Embed Size (px)
Citation preview
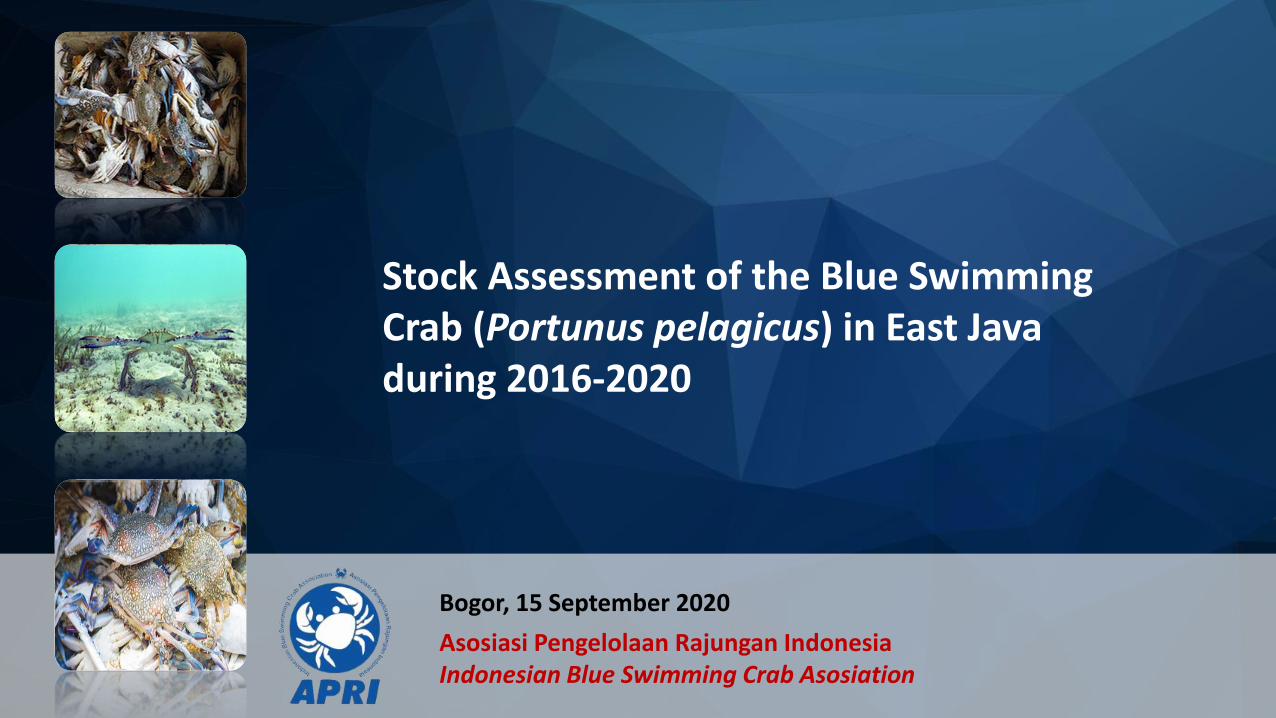
Stock Assessment of the Blue Swimming Crab (Portunus pelagicus) in East Java during 2016-2020
Bogor, 15 September 2020
Asosiasi Pengelolaan Rajungan Indonesia Indonesian Blue Swimming Crab Asosiation
Objective
This research aims to examine the population dynamics and stock status of the blue
swimming crabs (Portunus pelagicus) in East Java during 2016-2020 based on the
growth parameters, exploitation rates, and spawning potential ratio.
Outline
Sampling data
Carapace width composition
% Undersized and % Egg Berried Female
Growth parameters
Mortality and exploitation rates
Width at first maturity and width at first capture
Spawning Potential Ratio (SPR)
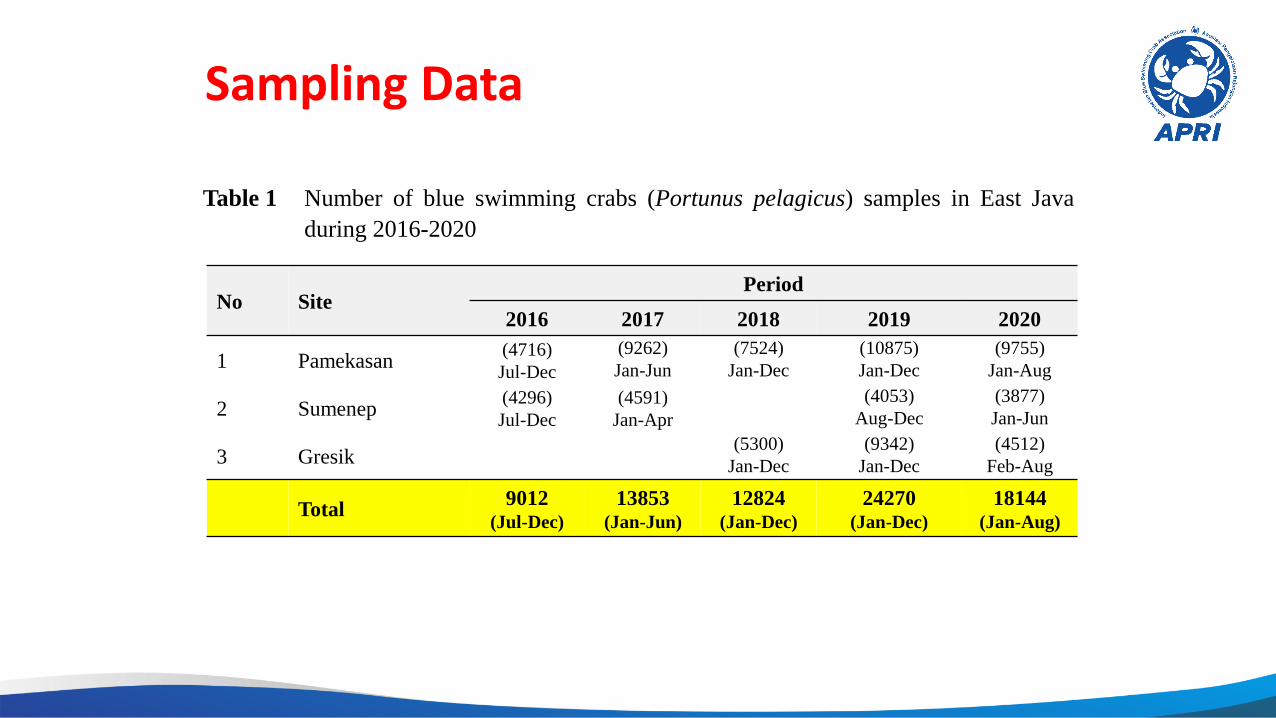
Table 1 Number of blue swimming crabs (Portunus pelagicus) samples in East Java
during 2016-2020
Sampling Data
No Site Period
2016 2017 2018 2019 2020
1 Pamekasan (4716)
Jul-Dec
(9262)
Jan-Jun
(7524)
Jan-Dec
(10875)
Jan-Dec
(9755)
Jan-Aug
2 Sumenep (4296)
Jul-Dec
(4591)
Jan-Apr
(4053)
Aug-Dec
(3877)
Jan-Jun
3 Gresik (5300)
Jan-Dec
(9342)
Jan-Dec
(4512)
Feb-Aug
Total 9012
(Jul-Dec)
13853 (Jan-Jun)
12824 (Jan-Dec)
24270 (Jan-Dec)
18144 (Jan-Aug)
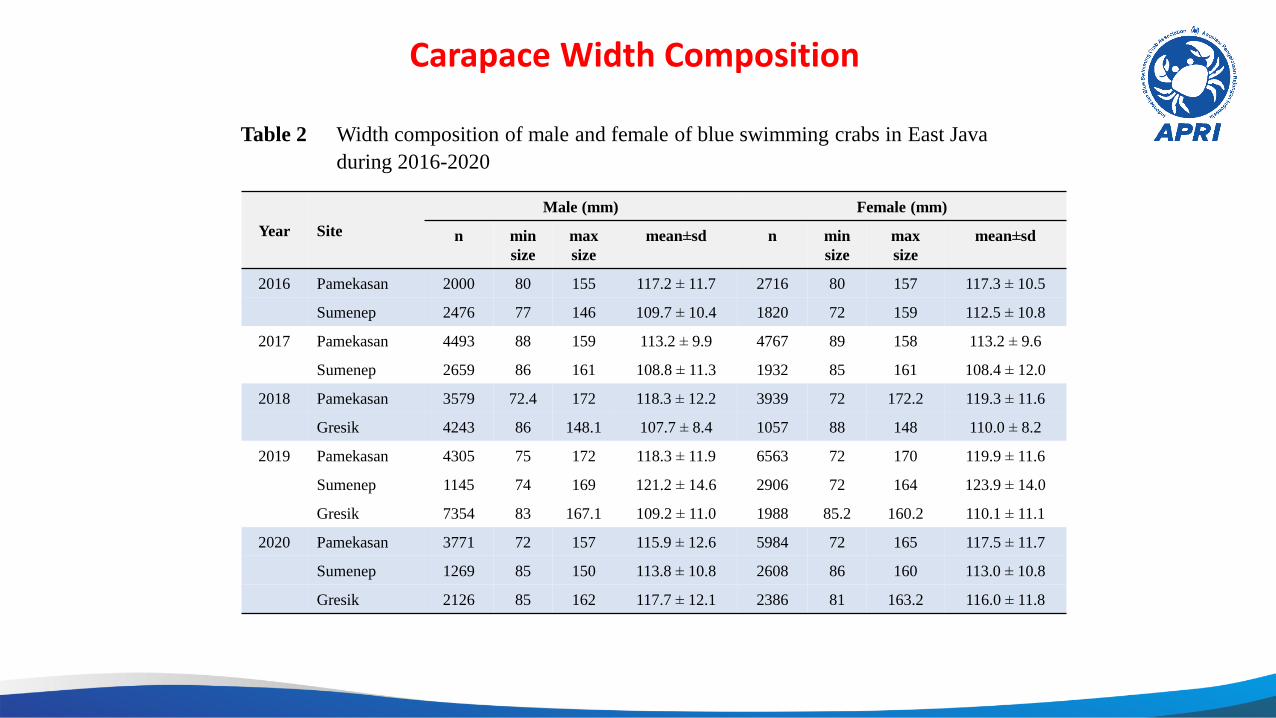
Table 2 Width composition of male and female of blue swimming crabs in East Java
during 2016-2020
Carapace Width Composition
Year Site
Male (mm) Female (mm)
n min
size
max
size
mean±sd n min
size
max
size
mean±sd
2016 Pamekasan 2000 80 155 117.2 ± 11.7 2716 80 157 117.3 ± 10.5
Sumenep 2476 77 146 109.7 ± 10.4 1820 72 159 112.5 ± 10.8
2017 Pamekasan 4493 88 159 113.2 ± 9.9 4767 89 158 113.2 ± 9.6
Sumenep 2659 86 161 108.8 ± 11.3 1932 85 161 108.4 ± 12.0
2018 Pamekasan 3579 72.4 172 118.3 ± 12.2 3939 72 172.2 119.3 ± 11.6
Gresik 4243 86 148.1 107.7 ± 8.4 1057 88 148 110.0 ± 8.2
2019 Pamekasan 4305 75 172 118.3 ± 11.9 6563 72 170 119.9 ± 11.6
Sumenep 1145 74 169 121.2 ± 14.6 2906 72 164 123.9 ± 14.0
Gresik 7354 83 167.1 109.2 ± 11.0 1988 85.2 160.2 110.1 ± 11.1
2020 Pamekasan 3771 72 157 115.9 ± 12.6 5984 72 165 117.5 ± 11.7
Sumenep 1269 85 150 113.8 ± 10.8 2608 86 160 113.0 ± 10.8
Gresik 2126 85 162 117.7 ± 12.1 2386 81 163.2 116.0 ± 11.8
0
10
20
30
40
50
Pam
ekas
an
Sum
enep
Pam
ekas
an
Sum
enep
Pam
ekas
an
Gre
sik
Pam
ekas
an
Sum
enep
Gre
sik
Pam
ekas
an
Sum
enep
Gre
sik
% E
BF
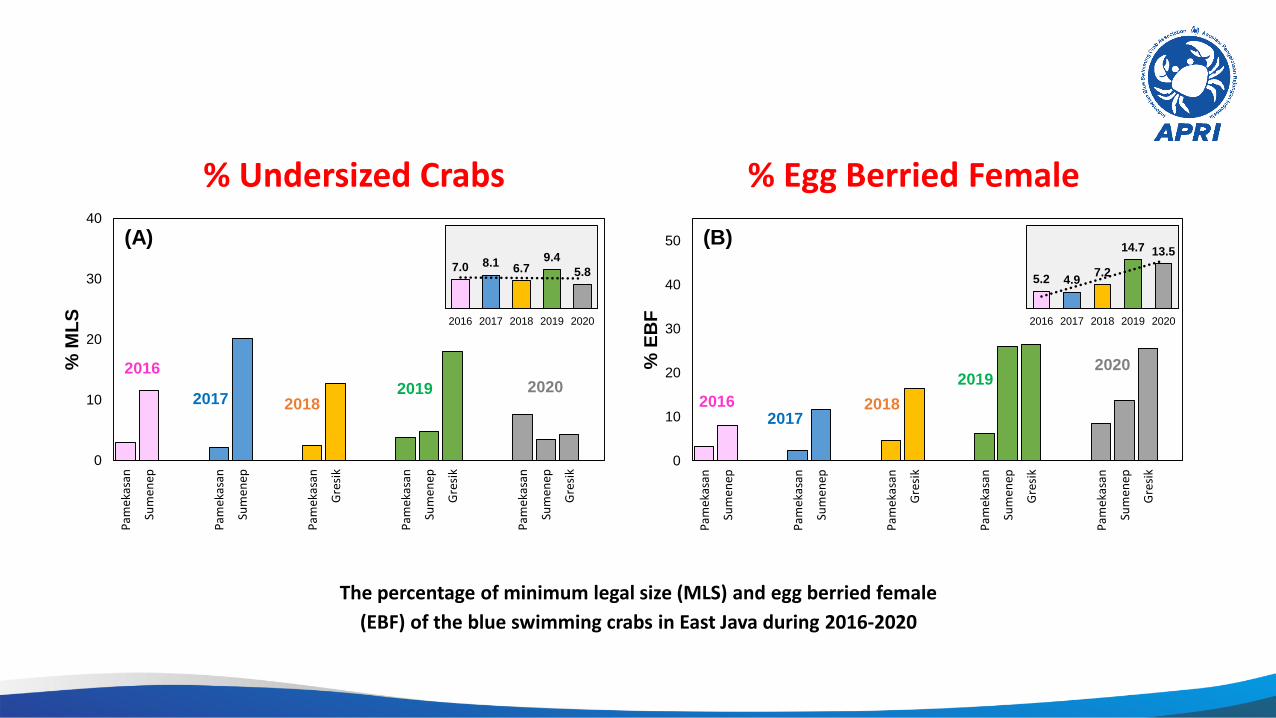
The percentage of minimum legal size (MLS) and egg berried female
(EBF) of the blue swimming crabs in East Java during 2016-2020
% Undersized Crabs
(B)
2017 2018
2019 2020
0
10
20
30
40
Pam
ekas
an
Sum
enep
Pam
ekas
an
Sum
enep
Pam
ekas
an
Gre
sik
Pam
ekas
an
Sum
enep
Gre
sik
Pam
ekas
an
Sum
enep
Gre
sik
% M
LS
(A)
2017 2018 2019 2020
2016
% Egg Berried Female
7.0 8.1 6.7
9.4
5.8
2016 2017 2018 2019 2020
5.2 4.9 7.2
14.7 13.5
2016 2017 2018 2019 2020
2016
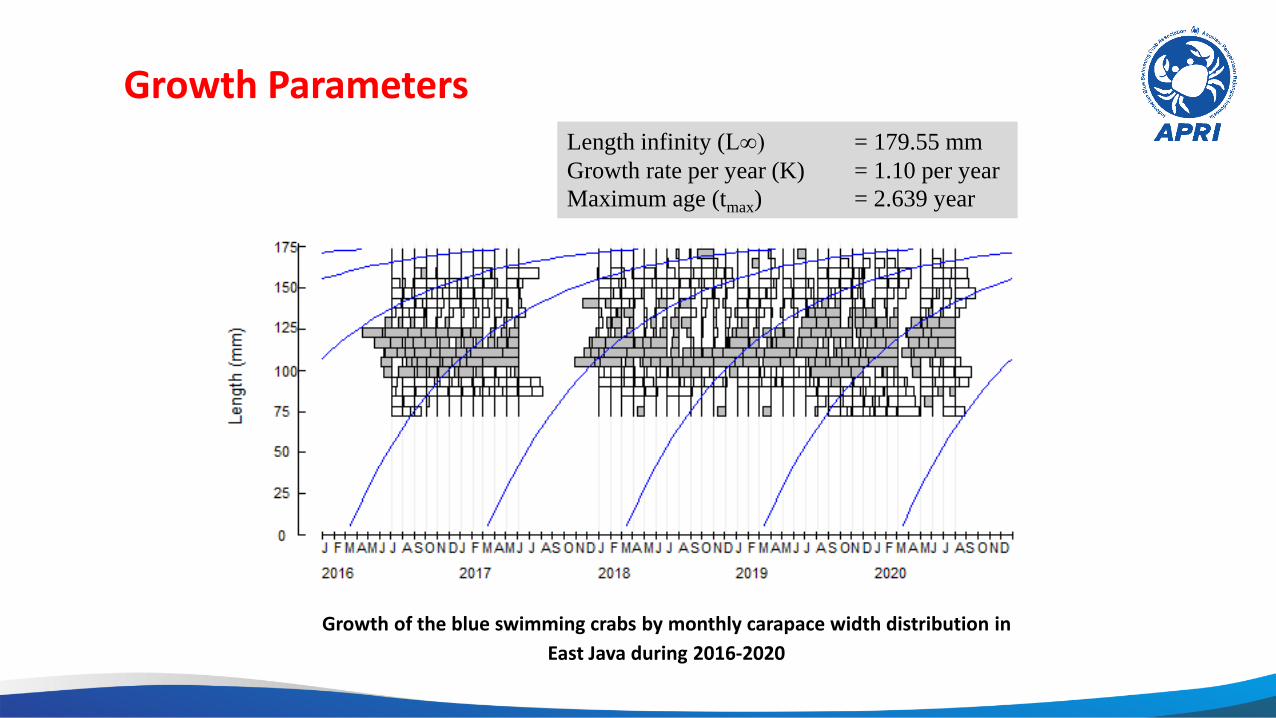
Growth Parameters
Growth of the blue swimming crabs by monthly carapace width distribution in
East Java during 2016-2020
Length infinity (L∞) = 179.55 mm
Growth rate per year (K) = 1.10 per year
Maximum age (tmax) = 2.639 year
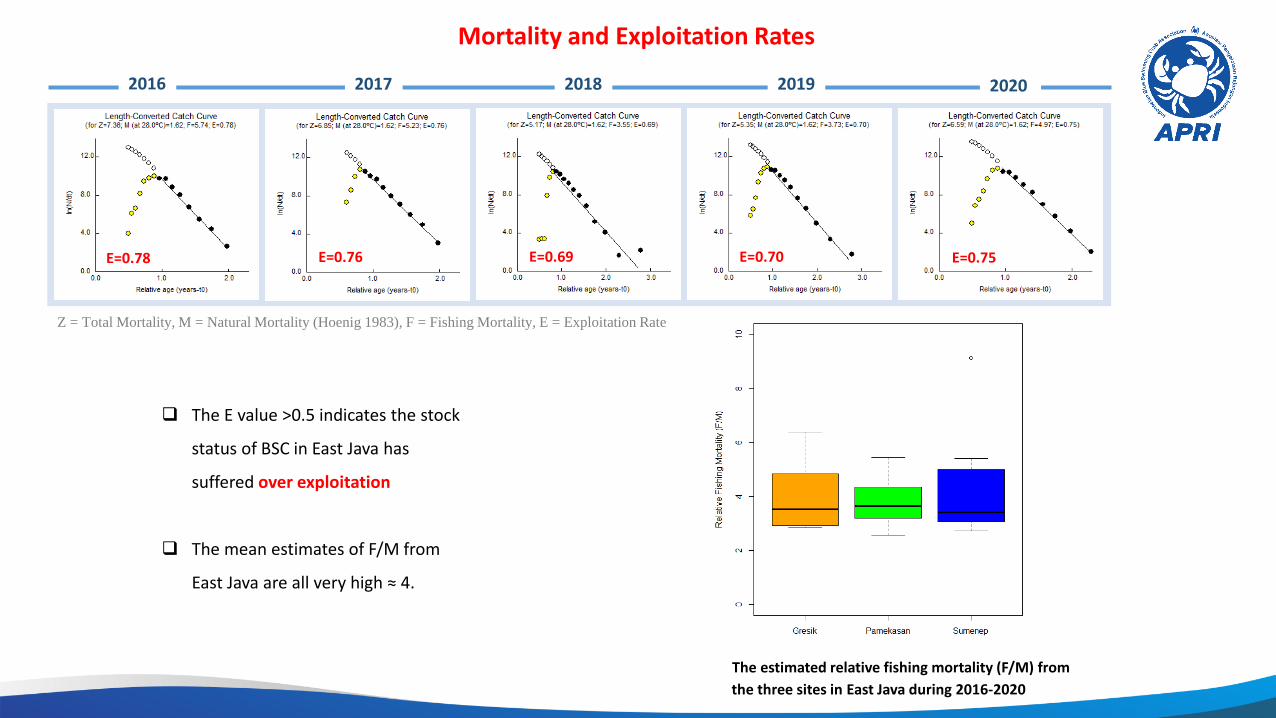
Mortality and Exploitation Rates
Z = Total Mortality, M = Natural Mortality (Hoenig 1983), F = Fishing Mortality, E = Exploitation Rate
The E value >0.5 indicates the stock
status of BSC in East Java has
suffered over exploitation
The mean estimates of F/M from
East Java are all very high ≈ 4.
2017 2018 2019 2020
E=0.70 E=0.69 E=0.76 E=0.75
The estimated relative fishing mortality (F/M) from
the three sites in East Java during 2016-2020
2016
E=0.78
0
0.25
0.5
0.75
1
50 75 100 125 150 175
Pro
po
rtio
n
Mean Carapace Width (mm)
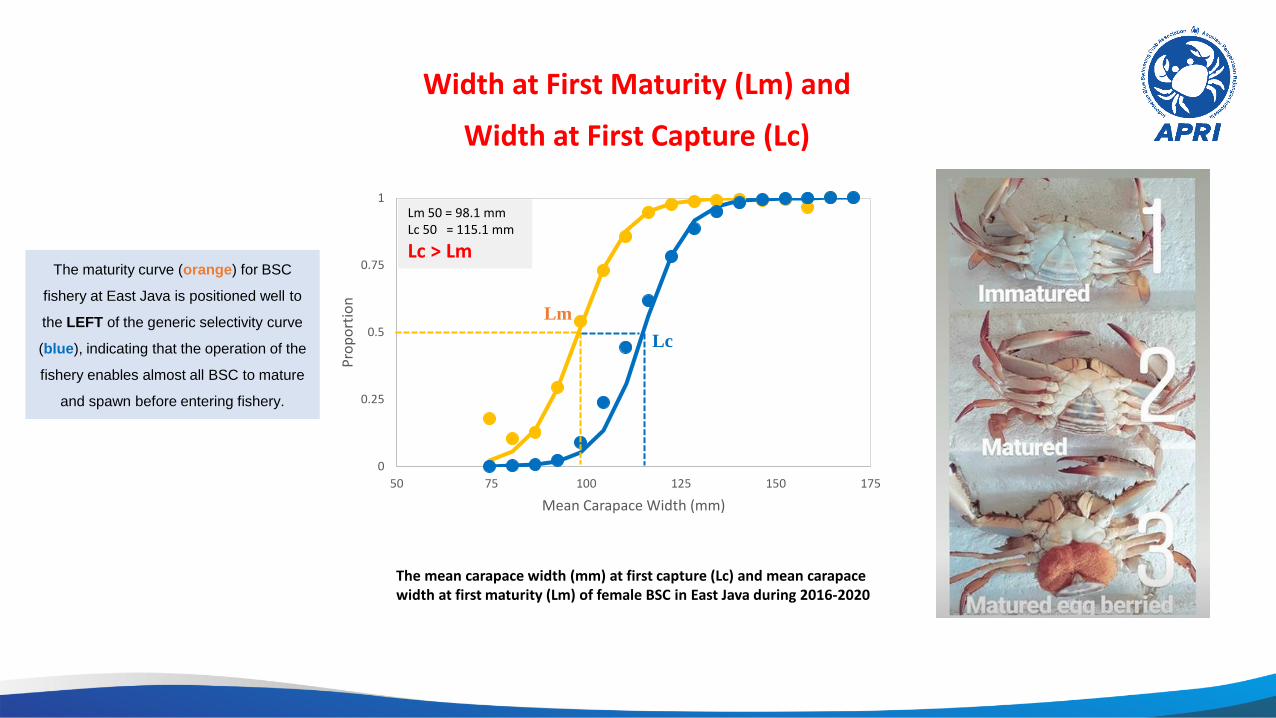
Width at First Maturity (Lm) and
Width at First Capture (Lc)
The maturity curve (orange) for BSC
fishery at East Java is positioned well to
the LEFT of the generic selectivity curve
(blue), indicating that the operation of the
fishery enables almost all BSC to mature
and spawn before entering fishery.
The mean carapace width (mm) at first capture (Lc) and mean carapace width at first maturity (Lm) of female BSC in East Java during 2016-2020
Lm
Lm 50 = 98.1 mm Lc 50 = 115.1 mm
Lc > Lm
Lc
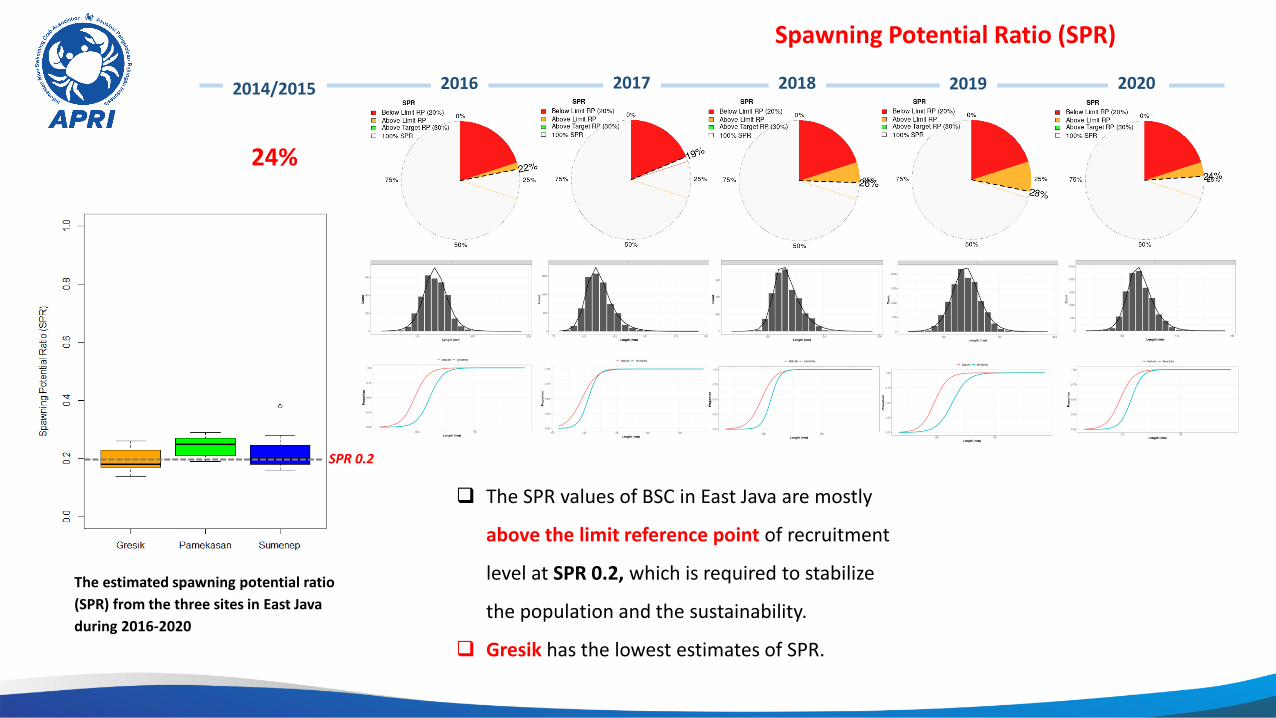
Spawning Potential Ratio (SPR)
The SPR values of BSC in East Java are mostly
above the limit reference point of recruitment
level at SPR 0.2, which is required to stabilize
the population and the sustainability.
Gresik has the lowest estimates of SPR.
2017 2018 2019 2020
The estimated spawning potential ratio
(SPR) from the three sites in East Java
during 2016-2020
2016 2014/2015
24%
SPR 0.2
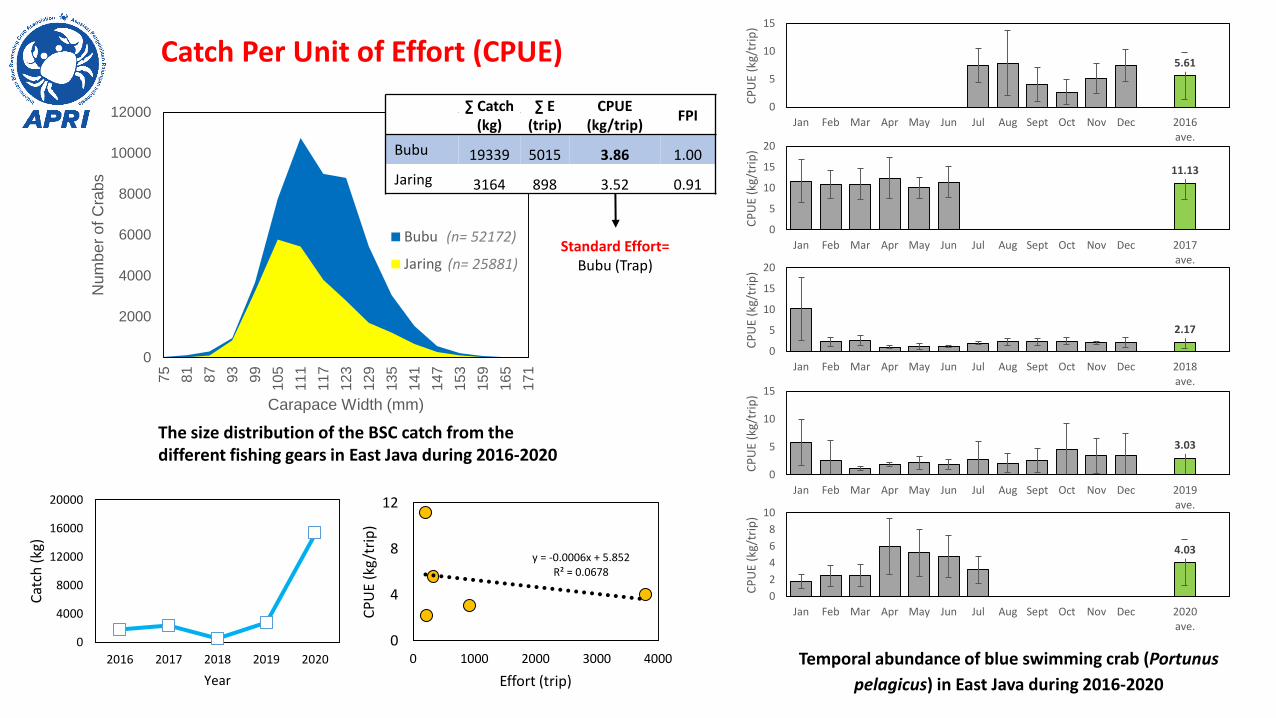
Catch Per Unit of Effort (CPUE)
0
2000
4000
6000
8000
10000
12000
75
81
87
93
99
105
111
117
123
129
135
141
147
153
159
165
171
Num
be
r o
f C
rab
s
Carapace Width (mm)
Bubu
Jaring
The size distribution of the BSC catch from the different fishing gears in East Java during 2016-2020
5.61
0
5
10
15
Jan Feb Mar Apr May Jun Jul Aug Sept Oct Nov Dec 2016ave.
CP
UE
(kg/
trip
)
11.13
0
5
10
15
20
Jan Feb Mar Apr May Jun Jul Aug Sept Oct Nov Dec 2017ave.
CP
UE
(kg/
trip
)
2.17
0
5
10
15
20
Jan Feb Mar Apr May Jun Jul Aug Sept Oct Nov Dec 2018ave.
CP
UE
(kg/
trip
)
3.03
0
5
10
15
Jan Feb Mar Apr May Jun Jul Aug Sept Oct Nov Dec 2019ave.
CP
UE
(kg/
trip
)
4.03
0
2
4
6
8
10
Jan Feb Mar Apr May Jun Jul Aug Sept Oct Nov Dec 2020ave.
CP
UE
(kg/
trip
)
Temporal abundance of blue swimming crab (Portunus
pelagicus) in East Java during 2016-2020
(n= 52172)
(n= 25881) Standard Effort=
Bubu (Trap)
∑ Catch (kg)
∑ E (trip)
CPUE (kg/trip)
FPI
Bubu 19339 5015 3.86 1.00
Jaring 3164 898 3.52 0.91
y = -0.0006x + 5.852 R² = 0.0678
0
4
8
12
0 1000 2000 3000 4000
CP
UE
(kg
/tri
p)
Effort (trip)
0
4000
8000
12000
16000
20000
2016 2017 2018 2019 2020
Cat
ch (
kg)
Year
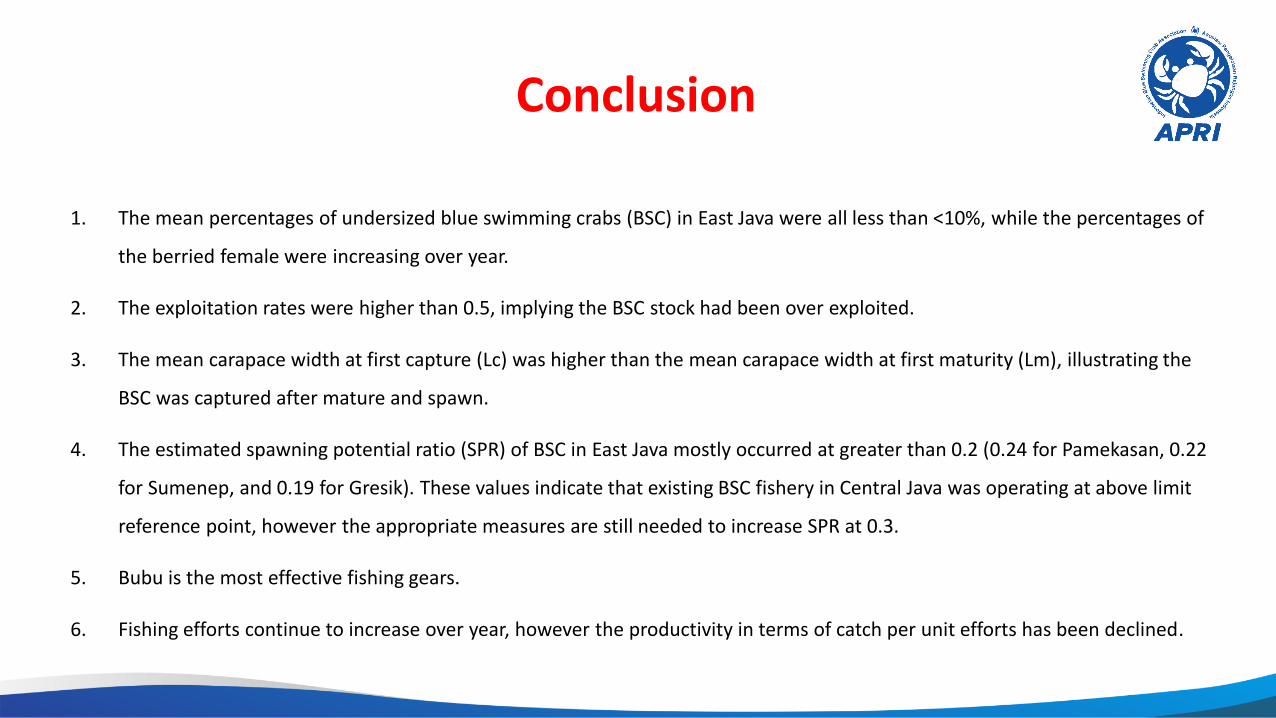
Conclusion
1. The mean percentages of undersized blue swimming crabs (BSC) in East Java were all less than <10%, while the percentages of
the berried female were increasing over year.
2. The exploitation rates were higher than 0.5, implying the BSC stock had been over exploited.
3. The mean carapace width at first capture (Lc) was higher than the mean carapace width at first maturity (Lm), illustrating the
BSC was captured after mature and spawn.
4. The estimated spawning potential ratio (SPR) of BSC in East Java mostly occurred at greater than 0.2 (0.24 for Pamekasan, 0.22
for Sumenep, and 0.19 for Gresik). These values indicate that existing BSC fishery in Central Java was operating at above limit
reference point, however the appropriate measures are still needed to increase SPR at 0.3.
5. Bubu is the most effective fishing gears.
6. Fishing efforts continue to increase over year, however the productivity in terms of catch per unit efforts has been declined.
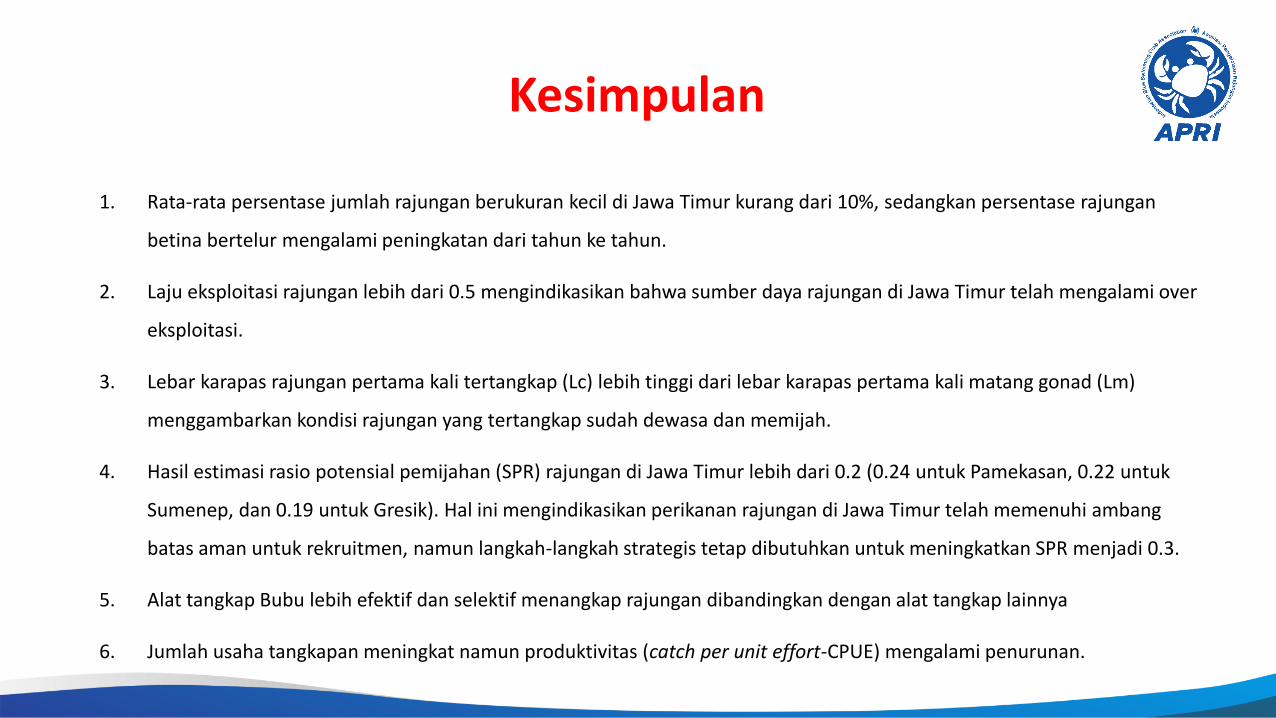
Kesimpulan
1. Rata-rata persentase jumlah rajungan berukuran kecil di Jawa Timur kurang dari 10%, sedangkan persentase rajungan
betina bertelur mengalami peningkatan dari tahun ke tahun.
2. Laju eksploitasi rajungan lebih dari 0.5 mengindikasikan bahwa sumber daya rajungan di Jawa Timur telah mengalami over
eksploitasi.
3. Lebar karapas rajungan pertama kali tertangkap (Lc) lebih tinggi dari lebar karapas pertama kali matang gonad (Lm)
menggambarkan kondisi rajungan yang tertangkap sudah dewasa dan memijah.
4. Hasil estimasi rasio potensial pemijahan (SPR) rajungan di Jawa Timur lebih dari 0.2 (0.24 untuk Pamekasan, 0.22 untuk
Sumenep, dan 0.19 untuk Gresik). Hal ini mengindikasikan perikanan rajungan di Jawa Timur telah memenuhi ambang
batas aman untuk rekruitmen, namun langkah-langkah strategis tetap dibutuhkan untuk meningkatkan SPR menjadi 0.3.
5. Alat tangkap Bubu lebih efektif dan selektif menangkap rajungan dibandingkan dengan alat tangkap lainnya
6. Jumlah usaha tangkapan meningkat namun produktivitas (catch per unit effort-CPUE) mengalami penurunan.
Terima Kasih