Embed Size (px)
Citation preview

Stock Code: BSE : 500303 NSE : ABIRLANUVO Reuters : ABRL.BO / ABRL.NS / IRYN.LU Bloomberg : ABNL IN / IRIG LX

2
Key Highlights 3 – 12
Business-wise Performance
13 – 28
Going Forward 29
Financials and other Annexure 30 – 52
Contents
Note 1 : The financial results of ABNL are consolidated financials unless otherwise specified
Note 2 : The financial figures in this presentation have been rounded off to the nearest ` 1 Crore
Note 3 : 1 USD : INR 60
Glossary
CY : Current Year
FY : Financial Year (April-March)
PY – Corresponding period in Previous Financial Year
PQ – Previous Quarter
Q1– April-June
Q4– January-March
YTD – Year to date
ROACE : Return on Avg. Operating Capital Employed based on EBIT
VAS – Value Added Services
EBO – Exclusive Brand Outlet
MBO – Multi Brand Outlet
TPA – Tons per annum
AAUM – Average Assets under Management
L2L – Like to Like

3
Indian Economy
India’s GDP is estimated to grow at 7.4% in FY15 compared to 6.9% in the previous year
(Source : Ministry of Finance, at constant 2011-12 market prices)
As per IMF, India’s GDP is expected to grow at 7.5% in 2015 & 2016 outpacing China
Controlled inflation propelled RBI for rate cuts
WPI inflation at -2.33% is lowest in 9 years & CPI inflation eased to 5.17% in Mar’15
IIP grew y-o-y by 5% in Feb’15. Cumulative growth in Apr-Feb’15 at 2.8% vis-à-vis -0.1% in previous year
RBI cut repo rate in Jan’15 & Mar’15 by 25 bps each on easing inflation and to push economic growth
Reforms for economic development continue to remain high on Government’s agenda
FDI / FII limit in Insurance sector increased from 26% to 49%
Government met its fiscal deficit target through auctions
Consumer confidence index has risen to its highest since Apr’11
Business confidence index continues to remain high
However, consumption and investment growth on the ground is yet to pick up

4
Aditya Birla Nuvo : Progressing in line with its vision
Investing in the Promising Sectors
Invested USD 2 billion over past 15 years to fund the growth of its businesses leading to
transformation from a manufacturing company to a premium conglomerate
2000 2001 2003
2005/06 2005-2011
2012
2013
2014
2015
Created India’s largest online money management platform MyUniverse
Added New Superfine Yarn capacity in Rayon
Expanded Linen Yarn and Fabric Capacities
Commenced Housing Finance operations
Applied for Payments bank license in a 51:49 stake with Idea
Signed MoU with MMI Holdings to enter health insurance sector in India
Enhanced strategic stake in Telecom through Idea
Expanded Financial Services portfolio by merger of
AMC & NBFC and entry in broking, private equity etc.
Augmented Fashion offerings through acquisition of
Pantaloons, a top 3 big box apparel retailer
Entered Fashion business through
acquisition of Madura
Forayed in Life Insurance business
through JV with Sun Life, Canada
Entry into IT-ITeS Business

5
Earnings before Tax
USD 141 million
(` 849 Crore : 17%↑ y-o-y)
Diversified Portfolio
Having 10 lines
of businesses
Retail Network
1869 Stores (4.8 mn sq. ft.)
Largest in fashion space
Customers Base
A large 10.8 million
loyalty customers base
EBITDA
USD 89 million
(` 532 Crore : 32%↑ y-o-y)
Building Leadership Position across its businesses
Note 1 : Includes AUM of Life Insurance, Private Equity and quarterly AAUM of Asset Management business
Market Positioning
Among the top 5 fund
managers in India
Market Positioning
#1 branded menswear &
womenswear player in India
Aditya Birla Financial Services
Fashion & Lifestyle (Madura & Pantaloons)
Scale
Selling two branded
apparels every second
Revenue
USD 1.3 billion
(` 7,926 Crore : 19%↑ y-o-y)
Revenue
USD 910 million
(` 5,450 Crore : 15%↑ y-o-y)
AUM
USD 27.5 billion1
(` 164,995 Crore : 35%↑ y-o-y)
NBFC Lending Book
USD 3 billion
(` 17,550 Crore : 52%↑ y-o-y)

6
Revenue
USD 901 million
(` 5,405 Crore : 9%↑ y-o-y)
EBITDA
USD 102 million
(` 615 Crore : 11%↑ y-o-y)
Cash profit (post tax)
USD 1.4 billion
(` 8,482 Crore : 32%↑ y-o-y )
Divisions (Jaya Shree, Indo-Gulf fertilisers, Indian Rayon, Aditya Birla Insulators)
Market Positioning
6th largest1 in the world
3rd largest2 in India
Outperforming Industry
Revenue share grew y-o-y
from 16.1% to 17.5%2
Note 1 : In terms of subscribers and based on operations in a single country (Source : GSMA, Dec’14) Note 2 : Based on gross revenue for UAS & Mobile licenses only for Oct-Dec14, as released by TRAI
Building Leadership Position across its businesses
Market Positioning
Leading manufacturer of
Linen, Urea, VFY & Insulators in India
Strong Balance sheet
Net Debt to EBITDA : 1.31x
(Standalone)
Free Cash Flow (pre-tax)
USD 52 million
(` 314 Crore : 36%↑ y-o-y)
Telecom (Idea Cellular)
Outlook
Expanding linen yarn capacity to tap sector growth
Long term anti-dumping duty to benefit Insulators sector
Gas pooling policy to benefit urea sector
EBITDA
USD 1.9 billion
(` 11,281 Crore : 32%↑ y-o-y )
Revenue
USD 5.3 billion
(` 31,527 Crore : 19%↑ y-o-y)

7
A platform to drive synergy of resources
Standalone Ratios
Standalone balance sheet has been the growth engine for ABNL & a platform to drive synergy of capital resource
Invested ~USD 1 billion to fund the growth capital requirements of its businesses over past six years
Healthy financial position : Net Debt to EBITDA at 3x & Net Debt to Equity at 0.42x as on 31st Mar’15
Contributed by strong cash flow from operations, dividend income, proceeds from divestment of sub-scale
businesses and capital support from the promoters
Received dividend of ` 89 Cr. in FY15 (~` 600 Cr. over past 6 years)
306 676 1,193
3591 3854
3584
Mar'09 Mar'12 Mar'15
Standalone Net Debt
( ` Crore)
5.8
3.7
3.0 0.87
0.68
0.42
Mar'09 Mar'12 Mar'15
Net Debt/annualised EBITDA Net Debt/Equity
O/s
Fertilisers
Subsidy

8
Exit from sub scale businesses to achieve greater focus on other businesses
Supported ABNL’s growth plans &
strengthened balance sheet
Greater focus on core businesses
Note : Refer slide 50 for transaction details
Delivering best value to all the stakeholders …
Consolidation of Branded Apparels Businesses to unlock value for the shareholders
Creating India’s largest pure-play fashion & lifestyle company
Presence across entire spectrum of fashion through India’s leading fashion brands
Unlocking value for shareholders by giving them direct holding in a best-in-class fashion powerhouse
Largest retail network in fashion space in India
Sound Balance sheet to act as a strong enabler for growth
Aditya Birla Fashion & Retail Ltd.
# 1 Menswear player # 1 Womenswear player
Enterprise Value
USD 260 million
Effective Date
9th May 2014
Effective Date
1st April 2013
Enterprise Value
USD 240 million
Divestment of
IT-ITeS business
Divestment of
Carbon Black business

9
4,227
10,723
21,654
Mar'09 Mar'12 Mar'15
Market Capitalisation (Rs. Crore)
-436
890
1,416
FY09 FY12 FY15
Consolidated Net Profit (Rs. Crore)
… and driving strong earnings growth
867
3,247
5,798
FY09 FY12 FY15
14,331
21,840
26,516
FY09 FY12 FY15
Branded Apparels Financials Services, Telecom & Divisions
Consolidated Revenue (Rs. Crore)
Consolidated EBITDA (Rs. Crore)

10
Performance highlights : 2014-15

11
Consolidated earnings growth
Revenue
( ` Crore)
7,111
25,892
7,073
26,516
-1%
2%
FY 14 FY 15 FY 14 FY 15
Quarter 4 Full Year
EBITDA
( ` Crore)
1,263
4,927
1,527
5,798
21%
FY 14 FY 15 FY 14 FY 15
Quarter 4 Full Year
18%
Net Profit
( ` Crore)
176
1,143
332
1,416
88%
24%
FY 14 FY 15 FY 14 FY 15
Quarter 4 Full Year
Ex-IT-ITeS business
(divested w.e.f 9th
May’14), L2L revenue
growth is 11% in Q4 &
14% in FY15
Ex-IT-ITeS business, L2L
EBITDA growth is 29% in
Q4 & 25% in FY15
Ex-IT-ITeS business and
before one-off items, L2L
Net Profit growth is 36%
in Q4 & 39% in FY15

12
Consolidated Earnings Mix – FY15
Financial Services
30%
Telecom 28%
Fashion & Lifestyle
21%
Divisions 21%
Financial Services
28%
Telecom 46%
Fashion & Lifestyle
9%
Divisions 17%
Segment Revenue1 Segment EBIT1
Note 1 : Revenue and EBIT Mix are excluding IT-ITeS business which was divested w.e.f. 9th May 2014

13
Aditya Birla Financial Services
Performance highlights : 2014-15
A significant non-bank financial services group

14
Vision : To be a leader & role model in a broad based
& integrated financial services business
A significant non-bank financial services group
Ranks among top 5 fund managers in India (excl. LIC)
Diversified portfolio with 10 lines of businesses
AUM at ` 164,995 Cr. (35%↑ y-o-y)
NBFC Lending book at ` 17,550 Cr. (52%↑ y-o-y)
Entering strategic partnerships & investing in promising sectors
Forayed into Housing Finance business in Oct’14
Acquired mutual fund schemes & portfolio accounts from ING in Sep’14
IFC became strategic financial investor in MyUniverse in Dec’14
Signed MoU with MMI Holdings in Oct’14 to enter health insurance sector
1
( ` Crore)
Assets under Management
Aditya Birla Financial Services : Progressing as envisioned
Note 1 : Includes AUM of Life Insurance, Private Equity and quarterly AAUM of Asset Management business
43,104
88,309 88,393 1,07,539
1,22,362
1,21,891
Mar'11 Mar'12 Mar'13 Mar'14 Mar'15
Non
Equity
26%↑ y-o-y
Equity
68%↑ y-o-y
164,995
6304 6542 6378 6637
7926
FY11 FY12 FY13 FY14 FY15
( ` Crore) Revenue
368
600 761 727
849
FY11 FY12 FY13 FY14 FY15
( ` Crore)
Earnings before Tax

15
Aditya Birla Finance Limited (ABFL) - NBFC
Aditya Birla Financial Services
1,850 3,425
8,000 11,550
17,550
Mar'11 Mar'12 Mar'13 Mar'14 Mar'15
Lending book
(` Crore)
10.2% 11.4%
14.3% 13.1%
14.6%
FY11 FY12 FY13 FY14 FY15
ROE
39%
35% 36%
31% 29%
FY11 FY12 FY13 FY14 FY15
Opex to NII
37 56 100
166
271
FY11 FY12 FY13 FY14 FY15
Net Profit
(` Crore)
196 348
715
1,201
1,776
FY11 FY12 FY13 FY14 FY15
Revenue
(` Crore)
Lending book reached USD 3 billion mark (52%↑ y-o-y)
Well diversified portfolio for sustainable growth
Growth accompanied by robust credit appraisal
and risk management practices
Gross NPA at 0.90% (PY: 1.29%)
Net NPA at 0.32% (PY: 0.58%)
Equity support and internal accruals funding growth
Net worth expanded to ` 2,585 Cr. (46%↑ y-o-y)
Infusion of ` 545 Cr. in FY15 (` 1,720 Cr. in 5 years)
Improved return ratios
ROE enhanced to 14.6% (150 bps↑ y-o-y)
ROA at 2.0% (15 bps↑ y-o-y)
Revenue at ` 1,776 Cr. (48%↑ y-o-y)
EBT at ` 411 Cr. (63%↑ y-o-y)

16
Birla Sun Life Insurance (BSLI)
Aditya Birla Financial Services
AUM crossed ` 30,000 Cr. (22%↑ y-o-y)
Ranks 6th in India with new business market share of 7.6% (in private sector)
#1 in Group new business premium @ ` 1,177 Cr. (44%↑ y-o-y)
Individual life new business premium @ ` 761 Cr. (13%↓ y-o-y)
Improved quality of business
Opex ratio at 16.6% (240 bps↓ y-o-y)
Surrender as a % of average AUM reduced y-o-y by 165 bps
Ranks 4th in India with domestic AAUM market share at 10.09% (PY: 9.85%)
Total AAUM rose to ` 1,33,689 Cr. (39%↑ y-o-y)
Strong focus on scaling up equity and offshore assets
Domestic Equity AAUM more than doubled y-o-y to ` 25,904 Cr.
# 5 in terms of equity AAUM with market share at 6.92% (PY : 5.78%)
Offshore AAUM reached USD 2 billion (103%↑ y-o-y)
Birla Sun Life Asset Management (BSAMC)
67,668 66,082
83,451
96,429
1,33,689
Q4FY11 Q4FY12 Q4FY13 Q4FY14 Q4FY15
AAUM
(` Crore)
19,760 21,110
22,929 24,775
30,185
FY11 FY12 FY13 FY14 FY15
AUM
(` Crore)

17
Aditya Birla Housing Finance (ABHFL)
Lending book as on 31st Mar’15 is ` 142 Cr.
Targeting to expand footprint from currently 15 cities to 30 cities next year
Aditya Birla Insurance Brokers (ABIBL: General Insurance Advisory)
In FY15, ABIBL’s premium placement rose y-o-y by 26% to ` 1,132 Cr. while industry premium grew by 9%
Market share increased to 1.33% (PY 1.16%)
Aditya Birla Private Equity (ABPE) : Invested more than 90% of net deployable corpus.
Aditya Birla Money (Broking, Wealth Management & Online Money Management)
Broking (ABML) : Market share improved in retail F&O and commodities segments
Higher average daily brokerage (67%↑ y-o-y) drove earnings growth
Wealth Management (ABMM) : Assets under Advisory at ~ ` 9,000 Cr. (as on 31st Mar’15)
MyUniverse is India’s #1 online personal finance management platform
Enjoying trust of > 1.5 million registered users & helping customers manage > ` 15,400 Cr. of money as on date
IFC has become a strategic financial investor in the venture
Health Insurance
Signed MoU with MMI Holdings Ltd. (a leading South African insurance-based financial services group) to enter health insurance
business in India. Final agreement is being negotiated post which application to IRDA will be made.
Aditya Birla Financial Services

18
Revenue at ` 7,926 Cr. (19%↑ y-o-y)
Earnings before Tax at ` 849 Cr. (17%↑ y-o-y)
Aditya Birla Financial Services
Revenue
FY14 FY15 ∆% (` Crore)
EBT FY14 FY15 ∆%
Remarks on profitability
1,201 1,776 48% ABFL 251 411 63% Expanded lending book (52%↑ y-o-y)
4,702 5,267 12%
BSLI 371 285 23% Lower new business sales and in-force book
502 596 19% BSAMC 140 182 29% Growth in total AUM (39%↑ y-o-y)
82 73 11% ABIBL 21 27 26% Higher premium placement (26%↑ y-o-y)
75 119 58% ABML (12) 6 n.a. Higher average daily brokerage (67%↑ y-o-y)
66 86 30% ABMM (6) 6 n.a. Increase in business volumes
9 8 Others (net of elim.) (39) (67) Scaling up MyUniverse
6,637 7,926 19% Total 727 849 17%

19
India’s #1 Menswear Player India’s #1 Womenswear Retailer
Fashion & Lifestyle
Performance highlights : 2014-15

20
Largest fashion retail presence serving 10.8 million loyalty customers
Presence across entire spectrum of Fashion with leading brands
Expanding market presence with addition of retail stores as well as
scaling up its own online presence through
Revenue at ` 5,450 Cr. (15%↑ y-o-y) & EBITDA at ` 532 Cr. (32%↑ y-o-y)
Fashion & Lifestyle
Madura 66%
Pantaloons 34%
Revenue mix FY15
1,811 2,239
3,802 4,759
5,450
FY11 FY12 FY13 FY14 FY15
Revenue (` Crore)
136 196
312 401
532
FY11 FY12 FY13 FY14 FY15
EBITDA (` Crore)
Retail Network
895 1,129
1,367
1,648 1,869
Mar'11 Mar'12 Mar'13 Mar'14 Mar'15
1.3 1.6
3.6 4.2
4.8
Carpet Area
(Million Sq. Ft.) EBOs / Stores
Note 1 : Excluding one-time investment income
1

21
Madura Fashion & Lifestyle1
Powerhouse of India’s leading fashion brands
Louis Philippe, Van Heusen, Allen Solly, Peter England
Extensive reach through multi-channel distribution network
1735 retail EBOs & 6000+ additional points of sale
Robust supply chain, strong in-house design & product
development capabilities
Posted strong earnings growth in FY15 despite weak customer
footfalls & higher promotions / discounting across the industry
Revenue at ` 3,735 Cr. (16%↑ y-o-y)
Retail channel sales (EBOs) : 14%↑ y-o-y led by stores expansion
L2L sales growth was flat. Added (net) 194 EBOs in FY15
Wholesale channel sales (Department Stores & MBOs) : 20%↑ y-o-y
EBITDA at ` 463 Cr. (19%↑ y-o-y)
Margins and ROACE expanded y-o-y to 12.4% & 72%
1,811 2,239
2,523
3,226
3,735
FY11 FY12 FY13 FY14 FY15
Revenue (` Crore)
136 196
245
388 463
FY11 FY12 FY13 FY14 FY15
EBITDA (` Crore)
FY 11 FY 12 FY 13 FY 14 FY 15
EBITDA % 7.5% 8.8% 9.7% 12.0% 12.4%
ROACE % 11% 20% 29% 64% 72%
Note 1 : Includes Madura Fashion, a division of ABNL and Madura Lifestyle, a subsidiary of ABNL. Madura Fashion owns and retails India’s leading apparel brands such as Louis Philippe, Van Heusen, Allen Solly,
Peter England and People. Madura Lifestyle retails international luxury brands under the retail format ‘The Collective’ and It also retails Madura Fashion brands under the retail format ‘Planet Fashion’

22
Pantaloons Fashion & Retail Ltd.
Strategic initiatives taken since acquisition … Launched 39 new stores in past 2 years on a base of 69 stores
43 stores renovated and 100% store re-layouts accomplished
Created 7 new private brands, added 15 external brands
Created a stronger vendor network with pan India capability
… are yielding results
Customer reach scaled to 104 Stores & 30 factory outlets across 2.3 million sq. ft.
Share of Private brands & Madura brands enhanced from 46% to 62%
Voted amongst India’s top most trusted retailer brands in “Brand Equity Survey 2014”
In FY15, posted revenue at ` 1,851 Cr. (11%↑ y-o-y)
Driven by L2L growth of 5.5% and stores expansion
Added 25 pantaloons stores & 6 factory outlets in FY15
Driven by portfolio enrichment, gross margin increased to 45% (340 bps↑ y-o-y)
EBITDA almost doubled from ` 39 Cr. to ` 75 Cr.
EBITDA margin expanded to 4.1% (180 bps↑ y-o-y)
Higher accelerated depreciation on account of stores renovation & planned stores
closures impacted bottom-line
Men 35%
Women 42%
Kids 9%
Non-Apps 14%
Revenue Mix (FY15)
2.3%
4.1%
39
75
FY14 FY15
EBITDA (` Crore)
EBITDA %
1,661
1,851
FY14 FY15
Revenue (` Crore)

23
Telecom
Performance highlights : 2014-15
3rd largest Cellular Operator in India

24
Robust performance across key metrics2 driving earnings growth
Solid foundation for business growth laid for the next 20 years
Won 79.4 MHz spectrum in Mar’15 auctions for ~USD 5 billion
Idea grew at 1.8 times the wireless industry in Calendar Year 2014
FY15 revenue at ` 31,527 Cr. (19%↑ y-o-y) & EBITDA at ` 11,281 Cr. (32%↑ y-o-y)
Strong cash flows & funds raised supporting balance sheet2 & growth plans
Net debt to EBITDA2
at 1.31x (PY: 2.61x)
Generated post tax cash profit2 of ` 8,482 Cr. in FY15 (32% y-o-y growth)
Raised equity capital of ` 3,750 Cr. (through QIP & Preferential allotment)
Proposed dividend @ 6% of share capital [Outlay of ` 260 Cr. incl. DDT]
FY14 FY15 Δ%
Minutes of Use (billion) 588 683 +16.3%
Average Realisation per minute (`) 0.442 0.455 + 3.0%
Cost per minute (`) 0.325 0.319 -2.0%
Data Volume (billion Mega Bytes) 79.4 172.5 +117.3%
Consolidated Net Profit (` Crore) 1,968 3,193 +62.3%
Telecom : Idea Cellular
13.3% 14.4% 14.8%
16.1% 17.5%
Q3FY11 Q3FY12 Q3FY13 Q3FY14 Q3FY15
Revenue Market Share 1
1Based on gross revenue for UAS & Mobile licenses only, as released by TRAI 2Standalone = Idea and its 100% subsidiaries
15,438
19,489 22,407
26,432
31,527
FY11 FY12 FY13 FY14 FY15
Consolidated Revenue (` Crore)
3,910 5,085
6,071 8,519
11,281
FY11 FY12 FY13 FY14 FY15
Consolidated EBITDA (` Crore)

25
Divisions
Performance highlights : 2014-15
Leading manufacturer of Linen, Urea, VFY and Insulators in India

26
Divisions
Led by rising popularity of Linen as comfort & style fabric, its demand has grown at a strong pace.
Currently ~70% of linen yarn demand is met through imports reflecting expansion opportunity.
Jaya Shree is a leading player in Linen & Wool segments in India
Focusing on retail expansion & brand promotion to fortify ‘Linen Club’ fabric brand
Retailing linen fabric through 115 EBOs and 3,500+ MBOs
Expanded linen capacities contributing to profitable growth
Targeting to further expand Linen Yarn capacity from 3,400 TPA to
6,400 TPA at a capex of ~` 220 Cr. in 2016, to tap sector growth
Operating at a sound ROACE of 53% p.a.
Acute deficit of urea in India – Approx. 1/4th of the urea demand is imported
Government’s gas pooling policy will be beneficial for the sector as it aims to improve plants efficiency & reduce subsidy outgo
Indo-Gulf is the 8th largest & one of the most energy efficient urea plants in India
Strong ‘Birla Shaktiman’ brand is preferred choice of farmers
Indo-Gulf is a complete agri-solutions provider
Offering fertilisers, seeds and agro-chemicals
Improved energy efficiency augmented earnings y-o-y
Jaya Shree
Indo-Gulf Fertilisers
53%47%
39%61%
FY11
FY15Wool Linen
99
141154
172 175
FY11 FY12 FY13 FY14 FY15
EBITDA (` Crore)
774
1,0461,144
1,3001,435
FY11 FY12 FY13 FY14 FY15
Revenue (` Crore)
Jaya Shree : Revenue Mix
1,244
2,107
2,924
2,3132,558
FY11 FY12 FY13 FY14 FY15
Revenue (` Crore)
176
211197
77
148
FY11 FY12 FY13 FY14 FY15
EBITDA (` Crore)

27
Divisions
VFY is a niche market globally – premium is driven by quality & value added yarns
Indian Rayon is India’s 2nd largest manufacturer and largest exporter of VFY
Integrated facilities : 34.5 MW captive power plant & caustic soda operations
In FY15, VFY segment posted higher profitability led by expanded new
superfine yarn capacity. In Chemicals Segment, maintenance shutdown
in Caustic Soda plant & lower ECU realisation impacted earnings
Operating at an ROACE of 21% p.a.
Cheaper Chinese imports had adversely impacted domestic players and the industry had appealed for anti-dumping duty
The Ministry of Finance, on 16th Sep’14, imposed an interim anti-dumping duty on imports of insulators from China and on
11th Apr’15, extended the duty till 15th Sep’19 to create a level playing field for the domestic manufacturers
Aditya Birla Insulators is India’s largest & world’s 4th largest manufacturer
In FY15, profitability improved y-o-y led by higher volumes &
realisation in the substation segment
ROACE improved to 17% p.a.
Indian Rayon
Aditya Birla Insulators
Indian Rayon : Revenue Mix
81%
19%
FY15
ChemicalsVFY
565680
777860 865
FY11 FY12 FY13 FY14 FY15
Revenue (` Crore)
110128
189222
197
FY11 FY12 FY13 FY14 FY15
EBITDA (` Crore)
518468 454 505
548
FY11 FY12 FY13 FY14 FY15
Revenue (` Crore)
134
67 6183
95
FY11 FY12 FY13 FY14 FY15
EBITDA (` Crore)

28
Revenue at ` 5,405 Cr. (9%↑ y-o-y)
EBITDA at ` 615 Cr. (11%↑ y-o-y)
ROACE improved y-o-y from 14% p.a. to 16% p.a.
Revenue
FY14 FY15 ∆% (` Crore)
EBITDA
FY14 FY15 ∆% Remarks on profitability
1,300 1,435 10% Jaya Shree 172 175 2% Higher profitability in Linen segment offset by lower wool
combing volumes
2,313 2,558 11% Agri 77 148 90% Improved energy efficiency, higher fixed cost reimbursement
as per Government policy and increased sales of pesticides
860 865 ↔ Rayon 222 197 11% Profitable growth in VFY segment offset by lower caustic
volumes & ECU realisation
505 548 8% Insulators 83 95 14% Higher sales volume & realisation in substation segment
4.979 5,405 9% Total 554 615 11%
Divisions (Jaya Shree, Indo-Gulf Fertilisers, Indian Rayon & Aditya Birla Insulators)

29
Going Forward
Financial Services
Gaining market share in the Life Insurance business through good quality sales driven by an efficient
distribution network with acceptable expense levels
Growing profitable assets while maintaining fund performance in the Asset Management business
Expanding book size in the NBFC business while keeping risk under control
Growing the Housing Finance business
Foray into the Health Insurance business
Driving profitable growth in other businesses
Capitalising on brand !DEA, strong cash flows and expanding spectrum profile & infrastructure in the Telecom
business to capture opportunities in voice, emerging wireless broadband business & mobile banking segments
Driving profitable expansion by tapping emerging markets in tier 2/3 cities, entering new product categories,
enriching product mix and focusing on omni-channel strategy in the Fashion & Lifestyle business
Expanding linen capacity, capturing sector growth opportunities & improving operating efficiency in the divisions

30

31
Consolidated Revenue ( ` Crore)
* Include Asset Management, NBFC, Housing Finance, Private Equity, Broking, Wealth Management, online money management & General Insurance Broking businesses
@ Idea is consolidated at ~25.3% till 10th June 2014, at 23.63% till 23rd July 2014 and at 23.29% thereafter
^ Divested w.e.f 9th May 2014
Quarter - 3 Revenue
2014-15
(PQ)
2013-14
(PY)
2014-15
(CY)
2013-14
(PY)
2014-15
(CY)
1,913 2,271 2,585 Aditya Birla Financial Services 6,637 7,926
1,223 1,740 1,825 Life Insurance 4,702 5,267
691 533 762 Other Financial Services* 1,946 2,666
(2) (1) (2) Elimination (11) (7)
1,865 1,752 1,955 Telecom (Nuvo's share) @ 6,669 7,467
1,349 1,243 1,403 Fashion & Lifestyle 4,759 5,450
- 724 - IT-ITeS^ 2,898 283
1,522 1,134 1,134 Divisions 4,979 5,405
336 345 374 Jaya Shree 1,300 1,435
835 408 381 Agri 2,313 2,558
204 223 216 Rayon 860 865
147 159 163 Insulators 505 548
(9) (13) (3) Inter-segment Elimination (50) (16)
6,640 7,111 7,073 Consolidated Revenue 25,892 26,516
Quarter 4 Full Year

32
Segment EBIT ( ` Crore)
* Other Financial Services include Asset Management, NBFC, Housing Finance, Private Equity, Broking, Wealth Management, online money management & General
Insurance Broking businesses. Interest cost of NBFC business, being an operating expense as per AS 17, is deducted from Segment EBIT
@ Idea is consolidated at ~25.3% till 10th June 2014, at 23.63% till 23rd July 2014 and at 23.29% thereafter
^ Divested w.e.f 9th May 2014
Quarter - 3 EBIT
2014-15
(PQ)
2013-14
(PY)
2014-15
(CY)
2013-14
(PY)
2014-15
(CY)
197 170 182 Aditya Birla Financial Services 725 814
60 80 45 Life Insurance 371 285
136 89 137 Other Financial Services* 354 529
296 274 367 Telecom (Nuvo's share) @ 952 1,305
68 36 73 Fashion & Lifestyle 199 261
- 53 - IT-ITeS^ 181 (16)
146 74 71 Divisions 430 494
28 37 38 Jaya Shree 141 146
62 (30) (28) Agri 56 116
31 45 35 Rayon 172 156
25 23 26 Insulators 61 76
706 607 693 Segment EBIT 2,487 2,857
Quarter 4 Full Year

33
Consolidated Profit & Loss ( ` Crore)
One-off items:
In FY15, profit is lower by ` 36 Cr. on account of net loss of ` 23 Cr. from operations of Minacs for the period from 1st Apr’14 to 8th May’14 & exceptional loss of ` 13 Cr. pertaining to the
divestment of Minacs. This loss is without considering deferred grant of ` 42 Cr. receivable over next 3 years, which will be accounted for on actual receipt basis.
In FY14, profit is higher by ` 65 Cr. on account of divestment of Carbon Black business (including net tax credit of ` 41 Cr.) and interest cost is higher by one-time charge of ` 88 Cr. on
redemption of CCDs by Minacs owing to its divestment. Exceptional items in FY14 include loss of ` 19 Cr. on impairment of goodwill relating to investments in broking & wealth management
businesses and gain of ` 24 Cr. on divestment of Carbon Black business
Quarter - 3
2014-15 (PQ) 2013-14
(PY)
2014-15
(CY)
2013-14
(PY)
2014-15
(CY)
6,640 7,111 7,073 Revenue 25,892 26,516
1,484 1,263 1,527 EBITDA 4,927 5,798
291 212 318 Less : NBFC Interest expenses 742 1,105
149 259 171 Less : Other Interest Expenses 809 652
1,043 792 1,037 EBDT 3,376 4,041
452 430 464 Less : Depreciation 1,609 1,703
591 362 573 Earnings before Tax (before exceptional items) 1,767 2,338
- (19) - Exceptional Gain / (Loss) 5 (13)
591 343 573 Earnings before Tax 1,772 2,325
199 160 230 Less : Provision for Taxation (Net) 550 833
24 7 11 Less : Minority Interest 79 76
368 176 332 Net Profit 1,143 1,416
Quarter 4 Full Year Consolidated
Profit & Loss Account

34
Balance Sheet ( ` Crore)
Note : 1. Standalone capex of ` 222 Cr. was incurred in FY15. Capex guidance for FY16 stands at ` 300 Cr.
2. Investments of ` 600 Cr. are planned in financial services businesses in FY16
3. Board of Directors of ABNL has recommended an equity dividend of 70% (` 7 per share) for FY15 entailing outgo of ` 109.6 Cr. (incl. DDT of ` 18.5 Cr.)
8,108 8,519 Net Worth 11,189 12,871
- - Minority Interest 778 802
3,753 3,688 Debt 10,893 11,391
- - NBFC borrowings 9,647 14,594
88 106 Deferred Tax Liabilities (Net) 504 485
11,949 12,314 Capital Employed 33,012 40,142
- -
Policyholders' funds (Incl. funds
for future appropriation) 23,557 28,839
11,949 12,314 Total Liabilities 56,569 68,981
1,845 1,859 Net Block (Incl. Capital Advances) 13,045 12,342
20 20 Goodwill 4,982 3,973
- - NBFC Lending 11,550 17,550
1,574 1,635 Net Working Capital 730 315
7,952 8,695 Long Term Investments 410 408
- - Life Insurance Investments 24,764 30,147
- - Policyholders' Investments 23,435 28,595
- - Shareholders' Investments 1,329 1,552
557 105 Cash Surplus & Current Investments 1,089 4,246
623 655 Book Value (`) 860 989
2.6 3.0 Net Debt / Annualised EBITDA (x) 2.3 1.5
0.39 0.42 Net Debt / Equity (x) 0.88 0.56
14,196 21,654 Market Capitalisation - NSE
Mar-15
Consolidated
Mar-14Mar-14 Mar-15
Standalone
Balance Sheet
35
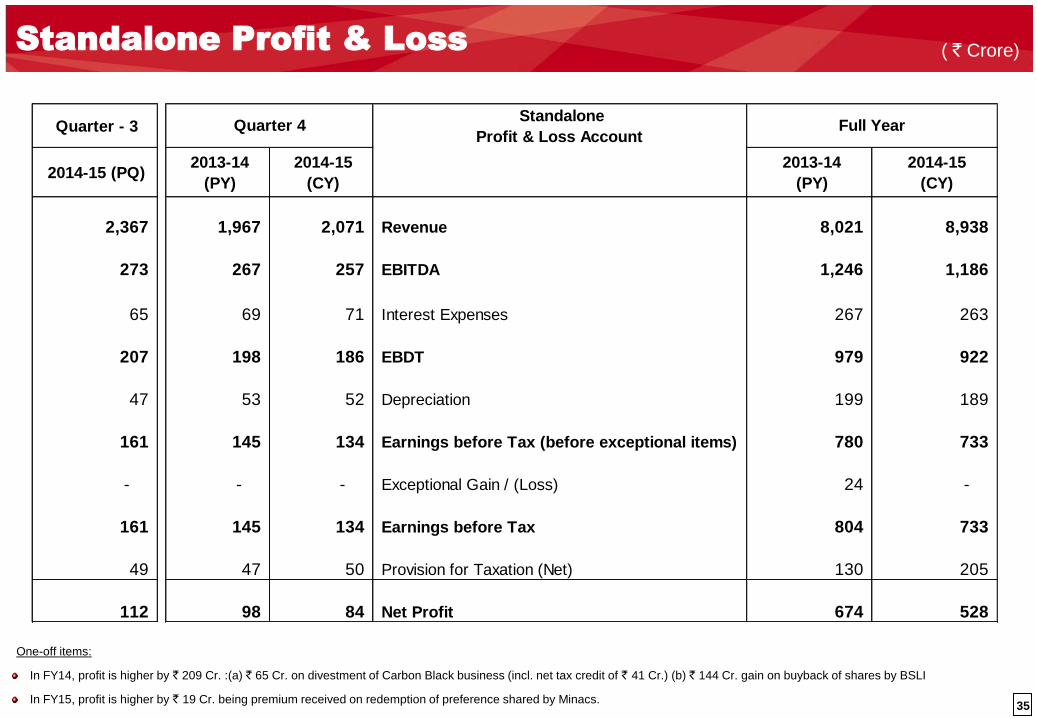
Standalone Profit & Loss ( ` Crore)
One-off items:
In FY14, profit is higher by ` 209 Cr. :(a) ` 65 Cr. on divestment of Carbon Black business (incl. net tax credit of ` 41 Cr.) (b) ` 144 Cr. gain on buyback of shares by BSLI
In FY15, profit is higher by ` 19 Cr. being premium received on redemption of preference shared by Minacs.
Quarter - 3 Standalone
Profit & Loss Account
2014-15 (PQ) 2013-14
(PY)
2014-15
(CY)
2013-14
(PY)
2014-15
(CY)
2,367 1,967 2,071 Revenue 8,021 8,938
273 267 257 EBITDA 1,246 1,186
65 69 71 Interest Expenses 267 263
207 198 186 EBDT 979 922
47 53 52 Depreciation 199 189
161 145 134 Earnings before Tax (before exceptional items) 780 733
- - - Exceptional Gain / (Loss) 24 -
161 145 134 Earnings before Tax 804 733
49 47 50 Provision for Taxation (Net) 130 205
112 98 84 Net Profit 674 528
Full YearQuarter 4

36

37
Aditya Birla Financial Services
2013-14
(PY)
2014-15
(CY)
2013-14
(PY)
2014-15
(CY)
Revenue
1,740 1,825 Birla Sun Life Insurance 4,702 5,267
346 504 Aditya Birla Finance 1,201 1,776
125 184 Birla Sun Life Asset Management 502 596
18 14 Aditya Birla Insurance Brokers 82 73
20 31 Aditya Birla Money 75 119
19 23 Aditya Birla Money Mart 66 86
5 5 Aditya Birla Capital Advisors (PE) 23 21
(2) (2) Others / (Elimination) (14) (13)
2,271 2,585 Revenue 6,637 7,926
155 190 Earnings before tax 727 849
122 134 Net Profit 584 638
Quarter 4
` Crore
Full Year

38
Aditya Birla Finance (ABFL)
Loan book growth continues to be robust and of good quality
More than 80% of lending book is secured
Attained growth across all the segments
Mortgages book crossed ` 5,000 Cr. (71%↑ y-o-y)
Capital Market, Infra & Corporate finance books crossed ` 4,000 Cr. each
Healthy borrowings Profile
Highest A1+ rating for short term debt
Long term debt rating upgraded to AA+ in FY15
Out of total borrowings ~75% is long term (PY: ~60%)
Capital Market
24%
Corporate Finance
23%
Infra Financing
23%
Mortgage* 29%
Others 1%
Lending book as on 31st Mar’15 : Break-up
* LAP / LRD & Construction Finance
(PY:26%)
(PY:22%)
(PY:23%)
(PY:28%)
(PY:1%)
2013-14
PY
2014-15
CY
Revenue 346 504
Earnings before tax 71 117
Net Profit / (Loss) 47 77
Revenue 1,201 1,776
Earnings before tax 251 411
Net Profit / (Loss) 166 271
Quarter 4
Full Year
` Crore
FY13 FY14 FY15
Net Interest Income (incl. fee income) (%) 5.4% 5.1% 5.0%
Return on Avg. Assets (p.a.) (%) 1.92% 1.85% 2.0%
Gross NPA (as % of total loans & advances) 1.23% 1.29% 0.90%
Net NPA (as % of total loans & advances) 0.83% 0.58% 0.32%
Net Worth (` Crore) 1,079 1,769 2,585
Borrowings (` Crore) 6,867 9,647 14,594
Leverage (x) 6.4x 5.5x 5.6x

39
Industry
In FY15, industry’s total new business de-grew by 9% while
private sector grew by 16%. In individual life new business,
industry de-grew by 10% while private sector grew by 16%
Private sector growth is driven by large bank backed players
Open architecture in bancassurance and increase of FDI / FII
limit in insurance sector from 26% to 49% will be beneficial for
the industry
Birla Sun Life Insurance
In FY15, New business premium at ` 1,938 Cr. (14%↑ y-o-y)
Renewal premium at ` 3,295 Cr. (5%↑ y-o-y)
Revenue at ` 5,267 Cr. (12%↑ y-o-y) driven by group business
EBT at ` 285 Cr. (23%↓ y-o-y)
Share of non-ULIPs in individual new business at 62% (PY: 60%)
Out of this, PAR products contributed to 42% (PY: 31%)
Birla Sun Life Insurance (BSLI)
2013-14
(PY)
2014-15
(CY)
2013-14
(PY)
2014-15
(CY)
726 710 New Business Premium (Gross) 1,697 1,938
297 271 Individual 879 761
429 438 Group 818 1,177
1,052 1,110 Renewal Premium (Gross) 3,136 3,295
1,018 1,065 Individual 3,010 3,156
34 45 Group 125 140
1,778 1,820 Premium Income (Gross) 4,833 5,233
(80) (79) Less : Reinsurance ceded & Service tax (307) (267)
1,699 1,741 Premium Income (Net) 4,526 4,966
41 85 Other Operating Income 176 301
1,740 1,825 Revenue 4,702 5,267
80 45 Earnings before tax 371 285
80 45 Net Profit 371 285
Assets under management 24,775 30,185
Policyholders' Investments 23,445 28,632
Shareholders' Investments 1,329 1,552
Full Year
` Crore
Quarter 4

40
Industry
Recorded its highest ever AAUM at ` 11.95 trillion (31%↑ y-o-y)
Equity AUM rose by 89% to ` 3.7 trillion contributing to more
than 60% of industry’s AUM growth in 2014-15
Birla Sun Life Asset Management
Total AAUM at ` 1,33, 689 Cr. (39%↑ y-o-y)
Equity & offshore AAUM surged by 124% and 103%
Consistently gaining market share
Equity market share is expanding year after year
Attained 10.3% share in industry’s net equity sales during 2014-15
Retail focus
Monthly SIP book size is 84%↑ y-o-y
Revenue at ` 596 Cr. (19%↑ y-o-y) & EBT at ` 182 Cr. (29%↑ y-o-y)
Recognition of strong fund performance
‘Asset Management House of the Year’ by Money Today-FPCIL Awards 2015
‘Best Fund House – Debt’ by Morningstar Awards 2015
Birla Sun Life MNC fund won ‘Best Small/Mid Cap Equity fund’ – Morning Star 2014
Birla Sun Life Asset Management (BSAMC)
` Crore
2013-14
(PY)
2014-15
(CY)
2013-14
(PY)
2014-15
(CY)
125 184 Revenue (Fee Income) 502 596
25 49 Earnings before tax 140 182
17 33 Net Profit 95 123
Quarter 4 Full Year
Revenues
Q4FY14
(PY)
Q3FY15
(PQ)
Q4FY15
(CY)
Domestic Equity &
Alternate Assets12,922 23,141 27,555
Domestic Fixed Income 77,586 86,673 94,128
Offshore Assets 5,921 7,675 12,006
Total AUM 96,429 1,17,489 1,33,689
` Crore
Average AUM
8.35% 9.09% 9.20% 9.45%
9.85% 10.09%
5.09% 5.45% 5.27% 5.26%
5.78%
6.92%
FY10 FY11 FY12 FY13 FY14 FY15
Domestic Market Share Equity Market Share

41
Other Financial Services
> Aditya Birla Housing Finance : Book Size at ` 142 Cr. as on 31st Mar’15
> Aditya Birla Insurance Brokers (General insurance advisory)
In FY15, premium placement grew from ` 898 Cr. to ` 1,132 Cr. (26%↑ y-o-y)
Revenue at ` 73 Cr. (11%↓ y-o-y) and EBT at ` 27 Cr. (26%↑ y-o-y)
> Aditya Birla Money (Broking, Wealth Management & Online Money Management )
Broking : Industry volumes were up by 71% in retail cash equity, up by 50% in retail F&O & lower by 36% in commodities
Market share of Aditya Birla Money improved to 2.48% (PY:1.37%) in retail F&O, 0.64% (PY:0.54%) in commodities & 0.50%
(PY: 0.29%) in currency segment while it was lower in retail cash equity segment at 1.34% (PY:1.43%)
Wealth Management: Average equity assets under advisory expanded y-o-y by 34%
Online Money Management Portal (MyUniverse) : Launched ZipSip – the smarter, easier and quicker way of doing SIP
> Aditya Birla Private Equity : Funds under management (net) at ` 1,121 Cr.
Invested in Wonderla Holidays, City Union Bank, Indian Energy Exchange, Manpasand Beverages, CIBIL & Monte Carlo Fashions in FY15
PY CY PY CY PY CY PY CY
Revenue 18 14 20 31 19 23 5 5
Earnings before tax 1 2 (1) 1 2 2 2 0
Net Profit / (Loss) 1 1 (1) 1 2 2 1 0
Revenue 82 73 75 119 66 86 23 21
Earnings before tax 21 27 (12) 6 (6) 6 9 6
Net Profit / (Loss) 14 18 (12) 6 (6) 5 6 4
Full Year
Aditya Birla
Money Mart
(Wealth Management)
Aditya Birla Insurance
Brokers (General
Insurance Broking)
` Crore Quarter 4
Aditya Birla Money
(Equity & Commodity Broking)
Aditya Birla
Capital Advisors
(Private Equity)

42
Capex of ` 95 Cr. was incurred during FY15
Capex guidance for FY16 stands at about ` 160 Cr. mainly towards new store launches and renovation of existing stores
Madura Fashion & Lifestyle
Retail Channel
895
1,129 1,272
1,541 1,735
Mar'11 Mar'12 Mar'13 Mar'14 Mar'15
1.3 1.6
1.9 2.2
2.5
Carpet Area (Million Sq Ft)
No. of EBOs
2013-14
(PY)
2014-15
(CY)
2013-14
(PY)
2014-15
(CY)
893 984 Revenue 3,226 3,735
117 138 EBITDA 388 463
93 112 Segment EBIT 299 377
457 591 Capital Employed 457 591
82 79 ROACE (Annualised) (%) 64 72
Quarter 4
` Crore
Full Year

43
Pantaloons Fashion & Retail Ltd.
Capex of ` 115 Cr. was spent during FY15
Launched 13 new stores in Q4 (25 during the year)
FY16 capex guidance stands at about ` 125 Cr. mainly
towards launch of 30-35 new stores
Customer Reach
90 95 107
134
Jun'12 Mar'13 Mar'14 Mar'15
1.6 1.7 2.0
2.3
Carpet Area (Million Sq Ft)
No. of Stores incl.
Factory Outlet ` Crore
2013-14
(PY)
2014-15
(CY)
2013-14
(PY)
2014-15
(CY)
410 460 Revenue 1,661 1,851
3 17 EBITDA 39 75
(46) (33) Segment EBIT (75) (110)
Quarter 4 Full Year
` Crore
As on
31st
Mar'14
As on
31st
Mar'15
Net Fixed Assets (Incl. Capital Advances) 496 422
Goodwill 1,168 1,168
Cash & Current Investments 17 7
Net Working Capital (50) 60
Net Worth 579 346
Debt 1,050 1,311

44
Base of 161 million active subscribers provides a great platform for upgrading voice customers to wireless data services in future
Currently, 33.4 million Idea subscribers use its mobile data services, contributing 16.9% of total service revenue in Q4FY15
As of Mar’15, Idea had 102.3% of reported subscribers as VLR (active) subscribers – highest in the industry
VAS as percentage of service revenue grew to 24.5% in Q4FY15 (PQ: 23.1%, PY: 16.5%)
Capex of ` 40.5 billion (excl. spectrum) incurred in FY15. Capex guidance for FY16, (excl. spectrum payout) stands at ` 50-55 billion
Idea Cellular
2013-14
(PY)
2014-15
(CY)
2013-14
(PY)
2014-15
(CY)
6,975 8,397 Revenue 26,432 31,527
2,273 3,251 EBITDA 8,519 11,281
1,090 1,577 Segment EBIT 3,773 5,508
590 942 Net Profit 1,968 3,193
Net Worth 16,527 23,029
Total Debt 20,635 26,859
Capital Employed 37,162 49,888
ROACE (Annualised) (%) 12 14
` Crore
(Consolidated Results)
Quarter 4 Full Year

45
Jaya Shree
Industry
Apparels & Textiles industry witnessed subdued consumer
spending during H2FY15
Jaya Shree
Revenue at ` 1,435 Cr. (10%↑ y-o-y)
Linen segment surged by 25% driven by expansion
Wool segment de-grew due to poor wool grease demand
EBITDA at ` 175 Cr. (2%↑ y-o-y)
Higher profitability in linen segment was offset by lower
wool combing volumes
Continuous focus on retail expansion and brand promotion to
fortify ‘Linen Club’ fabric brand
Opened 19 new ‘Linen Club’ EBOs during the year to reach
a total of 115 EBOs
Launched its own apparel line through ‘Linen Club Studio’
Operating at a sound ROACE of 53% p.a.
2013-14
(PY)
2014-15
(CY)
2013-14
(PY)
2014-15
(CY)
167 196 Linen Segment 614 765
177 178 Wool Segment 687 671
345 374 Revenue 1,300 1,435
45 46 EBITDA 172 175
37 38 Segment EBIT 141 146
317 237 Capital Employed 317 237
54 65 ROACE (Annualised) (%) 57 53
` Crore
Quarter 4 Full Year

46
Industry
Due to government policy for urea production beyond
100% quantity as permissible under Pricing mechanism,
few urea manufacturers had to take urea plant shutdown
during Q4FY15
Indo-Gulf
Indo-Gulf had to take urea plant shutdown for 35 days
starting 27th Feb’15, thereby, pulling down earnings from
normalised level. The plant resumed operations on
2nd Apr’15. During last year too, urea plant shutdown was
taken for 41 days
Revenue grew y-o-y by 11% largely due to pass through
of rise in natural gas prices & higher sales of customised fertilisers
EBITDA surged y-o-y by 90% to ` 148 Cr. led by improved energy efficiency, higher fixed cost reimbursement as per
Government policy and higher sales of pesticides
Outstanding subsidy & receivables at ` 1,207 Cr. (PQ: ` 1,109 Cr., Mar’14 : ` 1,176 Cr.)
Indo Gulf Fertilisers
2013-14
(PY)
2014-15
(CY)
2013-14
(PY)
2014-15
(CY)
175 176 Manufactured Urea Sales ('000 MT) 1,034 1,025
408 381 Revenue 2,313 2,558
361 348 Manufacturing(Urea, Customised Fertilisers)
1,995 2,248
47 33 Trading (Fertilisers, Seeds, Agro-Chemicals)
318 310
(25) (20) EBITDA 77 148
(30) (28) Segment EBIT 56 116
1,616 1,641 Capital Employed 1,616 1,641
(8) (7) ROACE (Annualised) (%) 3 7
Full Year
` Crore
Quarter 4

47
Industry
Indian textiles industry witnessed slowdown in H2FY15 with
steep fall in demand & prices across all major fibres & yarn.
ECU realisation declined y-o-y due to cheaper caustic imports
and lower chlorine prices. Q-o-Q, realisation has improved.
Indian Rayon
Amidst industry slowdown, Indian Rayon posted strong growth
in VFY profitability driven by new superfine yarn capacity
Total Revenue grew marginally y-o-y to ` 865 Cr.
VFY : Higher volumes led by new capacity
Chemicals : Softening of ECU realisation & lower caustic
volumes due to maintenance shutdown in power plant
EBITDA de-grew y-o-y by 11% to ` 197 Cr.
VFY : Expansion led higher volumes & realisation drove profitable growth
Chemicals : Lower ECU realisation & caustic soda volumes impacted coupled with higher power cost owing to shutdown
Operating at an ROACE of 21% p.a.
Indian Rayon
Note 1 : Including captive consumption and inter unit sale
2013-14
(PY)
2014-15
(CY)
2013-14
(PY)
2014-15
(CY) Net Revenue VFY
4,516 4,632 Manufactured VFY Sales Volumes (MT) 17,423 18,839
171 172 Revenue (VFY & allied chemicals) ( ` Cr.) 659 699
Chemicals
20,172 20,716 Caustic Soda Sales Volume (MT)1 86,758 80,162
51 44 Revenue ( ` Cr.) 202 166
223 216 Total Revenue 860 865
57 45 EBITDA 222 197
45 35 Segment EBIT 172 156
759 757 Capital Employed 759 757
23 19 ROACE (Annualised) (%) 24 21
Full Year
` Crore
Quarter 4

48
Aditya Birla Insulators
Industry
Insulators industry’s domestic sales volume de-grew
y-o-y by 12% during Apr’14-Jan’15 (Source : IEEMA)
Long term imposition of anti-dumping duty on imports from
China will provide sustainable relief to domestic manufacturers.
Aditya Birla Insulators
Revenue grew y-o-y by 8% to ` 548 Cr.
EBITDA rose by 14% to ` 95 Cr.
Higher volumes and increase in realisation (mainly to pass on
rise in operating costs) in the substation segment contributed
to the earnings growth
Profitability in the transmission segment was lower due to 42 days disruption / suspension of plant operations in Q1FY15
caused by stoppage of work in the plant by workers, pending long term wage settlement.
ROACE improved from 15% p.a. to 17% p.a.
2013-14
(PY)
2014-15
(CY)
2013-14
(PY)
2014-15
(CY)
11,340 11,564 Sales Volumes (MT) 36,913 38,581
159 163 Revenue 505 548
28 30 EBITDA 83 95
23 26 Segment EBIT 61 76
430 455 Capital Employed 430 455
22 24 ROACE (Annualised) (%) 15 17
Full Year Quarter 4
` Crore

49

50
Transaction Structure
ABNL
Transaction Steps
PFRL
58.3% 41.7%
27.4% 72.6% #
ABG Public
1 ABNL
MGLRCL
Madura
Lifestyle
2
100% #
Pre Transaction Post Transaction
39.84% 9.06% #
ABG Public
1
PFRL / ABFRL
Madura
Lifestyle
51.1%
Swap Ratio
# Including indirect holding
Mirror Demerger of Madura Fashion division into PFRL
Mirror Demerger of Madura Lifestyle division into PFRL
Net debt of ~Rs. 473 Cr. will be transferred along with the
businesses into PFRL. Transaction is subject to corporate &
regulatory approvals and is expected to take 6 to 9 months
1
2
26 equity shares of PFRL for every 5 equity shares of ABNL
7 equity shares of PFRL for every 500 equity shares of
MGLRCL
1 equity share of PFRL for all o/s preference shares of
MGLRCL
Shareholder holding 100 shares in ABNL will continue to hold 100 shares in ABNL & in addition will get 520 shares of PFRL

51
Transaction Details
Regulatory Body Requirement
Stock Exchange and SEBI
Scheme filing after board approval
Post court order – Allotment of shares
Approval for listing of shares
High Courts Bombay and Gujarat High Courts
Transaction is expected to be completed in next 6 - 9 months
Advisors
Transaction Advisor • Standard Chartered Bank
Independent Fairness Opinion • Axis Capital Limited
• JM Financial Institutional Securities Pvt. Ltd.
Legal Advisor • Amarchand & Mangaldas & Suresh A Shroff & Co.
Valuation Expert • Price Waterhouse & Co. LLP
• Bansi S Mehta & Co.
Key Regulatory Approvals

52
Annexure IV : Reporting Structure
Divisions
Rayon*
Agri*
Fashion &
Lifestyle
Financial
Services Telecom $ #
(23.28%)
Asset Management^
(51%) @
Life Insurance^
(74%) @
Private Equity (100%) ^
Broking (75%)^ #
Wealth management (100%) ^
General Insurance Advisory (50.01%) ̂ MyUniverse (100%)^
Insulators*
Represent Joint Ventures Represent Subsidiaries @ JV with Sun Life Financial, Canada Represent Divisions # Listed * ^ $
Leadership position in India Leader Top 3 Top 5
Pantaloons^ #
(72.62%)
Madura* Jaya Shree*
Note : Percentage figures indicated above represent ABNL’s shareholding in its subsidiaries /JV’s
NBFC & Housing Finance (100%) ^

53
Disclaimer
Certain statements made in this presentation may not be based on historical information or facts and may be “forward looking statements” including, but
not limited to, those relating to general business plans & strategy of Aditya Birla Nuvo Limited ("ABNL"), its future outlook & growth prospects, future
developments in its businesses, its competitive & regulatory environment and management's current views & assumptions which may not remain constant
due to risks and uncertainties. Actual results may differ materially from these forward-looking statements due to a number of factors, including future
changes or developments in ABNL's business, its competitive environment, its ability to implement its strategies and initiatives and respond to
technological changes and political, economic, regulatory and social conditions in the countries in which ABNL conducts business. Important factors that
could make a difference to ABNL’s operations include global and Indian demand supply conditions, finished goods prices, feed stock availability and
prices, cyclical demand and pricing in ABNL’s principal markets, changes in Government regulations, tax regimes, competitors actions, economic
developments within India and the countries within which ABNL conducts business and other factors such as litigation and labour negotiations.
This presentation does not constitute a prospectus, offering circular or offering memorandum or an offer to acquire any shares and should not be
considered as a recommendation that any investor should subscribe for or purchase any of ABNL's shares. Neither this presentation nor any other
documentation or information (or any part thereof) delivered or supplied under or in relation to the shares shall be deemed to constitute an offer of or an
invitation by or on behalf of ABNL.
ABNL, as such, makes no representation or warranty, express or implied, as to, and does not accept any responsibility or liability with respect to, the
fairness, accuracy, completeness or correctness of any information or opinions contained herein. The information contained in this presentation, unless
otherwise specified is only current as of the date of this presentation. ABNL assumes no responsibility to publicly amend, modify or revise any forward
looking statements on the basis of any subsequent developments, information or events or otherwise. Unless otherwise stated in this document, the
information contained herein is based on management information and estimates. The information contained herein is subject to change without notice and
past performance is not indicative of future results. ABNL may alter, modify or otherwise change in any manner the content of this presentation, without
obligation to notify any person of such revision or changes. This presentation may not be copied and disseminated in any manner.
INFORMATION PRESENTED HERE IS NOT AN OFFER FOR SALE OF ANY EQUITY SHARES OR ANY OTHER SECURITY OF ABNL
This presentation is not for publication or distribution, directly or indirectly, in or into the United States, Canada or Japan. These
materials are not an offer of securities for sale in or into the United States, Canada or Japan.
Aditya Birla Nuvo Limited
Corporate Identity Number L17199GJ1956PLC001107
Regd. Office: Indian Rayon Compound, Veraval – 362 266 (Gujarat)
Corporate Office: 4th Floor ‘A’ Wing, Aditya Birla Center, S.K. Ahire Marg, Worli, Mumbai – 400 030
Website: www.adityabirlanuvo.com or www.adityabirla.com Email: [email protected]