Embed Size (px)
Citation preview
Stock Options and Employee Behavior:
Evidence from Exercise and Survey Data
Zacharias Sautner and Martin Weber∗
March 9, 2006
Abstract
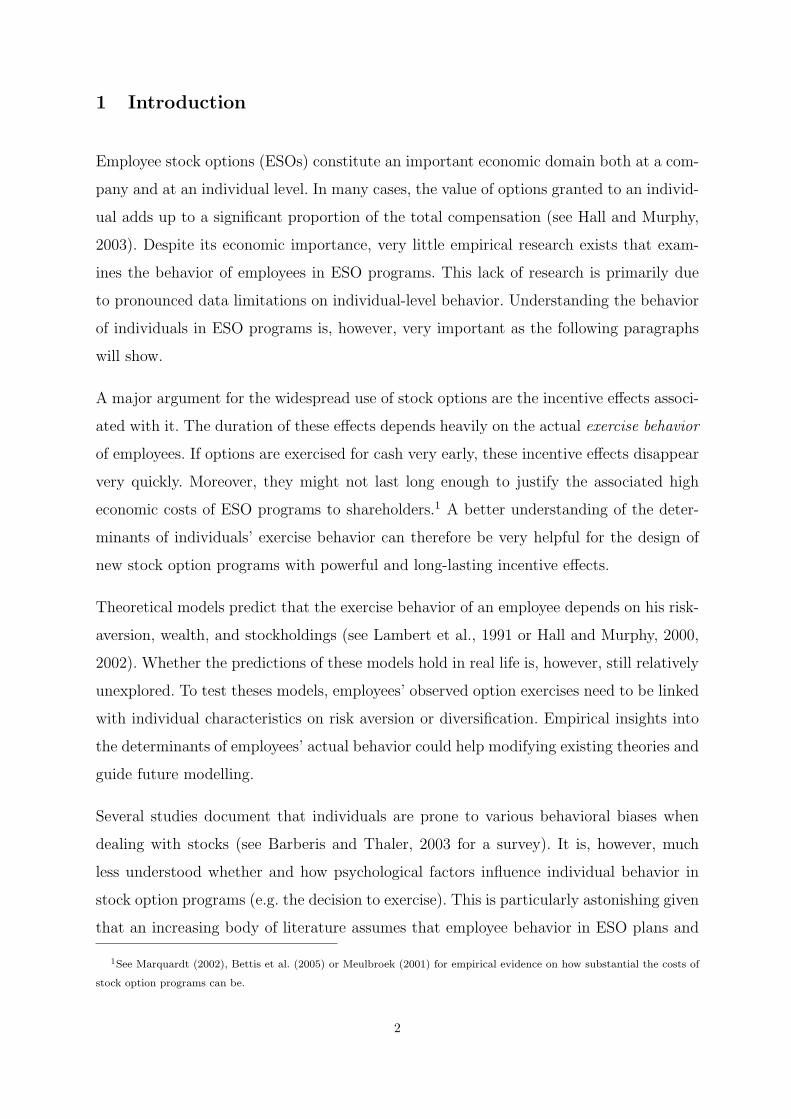
Employee stock options (ESOs) are a widespread and economically highly significant phenomenon,both at a company and at an employee level. Despite its economic importance and due to datalimitations, there exists very little empirical research that examines the behavior of employees instock option programs. Our study empirically analyzes the behavior of option holders in a distinctESO plan at a very large German corporation. Using individual-level option exercise data and verydetailed questionnaire data, we study how top managers exercise their stock options and how theydispose of company stock acquired in the ESO plan. Moreover, we investigate which rational andbehavioral factors explain differences in the observed exercise behavior. We find that individualsexercise their options very early and in a few large transactions. A large majority of option recipientssell the shares acquired on exercise. Furthermore, risk aversion and individuals’ holdings of companystock, factors that are included in rational models of exercise, cannot explain the exercise behavior inour data. We provide some interesting and new results that suggest that individuals’ exercise decisionsdepend on the psychological factors miscalibration and mental accounting.
Keywords: Employee Stock Options, Exercise Behavior, Stock Selling Behavior, Correlation of Economic
and Psychological Variables
JEL Classification Code: M41, M52, M55, G39
∗Zacharias Sautner is from the Saıd Business School, University of Oxford, Park End Street, Oxford OX1 1HP, United
Kingdom. E-Mail: [email protected]. Martin Weber is from the Lehrstuhl fur Bankbetriebslehre, Universitat
Mannheim, L 5, 2, 68131 Mannheim, Germany and CEPR, London. E-Mail: [email protected]. We would
like to thank Paul Oyer, Ulrike Malmendier, Ernst Maug, Matti Keloharju, Markus Glaser, and seminar participants at the
University of Mannheim, the Helsinki School of Economics, the University of Copenhagen, the Humboldt-University Berlin,
the Ringberg Workshop of the Max-Planck-Institute for Research into Economic Systems, and at the 12th ENTER-Jamboree
at the Free University Brussels for valuable comments. This paper was written during Zacharias Sautner’s doctoral studies
at the CDSEM of the University of Mannheim. Financial support from the European Commission within the European
Corporate Governance Training Network (ECGTN) and from the Deutsche Forschungsgemeinschaft (DFG) is gratefully
acknowledged.
1
1 Introduction
Employee stock options (ESOs) constitute an important economic domain both at a com-
pany and at an individual level. In many cases, the value of options granted to an individ-
ual adds up to a significant proportion of the total compensation (see Hall and Murphy,
2003). Despite its economic importance, very little empirical research exists that exam-
ines the behavior of employees in ESO programs. This lack of research is primarily due
to pronounced data limitations on individual-level behavior. Understanding the behavior
of individuals in ESO programs is, however, very important as the following paragraphs
will show.
A major argument for the widespread use of stock options are the incentive effects associ-
ated with it. The duration of these effects depends heavily on the actual exercise behavior
of employees. If options are exercised for cash very early, these incentive effects disappear
very quickly. Moreover, they might not last long enough to justify the associated high
economic costs of ESO programs to shareholders.1 A better understanding of the deter-
minants of individuals’ exercise behavior can therefore be very helpful for the design of
new stock option programs with powerful and long-lasting incentive effects.
Theoretical models predict that the exercise behavior of an employee depends on his risk-
aversion, wealth, and stockholdings (see Lambert et al., 1991 or Hall and Murphy, 2000,
2002). Whether the predictions of these models hold in real life is, however, still relatively
unexplored. To test theses models, employees’ observed option exercises need to be linked
with individual characteristics on risk aversion or diversification. Empirical insights into
the determinants of employees’ actual behavior could help modifying existing theories and
guide future modelling.
Several studies document that individuals are prone to various behavioral biases when
dealing with stocks (see Barberis and Thaler, 2003 for a survey). It is, however, much
less understood whether and how psychological factors influence individual behavior in
stock option programs (e.g. the decision to exercise). This is particularly astonishing given
that an increasing body of literature assumes that employee behavior in ESO plans and
1See Marquardt (2002), Bettis et al. (2005) or Meulbroek (2001) for empirical evidence on how substantial the costs of
stock option programs can be.
2
psychological biases are related (see, e.g., Oyer and Schaefer, 2005 and Bergman and
Jenter, 2005). Studying individual behavior in the context of option plans is therefore
a way to test if and how psychological biases affect economic activity in an important
domain. It is well-known that behavioral biases are of particular importance in situations
where subjects have a high degree of individual autonomy in their decisions and where
large amounts of money are concerned (as it is the case in ESO programs). Linking
judgement biases and individual transactions such as option exercises hence provides a
way to test which biases actually influence economic behavior.
From a practitioner standpoint, understanding the behavior of employees in ESO plans
is crucial for the estimation of the accounting costs of stock option programs. According
to the Financial Accounting Standard (FAS) 123, companies expensing the costs of stock
option plans need to estimate the expected life of issued options as an ingredient of classical
option pricing models (see Hull and White, 2004). The expected life of ESOs depends on
when option holders actually exercise their options. A precise estimation of the individual
behavior can thereby significantly reduce the accounting costs of ESO plans to the granting
firms. In a recent paper, Bettis et al. (2005) show that the failure to adjust for observed
exercise patterns can overstate the costs of stock options significantly.
We try to provide a contribution to a better understanding of individual behavior in ESO
plans by empirically studying the following set of research questions: How do employees
exercise their stock options? How do employees dispose of company stock acquired in stock
option programs? What rational and behavioral factors explain differences in observed
exercise behavior? To investigate these issues, we are able to use comprehensive and
unique data on individual behavior in the stock option plan of one of the largest German
companies. We can combine detailed individual-level stock option exercise data of the
senior managers of this company with extensive questionnaire information on a wide
range of individual-specific characteristics, beliefs, and attitudes. We further have data
about what the managers did with the shares acquired on exercise, and whether or not
they sold a stock investment that was required prior to the participation in the ESO
program (the so-called required stock investment, abbreviated RSI).2
The uniqueness of our data set stems from the individual-level of our data set and from
2For every ten options they received, employees had to buy one share of company stock.
3
the possibility to combine exercise and survey data. To our knowledge, there exist no other
empirical studies in the academic literature on ESO programs that also link individual
behavior with employee-level data on economic and psychological variables like risk aver-
sion, stockholdings, overconfidence or optimism which are included in our sample. As our
study uses data on the stock option program of a single company, we are effectively doing
a case study, which has natural benefits and costs. We therefore concentrate on looking
at individual-level determinants of behavior which show within-firm variation and do not
study cross-sectional firm characteristics and their influence on behavior. The case study
environment allows us to look inside the firm and to analyze finely tuned questions. Also,
all managers in our study worked under the same organizational environment. This is
certainly an advantage of our research design, but has the drawback that we need to be
careful with generalizations of our results. We use survey methodology as we believe that
conducting a survey is the best way to address the research questions outlined above.
Our main findings can be summarized as follows. Consistent with the ESO literature,
individuals in our data set exercise their stock options very early and in a few large trans-
actions. A large majority of option recipients sells the shares acquired on exercise. Most
individuals exercise for cash and hereby reduce the exposure to company stock. However,
we have evidence that employees suffer from mental accounting and violate the fungibility
principle: they dispose differently over equity acquired on exercise and over equity bought
for the RSI. Shares from the first source are much more likely to be converted into cash
than those of the second one. Furthermore, risk aversion and individuals’ holdings of com-
pany stock, factors that are included in rational models of exercise like those of Lambert
et al. (1991) and Hall and Murphy (2000, 2002), cannot explain the exercise behavior
in our data. We provide some interesting and new results that suggest that individuals’
exercise decisions depend on the psychological factors miscalibration and mental account-
ing. In particular, we offer evidence that suggests that miscalibrated individuals put a
too small value on stock options and therefore exercise too early. Our results supplement
the findings by Heath et al. (1999) who also document that psychological factors can
affect exercise decisions in ESO plans (in their study reference points and beliefs in trend
extrapolation and mean reversion).
The remainder of this paper is organized as follows: Section 2 provides the theoretical
4
background for the behavior of employees in ESO programs. Section 3 surveys the existing
empirical literature that studies individual behavior in option plans. The data sets and
the design of our study are described in Section 4. Section 5 presents our methodology
and describes the variables we use in the empirical analysis. The results of our case study
are presented in Section 6. We hereby provide descriptive statistics and try to explain the
differences in the observed employee behavior. Finally, Section 7 summarizes our results
and concludes.
2 Theoretical Background
Employees can neither freely trade or sell their stock options nor hedge away the implied
risks by short-selling company stock.3 Moreover, employees are usually inherently undi-
versified with their entire human capital invested in the company. The inability to hedge
the risk of stock options and their serious non-diversification will cause employees to value
ESOs in a way that systematically differs from that of well-diversified outside investors.
This implies that the concept of risk-neutral valuation can not be applied to the pricing
of ESOs. Therefore, an employee’s value of a stock option will usually not equal the Back
and Scholes (1973) value of a fully diversified investor, and exercise decisions prior to
maturity can be rational under certain circumstances.
It is important to note that the value an employee puts on his options is closely related
to his exercise behavior. A stock option will usually be exercised whenever an employee’s
expected utility from exercising prior to maturity is greater than the expected utility from
continuing to hold the option (see Huddart, 1994, Carpenter, 1998 or Bettis et al., 2005).
An individual’s exercise decision therefore reveals information about the value he places
on an option: the lower the value, the earlier he exercises it. If an employee exercises an
option at a certain date prior to maturity, he obviously values it less than or equal to
the amount of money he realizes from exercising (while continuing to hold the derivative
reveals that he values it above its intrinsic value).
3Stock option programs usually forbid employees to bilaterally sell their options and to go short in the underlying
company stock.
5
Rational Determinants of Behavior
Lambert et al. (1991) formally showed that risk preferences and endowments of individuals
affect the valuation of employee stock options. By using an expected utility framework,
they define the value of an option as the lump-sum payment (certainty equivalent) that
makes an individual indifferent between receiving this payment for certain and receiving
the uncertain payoff that is induced by holding the option. They hereby point out that an
employee’s entire wealth structure and his risk preferences affect his subjective valuation.4
More specifically, Lambert et al. (and later also Hall and Murphy, 2000, 2002) show that
the option value is lower for employees who are more risk averse, who hold a larger fraction
of wealth in company stock, and who have less outside wealth.
It is well documented that an employee’s firm-specific skills grow over time and increase
the productivity at the employing firm (see, e.g., Becker, 1964). However, firm-specific
skills are likely to be useless when the current job is terminated and when the employee
moves to another company. Although the firm-specificity of human capital is not formally
captured in ESO models, it is likely to affect exercise activity as well. More specifically,
one can expect that employees with a more firm-specific human capital exercise options
earlier in order to diversify.5
Behavioral Determinants of Behavior
There exists widespread and persistent evidence in the academic literature that psycho-
logical/behavioral factors affect individual decision making in economics and finance.6 In
what follows, we consider three psychological variables and their relationship to individual
behavior in ESO programs.
Increasing empirical evidence shows that individual decisions are subject to the psycholog-
ical bias overconfidence. Experimental studies have found that executives are particularly
vulnerable to showing overconfidence and the concept of overconfidence therefore cur-
4For a typical power utility function, Lambert et al. report that an employee’s valuation of a stock option can be less
than 50% of the Black and Scholes (1973) option value if he invested 50% of his wealth in his firm’s shares.
5Apart from these diversification issues, exercise decisions prior to maturity can be rational in cases where option holders
urgently need liquidity. Early exercise is rational in such a case if the value sacrificed by exercising pre-maturely is less than
the cost for a loan that might be taken out alternatively. See Subsection 6.4.
6See Rabin (1998) or Barberis and Thaler (2003).
6
rently receives increasing attention in the corporate finance literature.7 Overconfidence
can manifest itself in different forms like miscalibration, the better than average effect or
in illusion of control (see Glaser and Weber, 2006). In what follows, we consider overcon-
fidence as the tendency of individuals to assign confidence intervals to their estimates of
quantities that are too tight (miscalibration). Several studies find that this kind of over-
confidence is a robust phenomenon, especially when people judge items that are difficult.8
As a consequence, overconfidence, defined as an individual’s degree of miscalibration, is
very likely to affect employee behavior in ESO programs as well. Miscalibrated employees
assign confidence intervals to future stock prices that are too narrow and they thereby
subjectively underestimate the volatility of future stock returns. In the context of stock
options, this individual bias can result in a misvaluation of the time value imbedded in
options. The subjectively perceived stock price volatility has two effects on option val-
ues: on the one hand, it increases value as it lowers the firm-specific risk employees are
exposed to. But on the other, hand it also decreases value because of the convexity in
a stock option’s payoff. Whether overconfidence overall leads to earlier or later exercise
decisions remains an empirical question.
People regularly believe that favorable outcomes occur more frequently than they actually
do (see, e.g., Weinstein, 1980). This phenomenon is often called overoptimism or unrealis-
tic optimism. As with overconfidence, managers are again particulary likely to be exposed
to this behavioral bias. Overoptimistic managers believe that future stock returns of their
own companies are greater than they actually are. In two recent studies, Bergman and
Jenter (2005) and Oyer and Schaefer (2005) incorporate this form of unrealistic optimism
into stock option compensation frameworks. Both papers show that companies will com-
pensate their employees with options when employees are irrationally optimistic about
company stock. Overoptimistic individuals put higher values on their options and will
therefore exercise at later points in time compared to less optimistic individuals.
It is documented in numerous experimental studies that individuals use cognitive op-
erations to organize and evaluate financial activities. Thaler (1980, 1999) denotes this
7See Moore (1977), Kidd (1970), and Larwood and Whittaker (1977) as well as Malmendier and Tate (2005) or Gervais
et al. (2003).
8See Glaser and Weber (2006), Klayman et al. (1999) or Soll and Klayman (2004).
7
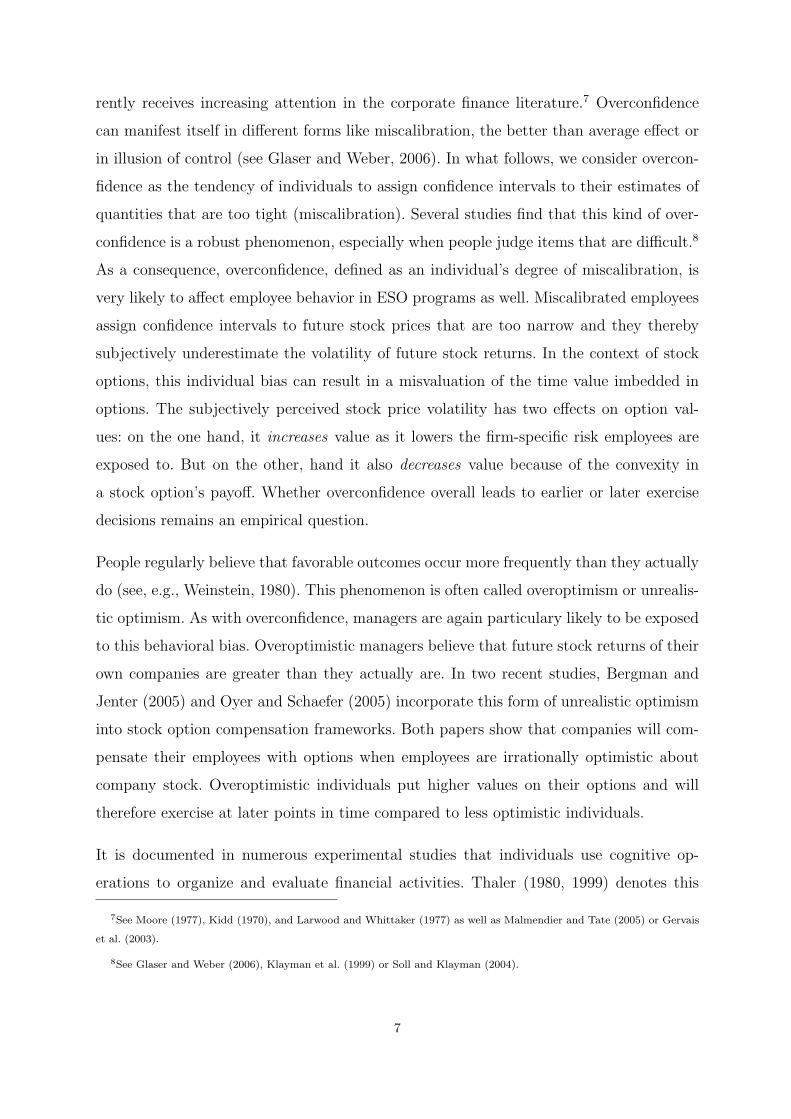
Table 1: Predicted Relationship Between Exercise Behavior and Rational and Psychological
Factors
This table reports predicted relationships between various rational and psychological variables and ESO valuation/ESO
exercise behavior. “+” means that a model or theory predicts that an increase in the respective variable results in an
increase in the subjective option value and hence in a later exercise decision. Correspondingly, “-” means that a model or
theory predicts that an increase in the variable results in a decrease in the subjective option value and hence in an earlier
exercise decision. “?” means that no prediction is possible.
Variable Exercise Behavior
(Predicted Sign)
Rational Variables
Risk Aversion -
Stockholdings -
Wealth +
Firm-specificity of human capital -
Psychological Variables
Miscalibration ?
Optimism +
Mental accounting -
kind of thinking as mental accounting. Mental accounting violates the economic axiom of
fungibility as individuals perceive economically identical assets in isolation (by assigning
them to different mental accounts). One aspect of mental accounting is that investors
do not sufficiently integrate individual assets into the rest of their wealth and focus on
narrowly defined gains and losses (cross-sectional narrow bracketing).9 Using prospect
theory, Massey (2003b) argues that the more narrowly an individual brackets his ESOs
(i.e. the less he integrates them into his total wealth), the lower his valuation of these
assets will be. Individuals that suffer from narrow bracketing should hence exercise their
options earlier compared to those that integrate their financial wealth.
A related aspect of mental accounting is that individuals often have myopic perspectives
when evaluating assets (temporal narrow bracketing).10 Benartzi and Thaler (1999) have
shown that myopia of investors with respect to risky gambles can lead to more risk averse
9The valuation of gains and losses rather than absolute wealth levels is a central feature of prospect theory, see Kahneman
and Tversky (1979).
10See Kahneman and Lovallo (1993).
8
decision-making. In the context of employee options, this line of argument implies that
individuals with short-term perspectives concerning stock price changes will regard options
as being less attractive. One can therefore predict that myopic individuals will be more
likely to exercise their ESOs at early dates.
Overall, the economic literature thus suggests that a set of rational and psychological
variables (risk aversion, company stockholdings, wealth, the firm-specificity of human
capital, miscalibration, optimism, and mental accounting) appears to be relevant for the
understanding of individual behavior in ESO programs. Table 1 summarizes the predicted
relationships between the variables discussed above and exercise decisions. To get a thor-
ough understanding and explanation of actual exercise patterns, one needs to ascertain
these variables (or proxies for them) empirically. One way to do this is by distributing a
questionnaire to option recipients of a particular ESO program. As most of the variables
discussed above are unobservable, we believe that conducting a survey is a very good way
to effectively link individual characteristics with employee-level exercise data.
3 Empirical Evidence on Employee Behavior in Stock Option
Plans
Data on employee behavior in option plans is highly confidential and causes a lack of
empirical studies in the field. The existing empirical findings suggest that employees gen-
erally exercise options in a few large transactions and that exercises take place well before
expiration. Also, many employees exercise the maximum permissible number of options
shortly after the first vesting anniversary.
Core and Guay (2001) find that option exercises are higher when the realizable value
of an option on exercise captures a greater percentage of the options theoretical Black
and Scholes (1973) value. This finding is considered evidence consistent with employees
recognizing that it is costly to exercise options too early (because it involves sacrificing
the time value of the option).11
11Heath et al. (1999) argue that exercise decisions of rational employees meeting liquidity needs or diversification goals
are more likely when the ratio of the intrinsic value to the Black-Scholes value is relatively large.
9
Bettis et al. (2005) find that employees working for firms with high stock price volatility
exercise their options earlier than those working for firms with low volatility. Furthermore,
employees at higher grades hold their options longer than those at lower ones. They
consider this finding as evidence suggesting that risk averse individuals exercise to reduce
the exposure to firm specific risk.12
Heath et al. (1999) and Huddart and Lang (1996) were the first who tried to study how
psychological factors influence exercise behavior. They show that option holders exercise
in a way that suggests that they believe that short-term price trends will reverse (mean
reversion) and that long-term price trends will persist (trend extrapolation). They also find
that exercise activity increases immediately when the stock price exceeds the maximum
level that was attained during the previous year.
Massey (2003a) matches data on exercise decisions of employees from a Fortune 100
company with a set of demographic characteristics provided by the company and with
stock price characteristics. He finds that exercises are sensitive to behavioral factors (the
short-term stock performance), the volatility of the option, the time-until expiration, and
to an individual’s experience with options. Demographic characteristics seem to have no
impact on the exercise decision.
Even less explored is the question of how option recipients dispose of shares acquired in
ESO plans. In a study on changes in stock and option ownership of top managers, Ofek
and Yermack (2000) document that executives sell nearly all of the shares they acquired
on exercise (regardless of their prior equity ownership).
4 The Company, the Data, and the Stock Option Program
The previous section has shown that empirical research which looks inside firms to study
individual behavior in stock option plans is quite rare. Most existing studies look at
aggregate exercise decisions of employees in different organizations and have no access
to individual-specific information. However, to get a deeper understanding of managerial
12They hereby assume that lower level employees are more risk averse or have more of their financial and human capital
invested in the firm.
10
behavior in ESO plans one needs to study more detailed information about the individuals
acting in these plans. Our objective is to examine in detail the behavior of managers in
one corporation. In particular, we analyze how well the theoretical mechanism on exercise
behavior outlined above fit our data. We thereby essentially conduct a clinical study
and, as a consequence, concentrate on looking at individual determinants of behavior
which show within-firm variation (rather than looking at cross-company determinants of
behavior).This section describes the data we use and also summarizes institutional details
on the investigated ESO program.
Our first data set contains stock option exercise transactions of all 70 top management
employees from one of the largest German corporation. The data set includes detailed
records of all exercises of these individuals between May 30, 2003 and September 16,
2004 (the “observation period”). All 70 managers belong either to the management board
(“Vorstand”) or to the first and second hierarchy level of the firm.
Stock options were granted between July and August 2000. The exercise period within
which options are exercisable opened on May 30, 2003 and closes in December 2005.
To avoid conflicts of interests with regard to insider information, the company decided
that options are not exercisable on all days during the exercise period but only within a
few so-called exercise windows. Each exercise window opens after the announcement of
company earnings and last for approximately four weeks. The ESO program encompasses
nine separate exercise windows in total. Our data set consists of exercises that took place
within the first five exercise windows. Since more than 90% of all options were exercised
during these five windows, we believe to have an accurate picture of the overall exercise
activity. Initially, the strike price of the options was equal to the arithmetical average of
the stock price 20 days prior to the option grant (15.00 Euro) with a conversion ratio of
1 (i.e. to buy one share of company stock at a price of 15.00 Euro, one option had to be
delivered). To avoid adverse effects for the stock price resulting from a large number of
option exercises with subsequent stock sales, the company decided to reduce the strike
price from 15.00 Euro to 3.00 Euro and lowered the conversion ratio from 1 to St−15St−3
(i.e.
a larger number of options had to be delivered to buy one share of company stock at a
reduced price). The program was designed such that employees were allowed to exercise all
options at one point in time (“cliff vesting”). Individuals were prohibited from conducting
11
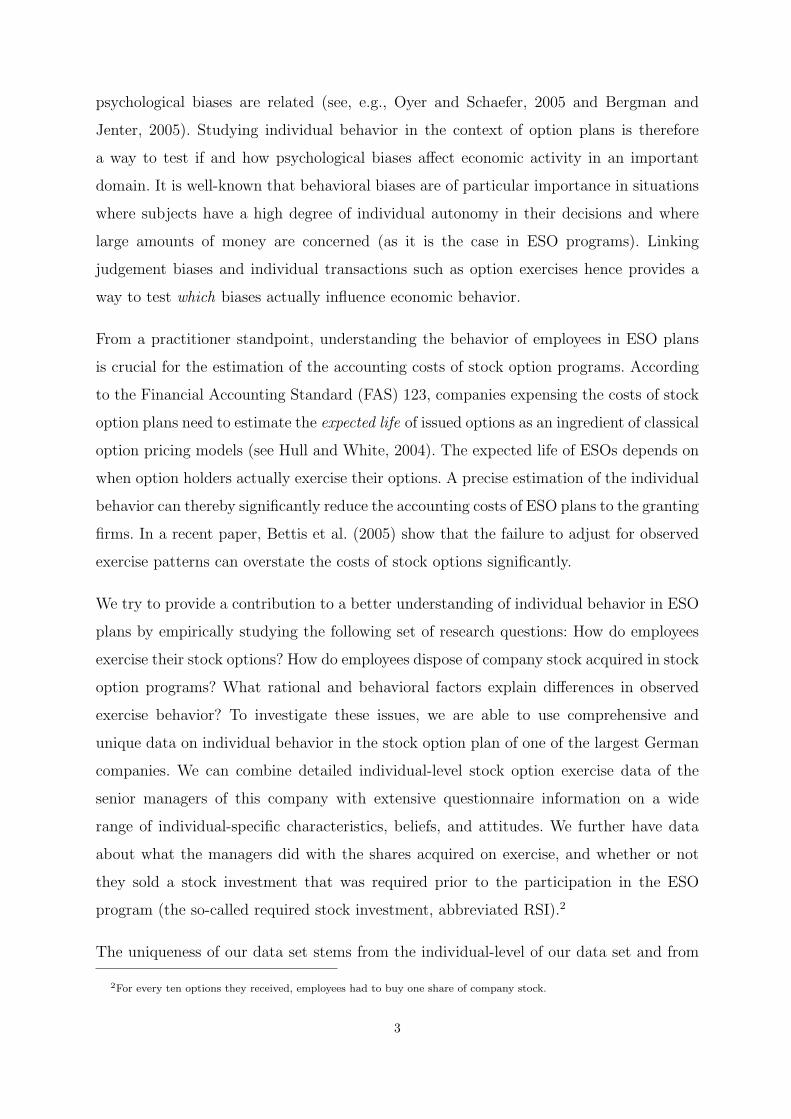
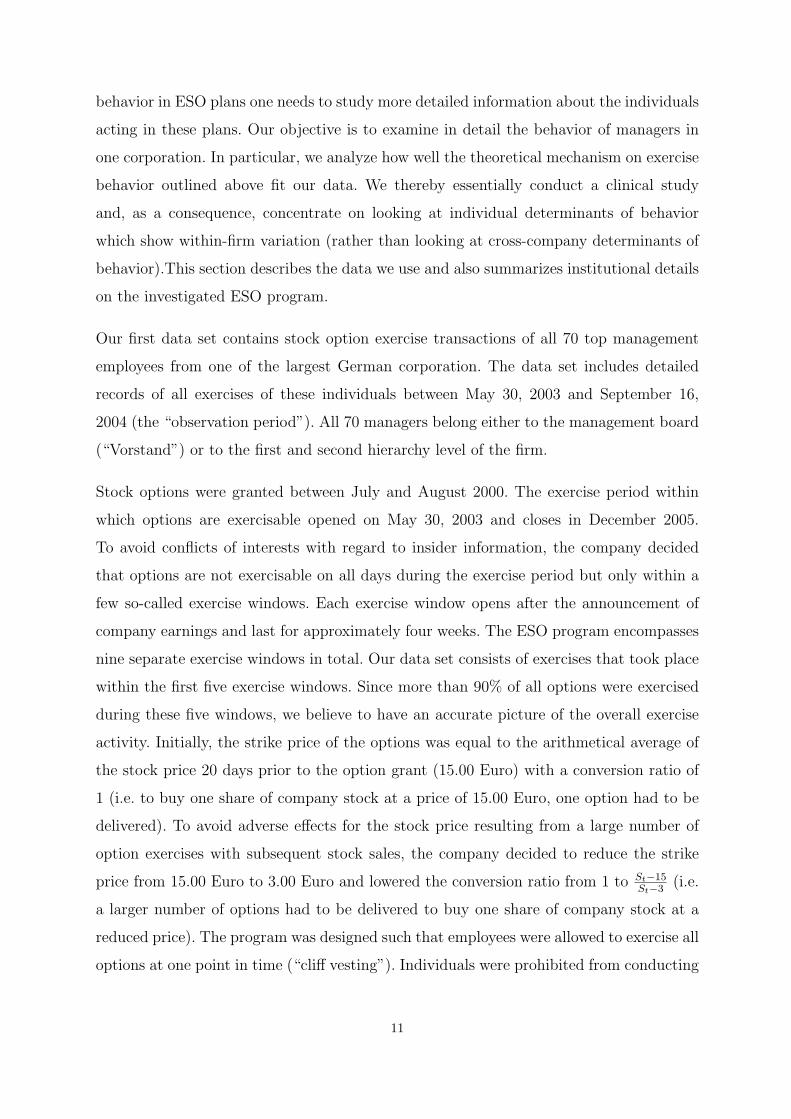
Figure 1: Overview of the ESO Program Structure
This figure documents the basic structure of the stock option program we study. It presents the
granting period, the vesting period, and the various exercise windows.
9 exercise windowsVesting Period
08/2000-05/2003 05/2003-12/2005
…
Four weeks each07/2000-08/2000
Granting Period
time
Structure of the Employee Stock Option Program
more than one exercise transaction per exercise window. Moreover, they were not allowed
to sell the RSI during the vesting period. Figure 1 provides a simplified overview of the
structure of the ESO program.
The company is one of the largest in its industry in Europe and employs more than
50,000 people worldwide. Its turnover exceeded 5 billion Euro in 2003 and its shares
are publicly traded. The company supplied the data on the condition that itself and its
managers remain anonymous. Both during the vesting and during the exercise period, no
extraordinary firm-specific events (like bankruptcy or financial distraction) occurred that
might have driven the exercise activity. There used to be no traded options on company
stock at the derivative exchange Eurex.
Our second data set consists of comprehensive data on individual-specific characteristics,
beliefs, and attitudes and was collected by means of a questionnaire. It further includes
information on what each individual did with the shares he acquired on exercise and
whether or not he sold the stock investment that was required prior to the participation
in the ESO program. On May 14, 2004, between the third and fourth exercise window, all
individuals participating in the ESO program received a mail and were asked to participate
in the survey. 48 out of 70 option recipients returned our questionnaire resulting in a
12
response rate of 68.57%. To avoid strategic and untruthful answering, we guaranteed
that survey responses are treated confidentially and used for research purposes only. In
particular, we assured that neither the executive board of the company nor their human
resources department will be able to access individual answers.
5 Methodology and Data Description
In this section, we present details on the methodology of our study and provide descrip-
tions and summaries of the variables and measures we employ throughout our analysis.
Individuals were free in deciding when to exercise their stock options (the exercise windows
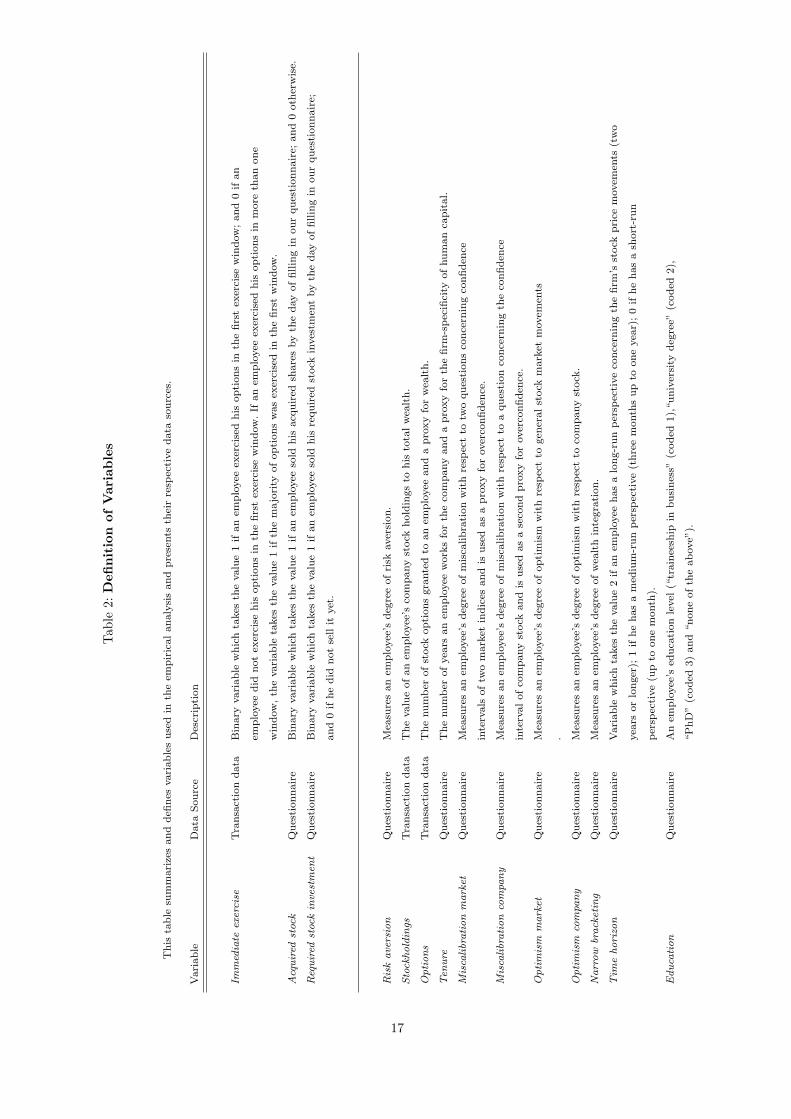
being the only given restriction). Immediate exercise is a binary variable that reflects the
exercise behavior of an option holder and documents how early he exercised his options.
It takes the value 1 if an employee exercised his ESOs during the first exercise window.
Correspondingly, it takes the value 0 if he did not exercise during the first window. The
latter contains both the case that an employee has not yet exercised any of his stock
options and the case that options were exercised in the second, third, fourth or fifth
window. If options were exercised in more than one window, the variable takes the value
1 if the majority of options was exercised in the first window. The variable is based on
the exercise data provided by the company.
When individuals exercise their ESOs, they acquire the underlying company stock and pay
the strike price. Option recipients can sell these shares immediately to log in the difference
between the stock price at the exercise date and the strike price.13 Alternatively, they
may decide not to sell acquired shares and keep them in their private stock portfolios. To
characterize the stock selling behavior of an individual employee, we use a binary variable
named acquired stock. It takes the value 1 if an individual sold his purchased shares by
the day of filling in the questionnaire (either by paying the strike price and selling the
shares or by cashless exercise), and 0 otherwise. The variable is based on self-reported
data collected by our questionnaire.
13The immediate sale of shares can also be realized by cashless exercise, a procedure in which a brokerage firm delivers
the difference between the strike price and the market price at exercise to the employee. As documented by Heath et al.
(1999), cashless exercise is very common in stock option programs.
13
A variable that is closely related to acquired stock is denoted required stock investment.
Recall that before being granted their ESOs, managers had to buy one share of company
stock for every ten options they received. Individuals were restricted from selling these
shares during the vesting period. From the inception of the vesting period onwards, em-
ployees were free in trading their initial stock investments. Required stock investment is a
binary variable which takes the value 1 if an employee sold his stock investment (RSI) by
the day of participating in our questionnaire, and correspondingly 0 if he did not sell it.
We use this measure based on self-reported information.
We argued that risk aversion can have a substantial effect on exercise decicions in ESO
plans. Following Massey (2003b), we used a certainty equivalence method to elicit the
degree of risk aversion of an individual. In this method, employees were offered an un-
certain prospect (a lottery) and were asked to indicate the amount of a sure payoff that
they consider equally attractive. The lottery was designed as a 50% chance of winning an
amount equal to a subject’s current wealth, and a 50% chance of winning nothing. The
certain payoff was a pre-specified and guaranteed change in wealth (e.g. a 30 or 40% in-
crease in wealth). We transformed the certainty equivalents into a risk aversion parameter
assuming a specific parametric form of the utility function. Following other studies in the
decision analysis literature, we work with a power utility function of the form u(x) = xα
(see Tversky and Kahneman, 1992). In this parametric form, α reflects the concavity of
the utility function and is a measure of an individual’s degree of risk aversion. Higher
certainty equivalents imply higher values of α and a smaller degree of risk aversion.
To measure individuals’ exposure to firm-specific financial risk, we asked each option
recipient for the percentage of total wealth that is currently invested in company stock.14
Stockholdings consequently reflects the value of an employee’s company stock holdings
divided by his total wealth.
Managers at higher levels in a company receive a large number of stock options and
14We presented two questions. In the first question, we asked individuals about the percentage of total wealth (including
savings, shares, mutual funds, bonds, life insurance, home equity etc.) that is currently approximately invested in stocks
and mutual funds including stocks. The second question asked them about the fraction of their total stockholdings that is
invested in company stock (including shares they received by exercising their options and shares resulting from the required
and not yet sold RSI). We combined the answers to both questions multiplicatively to get a measure of an employee’s total
wealth invested in company stock. The questionnaire can be found in the Appendix.
14
also get a higher cash salary. They are therefore ceteris paribus wealthier and have more
opportunities to diversify wealth. As described in Section 2, the value of an ESO is an
increasing function of wealth. We use the number of options granted to an individual
(options) as a proxy for wealth.15 This information is based on the transaction data set
provided by the company. Following May (1995) and Degeorge et al. (2004), we use tenure
as a proxy for the firm specificity of human capital. Tenure is measured as the number of
years a manager has been working for the company.
To measure the degree of miscalibration, we asked individuals to provide lower and upper
bounds of 90% confidence intervals to two questions concerning index level forecasts (for
the DAX and the Euro Stoxx 50), and to one question concerning the forecast of the
price of company stock for the end of the year 2004.16 Confidence interval questions are
widely used in the literature to elicit probability distributions and variance estimations
of stock returns.17 Following the methodology suggested in Keefer and Bodily (1983),
we transformed confidence intervals into volatility estimates and compared them with a
volatility benchmark.18 We use two measures of miscalibration: Miscalibration market is
used as a measure to reflect an individual’s degree of miscalibration with respect to general
stock market trends.19 Miscalibration company measures an individual’s miscalibration of
his volatility forecast for company stock. A lower value of our miscalibration measure
15Each non-board member (board member) could obtain up to 10,000 (50,000) options. For every ten options, one share
of company stock had to be bought (see above). Given their personal financial constraints, individuals therefore had to
decide how many options they actually wanted to receive. See Subsection 6.1.2 for descriptive data.
16The lower bound was defined such that the correct index/market price level at the end of the year 2004 should not fall
short of this bound with a probability of 95%. Similarly, the upper bound was defined such that correct index/price level
at the end of the year 2004 should not exceed the bound with a probability of 95%.
17See, for example, Glaser and Weber (2005, 2006), Klayman et al (1999), Biais et al. (2005), and Soll and Klyman (2004).
18Keefer and Bodily (1983) show that the following approximation provides a good estimation of the forecasted volatility
of a time series i: Volatilityi =r(0.95)i−r(0.05)i
3.25with i ∈ {DAX, Euro Stoxx 50, Company stock}, r(0.95) being the upper
and r(0.05) being the lower bound of the forecast. As volatility benchmarks, we use historical volatilities of non-overlapping
7 months returns. Historical volatilities are often used as objective volatility benchmarks or as estimates for future volatility
(see Graham and Harvey, 2002 or Glaser and Weber, 2006). Implied volatilities of exchange-traded options on company
stock were not available. Note that the forecast horizon in the questionnaire was approximately 7 months. By dividing the
Keefer and Bodily (1983) measure through the corresponding historical values, we get a measure of an individual’s degree
of miscalibration.
19It is constructed by calculating the arithmetic average over the miscalibration measures for the two market indexes
DAX and Euro Stoxx 50.
15
reflects tighter confidence intervals and implies a higher degree of miscalibration.20
In order to investigate the impact of stock market forecasts on employee behavior, we asked
each option recipient to provide a median forecast for the values of the two indexes DAX
and Euro Stoxx 50, as well as for the price of company stock at the end of 2004. For each
individual, we transformed these price/index forecasts into median return forecasts. We
thereby construct a measure of the general market optimism of an individual (optimism
market), and a measure of his optimism concerning company stock (optimism company).
Optimism market is calculated as the average over the market forecasts for DAX and
Euro Stoxx 50. Optimism company is simply the expected return for company stock.
To asses the pervasiveness of mental accounting, we investigated whether individuals think
of their stock options in isolation (narrow bracketing) or as part of an overall investment
strategy (asset integration). The resulting variable is denoted as narrow bracketing.21 To
explore the second dimension of mental accounting, we wanted to know how far option
recipients actually look ahead when they consider their stock options and possible future
prices of company stock. Time horizon is a discrete variable that takes the value 2 if
an employee has a long-run perspective (two years or longer), 1 if he has a medium-run
perspective (three months up to one year), and 0 if he has a short-run perspective (up to
one month only). In addition, employees provided information on their education levels
by indicating to what category their highest degree belonged to.22 Due to the fact that
all option recipients were men, we did not have to account for gender effects.
Table 2 summarizes the variables used in our empirical analysis and presents their respec-
tive data sources. A copy of the questionnaire can be found in the Appendix.
To investigate the determinants of exercise decisions, we form two groups of individuals:
• a group consisting of people that immediately exercised stock options and decided to
20If the value of the miscalibration measure equals one, we call an individual well-calibrated. If the ratio is smaller than
one, he is considered miscalibrated.
21More specifically, individuals were asked to indicate to what extend the statement “I try to make my private stock
investments in a way that takes my positions in employee stock options into account” is consistent with their own behavior.
They registered their answers on a seven-point scale ranging from “I strongly disagree” (1) to “I strongly agree” (7).
22With the categories being “traineeship in business” (coded 1), “university degree” (coded 2), “PhD” (coded 3) and
“none of the above”.
16
Tab
le2:
Defi
nit
ion
ofV
aria
ble
s
This
table
sum
mari
zes
and
defi
nes
vari
able
suse
din
the
empir
icalanaly
sis
and
pre
sents
thei
rre
spec
tive
data
sourc
es.
Vari
able
Data
Sourc
eD
escr
ipti
on
Imm
edia
teex
erci
seTra
nsa
ctio
ndata
Bin
ary
vari
able
whic
hta
kes
the
valu
e1
ifan
emplo
yee
exer
cise
dhis
opti
ons
inth
efirs
tex
erci
sew
indow
;and
0if
an
emplo
yee
did
not
exer
cise
his
opti
ons
inth
efirs
tex
erci
sew
indow
.If
an
emplo
yee
exer
cise
dhis
opti
ons
inm
ore
than
one
win
dow
,th
evari
able
takes
the
valu
e1
ifth
em
ajo
rity
ofopti
ons
was
exer
cise
din
the
firs
tw
indow
.
Acq
uired
stoc
kQ
ues
tionnair
eB
inary
vari
able
whic
hta
kes
the
valu
e1
ifan
emplo
yee
sold
his
acq
uir
edsh
are
sby
the
day
offillin
gin
our
ques
tionnair
e;and
0oth
erw
ise.
Req
uired
stoc
kin
vest
men
tQ
ues
tionnair
eB
inary
vari
able
whic
hta
kes
the
valu
e1
ifan
emplo
yee
sold
his
requir
edst
ock
inves
tmen
tby
the
day
offillin
gin
our
ques
tionnair
e;
and
0if
he
did
not
sell
ityet
.
Ris
kave
rsio
nQ
ues
tionnair
eM
easu
res
an
emplo
yee
’sdeg
ree
ofri
skaver
sion.
Sto
ckhold
ings
Tra
nsa
ctio
ndata
The
valu
eofan
emplo
yee
’sco
mpany
stock
hold
ings
tohis
tota
lw
ealt
h.
Options
Tra
nsa
ctio
ndata
The
num
ber
ofst
ock
opti
ons
gra
nte
dto
an
emplo
yee
and
apro
xy
for
wea
lth.
Ten
ure
Ques
tionnair
eT
he
num
ber
ofyea
rsan
emplo
yee
work
sfo
rth
eco
mpany
and
apro
xy
for
the
firm
-spec
ifici
tyofhum
an
capit
al.
Mis
calibr
ation
mark
etQ
ues
tionnair
eM
easu
res
an
emplo
yee
’sdeg
ree
ofm
isca
libra
tion
wit
hre
spec
tto
two
ques
tions
conce
rnin
gco
nfiden
ce
inte
rvals
oftw
om
ark
etin
dic
esand
isuse
das
apro
xy
for
over
confiden
ce.
Mis
calibr
ation
com
pany
Ques
tionnair
eM
easu
res
an
emplo
yee
’sdeg
ree
ofm
isca
libra
tion
wit
hre
spec
tto
aques
tion
conce
rnin
gth
eco
nfiden
ce
inte
rvalofco
mpany
stock
and
isuse
das
ase
cond
pro
xy
for
over
confiden
ce.
Optim
ism
mark
etQ
ues
tionnair
eM
easu
res
an
emplo
yee
’sdeg
ree
ofopti
mis
mw
ith
resp
ect
togen
eralst
ock
mark
etm
ovem
ents
.
Optim
ism
com
pany
Ques
tionnair
eM
easu
res
an
emplo
yee
’sdeg
ree
ofopti
mis
mw
ith
resp
ect
toco
mpany
stock
.
Narr
ow
brack
etin
gQ
ues
tionnair
eM
easu
res
an
emplo
yee
’sdeg
ree
ofw
ealt
hin
tegra
tion.
Tim
ehori
zon
Ques
tionnair
eVari
able
whic
hta
kes
the
valu
e2
ifan
emplo
yee
has
alo
ng-r
un
per
spec
tive
conce
rnin
gth
efirm
’sst
ock
pri
cem
ovem
ents
(tw
o
yea
rsor
longer
);1
ifhe
has
am
ediu
m-r
un
per
spec
tive
(thre
em
onth
sup
toone
yea
r);0
ifhe
has
ash
ort
-run
per
spec
tive
(up
toone
month
).
Educa
tion
Ques
tionnair
eA
nem
plo
yee
’sed
uca
tion
level
(“tr
ain
eesh
ipin
busi
nes
s”(c
oded
1),
“univ
ersi
tydeg
ree”
(coded
2),
“P
hD
”(c
oded
3)
and
“none
ofth
eabove”
).
17
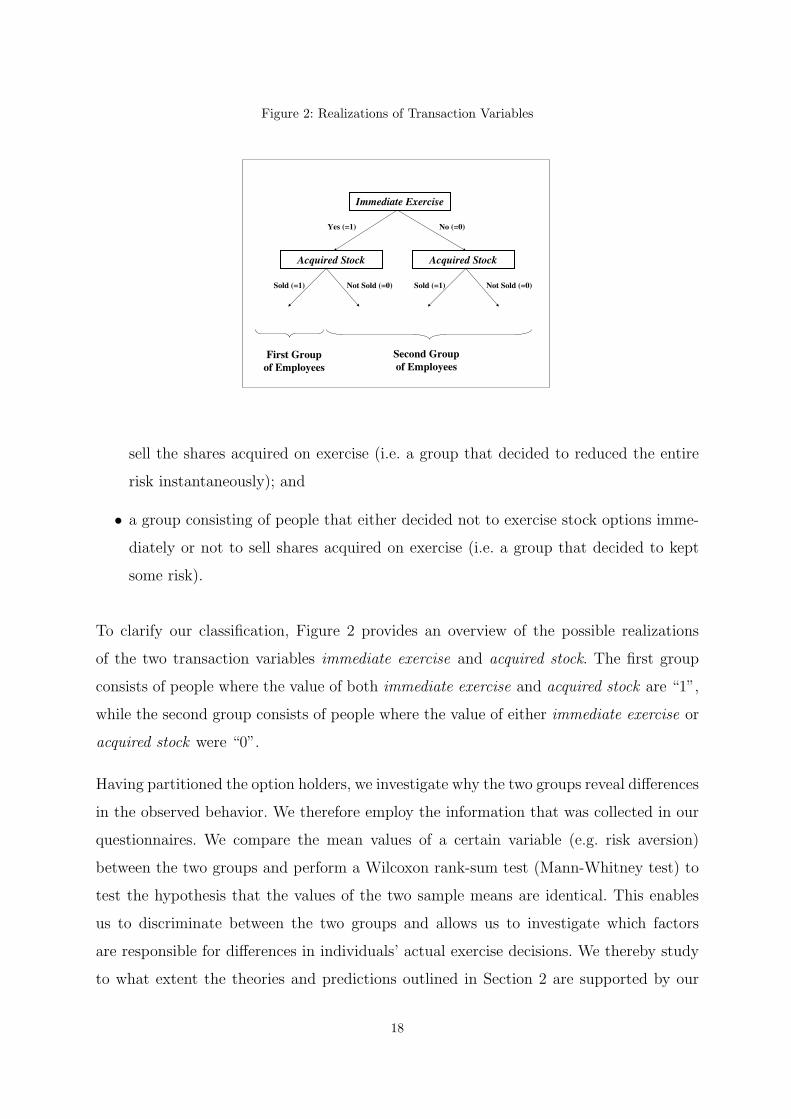
Figure 2: Realizations of Transaction Variables
Immediate Exercise
Acquired Stock Acquired Stock
Yes (=1) No (=0)
Sold (=1) Sold (=1)Not Sold (=0) Not Sold (=0)
Second Group
of Employees
First Group
of Employees
sell the shares acquired on exercise (i.e. a group that decided to reduced the entire
risk instantaneously); and
• a group consisting of people that either decided not to exercise stock options imme-
diately or not to sell shares acquired on exercise (i.e. a group that decided to kept
some risk).
To clarify our classification, Figure 2 provides an overview of the possible realizations
of the two transaction variables immediate exercise and acquired stock. The first group
consists of people where the value of both immediate exercise and acquired stock are “1”,
while the second group consists of people where the value of either immediate exercise or
acquired stock were “0”.
Having partitioned the option holders, we investigate why the two groups reveal differences
in the observed behavior. We therefore employ the information that was collected in our
questionnaires. We compare the mean values of a certain variable (e.g. risk aversion)
between the two groups and perform a Wilcoxon rank-sum test (Mann-Whitney test) to
test the hypothesis that the values of the two sample means are identical. This enables
us to discriminate between the two groups and allows us to investigate which factors
are responsible for differences in individuals’ actual exercise decisions. We thereby study
to what extent the theories and predictions outlined in Section 2 are supported by our
18
data. Because of the limited size of our sample, we do not perform multivariate analyses
like discriminant analysis or probit/logit regression models that require much stronger
distributional assumptions.
6 Empirical Results
6.1 Descriptive Results
6.1.1 Descriptive Results on Exercise and Stock Selling Behavior
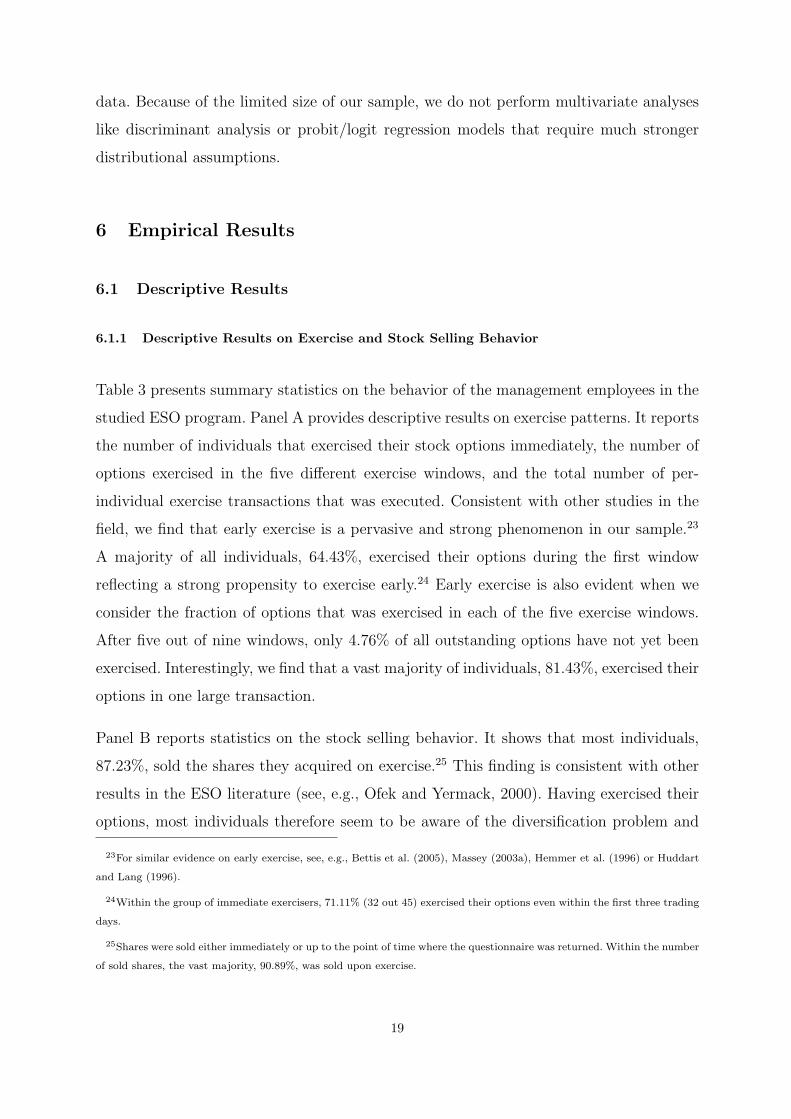
Table 3 presents summary statistics on the behavior of the management employees in the
studied ESO program. Panel A provides descriptive results on exercise patterns. It reports
the number of individuals that exercised their stock options immediately, the number of
options exercised in the five different exercise windows, and the total number of per-
individual exercise transactions that was executed. Consistent with other studies in the
field, we find that early exercise is a pervasive and strong phenomenon in our sample.23
A majority of all individuals, 64.43%, exercised their options during the first window
reflecting a strong propensity to exercise early.24 Early exercise is also evident when we
consider the fraction of options that was exercised in each of the five exercise windows.
After five out of nine windows, only 4.76% of all outstanding options have not yet been
exercised. Interestingly, we find that a vast majority of individuals, 81.43%, exercised their
options in one large transaction.
Panel B reports statistics on the stock selling behavior. It shows that most individuals,
87.23%, sold the shares they acquired on exercise.25 This finding is consistent with other
results in the ESO literature (see, e.g., Ofek and Yermack, 2000). Having exercised their
options, most individuals therefore seem to be aware of the diversification problem and
23For similar evidence on early exercise, see, e.g., Bettis et al. (2005), Massey (2003a), Hemmer et al. (1996) or Huddart
and Lang (1996).
24Within the group of immediate exercisers, 71.11% (32 out 45) exercised their options even within the first three trading
days.
25Shares were sold either immediately or up to the point of time where the questionnaire was returned. Within the number
of sold shares, the vast majority, 90.89%, was sold upon exercise.
19
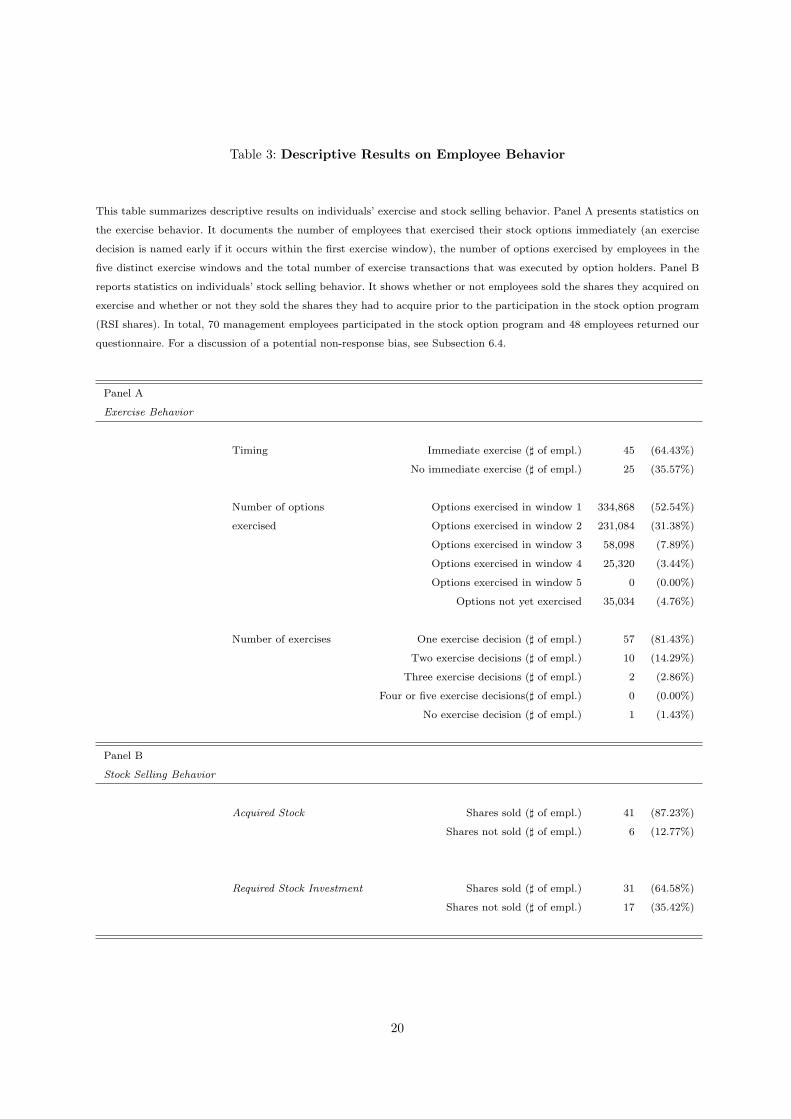
Table 3: Descriptive Results on Employee Behavior
This table summarizes descriptive results on individuals’ exercise and stock selling behavior. Panel A presents statistics on
the exercise behavior. It documents the number of employees that exercised their stock options immediately (an exercise
decision is named early if it occurs within the first exercise window), the number of options exercised by employees in the
five distinct exercise windows and the total number of exercise transactions that was executed by option holders. Panel B
reports statistics on individuals’ stock selling behavior. It shows whether or not employees sold the shares they acquired on
exercise and whether or not they sold the shares they had to acquire prior to the participation in the stock option program
(RSI shares). In total, 70 management employees participated in the stock option program and 48 employees returned our
questionnaire. For a discussion of a potential non-response bias, see Subsection 6.4.
Panel A
Exercise Behavior
Timing Immediate exercise (] of empl.) 45 (64.43%)
No immediate exercise (] of empl.) 25 (35.57%)
Number of options Options exercised in window 1 334,868 (52.54%)
exercised Options exercised in window 2 231,084 (31.38%)
Options exercised in window 3 58,098 (7.89%)
Options exercised in window 4 25,320 (3.44%)
Options exercised in window 5 0 (0.00%)
Options not yet exercised 35,034 (4.76%)
Number of exercises One exercise decision (] of empl.) 57 (81.43%)
Two exercise decisions (] of empl.) 10 (14.29%)
Three exercise decisions (] of empl.) 2 (2.86%)
Four or five exercise decisions(] of empl.) 0 (0.00%)
No exercise decision (] of empl.) 1 (1.43%)
Panel B
Stock Selling Behavior
Acquired Stock Shares sold (] of empl.) 41 (87.23%)
Shares not sold (] of empl.) 6 (12.77%)
Required Stock Investment Shares sold (] of empl.) 31 (64.58%)
Shares not sold (] of empl.) 17 (35.42%)
20
Table 4: Cross Tables of Transaction Variables
This table presents cross tables of the transaction variables immediate exercise, acquired stock and required stock investment.
Panel A
Acquired stock sold
No Yes Total
Immediate No 3 14 17
exercise Yes 3 27 30
Total 6 41 47
Panel B
Required stock investment sold
No Yes Total
Immediate No 7 11 18
exercise Yes 10 20 30
Total 17 31 48
Panel C
Required stock investment sold
No Yes Total
Acquired No 4 2 6
stock sold Yes 12 29 41
Total 16 31 47
rationally convert acquired shares into cash. To act consistently, individuals should also
sell the shares purchased for the required stock investment (RSI). However, Panel B shows
that a significantly smaller percentage of option recipients, 35.42%, also sold these shares
of company stock. A majority still ties a significant proportion of financial wealth to the
value of the firm by holding RSI shares.
The observation that employees tend to reduce their option holdings very early is re-
markable from an agency perspective. A major argument for the widespread use of stock
options are the incentive effects associated with them. If options are systematically exer-
cised for cash very early and at the beginning of the exercise period (as in our case), the
incentive effects disappear much earlier than probably expected by the issuing companies
(with the vesting period remaining the main incentive contracting mechanism).
Overall, our results document that most employees exercise a maximum number of options
in a few large transactions at the beginning of the exercise period. Individuals exercise for
21
cash and hereby reduce their exposure to company stock. However, our evidence suggests
that employees suffer from mental accounting and violate the fungibility principle: they
dispose differently over shares acquired on exercise and over shares bought for the RSI.
Equity from the first source is much more likely to be converted into cash than that of
the second one.
Table 4 provides cross tables of the three transaction variables immediate exercise, ac-
quired stock, and required stock investment. Panel A shows that, conditional on immediate
exercise, 90% of the option holders exercised for cash (27 out of 30). This finding sug-
gests that immediate exercisers are aware of their diversification problems and exercise to
diversify (or to satisfy liquidity needs). However, Panel C again shows the differences in
the disposition over acquired shares vis-a-vis RSI shares. According to economic theory,
individuals should consider shares of company stock, independent of the source, as perfect
substitutes. Our finding of a difference in the disposition over these shares might be due
to the fact that employees regard shares acquired on exercise and RSI shares separately,
and consider narrowly defined gains and losses for each source of equity. Prospect theory
provides a behavioral explanation for this kind of behavior (see Kahneman and Tversky,
1979). Shares acquired on exercise and shares of the required stock investment differ with
respect to their purchase prices: the strike price of an employee option was 3.00 Euro,
while the purchase price of a RSI share was approximately 15.00 Euro.26 At the end of
the closed period, the stock price exceeded 22.00 Euro and did not decline below 20.00
Euro from this date onwards. Virtually, both sources of company stock differed in their
purchase prices.27 If purchases prices of employees act as their reference points then the
disposition effect predicts that individuals sell shares acquired on exercise but not those
resulting from the RSI (as selling the earlier implies realizing a higher gain).28 Moreover,
it is well-known that individuals are more risk averse on stocks with larger gains compared
to those with smaller gains. This is due to the concavity of the value function and further
suggests that acquired shares rather than RSI shares are sold. Overall, these behavioral
26During the time period in which the company asked individuals to buy the required stock investment, the average stock
price was approximately 15.00 Euro.
27Note that from an economic point of view, funds from selling RSI shares are identical to those that result from selling
shares acquired on exercise. From a tax perspective, individuals should rather sell the RSI shares.
28See, e.g., Odean (1998) for the assumption that purchase prices are used as reference points.
22

arguments provide an explanation why a significant number of employees sold the shares
acquired on exercise but not those of the RSI. Supporting evidence for our interpretation
is provided by Grinblatt and Keloharju (2001) on trading decisions of individual and in-
stitutional investors in Finland. They empirically document that shares with larger past
return are more likely to be sold by investors.
An alternative explanations for our finding might be that RSI shares were considered as
an implicit contract to hold some minimum amount of stock. Also, the difference in the
holding periods of the respective shares might explain our finding. Shares from the RSI
were bought at least three years ago and individuals got accustomed to the fluctuations
in its value (compared to acquired shares which were purchased at the date of exercise).
RSI shares therefore more likely became part of an employee’s perceived “total wealth”,
leading to a reduction in the propensity to sell these assets quickly.
6.1.2 Descriptive Results on Questionnaire Data
Table 5 summarizes descriptive statistics on our questionnaire data. Apart from options,
all variables were calculated on the basis of the 48 returned questionnaires. The parameters
listed are means, medians, minimums, maximums, standard deviations, and the number
of observations of the each variable (Obs.).
The mean certainty equivalent for our presented lottery was a 25% increase in total wealth
(median = 25%, std. dev. = 16.42%), leading to a mean value of risk aversion equal to
0.55 (median = 0.50, std.dev. = 0.37). The average employee has invested 2.9% of his
total wealth in company stock (median = 1.75%, std.dev. = 3.04%), ranging from 0.25%
to 12.75%. As a fraction of his overall equity holdings, the average option holder has put
25.31% into company stock (not reported in Table 5).29 On average, managers received
10,520 options (median = 10,000, std.dev. = 11,435), and this number fluctuated between
1,000 and 50,000.30 The average individual has been working for the company for 17.76
29This figure is in line with the findings of other studies. Benartzi (2001), for example, documents that employees invested
20-30% of their discretionary funds in company stock.
30On average, individuals received 76.6% of the options they could obtain at maximum (median = 100%). Recall that non-
board members (board members) could obtain up to 10,000 (50,000) options, depending on personal financial constraints
to fulfill the RSI.
23
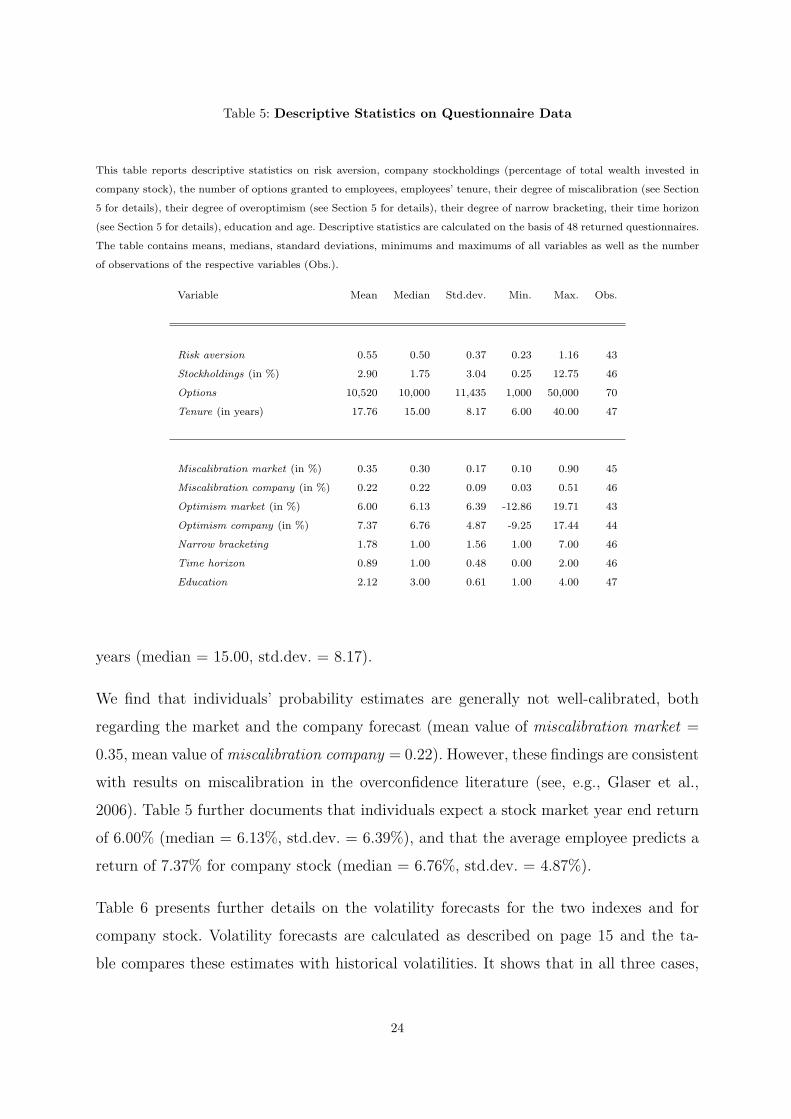
Table 5: Descriptive Statistics on Questionnaire Data
This table reports descriptive statistics on risk aversion, company stockholdings (percentage of total wealth invested in
company stock), the number of options granted to employees, employees’ tenure, their degree of miscalibration (see Section
5 for details), their degree of overoptimism (see Section 5 for details), their degree of narrow bracketing, their time horizon
(see Section 5 for details), education and age. Descriptive statistics are calculated on the basis of 48 returned questionnaires.
The table contains means, medians, standard deviations, minimums and maximums of all variables as well as the number
of observations of the respective variables (Obs.).
Variable Mean Median Std.dev. Min. Max. Obs.
Risk aversion 0.55 0.50 0.37 0.23 1.16 43
Stockholdings (in %) 2.90 1.75 3.04 0.25 12.75 46
Options 10,520 10,000 11,435 1,000 50,000 70
Tenure (in years) 17.76 15.00 8.17 6.00 40.00 47
Miscalibration market (in %) 0.35 0.30 0.17 0.10 0.90 45
Miscalibration company (in %) 0.22 0.22 0.09 0.03 0.51 46
Optimism market (in %) 6.00 6.13 6.39 -12.86 19.71 43
Optimism company (in %) 7.37 6.76 4.87 -9.25 17.44 44
Narrow bracketing 1.78 1.00 1.56 1.00 7.00 46
Time horizon 0.89 1.00 0.48 0.00 2.00 46
Education 2.12 3.00 0.61 1.00 4.00 47
years (median = 15.00, std.dev. = 8.17).
We find that individuals’ probability estimates are generally not well-calibrated, both
regarding the market and the company forecast (mean value of miscalibration market =
0.35, mean value of miscalibration company = 0.22). However, these findings are consistent
with results on miscalibration in the overconfidence literature (see, e.g., Glaser et al.,
2006). Table 5 further documents that individuals expect a stock market year end return
of 6.00% (median = 6.13%, std.dev. = 6.39%), and that the average employee predicts a
return of 7.37% for company stock (median = 6.76%, std.dev. = 4.87%).
Table 6 presents further details on the volatility forecasts for the two indexes and for
company stock. Volatility forecasts are calculated as described on page 15 and the ta-
ble compares these estimates with historical volatilities. It shows that in all three cases,
24
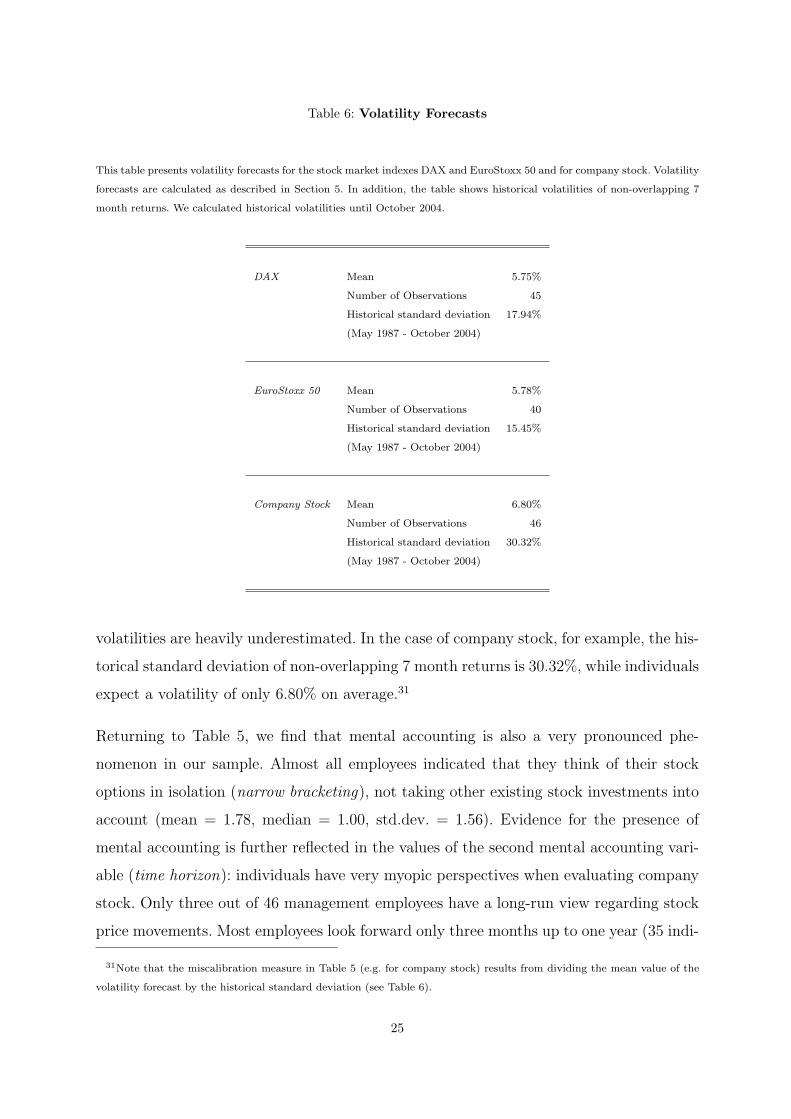
Table 6: Volatility Forecasts
This table presents volatility forecasts for the stock market indexes DAX and EuroStoxx 50 and for company stock. Volatility
forecasts are calculated as described in Section 5. In addition, the table shows historical volatilities of non-overlapping 7
month returns. We calculated historical volatilities until October 2004.
DAX Mean 5.75%
Number of Observations 45
Historical standard deviation 17.94%
(May 1987 - October 2004)
EuroStoxx 50 Mean 5.78%
Number of Observations 40
Historical standard deviation 15.45%
(May 1987 - October 2004)
Company Stock Mean 6.80%
Number of Observations 46
Historical standard deviation 30.32%
(May 1987 - October 2004)
volatilities are heavily underestimated. In the case of company stock, for example, the his-
torical standard deviation of non-overlapping 7 month returns is 30.32%, while individuals
expect a volatility of only 6.80% on average.31
Returning to Table 5, we find that mental accounting is also a very pronounced phe-
nomenon in our sample. Almost all employees indicated that they think of their stock
options in isolation (narrow bracketing), not taking other existing stock investments into
account (mean = 1.78, median = 1.00, std.dev. = 1.56). Evidence for the presence of
mental accounting is further reflected in the values of the second mental accounting vari-
able (time horizon): individuals have very myopic perspectives when evaluating company
stock. Only three out of 46 management employees have a long-run view regarding stock
price movements. Most employees look forward only three months up to one year (35 indi-
31Note that the miscalibration measure in Table 5 (e.g. for company stock) results from dividing the mean value of the
volatility forecast by the historical standard deviation (see Table 6).
25
viduals) or even less then three months (8 individuals). Given recent public discussions on
short-termist behavior of corporate officers, this finding is particularly striking. Finally,
the education levels of the responding individuals look as follows: four employees have
a traineeship in business, 35 hold a masters degree, six a PhD, and two have any other
degrees.
Correlations for the variables gathered by our questionnaire can be found in the Appendix
(Table 9).
6.2 Between Group Differences in Individuals’ Exercise Behavior
This subsection investigates to what extent variables like risk aversion, company stock-
holdings, miscalibration or mental accounting can explain the differences in the observed
exercise behavior across the individuals in our data set.
Table 7 compares individual variables for the group of employees that immediately exer-
cised their ESOs with those from the group that did not exercise immediately (or that
did not sell acquired shares). For each of the two groups, the table contains means and
medians of the respective variables as well as the number of observations used in calcu-
lating each variable (Obs.). The last column presents p-values of a two-sample Wilcoxon
rank-sum test (Mann-Whitney test) comparing the respective median values. The null
hypothesis is that the two groups are from populations with the same medians.
Rational valuation models like those by Lambert et al. (1991) or Hall and Murphy (2000,
2002) predict that the group of instantaneous exercisers should exhibit a higher degree of
risk aversion (i.e. a higher value of α) and larger holdings of company stock (i.e. a larger
fraction of wealth invested in company stock). These general models should also apply to
our data. But surprisingly, we find that the latter group neither shows a significantly higher
degree of risk aversion (median value of 0.50 vs. 0.50; p-value = 0.4208) nor significantly
larger holdings of company stock (median value of 2.25% vs. 1.25%; p-value = 0.5933).
These results are puzzling from a standard ESO valuation point of view. Moreover, they
suggest that individual behavior in our data might be driven by factors not included in
26
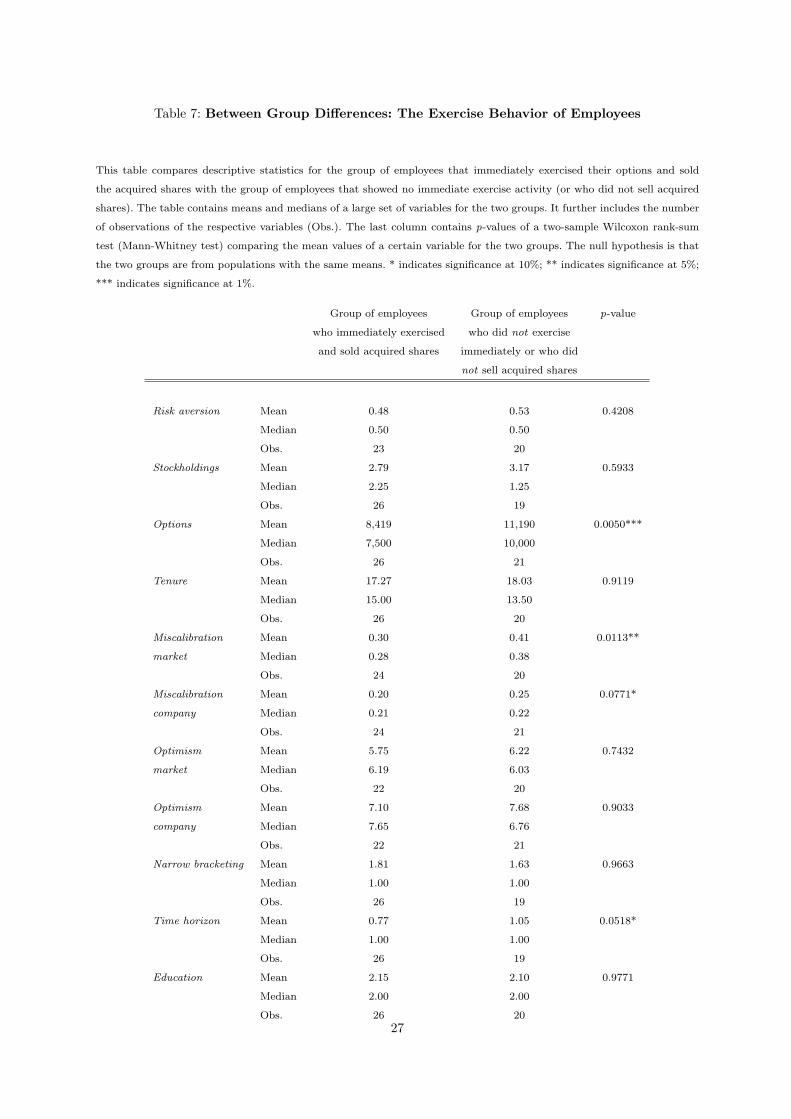
Table 7: Between Group Differences: The Exercise Behavior of Employees
This table compares descriptive statistics for the group of employees that immediately exercised their options and sold
the acquired shares with the group of employees that showed no immediate exercise activity (or who did not sell acquired
shares). The table contains means and medians of a large set of variables for the two groups. It further includes the number
of observations of the respective variables (Obs.). The last column contains p-values of a two-sample Wilcoxon rank-sum
test (Mann-Whitney test) comparing the mean values of a certain variable for the two groups. The null hypothesis is that
the two groups are from populations with the same means. * indicates significance at 10%; ** indicates significance at 5%;
*** indicates significance at 1%.
Group of employees Group of employees p-value
who immediately exercised who did not exercise
and sold acquired shares immediately or who did
not sell acquired shares
Risk aversion Mean 0.48 0.53 0.4208
Median 0.50 0.50
Obs. 23 20
Stockholdings Mean 2.79 3.17 0.5933
Median 2.25 1.25
Obs. 26 19
Options Mean 8,419 11,190 0.0050***
Median 7,500 10,000
Obs. 26 21
Tenure Mean 17.27 18.03 0.9119
Median 15.00 13.50
Obs. 26 20
Miscalibration Mean 0.30 0.41 0.0113**
market Median 0.28 0.38
Obs. 24 20
Miscalibration Mean 0.20 0.25 0.0771*
company Median 0.21 0.22
Obs. 24 21
Optimism Mean 5.75 6.22 0.7432
market Median 6.19 6.03
Obs. 22 20
Optimism Mean 7.10 7.68 0.9033
company Median 7.65 6.76
Obs. 22 21
Narrow bracketing Mean 1.81 1.63 0.9663
Median 1.00 1.00
Obs. 26 19
Time horizon Mean 0.77 1.05 0.0518*
Median 1.00 1.00
Obs. 26 19
Education Mean 2.15 2.10 0.9771
Median 2.00 2.00
Obs. 26 20
27
rational models of exercise.32
We argued that the amount of options granted to an employee can be considered as a proxy
for labor income and wealth (see Section 5). Lambert et al. (1991) model a manager’s
absolute risk aversion as a decreasing function of wealth, and they thereby show that
option values are strictly increasing in wealth. Following this prediction, we expected that
wealthier employees exercise their ESOs at later points in time compared to less rich
ones. Consistent with this hypothesis, we find that the average number of granted options
is significantly lower for the group of individuals that exercised their ESOs immediately
compared to the second group (median value of 7,500 options vs. 10,000 options). The
hypothesis that the two values are the same can be rejected at the 1%-level (p-value =
0.0050), providing support for the argument of Lambert et al. (1991).
We further used tenure as a measure for the firm-specificity of human capital. In general,
we hypothesized that rational employees with more firm-specific human capital (i.e. with
a longer job tenure) exercise their options earlier to reduce the risk exposure that is related
to the value of the firm. Our data, however, contradicts this conjecture: we do not find
that immediate exercisers show a significantly longer job tenure (median value of 15.00
years vs. 13.50 years; p-value = 0.9119).
To test if and how psychological factors are responsible for the differences in the observed
exercise behavior in our data set, we investigate to what extent the two groups reveal
variation in their degrees of miscalibration, optimism, and mental accounting.
Interestingly, we find that the group of immediate exercisers is significantly more miscal-
ibrated compared to the second group. Our findings seem to be robust as both measures
of miscalibration show significant between-group differences.33 This finding surprised us
since traditional theories have not yet incorporated judgement biases like overconfidence
(defined as individuals’ degree of miscalibration) in ESO valuation models.34 We argued
32Alternatively, we might not have measured risk aversion and diversification appropriately.
33Moreover, the correlation between both miscalibration measures and our proxy for wealth is -0.03 and highly insignifi-
cant, so we can exclude the possibility that wealth is the driving causal factor behind our miscalibration results.
34Malmendier and Tate (2005) use ESO exercises as a proxy for overconfidence within a behavioral corporate finance
model. Different to our aspect of overconfidence (miscalibration), they consider overconfidence as the belief of managers
to possess the ability to keep the companies’ stock prices rising. They predict that overconfident managers exercise their
28
that the subjectively perceived stock price volatility has two opposite effects on option
values: on the one hand, it increases value as it lowers the firm-specific risk employees
are exposed to. But on the other, hand perceived volatility also decreases value because
of the convexity in a stock option’s payoff. Depending on the magnitude of the two ef-
fects, miscalibration can therefore result in an underestimation of the time value imbed-
ded in options. Consistent with this argumentation, Henderson (2002) provides evidence
showing that when volatilities are underestimated, option values do decrease leading to
earlier exercise decision.35 Our evidence therefore suggests that miscalibration causes a
downward-biased estimate of the time value imbedded in options. Our results show that
individuals who systematically underestimate volatilities seem to put a too small value
on options and exercise earlier compared to less miscalibrated individuals.36 This result
suggests that overconfidence, modelled as miscalibration, might provide a promising basis
for the modelling of exercise decisions.
Abstracting from exercise motives like diversification or liquidity needs, one should expect
that exercise decisions are also based on personal stock market forecasts (optimism). We
argued in Section 2 that option holders who are overoptimistic about the movements in
company stock will place higher values on their options and should therefore exercise less
early. However, we are not able to confirm this argument empirically. Our results show
that the group of immediate exercisers is neither significantly less optimistic about the
stock market as a whole nor about company stock itself.
Based on experimental evidence, we further predicted that mental accounting, proxied
by narrow bracketing and time horizon, also significantly affects ESO exercises. Massey
(2003b) argued that the more narrowly an individual brackets his options, the lower he
typically values it. Applying this argument to option exercises, we predicted that the less
options later compared to a rational benchmark.
35Note that we assume that an individual’s degree of miscalibration is constant over time. Experimental studies on
miscalibration find evidence on this kind of stability over time (see Jonsson and Allwood, 2003 or Glaser et al., 2004)
36Further support for our argumentation comes form the finding that both miscalibration measures are positively cor-
related with the fraction of options that individuals effectively obtained (Rho = 0.4606 for miscalibration company and
Rho = 0.3515 for miscalibration market ; with both correlation coefficients being significant at the 5%-level). These results
shows that more miscalibrated individuals asked for a smaller percentage of options relative to what they were offered by
the company. Abstracting from financial constraints, these figures again indicate that more miscalibrated individuals seem
to underestimate the value of stock options more heavily.
29
an individual integrates an ESO into his wealth, the earlier he will exercise it. Inconsistent
with this conjecture, we find no significant difference in the values of narrow bracketing
between the two group of employees. However, the second aspect of mental accounting
seems to be more promising: we find that immediate exercisers have significantly shorter
perspectives with respect to price changes of company stock (mean value of 0.77 vs.
1.05). This finding confirms our prediction that myopia causes individuals to exercise
their options earlier. This evidence is also in line with the arguments in Benartzi and
Thaler (1999) who document that myopia can lead to more risk averse decision making.
The main results of this subsection can be summarized as follows. Inconsistent with tra-
ditional ESO theories, we cannot detect that immediate exercise behavior in our data is
driven by risk aversion and diversification needs (company stockholdings). Instead, our re-
sults suggest that exercise decisions are related to the psychological factors miscalibration
and mental accounting (temporal narrow bracketing).
6.3 Why Did Employees Exercise So Early?
Having studied the impact of individual characteristics on exercise decisions, there still
remains the open question of why so many employees decided to exercise their options
immediately after the vesting period. We believe that loss aversion is a major aspect that
can possibly explain this behavior (even though we have no data on it). Individuals re-
ceived their ESO in July/August 2000, i.e. almost three years before the options actually
became exercisable. All stock options already had considerable intrinsic value at the be-
ginning of the vesting period and employees certainly perceived this value. Given that all
options were granted on the top of existing salaries, it is likely that employees regarded
these granted ESOs as a “gift” and considered the value of this “gift” as a reference point
for future evaluation. Having the pervasiveness of mental accounting among the surveyed
individuals in mind, it is also very likely that they have put their stock options into a
separate mental account (e.g. for consumption after the vesting period). After the vesting
period, individuals had to decide whether to consume this amount of money by exercising
or whether to hold the option for another time period. Holding the option is thereby
equivalent to taking part in a lottery that has, say, a 50/50 chance of losing/winning a
certain amount. The value of an individual’s option package at the vesting date herby
30

very likely served as a reference point. Overwhelming empirical and experimental evi-
dence shows that humans are much more averse to losses than to same-sized gains in such
situations (see, e.g. Kahneman and Tversky, 1979). Tversky and Kahneman (1991), for
example, show that individuals value losses almost twice as much as gains of equal size.
For a loss averse individual to take part in such a bet, a very high gain relative to the
loss would consequently be required. Otherwise, he will immediately exercise his option
package to avoid the participation in the lottery (which is consistent with our data). Loss
aversion and narrow bracketing might therefore explain our finding that a huge number
of options was exercised immediately after the vesting period.
6.4 Robustness Checks
The first part of this subsection is concerned with a possible non-response bias in our
data sets. 22 out of 70 managers did not return our questionnaire. To investigate whether
this subgroup of individuals shows systematic differences in its behavior, we compare the
exercise activity of the responding subgroup with that of the non-responding one. In total,
35.64% of all granted options were given to the 22 non-respondents. Table 8 compares the
distribution of exercises over the five past exercise windows for the 22 non-respondents
with those of the 48 respondents. It documents that the group of non-respondents shows
exercise patterns that are very similar to those of the responding group: exercise activity
is also clustered in the first window and very few ESOs were exercised in the windows
3 to 5. Based on our available information, we therefore have no indication that the
exercise behavior of the responding individuals systematically differs from that of the
non-responding ones.
Rational individuals might also exercise their ESOs because of tax considerations or to
satisfy liquidity needs. To account for the possibility that observed exercise patterns were
actually driven by tax motivations, we asked individuals to indicate to what extend the
following statement provides a good description of their personal tax considerations: “Tax
considerations play an important role with respect to my exercise decisions within an
employee stock option program”.37 The mean answer to this question was 2.00 (median =
37Answers were measured on a seven-point scale ranging from 1 (“I totally disagree”) to 7 (“I totally agree”).
31
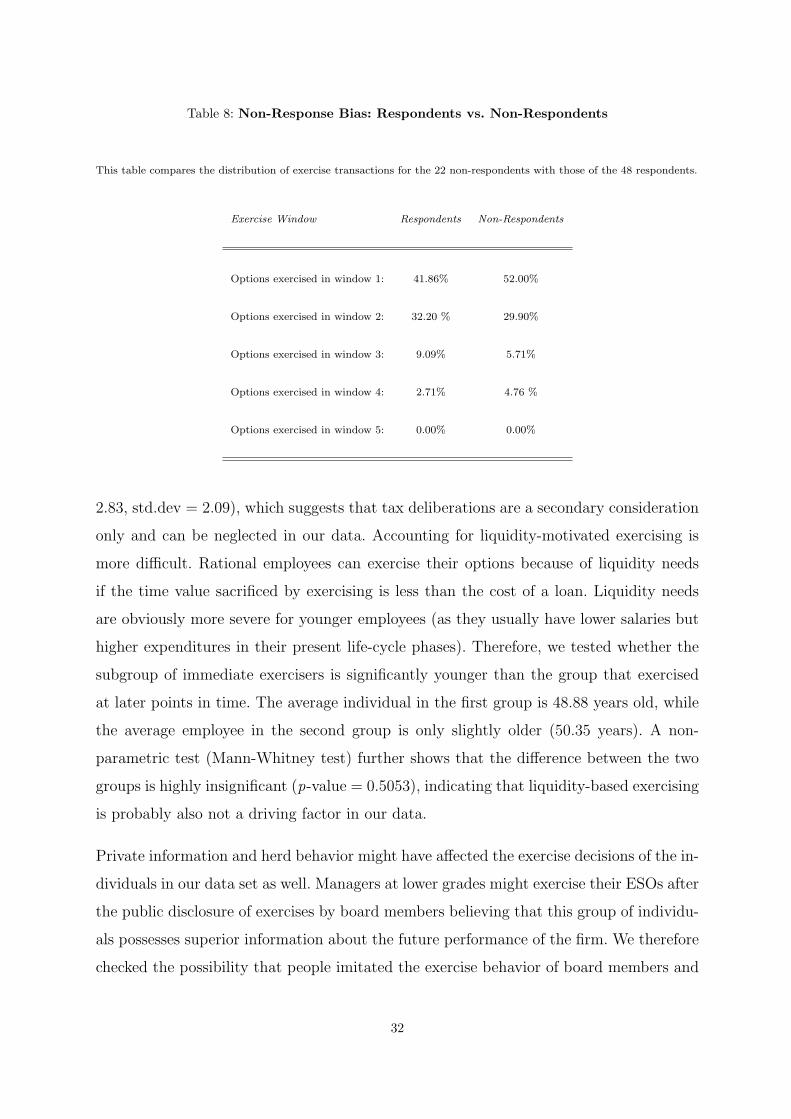
Table 8: Non-Response Bias: Respondents vs. Non-Respondents
This table compares the distribution of exercise transactions for the 22 non-respondents with those of the 48 respondents.
Exercise Window Respondents Non-Respondents
Options exercised in window 1: 41.86% 52.00%
Options exercised in window 2: 32.20 % 29.90%
Options exercised in window 3: 9.09% 5.71%
Options exercised in window 4: 2.71% 4.76 %
Options exercised in window 5: 0.00% 0.00%
2.83, std.dev = 2.09), which suggests that tax deliberations are a secondary consideration
only and can be neglected in our data. Accounting for liquidity-motivated exercising is
more difficult. Rational employees can exercise their options because of liquidity needs
if the time value sacrificed by exercising is less than the cost of a loan. Liquidity needs
are obviously more severe for younger employees (as they usually have lower salaries but
higher expenditures in their present life-cycle phases). Therefore, we tested whether the
subgroup of immediate exercisers is significantly younger than the group that exercised
at later points in time. The average individual in the first group is 48.88 years old, while
the average employee in the second group is only slightly older (50.35 years). A non-
parametric test (Mann-Whitney test) further shows that the difference between the two
groups is highly insignificant (p-value = 0.5053), indicating that liquidity-based exercising
is probably also not a driving factor in our data.
Private information and herd behavior might have affected the exercise decisions of the in-
dividuals in our data set as well. Managers at lower grades might exercise their ESOs after
the public disclosure of exercises by board members believing that this group of individu-
als possesses superior information about the future performance of the firm. We therefore
checked the possibility that people imitated the exercise behavior of board members and
32
asked each individual to what extent his exercises were influenced by the decisions of board
members.38 The average answer to this question was 1.95 (median = 1.00, std.dev. = 1.64)
which suggests that imitations of board member exercises were of minor importance only.
7 Conclusion
Using a unique data set, we studied the exercise and stock selling decisions of individuals
within a particular stock option plan, and tried to provide a contribution towards a deeper
understanding of how individuals behave in these programs. Our data set is much more
comprehensive and detailed then previous ones, but our study is limited in that it is
essentially a case study. Nevertheless, it provides an interesting opportunity to study the
following questions: How do employees exercise their stock options? How do employees
dispose of shares acquired in stock option programs? What rational and behavioral factors
explain differences in the observed employee behavior?
Our findings show that individuals exercise their stock options very early and in a few large
transactions. A large majority of option recipients sell the shares acquired on exercise.
From an agency perspective, this finding documents that the incentive effects that are
usually associated with stock options disappear much earlier than (probably) expected
by the program initiating company. A precise ex-ante estimation of this sort of exercise
pattern could have significantly reduced the accounting costs of the granted options to
the issuing firm. Furthermore, our results suggest that, inconsistent with standard ESO
models like those of Lambert et al. (1991) or Hall and Murphy (2000, 2002), exercise
activity in our data set is not driven by factors like risk aversion or company stockholdings
that are included in these rational models of exercise. Instead, we show that exercise
decisions depend on the psychological factors miscalibration and mental accounting. These
findings suggest that the cost estimation for ESO plans might need to take psychological
factors into account. Our findings supplement the study by Heath et al. (1999) which also
documents that psychological factors can affect peoples’ exercise decisions. Based on loss
aversion, we provided an argument for our finding that a significant number of options
38More precisely, we presented the following pre-formulated question: “The information that board members have exercised
stock options has an influence on the timing of my exercise decision”. Answers again ranged from 1 (“I totally disagree”)
to 7 (“I totally agree”).
33

were exercised immediately after the vesting period. Our findings on behavior that is
inconsistent with the predictions of rational decision making models is remarkable from
an economic perspective given that the individuals in our data set are top managers and
important decision makers in one of the largest German corporations. It is therefore likely
that these individuals are also prone to psychological biases when dealing with important
corporate decisions (like investment and financing decisions).
34
References
Barberis, Nicolas, and Richard Thaler, 2003, A survey of behavioral finance, in G. Costan-
tinidis, M. Harris, and R. Stulz, ed.: Handbook of the Economics of Finance. pp. 1051–
1121 (Elsevier Science B. V.).
Becker, Garry S., 1964, Human Capital: A theoretical and empirical analysis, with special
reference to education (Columbia University Press: New York).
Benartzi, Shlomo, 2001, Excessive extrapolation and the allocation of 401(k) accounts to
company stock, Journal of Finance 56, 1747–1764.
, and Richard Thaler, 1999, Risk aversion or myopia? Choices in repeated gambles
and retirement investments, Management Science 45, 364–381.
Bergman, Nittai, and Dirk Jenter, 2005, Employee sentiment and stock option compen-
sation, Working Paper, MIT Sloan School of Management.
Bettis, J. Carr, John M. Bizjak, and Michael L. Lemmon, 2005, Exercise behavior, valua-
tion, and the incentive effects of employee stock options, Journal of Financial Economics
76, 445–470.
Biais, Bruno, Denis Hilton, Karine Mazurier, and Sebastian Pouget, 2005, Judgmen-
tal overconfidence, self-monitoring and trapping performance in experimental financial
markets, Review of Economic Studies 72, 287–312.
Black, Fischer, and Myron Scholes, 1973, The pricing of options and corporate liabilities,
Journal of Political Economy 81, 637–659.
Carpenter, Jennifer N., 1998, The exercise and valuation of executive stock options, Jour-
nal of Financial Economics 48, 127–158.
Core, John E., and Wayne Guay, 2001, Stock option plans for non-executive employees,
Journal of Financial Economics 61, 253–287.
Degeorge, Francois, Dirk Jenter, Albert Moel, and Peter Tufano, 2004, Selling company
shares to reluctant employees: France Telecom’s experience, Journal of Financial Eco-
nomics 71, 169–202.
35
Gervais, Simon, J. B. Heaton, and Terrance Odean, 2003, Overconfidence, investment
policy, and executive stock options, Working Paper, Duke University and Haas School
of Business.
Glaser, Markus, Thomas Langer, and Martin Weber, 2006, Overconfidence of profession-
als and lay men: Individual differences within and between tasks?, Working Paper,
University of Mannheim.
Glaser, Markus, Markus Noth, and Martin Weber, 2004, Behavioral finance, in Derek J.
Koehler, and Nigel Harvey, ed.: Blackwell Handbook of Judgment and Decision Making.
pp. 527–546 (Blackwell Publishing).
Glaser, Markus, and Martin Weber, 2005, September 11 and stock return forecasts of
individual investors, Review of Finance 9, 243–279.
, 2006, Overconfidence and trading volume, Working Paper, University of
Mannheim.
Graham, John R., and Campbell R. Harvey, 2002, Expectations of equity risk premia,
volatility, and asymmetry, Working Paper, Duke University.
Grinblatt, Mark, and Matti Keloharju, 2001, What makes investors trade?, Journal of
Finance 56, 589–616.
Hall, Brian J., and Kevin J. Murphy, 2000, Optimal exercise prices for executive stock
options, American Economic Review 90, 209–214.
, 2002, Stock options for undiversified executives, Journal of Accounting and Eco-
nomics 33, 3–42.
, 2003, The trouble with stock options, Journal of Economic Perspectives 17,
49–70.
Heath, Chip, Steven Huddart, and Mark Lang, 1999, Psychological factors and stock
option exercise, Quarterly Journal of Economics 114, 601–628.
Henderson, Vickey, 2002, Stock based compensation: Firm-specific risk, efficiency and
incentives, Working Paper, University of Oxford.
Huddart, Steven, 1994, Employee stock options, Journal of Accounting and Economics
18, 207–213.
36
, and Mark Lang, 1996, Employee stock option exercise: An empirical analysis,
Journal of Accounting and Economics 21, 5–43.
Hull, John, and Alan White, 2004, How to value employee stock options, Financial Ana-
lysts Journal 60, 114–119.
Jonsson, Anna-Carin, and Carl Martin Allwood, 2003, Stability and variability in the
realism of confidence judgments over time, content domain, and gender, Personality
and Individual Differences 107, 559–574.
Kahneman, Daniel, and Dan Lovallo, 1993, Timid choices and bold forecasts: A cognitive
perspective on risk taking, Management Science 39, 17–31.
Kahneman, Daniel, and Amos Tversky, 1979, Prospect theory: An analysis of decision
under risk, Econometrica 47, 263–291.
Keefer, Donald D., and Samuel E. Bodily, 1983, Three-point approximation for continuous
random variables, Management Science 29, 595–609.
Kidd, John B., 1970, The utilization of subjective probabilities in production planning,
Acta Psychologica 34, 338–347.
Klayman, Joshua, Jack B. Soll, Claudia Gonzales-Vallejo, and Sema Barlas, 1999, Over-
confidence: It depends on how, what, and whom you ask, Organizational Behavior and
Human Decision Processes 79, 216–247.
Lambert, Richard A., David F. Larcker, and Robert E. Verrecchia, 1991, Portfolio consid-
erations in valuing executive compensation, Journal of Accounting Research 29, 129–
149.
Larwood, Laurie, and William Whittaker, 1977, Managerial myopia: Self serving biases
in organizational planning, Journal of Applied Psychology 62, 94–198.
Malmendier, Ulrike, and Geoffrey Tate, 2005, CEO overconfidence and corporate invest-
ment, Journal of Finance.
Marquardt, Carol A., 2002, The cost of employee stock option grants: An empirical anal-
ysis, Journal of Accounting Research 40, 1191–1217.
Massey, Cade, 2003a, When and why employees exercise stock options, Working Paper,
Duke University.
37
, 2003b, How employees value stock options, Working Paper, Duke University.
May, Don O., 1995, Do managerial motives influence firm risk reduction strategies, Journal
of Finance 50, 1291–1308.
Meulbroek, Lisa K., 2001, The efficiency of equity-linked compensation: Understanding
the full cost of awarding executive stock options, Financial Management 30, 5–44.
Moore, P. G., 1977, The manager’s struggle with uncertainty, Journal of The Royal Sta-
tistical Society Series A 149, 129–165.
Odean, Terrance, 1998, Are investors reluctant to realize their losses?, Journal of Finance
53, 1775–1798.
Ofek, Eli, and David Yermack, 2000, Taking stock: Equity based compensation and the
evolution of managerial ownership, Journal of Finance 55, 1367–1384.
Oyer, Paul, and Scott Schaefer, 2005, Why do some firms give stock options to all em-
ployees?: An empirical anaylsis of alternative theories, Journal of Financial Economics
76, 99–133.
Rabin, Matthew, 1998, Psychology and economics, Journal of Economic Literature 36,
11–46.
Soll, Jack B., and Joshua Klayman, 2004, Overconfidence in interval estimates, Journal
of Experimental Psychology: Learning, Memory, and Cognition 30, 299–314.
Thaler, Richard H., 1980, Towards a positive theory of consumer choice, Journal of Eco-
nomic Behavior and Organization 1, 39–60.
, 1999, Mental accounting matters, Journal of Behavioral Decision Making 12,
183–206.
Tversky, Amos, and Daniel Kahneman, 1991, Loss aversion in riskless choice: A reference-
dependent model, Quarterly Journal of Economics 4, 1039–1063.
, 1992, Advances in prospect-theory - Cumulative representation of uncertainty,
Journal of Risk and Uncertainty 5, 297–323.
Weinstein, Neil D., 1980, Unrealistic optimism about future life events, Journal of Per-
sonality and Social Psychology 39, 806–820.
38
APPENDIX
Questionnaire General Questions In the next questions, we are interested in the importance of stocks within your private investment portfolio. What percentage of your total wealth (including savings, shares, mutual funds, bonds, life insurance, home equity etc.) is approximately invested in stocks and mutual funds including stocks? (please mark)
O 0 % O 1 – 10 % O 10 – 20 % O 20 – 30 % O 30 – 40 % O 40 – 50 %
O 50 – 60 % O 60 – 70 % O 70 – 80 % O 80 - 90 % O 90 – 100 % O I do not know What percentage of your total wealth invested in stocks is currently invested in [Company] stocks (including stocks you received via the Employee Stock Option Program, stocks you still hold from the required initial stock investment of the Employee Stock Option Program 2000 (the so called “Eigeninvestment”), employee stocks etc.)? (please mark)
O 0 % O 1 – 10 % O 10 – 20 % O 20 – 30 % O 30 – 40 % O 40 – 50 %
O 50 – 60 % O 60 – 70 % O 70 – 80 % O 80 - 90 % O 90 – 100 % O I do not know In the next questions, we would like you to make three statements concerning your forecasts of future index levels/market prices: a lower bound, a best estimate, and an upper bound. The statements should be made such that the correct index level/market price (for instance in the first question, the true value of the Deutsche Aktienindex DAX at the end of 2004) should... … with a high probability (95%) not fall short of the Lower Bound (i.e. with 95% probability, it should be above your lower bound) … should equally likely be above respectively below the Estimate (i.e. with a probability of 50% it should not be below your Estimate and respectively with a probability of 50% it should not be above your Estimate) … with a high probability (95%) not exceed the Upper Bound (i.e. with 95% probability, it should be below your Upper Bound)
Lower Bound
Estimate
Upper Bound
Value of the DAX (Deutscher Aktienindex) at the end of the year 2004 (10.06.2004: 4.021,64)
Value of the EURO-STOXX 50 at the end of the year 2004 (10.06.2004: 2.800,18)
Stock price of the [Company] stock at the end of the year 2004 (10.0.2004: X€)
1
Moreover, we are intersted in the relevance of tax considerations for your personal exercise behavior: “Tax considerations play an important role with respect to my exercise decisions within an employee stock option program” (please mark)
1 I strongly disagree
2 3 4 5 6 7 I strongly
agree O O O O O O O
In the next questions, we are interested to what extent the following factors influence your exercise behavior.
“My activity within the employee stock option program is part of my overall investment strategy. Therefore, I try to make my private stock investments in a way that takes my positions in employee stock options into account” (please mark)
1 I strongly disagree
2 3 4 5 6 7 I strongly
agree O O O O O O O
“The information that board members (“Vorstand”) have exercised stock options has an influence on the timing of my exercise decision”
1 I strongly disagree
2 3 4 5 6 7 I strongly
agree O O O O O O O
In the subsequent questions, we are interested in how far you look into the future if you make stock price estimates for the stock price of [Company] If you consider your stock options and possible future stock price of [Company], how far do you look ahead? O less than one week O one week O one month O three months
O 6 months O 1 year O 2 years O more than 2 years Some Questions about what happened with your [Company] Stocks If you have already exercised some or all of your stock options, the hereby acquired stocks might have been sold either by yourself or via the block trade procedure immediately after your exercise decision. In the subsequent questions, we are interested in what you did with the stocks that you received by exercising your stock options. If you have exercised your options in two exercise windows, please use the subsequent subsections a) AND b). If you have exercised your options only once, please use subsection a) only
a) After your first exercise decision I have immediately sold the acquired stocks via the block trade procedure
Yes ONo O
2

If “No”, i.e. if you did not participate in the block trade procedure, what have you done with the acquired stocks? (Please mark) I have not sold these stocks yet
O
I sold these stocks immediately
O
I sold these stocks at different points in time (in this case, please state the approximate date and the approximate number of stocks you sold on this date)
O
Approximate date:
Approximate number of stocks sold:
b) After your second exercise decision (ONLY if you exercised in two exercise windows)
I have immediately sold the acquired stocks via the block trade procedure
Yes ONo O
If “No”, i.e. if you did not participate in the block trade procedure, what have you done with the acquired stocks? (Please mark) I have not sold these stocks yet
O
I sold these stocks immediately
O
I sold these stocks at different points in time (in this case, please state the approximate date and the approximate number of stocks you sold on this date)
O
Approximate date:
Approximate number of stocks sold:
Within the Employee Stock Option Program 2000, [Company] asked you to purchase a certain number of [Company] stock (the so-called “Eigeninvestment”). In the following questions, we are interested in what you did with these stocks after their unblocking.
I have not sold these stocks yet
O
I sold all these stocks immediately after their unblocking (for example via the block trade procedure)
O
I have sold these stocks at different points in time (in this case, please name the approximate date and the approximate number of stocks you sold at that date)
O
Approximate date:
Approximate number of stocks sold:
3
Some Questions About your Attitude towards Risk In the following question, you have to choose between two alternatives: a) the participation in a lottery or b) a guaranteed change in wealth Consider your total wealth (including your savings, your investments, your home equity, etc.). Think of your best estimate of your total wealth.
Now consider the following lottery:
50%
50%No change in your total wealth (hence +/- 0%)
Doubling of your total wealth (hence + 100%)
Lottery
with 50% probability your total wealth will double (+100%) and with 50% probability your total wealth will remain the same (hence +/- 0%)
Alternatively to participating in this lottery, your total wealth could simply increase by a
certain guaranteed percentage of your total wealth. Now consider different increases in your total wealth (e.g. a guaranteed 40% increase in your wealth) and check whether you prefer this guaranteed increase in your wealth or the participation in the lottery (please check all cases and mark your preferred alternative)
Guaranteed increase in your total
I prefer…
wealth by… ... the guaranteed increase in
wealth
… the lottery
10% or less O O 20% O O 30% O O 40% O O 50% O O 60% O O 70% O O 80% O O
90% or more O O I do not know O
4

Some Questions about You Finally, we have some questions about you: Please indicate your sex?
Female O Male O
How old are you? (please mark)
______________ years
For how long have you been working for [Company]? (please mark)
______________ years
Please indicate your education level? (please mark)
Traineeship in business O University degree O PhD O None of the above O
5
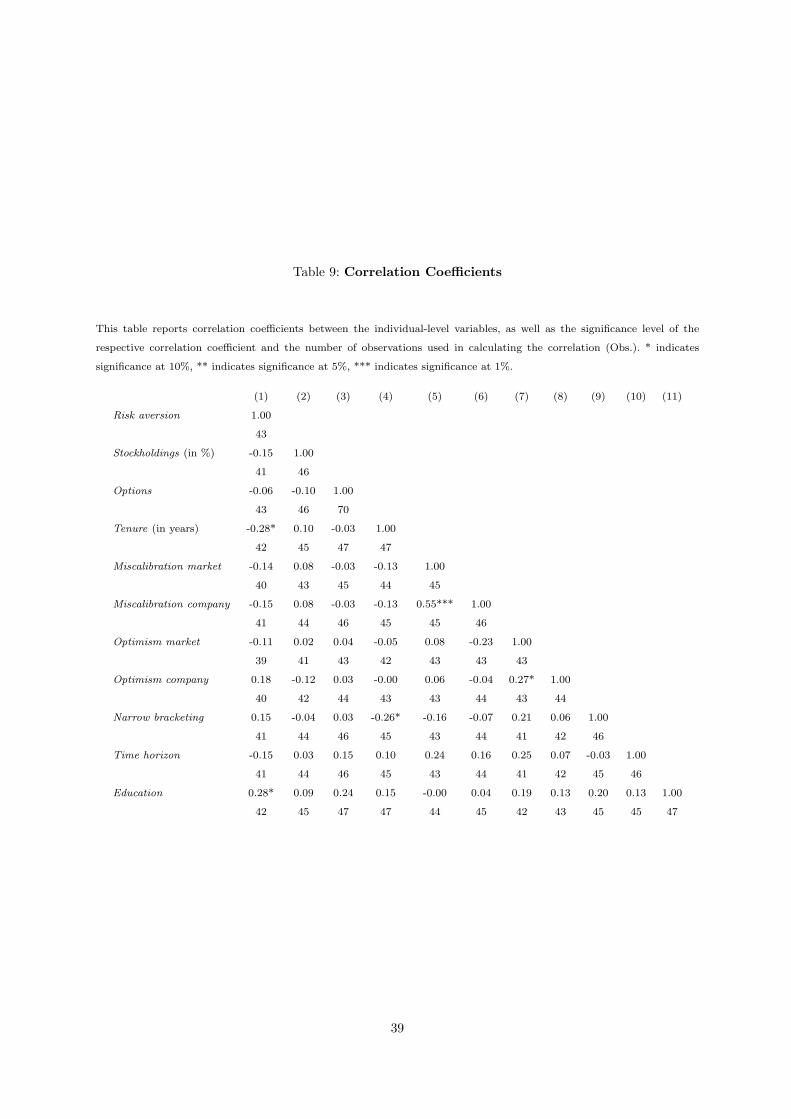
Table 9: Correlation Coefficients
This table reports correlation coefficients between the individual-level variables, as well as the significance level of the
respective correlation coefficient and the number of observations used in calculating the correlation (Obs.). * indicates
significance at 10%, ** indicates significance at 5%, *** indicates significance at 1%.
(1) (2) (3) (4) (5) (6) (7) (8) (9) (10) (11)
Risk aversion 1.00
43
Stockholdings (in %) -0.15 1.00
41 46
Options -0.06 -0.10 1.00
43 46 70
Tenure (in years) -0.28* 0.10 -0.03 1.00
42 45 47 47
Miscalibration market -0.14 0.08 -0.03 -0.13 1.00
40 43 45 44 45
Miscalibration company -0.15 0.08 -0.03 -0.13 0.55*** 1.00
41 44 46 45 45 46
Optimism market -0.11 0.02 0.04 -0.05 0.08 -0.23 1.00
39 41 43 42 43 43 43
Optimism company 0.18 -0.12 0.03 -0.00 0.06 -0.04 0.27* 1.00
40 42 44 43 43 44 43 44
Narrow bracketing 0.15 -0.04 0.03 -0.26* -0.16 -0.07 0.21 0.06 1.00
41 44 46 45 43 44 41 42 46
Time horizon -0.15 0.03 0.15 0.10 0.24 0.16 0.25 0.07 -0.03 1.00
41 44 46 45 43 44 41 42 45 46
Education 0.28* 0.09 0.24 0.15 -0.00 0.04 0.19 0.13 0.20 0.13 1.00
42 45 47 47 44 45 42 43 45 45 47
39