Embed Size (px)
Citation preview

Stock Plan Administration: Where do we go from here?
NASPP – July 9, 2008
Michael Bendorf – Principal, Buck ConsultantsRobin Silke – Manager, Global Shares

About the Survey
• In February, 2008, Global Shares and Buck conducted their second annual survey of Stock Plan Administrators
• Responses from 325 companies from 11 countries• Focus on the survey was on stock administration
practices, not on plan design• Buck Consultants provides a separate survey to
focus on stock plan design trends (2008 Buck Consultants Global Long-Term Incentive Practices Survey)

Survey represents a diversity of organizations…
91%
9%Public
Private
28%
17%
13%
11%
31%
TechnologyManufacturingFinancial ServicesLife SciencesOther
23%
18%
21%
28%
10%
$10 bn +
$3 - $10 bn
$1 - $3 bn
$100 - $1,000 mm
Less than $100 mm
Organizational Status Industry
Revenue Range
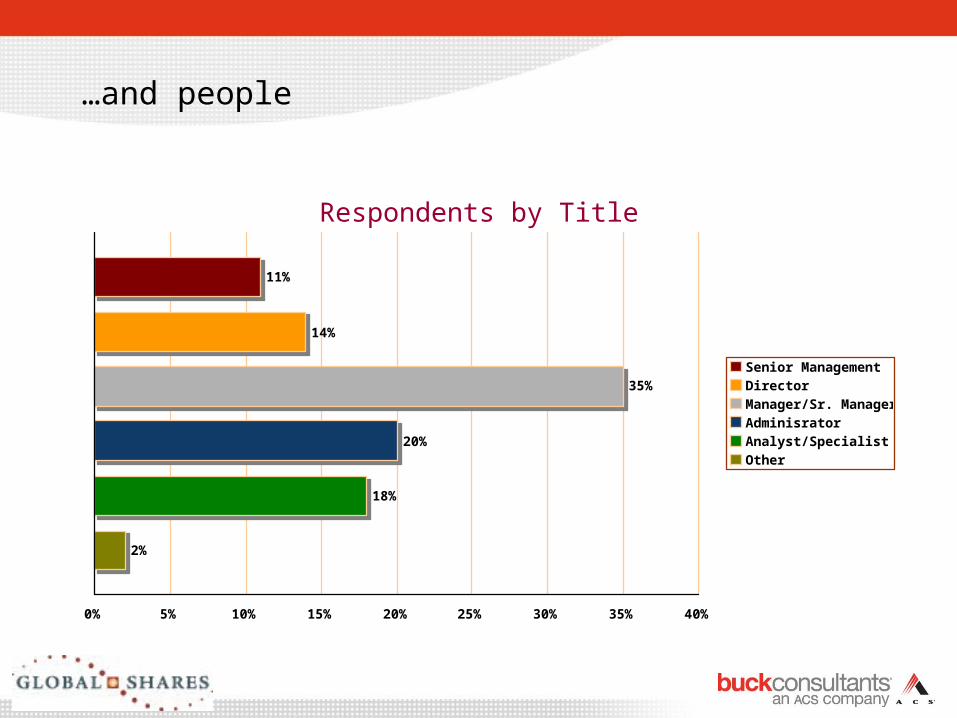
…and people
2%
18%
20%
35%
14%
11%
0% 5% 10% 15% 20% 25% 30% 35% 40%
Senior ManagementDirectorManager/Sr. ManagerAdminisratorAnalyst/SpecialistOther
Respondents by Title

The Results
[ essential intelligence ]

Administrators came from various backgrounds
• Human Resources provides the most common career path for stock plan professionals
• 16% of stock plan administrators started their careers specifically as stock plan professionals
37%
27%
16%
9%
6%6%
Human Resources Finance Direct EntryLegal Administration Other
Path Followed into Current Position

Educational experience
• Almost 30% of respondents have a graduate degree
• 91% of respondents have a minimum of a 2 year college degree
29%
51%
10%
9%
Advanced Degree Bachelors DegreeCommunity College High School
Educational Experience

Professional certifications are also common
• Almost half of survey respondents report having some certification or other professional qualification
25%
12%8% 8%
11%6%
40%
Certified EquityProfessional
CEP Exam LevelII
CEP Exam LevelI
CertifiedCompensationProfessional
PHR/SPHR OtherCertification
ProfessionalQualification
Prevalence of Certifications/Professional Qualifications

Continuing Education
• Respondents take ongoing education seriously, with 96% indicating they regularly participated in educational activities
• 79% participated in at least one annual conference in the past year– NASPP - 72.7%– E*Trade - 28.2%– WorldatWork - 25.7%– CEP Symposium - 15.1%– GEO Annual Conference - 14.3%
• 55% also participated in at least one local chapter meeting– NASPP - 81.0%– E*Trade User Group - 26.8%– GEO - 14.4%
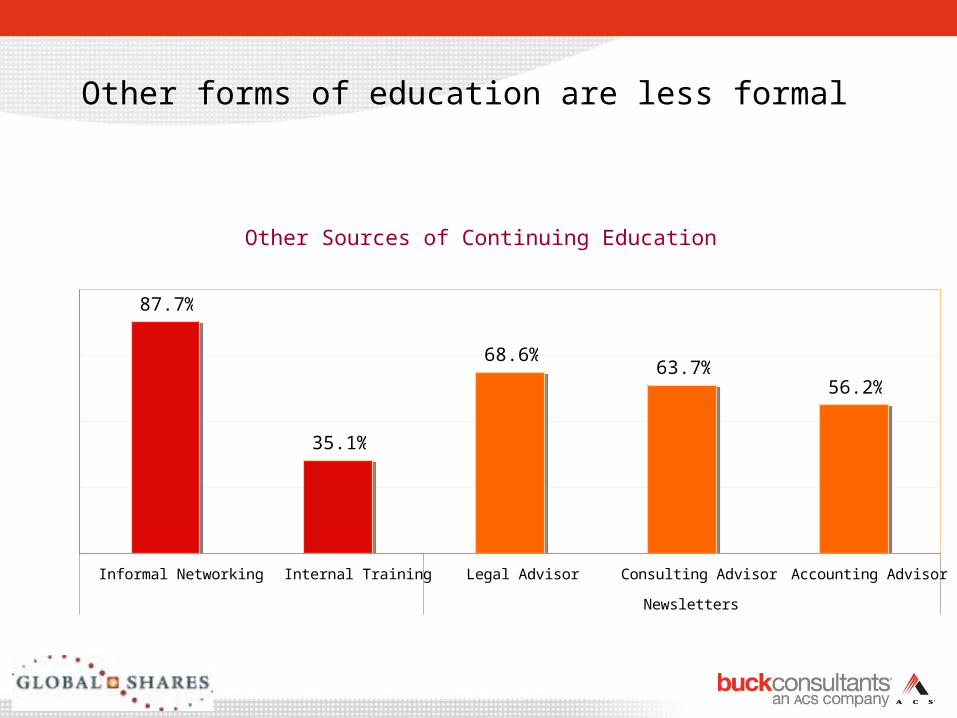
Other forms of education are less formal
87.7%
35.1%
68.6%63.7%
56.2%
Informal Networking Internal Training Legal Advisor Consulting Advisor Accounting Advisor
Newsletters
Other Sources of Continuing Education

Types of company plans administered
• Stock options are still the most popular, but more than half of the respondents are responsible for administering restricted stock plans.
• Additionally, more than half still administer a type of purchase plan (which can include ESPP, SAYE, SIP, etc.)
95%
23%
54% 59%
41%
54% 50%
Stock Options SARs Restricted StockRestricted StockUnits
Performance-based Plans
Stock PurchasePlans
Outside DirectorPlans
Prevalence of Equity Plan Type

Stock plans still have an international nature
• 71% of respondents are responsible for plans operating in multiple countries– Technology - 91%– Manufacturing - 86%– Services & Life Sciences - 81%
• 35% operate plans in more than 15 countries• Only 8% of companies with international plans use
different administrators outside of their home country

Organizational home for stock administration
• A majority of stock plan professionals find themselves in the HR department, with over half reporting HR as their home department
• The next most popular department is Finance (including treasury, accounting and payroll) and Legal (including corporate secretary)
52%
29%
11%
8%
Human ResourcesFinance Legal Other
Responsibility for Admin Function
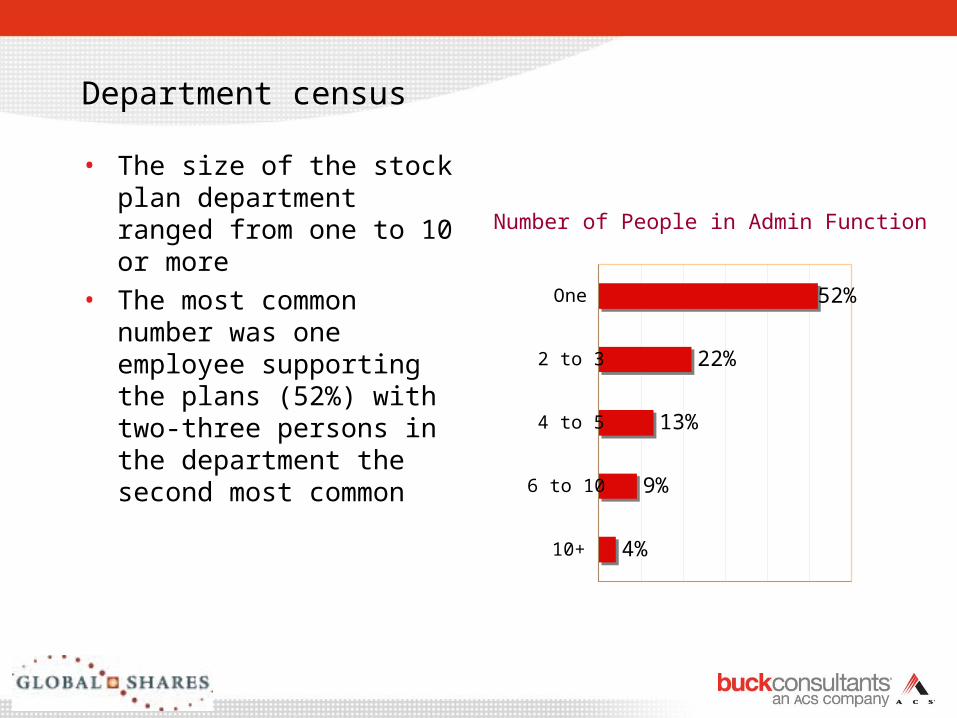
Department census
• The size of the stock plan department ranged from one to 10 or more
• The most common number was one employee supporting the plans (52%) with two-three persons in the department the second most common
4%
9%
13%
22%
52%
10+
6 to 10
4 to 5
2 to 3
One
Number of People in Admin Function

Cost of the plan(s)
• On average, across all respondents (large and small), companies spent an average of $213,565 to support their stock plans.
• Over half that amount went to paying service providers (administrators)
56%
8%
13%
20%3%
Service Providers Communications
Systems/TechnologyProfessional Fees
Training
Share of Total Cost of Plan

Cost of the plan(s)
• Average cost per plan participant across all companies was $28.32• Evidence that economies of scale have tremendous impact on per
participant cost
$0
$50
$100
$150
$200
$250
50,000+ 20-50,000 10-20,000 5-10,000 1-5,000 <1,000
Training
Professional Fees
Systems
Communication
Service Providers
Average Cost per Participant by Employee Population

Impact of Issues on Responsibilities
• The most influential activity to impact the daily life of the stock plan administrator is management reporting, followed closely by monitoring government regulations
• We are pleased to see that internal politics ranks low in terms of time-consuming activities.
High Impact Activities Low Impact Activities
1 Management Reporting 5 Changing Jobs
2 Government Regulations 4 Internal Investigations
3 Internal/External Auditors 3 Internal Politics
4 Participant Education 2 Budget Justification
5 Employee Satisfaction 1 Employee Turnover in Dept.

Utilization of time
• We were surprised to see that work unrelated to stock administration took up 35% of people’s time. When asked what that time was spent on, it related either to plan design/participation selection or unrelated activities.
• Unfortunately, twice as much time is spent on reporting (22%) than on training and communication (11%).

Commercial software licensing
• 58% of respondents utilize a commercially available software package, regardless of whether they outsource or not.
• We did not include proprietary software owned by administrators (that were unable to be licensed by end users) in our questionnaire.
77%
12%6% 6%
Equity Edge Transcentive EASi Other
Most Popular Software Packages
Little movement to new software platforms
• 10% of respondents had moved to a new software platform (either purchased or at an administrator)
• 15% were not convinced it had been a good idea, although 85% felt it had been worth the effort

Participant websites
• Over 80% of respondents provide a website in support of their administrative services
• Customized company websites are most prevalent in technology industries
• Broker-provided websites are most prevalent in hospitality and retail/wholesale
51%
21%
9%
19%
Broker Website Software Provider WebsiteCustom Website No Website
Source of Equity Participant Websites

Outsourcing prevalence varies
• 52% of companies surveyed report outsourcing some or all of their stock plan administration programs
• Larger companies appear more likely to outsource administration
78.9%68.2%
52.8%43.7%
12.5%
$10 billion + $3 - $10 billion $1 - $3 billion $100 million - $1 billion < $100 million
Outsourcing Prevalence by Company Revenue

Types of plan outsourced
• 17% of respondents have outsourced all their equity plans
• Larger plans (e.g., Stock Options, Purchase Plans) appear to be outsourced more frequently than smaller plans
46%
32%40% 43%
32%
46%
21%
Stock Options SARs Restricted StockRestricted StockUnits
Performance-based Plans
Stock PurchasePlans
Outside DirectorPlans
Percent of Equity Plan Types Outsourced

History with Service Provider
• We found a wide range in terms of the length of the relationship with the providers
• We did find a bump in the number of companies using their providers between 2 and 10 years and feel this may be explained in the rise of outsourcing over the past 10 years
• 45% have what are considered long term relationships (i.e., more than 4 years)
5%
22%
18%
30%
25%
10+
6 to 10
4 to 5
2 to 3
One
Number of Years with Current Service Provider

Additional services provided by outsourcing
• The trend for brokerage firms to provide outsourcing is supported with 92% of respondents reporting that their outsourcer provides brokerage services
• Only 11% reported that their administrator also provides transfer agent/registrar services

Perceived value of outsourcing initiative
• The most important attribute an administrator can provide is accuracy. Surprisingly, reporting was seen, by comparison, to have the least value to survey participants.
Reporting
Customer Service for Company
Timeliness
Administration
Customer Service for Participants
Accuracy
Level of Satisfaction with Service Deliverables

Losing control of data is still a major issue
• Of companies not currently outsourcing stock plan administration services, 1/3rd report considering doing so. However the most common reason companies don’t is their fear of losing control of their data. Pricing also appears to be an issue, with 38% challenged by the cost.
59%
38% 36%
6%13%
Data Control Price Impact on Workload Past Experience Other
Reasons for Not Outsourcing

Stock Plan Administration: Where do we go from here?
NASPP – July 9, 2008
Michael Bendorf – Principal, Buck ConsultantsRobin Silke – Manager, Global Shares