Embed Size (px)
Citation preview

Final Project
STOCK PRICE
PREDICTION USING
MACHINE LEARNING Final Report
Kia Woon Mah
19/09/2020
Higher Diploma in Science in Data Analytics

1
Contents 1. Introduction .................................................................................................................................... 2
2. Project Scope and Objectives ......................................................................................................... 3
3. Student’s Learning Objectives ....................................................................................................... 4
4. Technical Specification of the Project ........................................................................................... 5
5. Project Plan ..................................................................................................................................... 6
6. Description Of The Program Architecture ..................................................................................... 7
7. Stock Prediction with Classic Machine Learning Modelling ....................................................... 15
8. High Accuracy Stock Prediction with Propietary (Advanced) Machine Learning Modelling ..... 19
9. Conclusion .................................................................................................................................... 28
10. References / Bibliography ............................................................................................................ 29
2
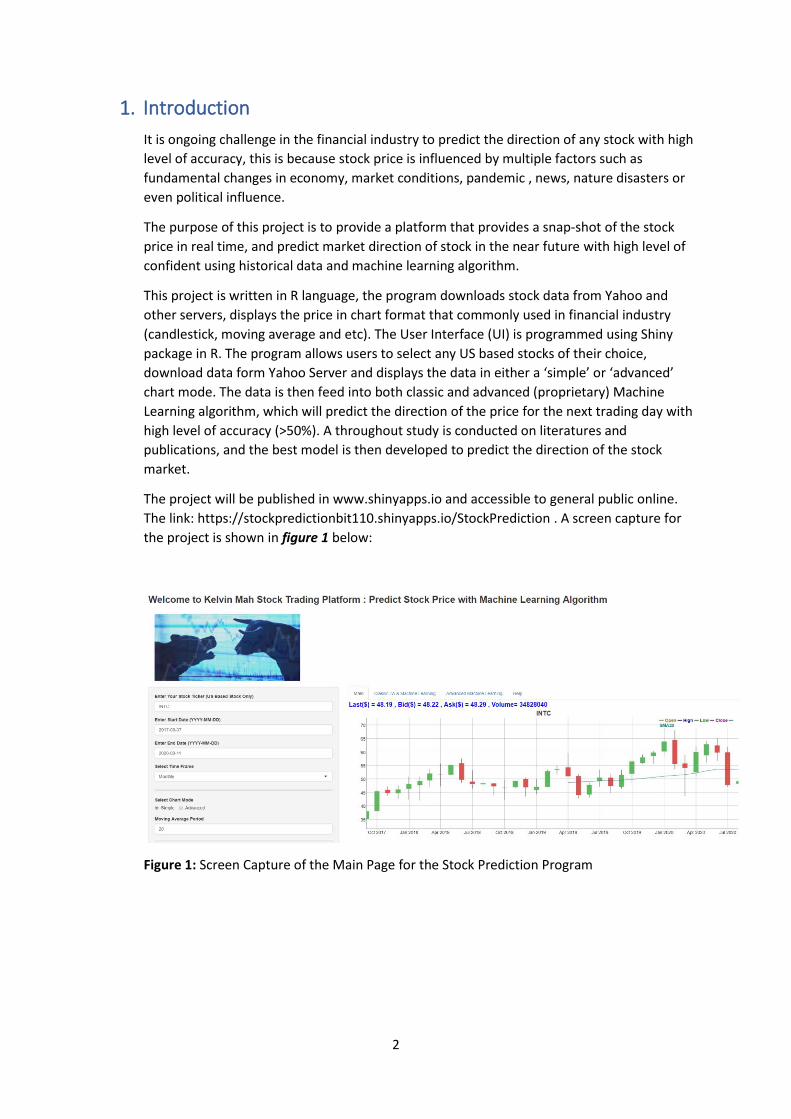
1. Introduction
It is ongoing challenge in the financial industry to predict the direction of any stock with high
level of accuracy, this is because stock price is influenced by multiple factors such as
fundamental changes in economy, market conditions, pandemic , news, nature disasters or
even political influence.
The purpose of this project is to provide a platform that provides a snap-shot of the stock
price in real time, and predict market direction of stock in the near future with high level of
confident using historical data and machine learning algorithm.
This project is written in R language, the program downloads stock data from Yahoo and
other servers, displays the price in chart format that commonly used in financial industry
(candlestick, moving average and etc). The User Interface (UI) is programmed using Shiny
package in R. The program allows users to select any US based stocks of their choice,
download data form Yahoo Server and displays the data in either a ‘simple’ or ‘advanced’
chart mode. The data is then feed into both classic and advanced (proprietary) Machine
Learning algorithm, which will predict the direction of the price for the next trading day with
high level of accuracy (>50%). A throughout study is conducted on literatures and
publications, and the best model is then developed to predict the direction of the stock
market.
The project will be published in www.shinyapps.io and accessible to general public online.
The link: https://stockpredictionbit110.shinyapps.io/StockPrediction . A screen capture for
the project is shown in figure 1 below:
Figure 1: Screen Capture of the Main Page for the Stock Prediction Program

3
2. Project Scope and Objectives
Scope:
The scope of this project consists of programming of a stock trading platform using R. The
stock data is downloaded from Yahoo Server using an API in R. The program also performs
data cleansing, Visualisation in ‘basic’ or ‘advanced’ charts created by stock trading packages
(Quandl), display the ‘live’ price data from Yahoo server (refresh in every three second) and
predict the price movement for the next trading day. The User Interface (UI) and Server
(SVR) Architecture are setup using Shiny package. The historical stock data is been analysed
and modelled by both classic and proprietary Machine Learning Algorithm (Random Forest,
SVM, linear regression, decision tree and Time Series and etc). The optimise parameters for
the models are derived with automated algorithm. The model predicts the direction of the
stock market for the next trading day, as well as provide recommended trading parameters
(such as stop loss and profit target) to the user (stock traders).
Objectives :
• Create a web base program that allows stock traders to input the required
parameters (stock tickers of interest, timeframe, chart selection options such as
‘simple’ or ‘advanced’ mode, parameters for the technical analysis) and dispaly the
stock information
• The program will download both the live and historical data from Yahoo Server using
build-in API in R-studio (in ‘xts’ format). This step is invisible to the users
• Data Visualisation - Display the stock data in commonly used stock charts format
(candlesticks) and volume data, as well as other technical analysis techniques such
as SMA (Simple Moving Average), MACD (Moving average Convergence Divergence)
and Bollinger Band
• Perform data modelling using both classic and proprietary machine learning
techniques to predict the direction of the stock price for the next trading day. This
process is invisible from the users, and the R-code for the algorithm is stored in the
‘server’ which is not accessible by the general users. The model are derived from the
historical data with proprietary models. All the operations are performed in
memory(HEAP) without any intermediate file, and hence provide a layer of security
for any leak of ‘IP’ of the algorithm
• The program will display the “trade suggestion” (buy or sell signals) based on the
outcome from the model mentioned above. The result is displayed in the UI page
which is visible to users. Other relevant trading parameters such as live stock data
from exchange with low latency, recommended stop loss, profit taking derived from
the historical data is also displayed in the UI page. This will provide a ‘one stop shop’
information to enable the stock trader to enter their position without the need to
reference to other stock trading platform.
• The program will be hosted online (www.shinyapps.io) and accessible to general
public.

4
3. Student’s Learning Objectives
• Design a Visualisation Stock Analysis program enabled by Machine Learning
Algorithm.
• Learn the Shiny packages and enable online web base Publication and Visualisation
in R.
• Learn common stock trading packages (such as quantmod, tidyquant, pdfetch,
dygraphs) in R
• Develop proprietary Machine Learning algorithm to predict the direction of the
stock market. This will require in depth research, review current literatures and
publications, data analysis and testing/verification for different modelling in order
to derive model with accuracy > 50% (better than random prediction)
• Test & Bug finding, and ‘stress test’ of the program
• The goal is to develop a model that can demonstrate the performance (accuracy)
that is comparable or better than other publications and literatures
• Exploit the option to publish the program in common R- shiny website
(www.shinyapps.io), exploit the marketing and monetise opportunity of the
program (e.g. subscription service)

5
4. Technical Specification of the Project
• Computer with internet access with R-studio installed
• The program is written in R language and is accessible using any browser with
internet access, the layout is user friendly to both desktop and mobile phone user.
• The program is only working on the US based stocks (NASDAQ, AMEX, CBOE). It is
not working on international stock markets such as FTSE, DAX, CAC and etc.
• The model is developed based on large amount of historical stock data. The
accuracy of the model is expected to be > 50% in long run (not random walk)
• Program is been tested vigorously, and expect to be generally bug free and robust
for general usage
• Program Architecture – Consist of two key components, a user interface (UI) object
and a server components. The inputs from users are passed as arguments from UI
to the Server function for data manipulation & modelling, and the result is then
passed back to the UI as an ‘output’ object (in plot, text, table format)

6
5. Project Plan
The overall schedule and the milestones are shown below:
Figure 2: Project Plan and current Status
7
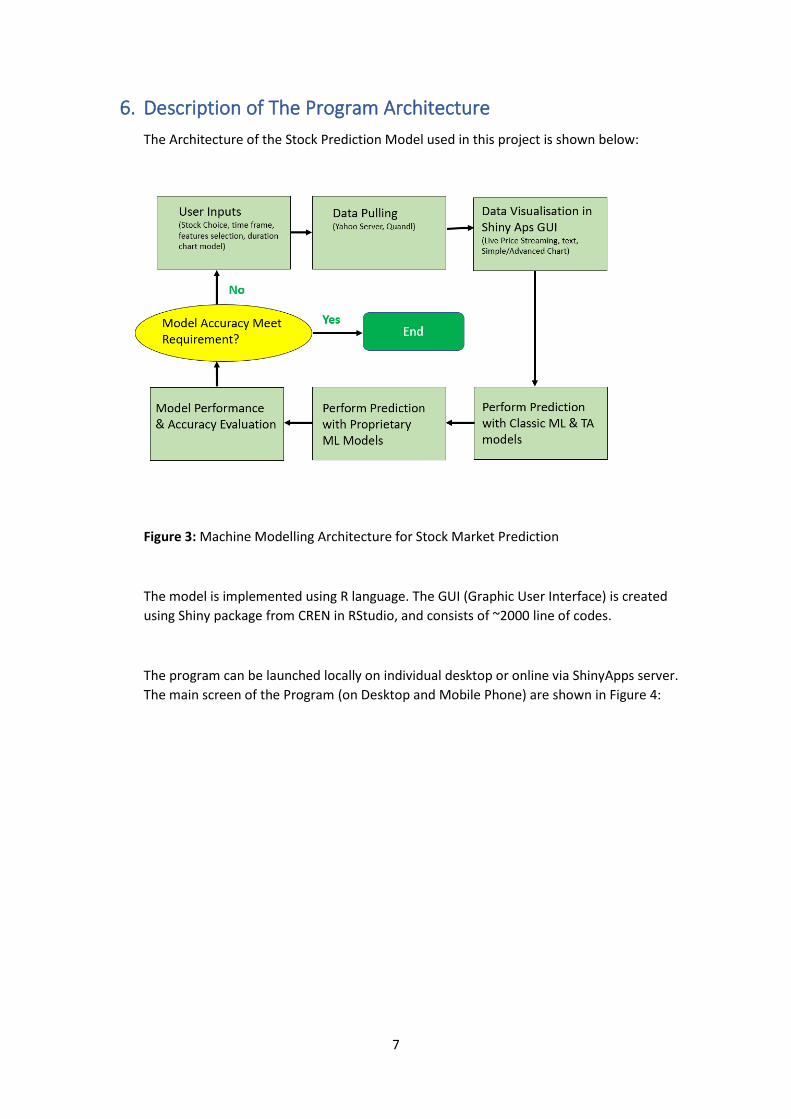
6. Description of The Program Architecture
The Architecture of the Stock Prediction Model used in this project is shown below:
Figure 3: Machine Modelling Architecture for Stock Market Prediction
The model is implemented using R language. The GUI (Graphic User Interface) is created
using Shiny package from CREN in RStudio, and consists of ~2000 line of codes.
The program can be launched locally on individual desktop or online via ShinyApps server.
The main screen of the Program (on Desktop and Mobile Phone) are shown in Figure 4:

8
Figure 4(a): The Main Page of the program (Desktop Mode in Internet Browser)
Figure 4(b): The Main Page of the program (Access via Mobile Phone)

9
As shown in Figure 4(a), the layout of the program is designed in such that the sidebar on
the left hand side is for user’s inputs, with the main output area located in the middle to
display the plots and other results from the simulation. The main output areas are divided
into 4 different tab:
• Main – Consist of live stream price data (refresh in every 3 sec) feeds from Yahoo
server. Professional looks financial charting (Candlestick charts) with option for
“simple” or “advanced” mode charting
• Classic Machine Learning and TA (Technical Analysis) – Market prediction using
“classic” Machine Learning Model, Time Series Analysis and Technical Analysis (TA)
which are commonly used in professional trading platform. The modelling &
simulations are executed behind the scheme and invisible to user. The output of the
simulation is consolidated and displayed with a few simple lines of sentences &
table, to ease the complication for the user to understand the mathematic models
involved in the modelling
• Advanced Machine Learning – Market prediction using proprietary Machine
Learning Model. The model requires users to enter appropriate parameters for the
proprietary models. It also requires significant computing power to simulate the
model of a given stock even with high performance CPU (Intel i7 or i9), with average
simulation time ~ 20 minutes for a single stock. The modelling & simulations are
executed behind the scheme and invisible to user, and the output of the simulation
is consolidated & displayed as a few simple lines of sentences in the main panel
• Help – Provide relevant information on how to use the Apps

10
The program is written in different modules using Shinny Apps Architecture. The Five key
Modules are:
o UI (Use Interface) Module– Allow users to enter the stock ticker of their choices,
time frame (daily, weekly or monthly), select chart mode (simple or advanced),
enter machine learning parameters (such as Monte Carlos Iterations, attributes
Selections, number of datapoints for modelling), TA parameters (such as Moving
average, MACD, Bollinger Bands, RSI). The sidebar consists of different type of
interfaces such as text box, radio button, drop-down menu, check box and slider
bars. A screen capture of the UI I shown in Fug 5 below.
Figure 5: UI Module to let user inputs the relevant information
o Live Price Module: The ‘live’ prices (open, close, high, low, volume) of the stock is
streamed on the top of the charts and is refreshed every 3 second. The refresh
capability is enabled with R-build in function “InvalidateLater()”. The stock data is
feed from Yahoo Server with low time latency. The Source code is shown in next
page.

11
Figure 6: Source Code for live stream of Stock Data
o Chart Module - The program offers two different chart mode:
o Simple Chart Mode – A Candlestick price chart with Simple Moving Average
(SMA). See below for the screen capture of the Simple Chart Mode:
Figure 7: Simple Chart Model with SMA (blue line) and live stream price data from
Yahoo Server
The default setting for the period of Simple Moving Average (SMA) is 20 which is the
standard setting for SMA in finance industry, but user can change the setting using text
box in the left hand panel (see Figure 8 in next page). The longer the period, the lower
the sensitivity of the SMA curve to react to a sudden change in price4. The chart will
refresh automatically when the setting is changed

12
Figure 8: User can change the Simple Moving Average Period in Simple Chart Mode
in the text input box.
Dygraphs package is used to generate the interactive candlestick chart for Simple
Chart Mode. The source code is shown below:
Figure 9: Source Code used to generate Candlestick Simple Chart Mode
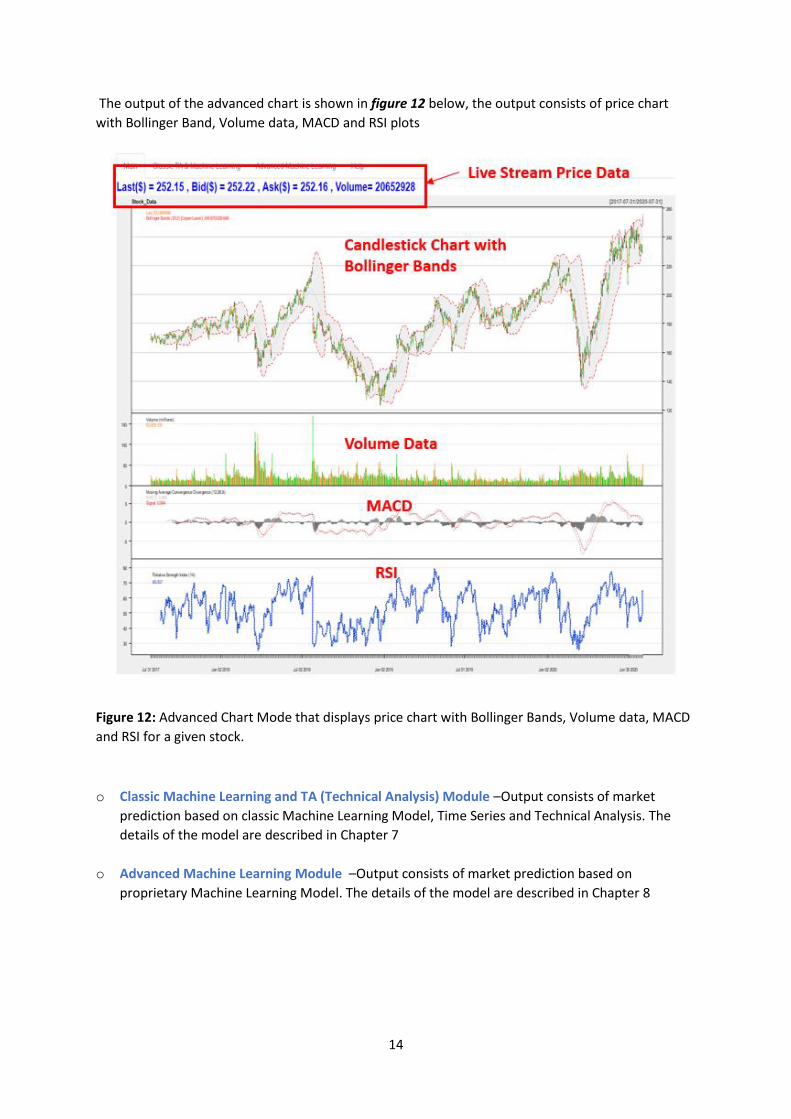
o Advanced Chart Mode – Display Candlestick plot together with other advanced
Technical Indicators below :
o Trading Volume
o Bollinger Band : The indicator displays the boundary of the price movement
based on standard deviation/volatility (Default = 2 sigma)
o RSI (Relative Strength Index) : RSI is a momentum indicator that measures
the magnitude of recent price changes to analyse overbought or oversold
situation of a given stock. The default setting for Fast Period RSI = 14
o MACD (Moving Average Convergence Divergence). MACD is a trend
following indicator that shows the relationship between two moving
average of a given stock price. The default setting for MCAD is Slow Period =
26, Fast Period = 12
The description of the TA modelling and analysis are discussed in literature 4
The default settings (e.g. 2 sigma for Bollinger Bands, RSI = 14 and etc) in advanced
chart are the standard setting used in the finance industry. However, users are able
to modify those default setting in the sidebar on the left (as shown in
Figure 10). The chats will refresh automatically when the setting is changed.

13
Figure 10: User can change the parametric setting for Bollinger Band, MACD and RSI to suit for
different stocks of their choice that may have different Characteristic and Volatility
The advanced charts are created using Quantmod package, which is one of the most popular
package designed to assist quantitative trader in the development, testing and development of
statistically based trading model. Quantmod makes modelling easier by removing the repetitive
workflow issues surrounding data management, modelling interfaces, and performance analysis. The
source code is shown in Figure 11 below.
Figure 11: Source Code used to create Advanced Chart with different indicators – Bollinger Band,
RSI, MACD and Volume Data
14
The output of the advanced chart is shown in figure 12 below, the output consists of price chart
with Bollinger Band, Volume data, MACD and RSI plots
Figure 12: Advanced Chart Mode that displays price chart with Bollinger Bands, Volume data, MACD
and RSI for a given stock.
o Classic Machine Learning and TA (Technical Analysis) Module –Output consists of market
prediction based on classic Machine Learning Model, Time Series and Technical Analysis. The
details of the model are described in Chapter 7
o Advanced Machine Learning Module –Output consists of market prediction based on
proprietary Machine Learning Model. The details of the model are described in Chapter 8

15
7. Stock Prediction with Classic Machine Learning Modelling
In this module, several classic Machine Learning models and Analysis tools have been
employed to predict the stock movement for the next trading day.
The architecture and the test flow for this module is shown in figure 12 below.
Figure 12: Flow diagram for the “Classic” Machine Modelling & Analysis
Three different models have been applied in this module.
• Classic Machine Learning Modelling
• Time Series Analysis
• Technical Analysis
The algorithm used in each models will be discussed in detail in the next page

16
Classic Machine Learning Modelling Algorithm
1. Data is pulled from Yahoo server and cleansed
2. Set the Future price as the response/label for the model, a common practice used in
machine learning algorithm for stock market prediction
3. Bagging samplings (bootstrap aggregating) - 80% of the data is randomly chosen as training
dataset using sample() build-in function.
4. Models (GLM, SVM, Random Forest, Decision Tree) are developed using training dataset
5. Predict the stock price for the next trading day using the data from the last price
6. Repeat steps (2) to (4) with Monte Carlos Iterations (default setting = 1000) to improve the
accuracy of the modelling
7. Display the final decision (price trend up or trend down) in the output screen
Time Series Analysis
1. Data is pulled from Yahoo server and cleansed
2. Convert the data into time series format
3. Use Auto Arima (auto.arima() build-in function from R) to predict the time series
parameters, namely - Auto Regression(p), differentiation (d) and moving average(q)
4. Display the Time Series plot with Prediction in the output screen
5. Predict the price of the next trading day by taking the average price of the next three
prediction based on the Time Series Model in step(3). The data, together with other
machine learning models, is used to predict the market movement for the next trading day
with ensemble approach (“majority vote”)
Technical Analysis (Chart Analysis)
1. Data is pulled from Yahoo server and cleansed
2. Calculate Simple Moving Average (SMA), MACD and RSI values of the last price
3. The Technical Analysis Prediction is based on Trend Following trading assumption5 :
• Stock is expected to trend-up when the price is above SMA20
• Stock is expected to trend-down when the price is below SMA20
• Stock is expected to trend-up when SMA 20 > SMA50
• Stock is expected to trend-down when SMA20 < SMA50
• Stock is expected to trend down during overbought (RSI > 70)
• Stock is expected to trend up during oversold (RSI < 30)
• Stock is expected to trend-up when MCAD > 1
• Stock is expected to trend-down when MCAD < 1
4. The final prediction is based on the ensemble models approach, e.g. the outcome of the
prediction is based on the “majority vote” from step(3)
5. Display the final decision (price trend up or trend down) from (4) in the output screen

17
Control Parameters for Classic Models in User Inputs Panel
As shown in figure 13 below, user is able to define the number of days (aka data points) for their
modelling in the text box located in the left sidebar. The default setting is 100 days which should
provide sufficient data points for most of the machine learning models
Figure 13: Input panel that allow user to define the parameter for the classic modelling
There are Five different machine learning models applied in this analysis:
• General Linear Modelling
• Support Vector Machine
• Random Forest
• Decision Tree
• Time Series
Technical speaking, Time Series is not part of the Classification Machine Learning Models, however,
Time Series is proven to be a powerful tool to predict the “trend” of the dataset as discussed in
literature6 and hence it has been included in this study.
As shown in figure 14 above, user is able to select the “weightage” of the Time Series Analysis using
the slider bar, e.g. “0” for the situation where time series is omitted from the analysis, 20% for the
situation that Time Series Model will have equal weight with other four models, and 100% for the
situation that Time Series is the only analysis technique used in the modelling. The default setting is
20% (equal weight for all the models)

18
Interpretation of the Output Screen
An example of the output from the modelling is shown in figure 14 below
Figure 14: Output of the Classic Machine Learning Prediction for “GOOG” (Google)
Interpretation for the output in figure 14 above:
• Time Series Plot displays the predicted price range with 80% and 95% confident level in the
next 25 days. The range can be used as the target for Profit Taking and the level for Stop
Loss.
• Technical Analysis (TA) predicts the stock price is going to trend up in the next trading day
and suggests that the trader to buy into the stock (e.g. open a Buy(Long) position).
• The Machine Learning model (ensemble models with GLM, SVM, Random Forest, Decision
Tree and Time Series) predicts the stock price will trend up (e.g. from $1475.45 to $1498.28)
in the next trading day.
Based on the prediction from both Technical Analysis and Machine Learning, the trader should look
for opportunity to open a “buy” (long trade) position on this particular stock (“GOOG” which is
Google), and set the profit target and stop loss based on the range derived from Time Series Model.

19
8. High Accuracy Stock Prediction with Proprietary (Advanced)
Machine Learning Modelling
This chapter describes the algorithm used in the proprietary (Advanced) Machine Modelling
in this project, and discusses the performance of our proprietary Machine learning model
compare to standard machine learning models and other publications.5, 7, 11
The proprietary model developed in this chapter is the “Core” of this project. The number of
R-code for proprietary modelling consists of ~1200 lines of R-code, which is ~70% of the
overall R-codes developed in this program. It normally takes up to 15-20 min to complete a
prediction in each stock ticker with a modern laptop/PC and will consume significant of
computing powers. However, in order to avoid any confusion to the user (mainly stock
trader) to interpret the machine learning & mathematic models involves in the calculation,
the output of the model (market prediction) has been simplified such that it only consists of
several lines of summary text.
Figure 15: Main Interface of the Advanced Machine Learning Modelling
Figure 15 above shows the main UI (user interface) for Advanced Machining Learning Model.
Use is required to input the following parameters:
• Number of days for the model which essential refer to the number of data points
that will be used to model the stock movement. We find out the optimum range for
number of data points for US stocks is between 40 to 80 days with is similar to other
literature2,7,9. The default setting is 40 days
• 1st Level Monte Carlos Iteration. This refer to the number of iteration used to find
the optimised attributes. The default setting is 100
• 2nd Level Monte Carlos Iteration. This refer to the number of iterations used to
predict the market direction in “optimised model”. The default setting is 1000
• Accuracy of the models. The default setting is 0.65

20
Rule of thumb for the Setting in figure 15
In general, the higher the numbers of Monte Carlos iterations, the better the accuracy of the
modelling, however, high number of iterations will consume a significant amount of
computing processing power.
The setting for accuracy should be larger than 0.5 to have meaningful prediction for the
market direction (e.g. stock market can only up or down which is binary with random
accuracy of 0.5), however in practical it is impossible to achieve accuracy higher than 0.8.
The reason is stock market depends on a lot of external factors and it is impossible to have
all the data available for the modelling.
The onus of this algorithm is to “add” other proprietary attributes (e.g. dataset) that
generally impact the stock movement, with the expectation that those attribute will increase
the accuracy (e.g. information gain) to the stock prediction. This approach has been
investigated by several authors with certain level of success7, 9, 10, 11.
The algorithm used in this project are divided into 3 main modules:
• Module 1: Raw Data Pulling & Cleansing
• Module 2: Automatic Search for Highly Correlated Attributes
• Module 3: Modelling and Price Prediction

21
Module 1: Raw Data Pulling & Cleansing
Figure 16: Data pulling and Cleansing Module
As shown in figure 16 above, the function of this module is to pull live data from different
servers and perform data cleansing steps to remove data from non-US trading day or missing
data.
The stock data (based on user choice) is pulled from Yahoo Serves and the stock data for
next trading day (e.g. future price) is set as label (Y-response) using lead() function10.
The module also pulled ~40 different dataset from various servers in different locations
(Yahoo, Quandl and etc). Those additional data will serve as potential candidate to improve
accuracy of the prediction. The first step for the data cleansing is to synchronise those
external data with US stock market based on the trading date, e.g. to make sure we only pull
the data from non-US based stock when the US stock market is open. An example of the R-
code uses to synchronise the external data is shown in figure 17 below:

22
Figure 17: Two dimension for loop is used to synchronise the Gold data with the US stock
trading day
All the data are then combined into one single structural table in dataframe format. Any row
with NaN (missing data due to non-trading day) will be removed as some of the machine
learning models cannot take missing data. An example of the structural data is shown in
figure 18 below:
Figure 18: Structure Dataset consist of stock data and other attributes.
23
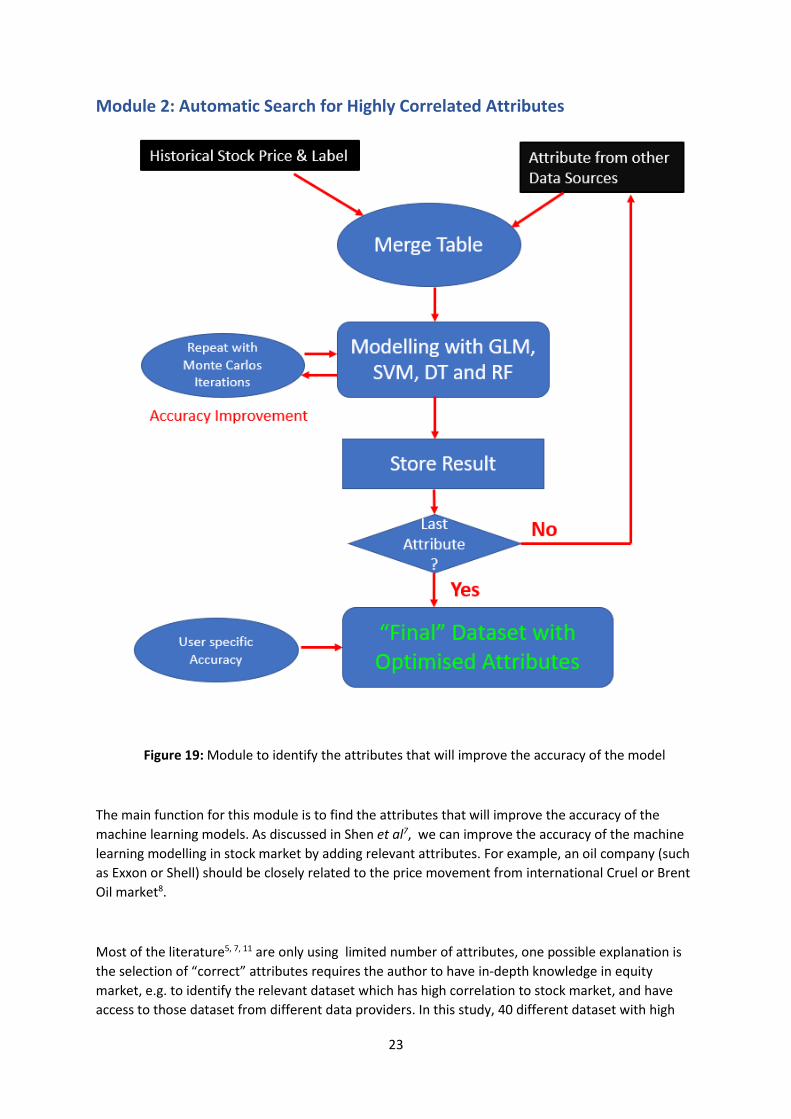
Module 2: Automatic Search for Highly Correlated Attributes
Figure 19: Module to identify the attributes that will improve the accuracy of the model
The main function for this module is to find the attributes that will improve the accuracy of the
machine learning models. As discussed in Shen et al7, we can improve the accuracy of the machine
learning modelling in stock market by adding relevant attributes. For example, an oil company (such
as Exxon or Shell) should be closely related to the price movement from international Cruel or Brent
Oil market8.
Most of the literature5, 7, 11 are only using limited number of attributes, one possible explanation is
the selection of “correct” attributes requires the author to have in-depth knowledge in equity
market, e.g. to identify the relevant dataset which has high correlation to stock market, and have
access to those dataset from different data providers. In this study, 40 different dataset with high

24
level of correlation to the stock market movement have been selected, which is the highest number
of attributes that have been reported by any literature.5, ,7,11
Four different models are used to model the stock price, namely GLM (General Linear Model aka
Gaussian Model), SVM (Support Vector Machine), RF (Random Forest) and DT (Decision Tree). As
shown in figure 19 above, each attribute is merged with selected stock price one by one, and the
program will then compute the *accuracy of each model based on 80/20 train and test dataset, and
stores the ‘score’ of the accuracy in a Matrix table. The process is repeated until all the attributes are
completely computed. Monte Carlos algorithm is used to improve the accuracy of the model. It is
noteworthy to mention that this is a long process and could take up to 20 min to complete the
calculation for all attributes.
* Note: Accuracy is defined as (TP + TF)/(TP + TN + FP +F N) where TP = True Positive, TN = True
Negative, FP = False Negative and FN = False Negative.
Finally, the program will select the models that meet the accuracy as specified by user, and creates a
“final” table with the attributes that will improve the accuracy of the stock. The R-code used to
compute the “final table” is shown in figure 20 below
Figure 20: R-code used to find optimised attributes from the dataset

25
Module 3: Modelling and Price Prediction
Figure 21: Module to build the model and predict the stock price
The main function of this module is to build machine learning models based on the dataset with
‘optimised’ attributes calculated from previous module. The dataset is divided into 80/20 train and
test dataset.
Two approach have been employed to predict the stock markets:
Compute Accuracy based on the Best Model
The train dataset is feed into four different machine learning models (GLM, SVM, DT, RF) to build
the model. The accuracy of the model is predicted using test dataset. Monte Carlos approach has
been used to improve the accuracy of the model. The program will then select the model that
demonstrate the highest accuracy.
Ensemble Approach to determine market direction for the next trading day
The train dataset is modelled with three different machine learning models (GLM, SVM and RF) to
predict the market direction for the next day (“up” or “down”), the program will then identify the
“majority vote” and decide the final outcome of the prediction (“up” or “down”) for the next trading
day). The accuracy of the model is predicted by test dataset. Monte Carlos approach has been used
to improve the accuracy of the model.

26
The most recent price data (last price) for the stock and other attributes are downloaded from
Yahoo server using live query with R. The best model with the highest accuracy (derived from
previous steps) is used to predict the future stock price, and ensemble model is used to predict the
market direction (“up” or “down”) for the next trading day. The program will then display the stock
movement (based on highest accuracy model and ensemble model) with the correspond confident
level in “Advanced Machine Learning” tab as shown in figure 22 below.
Figure 22: Output of the Advanced Machine Learning Model in Desktop Model (Top figure) and
Mobile Mode(Bottom figure)

27
Evaluation of the Performance of the Model
In this section, the performance (e.g. accuracy) of the advanced machine learning model is
compared to classic machine learning models, advanced machine learning model that used all
attributes and other publications7 ,9, 11.
A few popular stocks (Intel, Facebook, Microsoft, Google, Exxon) are selected for the performance
evaluation, and the accuracy for each stocks were computed with the following conditions:
• Classic Machine Learning Modelling (without additional attributes)
• Advanced Machine Learning Modelling (with All attributes)
• Advanced Machine Learning Modelling (with Optimised Attributes)
• Compare to other publications
Figure 23: Performance (Accuracy) Comparison between Advanced Models vs Classic Model and
other publications
As shown in figure 23 above, all the models (classic & advanced models) derived in this project have
accuracy > 0.5 which confirms that it is not a random prediction. e.g. the movement of any stock
movement is either ‘up’ or ‘down’ (binary movement with probability of 0.5). Any accuracy above
0.5 indicates the prediction is not random.
Figure 23 shows the accuracy for the Classic machine learning model (without additional attributes)
is in the range of 0.51 to 0.63, which indicates accuracy that is better than random probability of 0.5.
However, an improvement in the overall accuracy (to 0.61 to 0.69 range) can be achieved when all
the attributes are included in the modelling. This suggests that additional attributes do bring
additional “information gain” that can improve the overall accuracy.
The accuracy can be further improved to 0.73-0.76 after the optimisation process is performed, e.g.
only the relevant attributes are selected to build the model. One thing to note is the performance in
our model is equal or better than other publication.7, 9,11 that used similar approach. This may due
to the attributes selected in this study provide more superior “information gain” than other study.7,
11

28
9. Conclusion
The purpose of this project is to create a machine learning application to predict stock market
movement using R shiny package. The stock data is live stream from Yahoo Server with refresh
rate of 3 second. The program allows users to visualise the stock price using classic or advanced
candlestick stock charts. The advanced mode provides chart visualisation and technical
information such as moving average, RSI, Bollinger band and MACD, which is standard technical
analysis chart in financial industry.
The stock data is then modelled with classic machine learning algorithm – GLM, SVM, Random
Forest, Decision Tree and Time Series Analysis. The program also analyses the stock data using
conventional technical analysis (TA) such SMA cross-over and momentum study in R. The
outcome of the analysis is displayed in a simple text output in window-based GUI.
The core of this project (>70% of the coding) is on the advanced machine learning modelling in
which proprietary attributes have been added to the classic machine learning models. An
automated algorithm has been developed to select the attributes that contribute to the model
performance (accuracy). The output of the modelling and prediction is displayed as simple text
output in window-based GUI. The performance (accuracy) of the model developed in this
project is comparable or better than those published in literature.

29
References / Bibliography
1. Mahantesh, C. and Amogh P. (2015). Time Series Data Analysis for Stock Market Prediction using
Data Mining Techniques with R. International Journal of Advanced in computer Science, Vol6.
No.6, pp. 104-108.
2. Bruno, M. H., Vinicius A. S. and Herbert K. (2018). Stock Price Prediction using Support Ventor
Regression on daily and up to the minute prices. ScienceDirect 4, pp. 183-201.
3. Zahid Iqbal, R. IIyas, W. Shahzad, Z. Mahmood and J. Anjum. Efficient Machine Learning
Techniques for Stock Market Prediction. Int Journal of Engineering Research and Applications,
Vol. 3, Issues 6, pp. 855-867.
4. Mahajan Yogesh D. Optimization of MACD and RSI indicators: An Empirical Study of Indian Equity
Market for Profitable Investment Decisions. ResearchGate.org. Online published on 7 December,
2015.
5. Micheal W.Covel, Barry Ritholtz (2010). Trending Following, How to make a Fortune in Bull, Bear
and Black Swan Markets. US. Wiley
6. Alestair V., Harpreet T., Aquib S., Prosenjit B., Ashish R., Stock Market Prediction Using Time
Series. International Journal on Recent and Innovation Trends in Computing and Communication.
Vol. 4, issue 5, pp. 427-430
7. S. Shen, H. Jiand, T. Zhang., Stock Market Forecasting Using Machine Learning Algorithms. Cs229
stanford.edu online publication, 2012.
8. C. Mateus, M. Bagirov, Oil Price, Stock Markets and Firm Performance: Evidence from Europe.
SSRN Electronics Journal. DOI: 10.2139/ssm 2878119. 2017
9. Y. Lin, H. Guo and J. Hu. An SVM-based Approach for Stock Market Trend Prediction. Neural
Networks (IJCNN) The 2013 International Joint Conference, pp. 1-7, 2013
10. Youxen L., Kanyue Z., Yuchen L., Multi-Category Event Driven Stock Price Trends Prediction.
International Conference on Cloud Computing and Intelligence System (CCIS) IEEE, pp497-501,
2018
11. Indu K., Kiran D., Chetna U, Premlata Y., A Comparative Study of Supervised Machine Learning
algorithm for Stock Market Trend Prediction. Second International Conference on Inventive
Communication and Computation Technologies (ICICCT). IEEE, 1003-1007, 2018