Embed Size (px)
Citation preview

Journal of Financial Economics 20 (1988) 461-492. North-Holland
STOCK PRICES AND TOP MANAGEMENT CHANGES*
Jeroid B. WARNER and Ross L. WATFS U.~versity of Rochester, Rochester, NY 14627, USA
Karen H. WRUCK Harvard University, Boston, MA 02163, USA
Received .March 1987, fmal version received October 1987
This p ~ e r studies the association between a finn's stock returns and subsequent top management chAMes. Con~ieut w~th hmmml monitoring of management, there is an inverse relation between the probability of a management change and a firm's share performance. ~ relation can result from monitoring by the board, other top numagers, or b!oe?~older~. However, unless share performance is extremely good or bad, logit models have wo predictive ability. No average stock price reaction is detected a*. announcement of a top manasement change.
1. Introduefion
This paper investigates the relation between a firm's stock price perfor- mance and subsequent changes in its top management. A top management change is defined as any change in the set of individuals holding the title of chief executive officer (CEO), president, or chairman of the board. The major hypothesis is that the probability of a top management change is inversely related to stock price performance. Using a random sample of listed firms, the hypothesis is tested with a prediction procedure to exploit information on firms that do not experience a management change. In addition, standard event study methodology is employed to study stock price reaction to an- nouncement of management change.
The p~oer provides new evidence on mechanisms for removing inefficient managers and encouraging managers to act in shareholders' interests. Al- though external mechanisms such as the takeover market can serve this function [e.g., Manne (1965) and Fama and Jensen (1983)], there are poten- tially important internal mechani,~ms. One is monitoring by the board of
*We thank Ray Ball, Mike Barclay, Jim BricHey, Harry DeAngelo, Linda DeAngelo, Cliff Holdemess, Richard Leftwich, John Long, Bill Mecldin8, Krishna Palepu, Bill Schwert, Dick Vancil, Eric Wruck, Jerry Zimmerman, Andrei Shleifer (the referee), and Michel Jensen (the editor) for their comments on earlier drafts.
030~05X/88/$3,50©1988, Elsevier Science. Fubfishers B.V. (North-Holland)

462 J. Warner et al., Stock prices and management changes
directors [Fama (1980)]. A second is mutual monitoring among the firm's managers [Fama and Jensen (1983)]. A third is monitoring by holders of large share blocks [Sldeifer and ¥~shny (1986)]. If these mechanisms are effective, and if stock price performance reflects information on managers' efficiency, there w m be a negative relation between the probability of a top management change and share performance.
Results using logit analysis are strongly consistent with the hypothesized relation. However, unless performance is extremely good or bad, the logit models have no predictive ability. Top management changes following poor share performance can take a variety of forms. These include, for example, the replacement of current managers or the addition of new managers from inside or outside the firm. The result~ for CEO changes extend those reported elsewhere [Coughlan and Schm;dt (1985) and Weisbach (1988)].
Evidence on the specific functional form of the management change/share performance relation is also examined. Share performance relative to market performance is a better predicto~ of management changes than is the firm's stock return. These results ~,ugge~t that management is not held acc~ountable for some factors outside its control. However, examination of tJJe ti:rting of management changes indicates that any response to poor perforn~arce is not immediate and can take up to two years.
The event study results indicate that individual securities have a very small stock price reaction at announcement of a top management change. ,-'~ average effect is zero. For reasons discussed later, it is difficult to te~' hypotheses about management changes in the context of an announcement effect study. Results among seven such studies are contradictory./No attempt is made to resolve differences among these studies. However, the contrast between this paper's strong prediction and weak announcement effect results provides an example of i'ow hypotheses that focus on the prediction of an event can yield insights not available from a study of announcement effects. Further, absen_,:e of strong evidence that stock prices decrease on announce- ment indicates the logit results are not simply due to the market's anticipation of an unfavorable event (i.e., a management change).
Section 2 discusses the structta'~ of the firm's top management team and the relation between stock price performance and management changes. Data used to test hypotheses are described in section 3. Section 4 describes the. prediction methodology and results. Section 5 outlines the event study meth- odology and reports results. Section 6 summarizes the study, presen~ condu-
IFor their overall sample, three of the seven studies find sta~¢fically significant positive ~Onormal performance [see Bonnier and Bnmer (1986), Furtado and gozeff (1987), and Weisbach (1988)], three find no significant abnormal performance [see Borstadt (1985), Klein, Kim, and Mahajan (1985), and Reinganum (1985)], and one finds significang negative abnormal performance [see Furt~o 09~,6)1.

J. Warner et el., Crock prices and management changes 463
sions, and suggests possible extensions. An appendix contains details of the event study tests.
2. Stock perlonnanee and top nmnagement changes
This section discusses the structure of top management, signals about management performance associated with stock price changes, and different types of management changes.
2.1. The firm's top management
Top management is defined here as the set of individuals holding the title of CEO, president, or chairman of the board. For listed firms, top management most often consists of two individuals. 2 In such a case, one is chairman, tl'e other is president, and one of these individuals usually holds the title CEO.
Recognizing that top management is not res~cted to one individual raisf s the possibility that competition between top managers is an important force affecting management turnover. For example, there are cases in which the chairman/CEO tries to oust the president, and vice versa) Thus, while other empirical work on turnover emphasizes the role of the board of directors [see Cough_lan and Schmidt (1985) and Weisbach (1988)], the board is not the only force disciplining top managers. Monitoring by other parties, such as large blockholders [Shleifer and Vishny (1986)], can also result in management changes. 4 Since blockholders can be directors or serve as top ravagers, the forces of managerial competition, board monitoring, and block ownership seem interrelated. 5 Limited evidence on the role of these factors in observed management changes is discussed later.
2For this paper's sample of randondy :,elected New York and American Stock Exchange-listed firms, 65.7% had two team members in 1978 and 34.3% had o~ne. Prior to 1967, the majority o[ sample firms had o:~dy one individual as a top ma~,ager. Additional evidence of an increase in top management team .~e over time is presented in ~0ancil (1987, ~pp. A, exhibits 1.1-1.3).
31n Chock Full O'Nuts Corp., the chalrman/CEO was responsible for ~e ouster of the president (Wall Street Journal, November 12, 1969). In the case of American Metal Climax, the president won out in a three-year power struggle with the chairman and CEO, and the chairman resigned his position. The outcome cannot be attributed solely to competition between managers because nonmanager blockholders who had board seats also played a key role by supporting the president (Wall Street Journal, May 5, 1967).
4An example co~d be Le~ch Valley Industries. The president/CEO resigned after a policy dispute with the largest shareholder, who was chairman (Wall Street Journal, February 12, 1969).
SThe relation between blockholding and board directorship is recognized by Shleifer and Vishny (1986, p. 474, fn. 19).
464 .L Warner et al., Stock prices and management changes
2. 2. Information associated with stock returns
Although top managers' contribution to firm value is not directly observ- able, stock returns are a potential source of information. In an ef~cient market, however, stock return is a noisy measure of management performance. The return reflects only the unexpected component of top management performance and is influenced by a variety of exogenous factors.
Given the noise in stock returns, alternative sources of information, such as earnings reports, could provide measures more closely associatc.~l with man- agement performance. Some measures could incorporate information not reflected in stock returns. For example, the board, the top managers, and lower-level managers can obtain inside information from working closely with each other. Thus, any relation between stock returns and subsequent turnover understates the responsiveness of these parties to poor manager performance.
Tois paper's major testable proposition is that the probability of a top management change is inversely related to stock price performance. The proposition is a joint test of the hypotheses that information about manage- meat performance is reflected in stock returns and that such information is used in evaluating performance. That stock returns be used in evaluating performance is not a necessary condition for this proposition; it is sufficient that the performance measures used are correlated with stock returns.
To examine the extent to which management is held accountable for stock returns, the role of market and industry factors is explored. For example, suppose performance relative to the market is taken into account. Then for a given level of own stock return, better market performance indicates poorer relative performance and should be associated with a higher probability of a management change. Taking into account market and industry factors could be one way the responsiveness to a given stock return differs across firms. 6 Howevcr, a complete analysis of the cross-sectional deter~ninants of firms' responsiveness to stock performance is beyond the scope of this study.
2.3. Management changes following poor stock performance
Management changes occur for different reasons, and differ in their a priori relation with prior share performance. Some could follow good performance, and others could have no relation to prior performance. In either case, inclusion of such changes biases tests against finding an inverse relation between share perfol-mance and top management changes. To address this potential problem, several types of management changes are studied using information on the details of observed management changes.
6Weisbach (1988) extends this analysis and presents evidence that board composition is a determinant of cross.sectionrA differences in response to poor performance.

J. Warner et aL, Stock prices and management changes 465
,~brced departures. Termination of top manager's employment is more likely to be a response to poor management performance than are management. changes in general. Few management changes ate described as terminations in press announcements. As discussed later, however, it is possible to identify those cases in which the management change involves a top manager's leaving the firm~ and in which he is most likely to have been forced out as a consequence of poor performance.
Changes involving outsiders. Replacement of a team member or an addition to the management team can be made either by promoting a current lower-level manager or by hiring from outside the firm. Hiring an outsider involves potential costs not borne by the firm wi~ an insider. For example, the outside appointment can adversely affect insiders' incentives. If insiders revise down- ward their probability of achieving a top management position, their motiva- tion to perform is reduced [Lazear and Rosen (1981)]. In addition, to function effectively the outsider will have to acquire firm-specific human capital. Given the hypothesized costs, an outsider appointment must involve substantial benefits. These benefits are likely to be greater in situations where manage- ment p,,-*rformance is poor. A caveat is that some outsider appointments occur as part of a firm expansion into new areas in which the firm has no specific human capital. 7 If such firm expansion occurs after the firm has done relatively well, the predicted inverse relation between share performance and outsider appointments is reduced.
CEO changes. Previous work on turnover and performance focuses solely on CEO changes. This paper's definition of a top management change includes many changes htb.at are pl:obably fled to performance but do not involve a CEO. CEO changes are probably also linked to performance and are examined here. In addition, it is useful to distingttsh important from unimportant CEO changes. For example, Vancil (1987) argues that many CEO changes are part of the normal succession process; it is common for the chairman and CEO to pass the CEO title to the president, s This kind of CEO change is not included as a management change in this paper because it does not irtvolve a change in the group of individuals comprising top management. Title changes alone are less likely to be related_ to poor performance, and excluding them should
,..-eu~ical brought in a new president who had headed a large drug 7For example, Allied r,t. _ : company. The move was 'viewed as an attempt to strengthen Allied's move into consumer markets' (Wall Street .r.au.m~t, December 27, 1968). This chaage enters the paper's s~tpl~, and detailed information Is given in Vancil (1987, ch. 5, pp. 158-162).
Vavcii (1987, ch. 1, pp. 13-31).

466 J. Warner et al., Stock prices and management changes
enhance the ability t.o detect a relation between stock price performance and subsequent man~e~nent changes . 9
2. 4. An event study perspective
The major questions in this paper are best addressed by examining the association between stock p e r f o ~ and subsequent management changes. Additional information can be obtained using standard event study proce- dures to examine stock price reaction ~ound announcement of top manage- ment changes.
Stock price reaction at announcement. Stock price reaction at announcement of a management c[~ange can indicate whether the capital market considers the event significant. However, predictions about the sign of the abnormal stock price effect at a n n o u n c e ~ t are not precise even if the change is a response to poor performance, in shareholders' interests, and unanticipated. One reason is that announcement of a change can convey other inforn~tion. 1°
For example, suppose the extent of management's poor performance was not previously known to the market. Then abnormal stock return at announce- ment is the sum of two components. One is an information component that is negative if the change signals worse management performance than antic- ipated. The second is a real component that is positive if the change is in shareholders' interest. A positive net effect is expected only if the real component is larger in absolute value than the information component, n
Although each component is unobservable, it is possible to examine whether, on average, the sum of firm's information and real components is equal to zero. This is equivalent to testing for shifts in the mean of the cross-sectional distribution of abnormal returns. These tests can fail to det~¢ a mean stock price response W announcement ff some ~:~as have a positive response and others a negative response such that the average response is zero. To address
• this possibility, ~ests for shifts in the variance of excess returns are also employed, and indicate whether a stock price effect exists, regardless of its sign. Such tests are widely useA in the accounting literature [e.g., Beaver (1968)].
9However, even for title changes, there could be some relation if the timing of the change is discretionary, and a planned change is implemented sooner if performance is poor.
t°Although a similar problem arises in other types of announcement effect studies, it is very unclear in this case how to control for, or study, these effects.
xtB,~-~..-Aer and Brunet (1986) address this issue by sampling management changes where the firm has prior poor dividend and earnings performance. This should reduce any negative information component and increase the probability that the observed abnormal return measures the real componen:. Of the seven event studies of management change announcements, Bonnier and Brunet report the largest positive abnormal return on announcement. This is consistent with management change announcements having a positive real, but negative information effect.

J. Warner et al., Stock prices and management changes 467
Preannouncement performance. If poor performance leads to a management change, negative stock performance should be present before this event for a sample of observed changes. Examination of pre-event abnormal performance thus provides a useful check on the prediction results.
However, examining pre-event stock price behavior for a sample of observed management changes does not address some important issues directly. One is precisely how the probability of a management change depends on the level of stock price performance, and the relevant measure of performance. A related issue is whether stock price performance is a good predictor of a management change. In contrast, prediction procedures used in this paper examine these issues explicitly, with pot,,~atial gains from exploiting information on firms that do not experience a management change.
3. Data
3.1. Sample flrms
The sample consists of 269 firms listed on the New York and American Stock Exchanges (NYSE and AMEX) on July 2, 1962. Every sixth firm from alphabetical lists of exchange-listed firms is included, t2
3.2. Identifying top management changes
The names of each firm's CEO, president, and ch~i,-man are i-ecorded from Poor ' s Register of Corporations, Directors and Executives (henceforth Poor's). This procedure is repeated for each edition of Poor's from 1962 through 1980. Changes are identified by comparing management team composition across years. ~3 ' lop management changes involving only a reassignment of floes are excluded.
Additional information about changes is obtained by searching the Wail Street Journal (WSJ) Index for the years 1962 through i978. If a top management team change involves two or more individuals, it is treated as one change unless the W ~ indicates separate changes occurred at different dates°
"[here are 549 changes identified from Poor's. Of these changes, 333 are reported in the WSJ. An additional 18 changes not observed in Poor's are reported in WSJ, yielding a total of 351 WSJ changes. ~4 This paper's results on
12The first firm is chosen randomly. !mfsUy 272 listings are selected. T~-ee of these are investment trasts rather than operating firms and are dropped from ~ e sample.
13If a firm ceases to be reported in Poor's or to be exchange-fisted, subsequent changes do not enter the sample.
14For changes reported in the Wall Street Journal, mean firm size is twice that of changes reported only in Poor's. However, the median firm size is si~lar.

~,~68 J. Warner et al., Stock prices and management changes
Table 1
Number of top management changes by year, a time period: 1963-1978, sample of 269 randomly selected NYSE and AMEX firms.
Number of Number of changes Changes per firm sample at be t, lnnlnS All WSJ All WS./
Year of year changes changes changes changes
1963 269 53 29 0.197 0.108 1964 258 26 24 0.101 0.093 1965 241 66 33 0.274 0.137 1966 231 37 21 0.160 0.091 1967 221 48 26 0.217 0.118 1968 21! 28 14 0.133 0.066 1969 194 44 27 0.227 0.139 1970 185 36 30 0.195 0.162 1971 181 40 28 0.221 0.155 1972 174 36 23 0.207 0.132 1973 166 30 13 0.181 0.078 1974 161 26 17 0.161 0.106 1975 153 31 18 0.203 0.118 1976 148 23 16 0.155 0.108 1977 145 24 14 0.166 0.097 1978 143 19 18 0.133 0.126
Total Average
567 351 0.183 0.115
aA top management change is defined as any change in the set of individuals holding the rifles CEO, president, or chairman of the board.
the relation between stock price performance and management changes do not depend on which source is used to identify a change. Although the frequency of changes from each source is reported in this section, results ie the rest of the paper are based on changes reported in the ;VS./. is
Time series of changes. Table 1 shows the number of sample firms in existence at the beginning of each year and the number of changes in each year, for the 1963-1978 period. During this period, 91 of the 269 sample firms were delisted because of merger or because their shares were exchanged, and 41 were delisted because of liquidation or for other reasons. Because firms are dropped from the sample when they are delisted, table I shows more changes in e~lier years than in later years. However, the ratio of the number of top m~nagement changes to tF~ number of firms remaining in the sample is relatively stable across years at 0.183 for a~J 6h~ges and 0.I15 per year for WS./changes.
lSFor the logit procedures, similar results are obtained for the 218 changes reported in Poor's but not in the Wall Street Journal. Event study results for this sample cannot be examined because there is no Wall Street Journal article, and hcace no precise day or month of announcement.

J. Warner et aL, Stock prices and management changes 469
Table 2
Frequen~ distribution of number of top menagement ch,~ges, a time period: 1963-1978, sample of 269 randomly selected NYSE and AMEX firms.
Number of changes over sample period
Number of Number of surviving nonsurviving
Number of sample firms sample firms sample firms as of 1/1/79 as of 1/1/79
PanelA: AOtopmanagementchanges ( N m 567)
0 61 9 52 1 59 20 39 2 54 36 18 3 36 23 13 4 28 22 6 5 18 16 2 6 6 5 1 7 4 3 1 8 2 2 0 9 0 0 0
10 1 1 0
Totals 269 137 132
Panel B: Top management changes reported in the Wall Street Journal ( N = 351)
0 107 24 83 1 68 40 28 2 46 37 9 3 23 13 10 4 11 10 1 5 8 7 1 6 4 4 0 7 2 2 0
Totals 269 137 132
aA top r,~anagement change is defined as any change in the ~ t of ;..--a;...vid ,-ue.L~ holding the titles CEO, president, or chaLnnan of the board.
Table 2 reports the number of changes per firm (panel A) and the number of WSJ changes per firm (panel B). Of the 137 firms surviving the entire sample period, 9 (7%) have no top management changes and 20 (15~;) have only one change. The corresponding numbeJ~ fo~ WSJ changes axe ,.-, "~ ~.,,~1 ~,,p and 40 (29%).
3.3. Identifying forced departures
Whether a change involves a CEO, an outsider, or a top manager !eaving the firm is readily determined from the WSJ article and Poor's. However, identification of forced departures ls diSeuit because press releases rarely

470 J. Warner et al., Stock prices and management changes
Table 3
Stated reasons for a manager leaving top ms~agement a ~ reported in the Wall Streee Journal, b time period: 1963-1978, sample of 269 randomly selected NYSE aud AMEX firms.
Retirement "i 2 Assume other position in firm 57 No reason 35 Control change 13 Death 19 Poor performance 10 Other interests 7 Take other position 6 Health 5 Policy difference 5 Fired 1
Total 230
aTop management is defined as the set of individuals holding the titles CEO, president, or chairman of the board.
bAs many as two reasons per reported change are recorded. The 230 reasons reported represent 220 top management changes.
describe them as such. To isolate changes most likely to have been forced departures, details of the WS,/ articles are examined. As discussed below, changes are included in the forced departure sample if they involve a top managers' leaving the firm and the reason in the WS, Y article appears con- sistent with a forced departure.
Table 3 gives the distribution of reasons reported in the WS:I for managers' leaving the top management team. Of the 351 changes in the sample, 220 involve at least one top manager's leaving the team. These 220 changes involve 230 departees.
The most commonly reported reason is retirement. This term could be a euphemism for a forced departure. This possibility is investigated by using birthdates reported in Poor's to calculate the ages of managers !ea~.ng the team. Poor's yields 59 birthdates for individuals described in the WSJ as retiring and 103 birthdates for departees not described as retiring. The ages of individuals described as retiring are symmetrically distributed around the age commonly used in retirement policies (65); the modal and median ages are both 65 and the mean age is 65.6. Further, age is relatively tightly distributed around 65. These numbers suggest a substantial proportion of reported retirements are m fact retirements. This impression is reinforced when the retiree's age distribution is compared with the age distribution of departees who are not described as retirin~ Departees not described as retiring are generally younger. Their mean age is 59.5. Their median and modal ages are 59 and 53, respectively. The t-statistic for the difference in mean ages of

J. Warner et al., Stock prices and management changes 471
retirees and other departee$ is 4.3. Given this evidence, reposed retirements are e~:eluded from the forced departure sample°
The second most commonly reported reason for an individual's leaving the top management team is that the manager is taking another position in the firm. Since most of these changes involve a part-time position and ate similar to retirements, they are excluded from the forced departure sample. 16 Simi- larly, the 13 cases in which a top management change occurs at the same time as a transfer of a block of common shares (a control change) are excluded from the forced departure sample. These changes probably involve external disciplining of the board and top management. Fi~lly, ill health and death are unlikely to be internal mechanisms for removing nonperforming managers. Changes ir .~Ang those reasons are excluded from the forced departure sample.
Exclusion of changes that have death, health, retirement, assumption of another position within the firm or a control change as the reported reason resets m a sample of ~ ~ r ~_u~gement changes classified as forced departures. F.ach change involves one individual. Reported reasons for these changes include poor performance (10), t7 pursue other interests (7), take a position outside the firm (6), policy reasons (5), and fired (1). For 35 depar- tures no ~e.:lson is reported and these are also classified as forced departures.
Details of forced departures. To provide additional evider~ce on the underlying reason for a management change, each W&I article for the forced departure subsample is studied. Details of the process leading to the departure are typically sparse, but are consistent with the change resulting from internal monitoring by blockholders, managers and/or the board. !n 15 of the 64 departures a blockholder is identified in the WSJ. Is In six of these the blockholder plays an active role in the change. 19 The active blockholder is another corporation in three cases and the chairman in two cases. In the sixth case two b!ockholders successfully back one top manager in a power struggle against another. In another two departures, the article suggests the change was
rein a few cases the change is an apparent demotion (e.g., from CEO to division head).
l~In all ten cases poor earnings are mentioned in the report. In two cases (Argus, 8/29/69, and Chock Full O'Nu~, 2/8/65) statements by the firm hold the departing manager responsible.
lSIn two cases the blockholder is identified from previous management change articles.
19Blockholders are defined as playing an active role when: (i) the management change is described as evidence the blockholder is becoming more involved in managing the company; (ii) the blockholder is described as having a co~rontation or policy difference with, or being unhappy with, the depanee; or (iii) the bl~khoider is described as supporting another top manager in a power struggle with the departee. The board as a whole is re~arded as being involved when the board in general is described as deciding a new manager is required.

472 J. Warner et al., Stock prices and management changes
Table 4 Proportion of top management changes with selected characteristics, a time period: 1%3-1978,
sample of 269 randomly selected NYSE and AMEX firms.
Proportion of top Characteristic management changes
PandA: All top management changes ( N = 567) Outsider brought in b CEO l~lacod c A top manager departs Outsider brought in & CEO replaeed Outsider brought in & a top manager departs CEO replaced & a top wangler departs
0.19 0.29 0.64 0.08 0.12 0.21
Panel B: Top management dumges reported in the Wall Street Journal (N -- 351) Outsider brought in b CEO r~la~t © A top manager departs Ouudder brought in & CEO replaced Outsider brought in & a top manager departs CEO replaced & a top manager departs
0.19 0.36 0.59 0.11 0.12 0.24
a A top management change is defined as any change in the set of individuals holdin~ the titles
C l • b O A n , president, or chairman of the board. outsider is defined as a newly appointed member of the top management team whose
previous en~k~y-~-ent is outside the tirol ©CEO replaeement is defined as a top management change in which a new CEO is appointed or
the CEO title is created for a new top manager.
initiated by the board as a whole. In one of these, the board chairman is a major blockholder.
3.4. Summary statistics for subsamples
Table 4 shows the relative frequency of CEO replacements, outsider changes, and managers leaving the firm for the full sample of 567 changes (panel A) and for the sample of 351 WSd changes (panel B). Differences between the samples seem small. The relative frequency of outside appointments and managers leaving the firm is similar in the Poor's and W S J subsamples and the relative frequency of CEO replacements is only slightly greater in the W S J sample. Outside appointments have a relative frequency of 0.19 in both samples and managers leaving the fh,~ have a relative frequency of 0.64 for the full sample and 0,59 for the W S J sample. The relative frequency of CEO replacements is 0.29 in the full sample and 0.36 for the ~ T J sample. The relative frequency of changes involving both a CEO change and a manager leaving the ~ m is also slightly greater for the WSJ sample (0.24) than for the full sample (0.21).

J. Warner et al., Stock prices and management changes 473
4. Predicting top management changes
The relation between the probability of a top management change and various measures of stock performance is estimated using logit regressions. The dependent variable is one if a top management change occurs during the period in question and zero otherwise. Independent variables are measures of stock pri~..'~ performance.
The magnitude and duration of share performance req,.fired to affect the probability of a management change are not apparent a priori. Thus, perfor- mance is measured over various periods. Depending on the specific model a period is defined as one quarter, a half-year, one year, two years, or three years. The independent variables are own stock return, lags of owe stock return, market return, and lags of market return. For contemporaneous and lagged own stock return, the expected coefficient sign is negative. It is hypothesized that poorer performance is associated with an increased prob- ability of a nmnagem~t ch~.b.~n-ge. For contemporaneous and lagged market return, the expected coefficient sign is positive. For a ~ven level of own stock return, better market performance indicates poorer relative performance and should be associated with a higher probability of a management change. To save space, only those results based on half-year and one-year periods are presented.
4.1. Baseline results
Table 5 presents logit regression results using annual data under four definitions of a management change. 2° These are 1) all WSJ changes, 2) CEO changes, 3) outsider changes, and 4) changes classified as forced departures. 21 The independent variables are own stock return, three lags of own stock return, market return as measured by the return to the Center for Research in Security Prices (CRSP) equally-weighted market index, and three lags of market return. As discussed below, baseline results indicate there is a response to s~,re performance in the predicted direction. Ho~vever, the lag between performance and a management change can be up to two years.
The logit model produces s'|'c:~aificant results for all types of change except outsider changes. 22 As predicted, for all types of changes the sign of the coefficient on own return variables is negative. The coefficient on the current
2°The underlying data are pcx~ied cross-section and time-series data. A sinsle firm p r o ~ s many regression observations as periods it survives between 1963 and 1978. For example, a firm surviving from 1963 through the end of 1970 accounts for eight observations in models based on annual performance and 16 observations in models based on six-month performance.
21 Changes due to death or ill-health and control changes are excluded from all four categories.
22For all WS/changes the model p-value is 0.07; it is 0.01 for CEO changes and forced departures. For outsider changes the model p-value is 0.50.

474 J. Warner et al., Stock prices and management changes
Table 5
Estimated lagit models for selected types of top management changes based on annual measures of firm performance, a 351 top management changes reported in the Wall Street journal, time
period: 1963-1978, 2160 observations.
Coefficient estimates (p-values)
All WSY CEO Outsider Forced Vndependent Expected changes changes c changes d departures e variables b sign (N -- 247) (N = 87) (N = 42) (N = 43)
Intercept - 2.04 s - 3.22 s - 4.01 z - 4.22 z (0.00) (0.00) (0.00) (0.00)
Return - - 0.42 z - 1.17 s - 0.88 f - 1.37 s (0.02) (0.00) (0.07) (0.01)
Lag one - - 0.36 s - 0.28 - 0.41 - 0.64 (0.05) (0.34) (0.34) (0.19)
Lag two - - 0.09 - 0.49 r - 0.50 - 0.30 (0.50) (0.08) (0.22) (0.36)
Lag three - -0.09 -0.16 -0.07 0.00 (0.52) (0.4s) (0.81) (0.99)
Market return + 0.57 f 1.23 s ~ 1.19 1.84 s m,~.wyng~ (0.02) (0.12) (0.0i)
Lag ~ + - 0.~,~ - 0.25 0.15 - 0.53 (0.91) (0.65) (0.84) (0.54)
Lag two + 0.21 0.56 0.56 1.808 (0.51) (0.30) (0.45) (0.01)
Lag three + 0.14 0.34 0.26 0.04 (0.68) (0.54) (0.73) (0.96)
Sign~cance of model, p-value 0.0681 0.0119 0.4951 0.0141 a A ,.x top management change is defined as any ehanse in the set of individ~aL¢ holding the titles
CEO, president, or chairman of the board. bReturns to the firm's stock age measured over one calendar year. Market returns are measured
over one calendar year and are returns to the CRSP equally-weighted market index. CA CEO change is defined as a top management change in which a new CEO is appointed or the
CEO position is created for a new top manager. dAn outsider change is defined as a top management change in which a newly appointed
member of the top manasement team was not previously an employ~ of the .fi_rm~. eA forced departure is defined as a t fp manager leaving the firm_ .with no reason reported for the
departure or the reported reason is poor performance, other interests, take a position with another firm, policy difference, or firing,.
tSignilicant at 0.10 level. gS~J~ificant at 0.05 level.

J. Warner et al., Stock prices and management changes 475
year's own return is statistically significant for a~l categories. For all WSJ changes, lag one return is also significant. When a market return variable is significant, the coefficient is positive, as predicted. Current-year market return has a significant positive coefficient for all categories except outsider changes. However, the only significant lagged market return variable is the lag two market return for forced departures.
From table 5, the impact of stock price performance on the probability of a management change is larger for CEO changes, outsider changes, and forced departures than for WSJ changes. The coefficient on the current year's own return is - 1.37 for forced departures, - 1.17 for CEO changes, and - 0.88 for outsider changes, but only -0 .42 for all WSJ clumges. For the current year's market return the estimated coefficient is 1.84 for forced departures, 1.23 for CEO changes, and 1.19 for outsider changes, but only 0.57 for all :4rSJ changes. The estimated coefficients reported for each type of change are significantly different at the 0.01 level from ~ e ~im~j,~,-I coefficient for all WSJ changes. Differences in the magnitude cf estimated coefficients between all WS./changes and forced departures indicate that the forced departure subsample exhibits a stronger relation between share performance and man- agement changes than other types of changes. 2s
Table 6 presents results based on half-year periods of performance. The qualq'tative conclusions are similar to those using annual data, a l thou~ the models do not work as well. 24 Coefficient estimates are generally negative for own return variables and positive for market return variables, though not as consistently so as in annual models. Foz forced departures, current own return, lag one and lag two returns are si~ificant. For all WSJ changes lag one and lag two returvs are significant. For outsider changes only lag two return is significant. For r~.O changes none of the half-year measures of performance are s i ~ ~fi¢~ ,~t. Market return meas l e s are not significant in any of the models, itesults are consistent with share performance affecting the probabil- ity of a management change within two years of, but ~ot concurrent with, the performance.
4.2. Examining the goodness of fit of the logit model
Underl3~ng the coefficient estimates in tables 5 and 6 is the assumption that. the probability of a management is well described by the logistic function. To explore further the appropriateness of the logit model, for each year from 1963 through 1978 each firm is assigned to a decile based on that year's ranked own
23Whell the logit model is re-estimated excluding the 11 firms for which poor performance ¢." firing is the reported mason for the departure, the results for each sample are similar to those reported in table 5.
24Model p-values are 0.13 for all WSJ changes, and 0.28, 0.76, 0.02 for CEO changes, outsider changes, and forced departures, respectively.

476 J. Warner et al., Stock prices and management changes
Table 6
Estimated logit models for selected types of top management changes based e~ six-month firm performance, a 351 top mmagement changes reported in the Wall Street Journal, time period.
1963-1978, 5074 observations.
Coefficient estimates (pvalues)
All WYJ CEO Outsider Forced Independent Expected changes changes ¢ change sd d e p ~ e s e variables b sign (N ffi 294) ( N ffi 109) ( N ~- 57) ( N = 57)
~ t t e r e ~ t - 2.77 s - 3.83 s - 4.508 - 4.528 (0.00) (0.00) (0.00) (0.00)
Return - - 0.20 - 0.53 0.14 - 1.02 ~ (0.36) (0.17) (0.71) (0.09)
Lag one - - 0.49 s - 0.41 - 0.08 - 1.28 s (0.04) (0.26) (0.85) (0.03)
Lag two - - 0.58 s - 0.31 - 1.04 f - 1.30 s (0.02) (0.43) (0.08) (0.04)
Lag three - -0 .11 -0 .15 -0 .28 -0 .25 (0.59) (0.65) (0.43~ (0.60)
Market return + 0.22 0.57 0.28 0.53 (0.56) (0.36) (0.71) (0.55)
Lag one + 0.39 0.80 - 0.29 0.88 (0.32) (0.18) (0.74) (0.32)
Lag t~o + 0.32 - 0.71 0.61 0.02 (0.43) (0.30) (0.49) (0.98)
Lag three + 0.09 0.4S - 0.22 - 0.83 (0.81) 0.45) (O.79) (0.31)
Sit, ni,'icance ot model, p-value 0.1255 0.2834 0.7571 0.0212
aA top management chanbe is defined as any change in the set of individuals holding the floes CEO, president, or chairman of the board.
bReturns to the firm's stock are measured over six calendar months. Market returns are measured over six ca lend~ mon*.hs an-d ~ returns to the CRSP equally-weighted market index.
CA CEO change is defined as a top management change in which a new CEO is appointed or the C~ position is created for a new top manager.
¢ t l A ~ outsider change is defined as a top management change in which a newly appointed member of the top management team was not previously an employee of the firm.
CA forced departure is defined as a top manager leaving the firm ~ t h no reason reported for the departure or the reported reason is poor performance, other interests, take a position with another
, policy difference, or firing. a. nificant at 0.10 level.
sSignificant at 0.05 level.

J. Warner et al., Stock prices and management changes 477
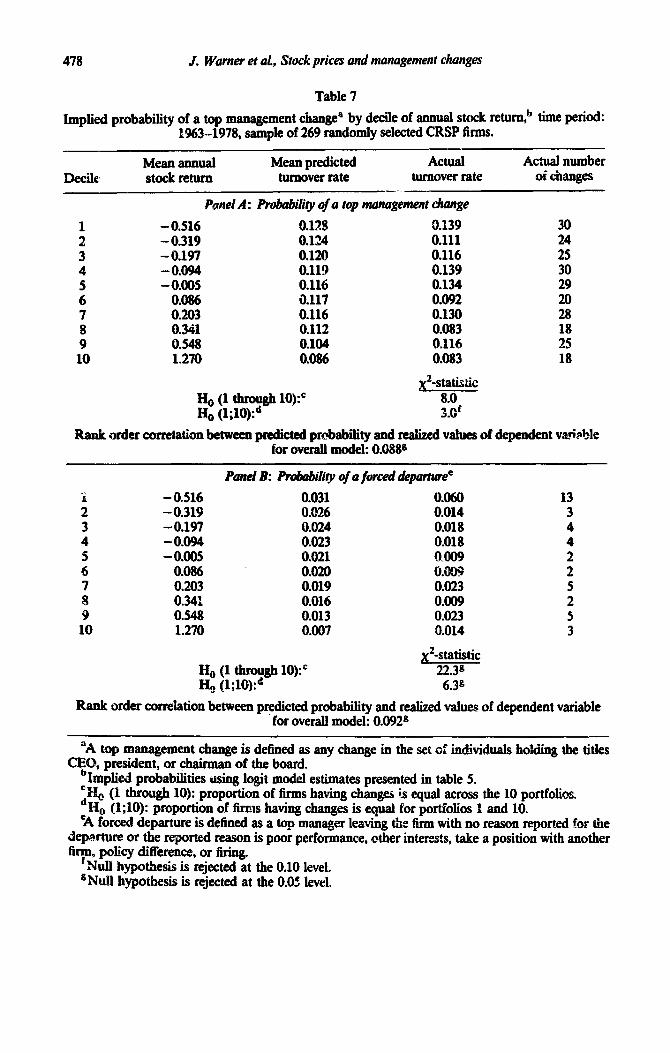
stock return. Within a decile, the implied probab'tlity of a management change is calculated for each observation from logit model coefficients in table 5. Implied probabilities are averaged within each decile. The mean probability for each decile is compared to the actual turnover rate; a X2-test is used to test for a difference in the actual number of changes across deciles ef performance. In addition, for individual observations a significant positive correlation is expected between predicted probabilities and the realiTed value of the depen- dent variable.
From table 7, it appears that only extreme levels of stock price performance affect the likelihood of a top management change. Panei A reports results for all WSJ changes when performance is measured on an annual basis. Mean annual own stock return ranges from -0.516 in the first decile to 1.270 in the tenth decile. The mean predicted probabilities decline monotonically from 0.128 for the group of worst pedormers to 0.086 for the best performers. Firms in the worst decile of performers are predicted to be about 1.5 times as likely to have a top management change as firms in the best decile of performers.
Consistent with predictions of the fitted logit model, the first and last deciles have the highest and lowest actual turnover rates of 0.139 and 0.083, respec- tively, and the difference is statistically si~ificant (X2= 3.0, significant at the 0.10 level). The rank order correlation coefficient between predicted probabili- ties and the dependent variable is 0.088 (p-value = 0.10). This positive associa- tion indicates that in an overall sense the model works well; the predicted probability is higher when the dependent variable is one and lower when it is zero. 25
However, across deciles actual turnover rates are not monotonically decreas- ing. For example, deciles four and five have higher turnover rates than two and three, even though their own return performance is better. The hypothesis that the turnover frequency is equal across all ten deciles cannot be rejected. The lack of monotonicity is inconsistent with the logit predictions. Even if the true relation is monotonic, however, such a fmdino ~ could be the result of measurement error. The act'a~ frequency of changes within a decile is only an estimate of the expected frequency conditional on a given level of perfor- mance. If the variance of the estimate for each decile is large in relation to the across-decile variation in the true conditional expected frequency, some ap- parent departures from monotonicity will be observed.
Data for the forced departure sample are presented in panel B of table 7. 26
Again, the average "~redicted probability decreases monotonically, from 0.031
25Within-decile rar~ order correlations are also examined. For deciles one, four, and seven the correlation is positive and significant at the 0.05 level. For all other decries the correlation is positive but insignificant, with the exception of ~ecile ten, where the correlation is slighdy negative ( - 0.005, p-value = 0.90).
2eDecile-based results for CEO changes ~ d ,J,~:~er changes are similar to results for ",d] ~ changes,
478 J. Warner et al., Stock prices and management changes
Table 7
Implied probability of a top management changea by deciIe of annual stock return,,, time period: 1%3-1978, sample of 269 randomly selected CRSP firms.
-_ Mean annuaI Mean predicted Actual Actual number
Decile stock return turnover rate turnover rate of changes --
Panel A: Probability of a top management change
:. - - 0.516 0.319 0.128 0.124 0.111 0.139 30 24 3 - 0.197 0.120 0.116 25
: -0.005 - 0.094 0.119 0.116 0.139 0.134 30 29
6 0.086 4117 0.092 7 0.203 0.116 0.130 z 8 0.341 0.112 0.083 18 9 0.548 0.104 Ol16 25 10 1.270 0.086 0.083 18
+statistic He (1 through 10):’ Ha (l;lO)+
8.0. 3.0’
Rank order correlation between predicted probability and reahaed values of dependent va.+bIe for overah model: 0.088s
i - 0.516 0.031 2 - 0.319 0.026 3 - 0.197 0.024 4 -0.094 0.023 5 -0.005 0.021 6 0.086 0.020 7 0.203 0.019 8 0.341 0.016 9 0.548 0.013 10 1.270 0.097
Panel B: Pr&biliiry of a forced departwee
:E iO18 0.018 0.009 O.ON 0.023 0.099 0.023 0.014
x*-statistic 22.3s 6.3s
13 3 4 4 2 2 5 2 5 3
Rank order correIation between predicted probability and realized values of dependent variable for overall model: 0.0929
“A top management change is defined as any change in the set of iudividuab holding the titles CEQ president, or chairman of the board.
bImplied probabilities using logit model estimates presented in table 5. iI-& (1 through 10): proportion of firms having changes is equal across the 10 portfolios.
He (1;lO): proportion of firms having changes is equal for portfolios 1 and 10. ‘A forced departure is defined as a top manager leaving the firm with no reason repo-rted for the
departure or the reported reason is poor performance, other interests, take a position with another fiy policy difference, or tiring.
NuII hypothesis is rejected at the 0.10 level. gNulI hypothesis is j re ected at the 0.05 level.

J. Warner et al., Stock prices and management changes 479
in decile one to 0.007 in decile ten. A X2-test shows that the difference in the actual turnover rate between deciles one and ten ~ significant at the 0.05 level. The rank order correlation of 0.092 (p-value--0.05) between predicted prob- abilities a_n_d the dependent variable is consistent with the logit predictions. 27 However, the difference in actual turf ,¢er across deciles is driven by decile one. The turnover rate t~:~ere is 0.060, almost three times that in any other decile and twice the predicted probability under the logit specification. As in panel A, unless performance is extreme, the model has no predictive ability. Furthermore, a turnover rate of 0.06 for firms m the lowest decile of perfor- mance indicates that even conditional on poor performance, the likelihood of a forced departure is not high. Coupled with earlier results that the lag between performance and a management change can be up to two years, the evidence indicates that management turnover is not highly sensitive to poor share performance.
4.3. Sensitivity analyses
Industry factors. In addition to own stock return and market return and their lags, both industry return and lagged industry return, measured as the return to all firms with the same two-digit SIC code, are included as independent variables. As with the market return, the expected sign of industry return and lagged industry return variables is positive. In logit regressions, industry, return variables are typically insignificant. 28 Signs of own return, market ~eturn, and their lags remain negative and positive, respectively, but their statistical significance is reduced. Use of an industry index appears to add noise, rather than explanatory power, to the model. Either industry performance is not associated with measures used to evaluate managers, or two-digit SiC-code- based measures ~ e very noisy.
Alternative st6ck performance benchmarks. An alternative approach is to use a standard share performance measure and its lags as independent variables in logit regressions. Results using mean adjusted own return, market model abnormal return, or a market ~nd industry adjusted abnom~ ! return also indicate a negative relation between the probability of a m~agement clmnge and performance. However, no alternative measure provides additional ex- planatory power over results presented in tables 5 and 6.
2~The strength of the correlation varies widely across dedles. Deciles one and three have the strongest correlations, with values of 0.197 and 0.180 (both significant at the 0.05 level), In decile eight, the correlation is negative (-0.121, p-value = 0.10).
2SThe exception is lag one industry return in the CEO changes model. It is sigrdficant!y v,w,~ted sign. negative, the opposite of ~ e -..a.

480 £ Warner et al., S t~k prices and management changes
Alternative definitions of forced departures. In addition to the definition of forced departures used in tables 5 through 7, an alternative definition of forced departures is constructed based on the age of the manager leaving the firm. As in tables 5 through 7, departures except those due to death, ill-health, or control change are inclt~ded as forced departures. In addition, departures in which the departee is either 64 or 65 years old are excluded. Assuming the closer the departee is to 65 years old the more likely the change is a routine retirement, this definition could better identify changes due to poor perfor- mance that are camouflaged in press reports. Ren~oving changes in which the departing manager is 64 or 65 does not significantly affect results. Using the reported reasons for departure in the WSJ appears to be a more effective way of isolating management changes associated with poor performance.
Unconditional turnover and firm size. Results presented in sections 4.1 and 4.2 do not address the issue of how turnover rates vary across firms independent of the level of performance. To the extent that systematic differences in unconditional turnover are not controlled for, noise is injected into the analysis. Though a complete analysis is beyond the scope of this study, the data provide an opportunity to examine one variable that could be important in understanding differences in unconditional turnover rates across firm¢, namely, finn size.
When the natural log of firm size 29 is included in the logit analysis as an explanatory variable, the coefficient is sitmificantly positive for all WSJ changes and forced departures. It appears that larger firms have higher 'normal' management turnover. Perhaps their promotion and retirement poli- cies are designed to ensure shorter tenures in top management positions. Mothe r potential explanation is simply that larger firm_s have larger manage- ment teams. With a larger team the probability of at least one change is increased. However, a positive correlation between firm size and management team size does not fully exp!~n thee results.
To control for the size of the management team, the number of top managers is also included as an independent variable. ~° The coefficient on the team size variable is significant and positive for all categories. The coefficient' on firm size remains positive and statistically significant for all WSJ changes and forced departures. For outsider changes the coefficient on firm size is significantly negative, even ~ter controlling for the size of the management
2°Firm size. is measured as the sum of the market value of equity and the beok value of long-term debt.
~Logit regressions for CEO change~ control for differenc,~; in management team size because a firm has only one CEO. Firm size has an insi~nificaot coefliciem in the CEO changes category. Similar evidence is provided in Comment (1985, tables 23 and 24). He finds that firms with larger numbers of officers and managers have nigher turnover in the top management team, but not in the CEO position.

J. Warner et al., Stock prices and manager,~ent changes 481
team. This is ~ns i s t en t with Furlado and Rozefl" (1987), who raise the possibility that large firms are less likely to go outside the firm to recruit ~ew managers because they have access to a bigger internal market for managers. 31
5. Event study results
,5.1. Statt~iical methods
Standard event study methodology is employed to analyze stock price behavior a round the announcement of a top management change. Market model prediction errors are used to measure unusual stock price performance for each firm. Both daily and monthly prediction errors are examined. Proce- dures for assessing the statistical significance of the prediction errors are outlined below. Details are provided in the appendix.
For various event periods, prediction errors are averaged across sample firms. To assess the statistical significance of mean prediction errors, a s tandardized test statistic is constructed. Each prediction error is standardized by the square root of its estimated forecast variance. The mean of these s tandardized prediction errors has a distribution that is ~pproximately unit normal under the null hypothesis that the m ~ n standardized prediction error is equal to zero. 32
To test for unusual stock F2ice performance independent of sign, mean standardized squared pre¢~Action errors are examined. The test statistic used to assess the significance of the mean standardized squared prediction error has a theoretical distribution that is approximately unit normal under the null hypothesis that the mean prediction error equals zero and there is no va,'iance change at announcement. In the absence of unusual performance, the expected value of the mean standardized squared prediction error is one. 33
3ZLogit models run separately on firms smaller and larger than the median size in~cate a possible difference in their response to share performance. Results indicate own return, not market return, is important in explaining the probability of a management change for small firms. Market return, not own return, is important in explaining the probability of a management change for large firms. These results could merely indicate that a large firm's return is more highly correlated with the market index than a small firm's re t~ .
32See Dotld and Warner (1953. p. 43~ 33Simulation evidence raises the possibility that this test sta~stic misstates the significance level,
rejecting the null hypothesis too often [Dodd, Dopuch, Holthausen, and Leftwich (1984, p. 37)] To address this potential problem, this paper reports rankings of mean standardized squared prediction errors relative to their empirical sampling distribution during a 90-day period surround- ing announcement. To check whether results are driven by a few ob~r~ations, values of -,edi~al standardized squared prediction errors are also reported and ranked relative to their empirical sampling distribution. This procedure understates the significance of announcement day results if there is a generalized variance increase during this 90-day period.

482 J. Warner et al., Stock prices and management changes
5.2. Results: Daily abnormal performance
Table 8 shows abnormal performance for 90 trading days around WSJ announcements of top management changes. 34 Generally, there are no sub- stantial share price movements in response to announcement of a top manage- ment change.
Results for all WSJ changes. For the sample of al~ WS:! changes, there is no evidence of average abnormal performance before or at announcement. In the period comprising days - 1 and 0, the mean prediction error is 0.31~ with a z-statistic of 1.36. The cumulative mean prediction error from days - 5 9 through 0 is 1.25~ (z-statistic = 1.27).
Variance shift tests indicate a small security price reaction at the announce- ment of a top management change. The mean standar~tized squared prediction error for the - 1 to 0 interval is 1.39, ranking fourth highest among two day periods over the - 5 9 to 30 interval. The median standardized squared prediction error is 0.62 and ranks second. Although these results are statisti- cally significant, they seem economically unimpressive. For e~mmple, the mean absolute two-day prediction error increases only about 15~ c~:~nditional on announcement, from 2.37~ to 2.73~$. The increase in mean absolute prediction error is only about an eighth of a point on a $50 stock.
There is some evidence of a postaunouncement stock price drop. The mean cumulative prediction error is -1.75~ for days 5 through 30 (z-- -2.69). However, the price movements are not concentrated in the days imrned~tely following announcement; from days + 1 through + 4 there is no unusual stock price movement. The lag between announcement and the appearance of negative abnormal performance is surprising given the earlier finding of a variance shift on announcement. There is a possibility that the negative abnormal performance is unrelated to the announcement. As discussed later, the evidence on postannouncement stock price drop is stronger when it is examined in detsi!o Because the sample has no obvious ex post selection bias, the possibility of a profitable trading rule (ignoring transactions costs) from going short at announcement cannot be dismissed.
Results for other types of changes. Examination of particular types of changes yield pi - -~ ~ r . , ~ , ! o s a ct~e nf_. abnormal__ returns ~.~,....,.~;,,,ao- t o~. ~,.,. ....¢,,- ....-n W~J ch~ges . . ,.u,,. 8 shows results for CEO changes, outsider changes, and forced departures. Only the outsider changes category has a significant mean response over days
34"1"o eliminate any confounding effects, announcements of top management changes where another announcement is made simultaneously (e.g., earnings or dividend announcements) me excluded from the event study analysis.

J. Warner et al., Stock prices and management changes
~.~. .~ ~ ~ !
~ , , _ , . ~ . • o . ~ , ~ . ~ .
~ ~ ~ • ~ ~ . ~
I I I . ~ e,l ,~l. ~,~
I
483
484 j. Warner et al., Stock prices and management changes
- 1 through 0. Here the response is small. The mean prediction error is 0.34~; (z - 2.02) and the median is 0.59~. 35
in all cases there is evidence of a variance shift at days - 1 to 0. Negative abnorm~ performance is detected following announcement, but is not con- centrated in or confined to the days immediately following announcement. For example, in the for~od depa~are subsample, the cumulative mean prediction error for days 5 through 30 is -4.30~; (z = -2.37). The one exception to the generally similar behavior for subsamples is for forced departures, where there is weak evidence of negative abnormal performance in the weeks preceding the announcement of a top management change. For days - 5 9 through -6 , the cumulative mean prediction error is -1.08~ (z = -0.63). This result hints at the e.artier prediction result that changes classified as forced departures are more likely to have involved poor management performance and to have been preceded by poor stock performance.
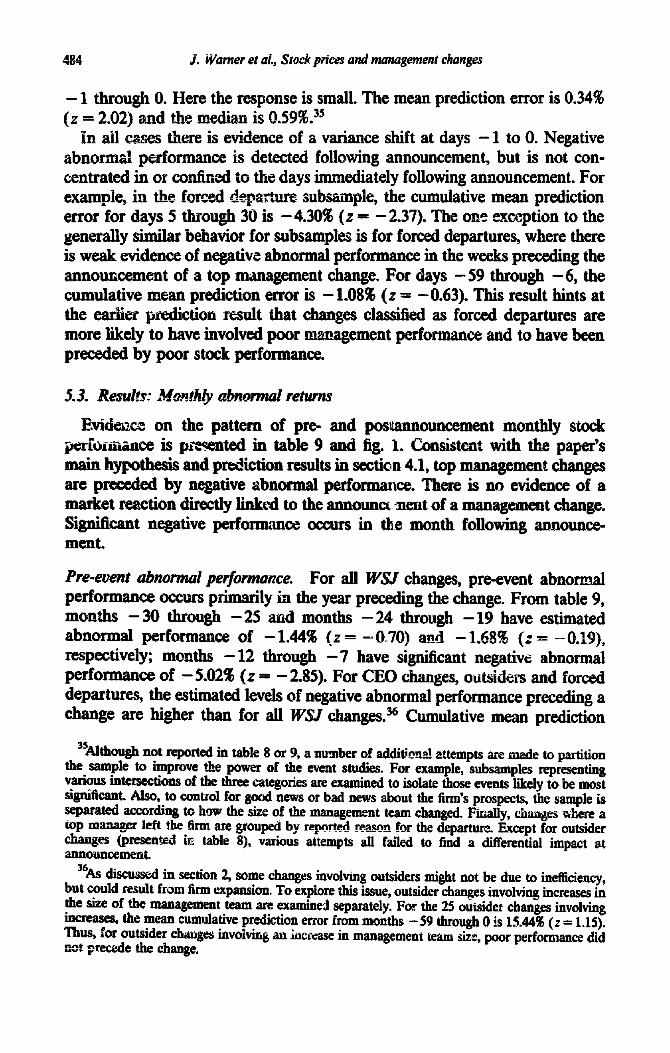
5.3. ResulLt: Monthly abnormal returns
Evidence on the pattern of pro- and pos~anouncement monthly stock peffot'a~mce is p~-esented in table 9 and fig. i. Consistent with the paper's main hypothesis and prediction results in secticn 4.1, top management changes are preceded by negative abnormal performmice. There is no evidence of a market reaction directly linked to the announca .~aent of a management change. Significant negative performance occurs in the month following announce- ment.
Pre-event abnormal performance. For all WS,/changes, pre-event abnormal performance occurs primarily in the year preceding the change. From table 9, months - 30 through - 25 and months - 24 through - 19 have estimated abnormal performance of -1.44~ (z - - -0 .70) and -1.68~ ( z=-0 .19 ) , respectively; months - 1 2 through - 7 have significant negative abnormal performance of - 5.025 (z - - 2.85). For CEO changes, outsiders and forced departures, the estimated levels of negative abnormal performance preceding a change are higher than for all WS] changes. 36 Cumulative mean prediction
3SAlthough not reported in table 8 or 9, a number of addit~on~ attempts are made to partition the sample to improve the power of the event studies. For example, subsamples representing various intersections of the three categories are egamined to isolate those events likely to be most significant. Also, to control for good news or bad news about the firm's prospects, the sample is separated according to how the size of the management team changed. Finally, chauges where a top manager left ",he firm are grouped by r%po_rted r~_~n for the departure. Except for outsider changes (presented ~ table 8), various attempts all failed to find a differential impact at announcement.
36As discussed in section 2, some changes involving outsiders might not be due to inefficiency, but could result from firm expansion. To explore thi~ issue, outsider changes involving increases in the size of the management team are examine-.I separately. For the 25 outsider changes involving increases, the mean cumulative prediction error from months - 59 through 0 is 15.44~ (z = 1.15). Thus, for outsider changes involving an iac~ease in management teant size, poor performance did not precede the change.

J. Warner et al., Stock prices and management changes 485
Table 9
M e a n pe rcen t p red ic t ion errors and measures o f var iance change a round the m o n t h o f a top m a n a g e m e n t change , a t ime per iod: 1963-1978. M o n t h 0 is the ca lendar m o n t h o f the Wall Street
Journal announcement , b
All W S J C E O Outs ider Forced changes replaced changes depar tures
(N -- 276) (N -- 91) e (N = 46) d (N -- 53) e
Even t m o n t h s Mean p red ic t ion er ror (%)
- 36 to - 31 0.05 1.18 - 2.29 - 3.49 - 30 to - 25 - 1.44 - 5.49 - 3.62 - 9.39 f - 24 to - 19 - 1.68 - 2.23 - 1.93 - 5.64 - 18 to - 13 0 .7I 1.38 1.02 - 2.92 - 12 to - 7 - 5.02 z - 6.67 f - 7.18 g - 14.67 g
- 6 - 0.06 - 0.57 1.31 1.28 - 5 - 0 . 9 1 0.38 - 1.15 - 2.40 r - 4 - 0.01 - 0.38 - 2.60 - 1.87 - 3 0.28 - 0 . 6 3 0.30 - 0 . 9 0 - 2 - 0.52 - 0.81 - 1.29 - 2.878 - 1 0.14 1.12 1 . I7 0.79
0 - 0.25 - 1.29 0 .3I - 2.02 1 - 1.25 s - 2.80 s - 2.28 - 2.43 f 2 - 0.94 - 0.67 0.66 - 1.77 3 - 0 . 5 1 - 1.09 - 0 . 8 4 - 2.50 4 - 0 . 0 5 - 0 . 1 0 0.42 1.66 5 - 0.16 - 0.13 0.22 - 1.88 6 - 0.32 - 0.62 - 0.41 - 1.65 7 to 12 - 0.03 - 1.25 - 5.4! - 0.67
aA top m a n a g e m e n t ehan~e is defined as any change in the set o f individuals ho ld ing the rifles CEO, pres iden t , o r cha i rman o f the board .
b E x d u d e s announcemen t s o f a top management change where ano ther a n n o u n c e m e n t is made s imul t aneous ly (e.g,, earnings o r d iv idends announcements) . Of the 351 changes repor ted in the WSJ , 72 have s imul taneous announcements .
CA C E O change :'s defined ~¢ a t op management change in w ~ c h a new C E O is appo in ted o r the Cld pos i t i on is c rea ted for a new top manager .
A n ou t s ide r change is def ined as a top managemen t change in which a newly appoin ted m e m b e r o f the t op m ans~enlef l t t eam was no t previously art employee o f the firm.
CA forced d e p a r t u r e is defined as a top manager leaving the firm with no reason repor ted for the depa r tu r e o r the r epor ted reason is p o o r performance, o the r interests, take a pos i t ion with another firm, pof icy difference, o r firing.
tSignif icant a t 0.10 leveL s s ign i f i can t a t 0.05 level.
errors from months - 12 through - 7 are -6.67% (z = - 1.86), - 7.18% (z = -2.12), and -14.67% (z- - -3.52), respectively. For these subsamples, there are indications of poor stock price performance as much as two to three years prior to announcement of the change. This is especially true for forced departures, where the cumulative mean prediction error from months - 3 6 through - 1 3 is -21.44% (z = -2.12).
Abnormal performance at, and following, announcement. For all WSJ changes, the mean prediction error at month 0 is -0.25% (z = -0 .04) . Consistent with

486 J. Warner et ~1., Stock prices and management changes
I0
-10
-20
Predl~lon Error -30 ¢x.)
-40 -
-50 " I
-60 -36
, , , , . . . . . : : : : : : : : : : : : : : : : : : : : : : : : : : : : '
..,_% "~_'._.,.. ,. ,:,,~.......~..,
~.~_~..,/ . .~.. ' - " "''~:~.-..::
o
I i I I I I I I I | Ii I I g I ; I I l I l I I
All WSJ Chongt's
/Outsicl.~r Changes
m°° °o ooo ooeoo~ %.qtmm eseoeeeo 8
CEO Changes (N=91) \..\_ .._
~ , , Forceci Deparlures
-30 -24 -18 -i2 -6 0 6 12
Mmdlt I~datlvo To Ammunemamd
Fig. 1, Monthly cumulative mean prediction error by type of top management change, time period: 1963-1978.
the daily data results, thee is negative abnormal performance following the announcement of a top management change. The mean prediction error at month + 1 is - 1.25% (z ffi - 2.07). This latter result is somewhat stronger for CEO changes and forced departures. For month + 1, the mean prediction errors for these two subsamples are -2.80% (z ffi -2.65) and -2.435 (z-- - 1.95). respectively. For the outsider subsample the mean prediction error is - 2 . 2 8 % , but is not statistically sigxdficant (z ffi -1.51) for month + 1.
Given the lag between announcement and the appearance of negative abnormal returns in both daily and monthly results, it is hard to argue that this postannouncement behavior is directly related to the announcement of the change. Further, the significant negative postannouncement behavior does not appear to be induced by the specific methodology use~] to estimate abnormal performance. For example, the picture of negative abnormal performance is similar when only postevent data, as opposed to pre- and postevent data, are used to estimate market model parameters, or when median (rather than mean) prediction errors are examined. 3v Thus, a good explanation for the apparent postannouncement share price fall is lacking.
3?Furthermore, the apparent significance of the m::an predictinn errors in the month following announcement cannot be attributed to a variance increase [see Brown and Warner (1985, p. 22)]. Although not reported in table 9, examination of mean and median standardized squared prediction errors indicates that no such increase occu Ted.

J. Warner et al., Stock prices and management changes 487
6. Summary and conclusions
This paper examines the association between ~tock price performance and top management changes for 269 NYSE and AMEX firms in the period 1963-1978. The major focus is the association between stock performance and subsequent top management changes. In addition, stock price reaction at_ management change announcements is examined. Major results are sum- marized below.
6.1. Predicting top management changes
Results using logit indicate an inverse relation between the probability of a top management change and stock performance. This relation is consistent with the joint hypothesis that 1) information about management performance is reflected in stock returns and 2) such information is used in evaluating management performance. Th_e relation between stock performance and management changes appfies to several types of top management chauges and is consistent with studies of CEO changes [e.g., Coughlan and Schmidt (1985) and Weisbach (1988)]. Further, while these studies emphasize the role of the board of directors, the board is not the only force disciplining top managers. Although reported details of management changes are often sparse: there is evidence of several internal monitoring mechanisms at work. These include monitoring by blockholders and competition among managers, a:~ well as discipline by the board.
The appropriate benchmark for measuring performance. Investigatioh of the functional form of the share performance/management change relation pro- rides further evidence on internal monitoring. Adjustment for market factors increases the explanatory power of the logit procedures. For example, for a given level of own stock return, better market performance indicates poorer relative performance and is associated with a higher probability of a top management change. This suggests that management is not held responsible for some factors outside its control. Although similar results do not apply when industry factors are also included, one plausible explanation is that industry factors based on two-digit SIC code are very noisy measures of industry performance.
The strength of the underlying mechanisms. Although the results are consistent with internal monitoring, they also raise questions about the strength of the underlying monitoring mechanisms. Unless share performance is extreme, the logit specification has no predictive ability. Even for firms in the lowest decile

488 J. Warner et al., Stock prices and management changes
of share performance in a given year, the probability of a forced departure in that year is only about 0.06. in addition, any response to share performance is not in, mediate and share performance lagged up to two calendar years help~ predict cun'ent-calendar-year management changes.
6.2. Event study results: Mean and variance shift tests
Despite the results obtained with the prediction methodologies, standard event study procedures produce little evidence of nonzero mean abnormal returns at announcement of a top management change~ This finding could occur under several plausible scenarios, for example, if a management change is in shareholders' interest but conveys bad news about the current mana$e- ment team's p e r f o r c e . Controlling for such information effects is dimcult, and several attempts to structure hypotheses and partition the sample to provide more informative tests are inconclusive.
Cross-sectional and variance shift tests indicate that management change announcements are associated with small, but statistically significant, abnormal stock price movement, positive in some cases and negative in others. Although further investigation could help explain the stock price reaction, its unimpres- sive magnitude raises questions about the gains from such an endeavor.
6.3. Extension and generalizations
The probability of a top management change is not high, and much about the event is unexplained. One extension of this paper is to examine other measures of firm perfo~maace, such as accounting earnings, and how they influence turnover. This is useful in identifying the variables actually used in evaluating management performance.
Mother extension is to expand the set of firm characteristics used to predict management changes. How the response to poor performance is influenced by the board, by the presence of large blockholders, and by the structure of the top manage~n t team is not well understood.
Finally, a general methodological issue is raised by the contrast between this paper's relatively informative results u~ing !ogit procedures and somewhat uninformative results using event study procedures. The issue is whether to test economic hypotheses by trying to predict an event, or by studying the stock price reaction at announcement of an event. In the accounting literature, comparison of prediction and event study procedures indicates that the former are relatively valuable [see Holthausen and Leftwich (1983, p. 109)]. The extent to which this conclusion applies to corporate control events remains to be determined, and further ~malysis of what determines the efficacy of the alternative procedures is required.

J. Warne'r et ai., Stock prices and management changes 489
Appendix
This appendix describes in detail the measurement of abnormal perfor- mance and statistical tests used in section 5. It d,~aws heavily on work by Patell (1976), D~tI~,md Warner (1983), and Dodd, Dopuch, Holthausen, and Leftwich (1984).
A.I. Measuring abnormai performance
Abnormal stock price performance is measured using the market model. In the daily study, the estimation period for market mode| parameters is from 260 to 61 days prior to announcement. The event period is defined as 60 days before through 30 days after announcement. In the monthly study, the estimation period is from 60 to 37 months before and 13 to 48 months after announcement. The event period ;_s from 36 months before through 12 months after announcement. A firm is drop!~ed from the d~,~ily study if fewer than 30 days of data are available for esthnatt'oa, and from the monthly study if less than 12 months of data are available.
Abno! aml stock return for firm i on day (or month) t in the event period is calculated as the prediction error from the market model:
where R i , t
R . .~, t
ai, ~i
-- stock return of firm i at time t, --return to CRSP equally weighted index at time t, and ffi OLS estimates of natrket model paramet~So
A cross-sectional average prediction error over N firms for each event day (month) t is calculated:
1 N PEt ~ ~ ~ PEi, t.
i-1
Cumulative prediction error over K days is simply the sum of the PEt's over the period in question:
T+K CPE,,,+xffi ~ PEt.
t m ~ ,
A.2. Standardized abnormal performance
To ,,~sess the statistical significance c,~ aver:,ge prediction errors durin~ ,~he event period, stsnd~dized test statistics are constructed. Each ore~:~.

490 J. Warner et al., Stock prices and management changes
is divided by the square root of its estimated forecast variance, forming a standardized prediction error:
where SPEd, t= PE~,t/s~,t,
]1/2
1 ( R . , , - R,.) 2 s~ , t f s ~ 1+~-~+ /.~- . . . . .
,.T_., (R.,,- Here s~ is the estimated residual standard deviation from firm i's market model regression, R,. is the average market return over the L~ estimation period days (monms), aria -:'¢,.,t is the return to the market index at day (month) t.
The standardiz~ prediction error is distributed as a Student-t with (L~- 2) degrees of freedom. Since. L,: is large, the disla-ibution is approximately unit normal in the absence of abnormal performance. A cumulative standardized prediction error for testing hypotheses about K-day performance is formed as
1 ,+K CSPEi'(" "+ Ic) = " ~ t~, SPEi't"
The cumulative standardized prediction error is also distributed unit normal for large L~. 3s
Invoking the assumption n¢ cross-sectional iudependence and applying the central limit theorem, the following statistics test whether average performance differs from zero:
1•" At
Zt= N ~" SPEd, t, i = 1
and for cumulative performance,
N
= - N i = 1
A.3. Standardized squared abnormal performance
To test for unusual stock price performance independent of mean effect $ig~, 2. ~.~.~r~d ~t~lar~liT~d ~t~tiefir ie , e~ri 39 From ~ow'ticm A 9 ~h~ ~arl-
3SSee Dodd and Warner (1983, p. 437) foi- details. 39As Patell (1976) points out, this test is not strictly a measure of an event-period variance s~h,
but is more apprc:~riately viewed az a ~e~t that average performance equals zero and event-period vo~-ia.qce equals estimation-period variance (see especially p. 258).

J. Warner et aL, Stock prices and management change," 491
d~dized prediction error has a Student-t distribution with (L~ - 2) degrees of freedom. Hence, the squared value of the standardized prediction error is distributed F(1, L~- 2) and E(SPEi, t) 2 = ( L ~ - 2)/(L~ - 4). Analogous results hold for the cumulative standardized prediclaon errors.
Given market model estimation procedures, L~ is not the same for all firms. To make the standardized squared statistics comparable across firms, a new statistic ~. , is formed:
l.I~,, = ( $PE~,t)2[ ( L, - 4 ) / ( L , - 2)],
and for cumulative performance
where
U~.,- ( CSPE,.t)2[( L , - 4 ) / ( L , - 2)].
E[U~.t] = 1, var[U~.t] - 2 [ ( L , - 3 ) / ( L , - 6)].
Under the assumption that the U j s axe cross-sectionally independent, the central limit theorem can be applied to construct an approximately normal variate:
N E
Z t _ . i f f i l 11/2 •
Simulations by Dodd, Dopuch, Holthause~, end Leftwich (1984, p. 37) suggest the above statistic is misspvcified, specifically, that its distribution is fat-tailed, the statistic registering significant performance too often, in this study the same problem arises. For example, in the daffy study oi all nanage-
stat,,~a~s (37~) are great,~r than merit changes, 33 of the 90 sample-period test :o"- two in absolute value. To avoid false inferences, the statistical signific~tnce of standardized squared performance is a~s sed using the empmcal distribution of the Ui.:s.
Rankings of mean and median standardized squared prediction er:rors at time 0 relative to those at other times during the announcement period are . . . . a t e infer the ~:"-:';"~ . . . . r ..... !. v,'ice verformance. A "~':¢+ " Oi~#.JLa.a~th,,~LIP~w0 '~g ~tLg)/W~.. . | i i ~ ;
distribut2on of the U's from the center to the tails indicates unusual stock price response at announcement. These test procedures are biased against finding unusual stock price behavior, especially if behavior at other ever~t- period times is itself unusual.

492 J, Warner et ai., Stock prices and management changes
References Beaver, W.H., 1%8, The information content of annual earnings announcements, Empirical
research in accounting: Selected studies 1%8, Supplement to Journal of Accounting Research 6, 6?-92.
Bonnier, ICA. and R.F. Bmner, 1986, An analysis of the stock price reaction to manegement change in distressed firms, Unpublished manuscript (Unlvers/ty of V/r~'nia, C~ . ~ottesville, VA).
Borstadt, L., 1985, Stoe.k price react/ons to management changes, Unpublished manuscript (University of U~h, ~ i t Lake City, UT).
Brown, S~ and J. Warner, 1985, U~ng daily stock returns: The case of _~ent studies, Journal of Financial Fconomics 14, 3-31.
Comment, R., 19.~. The effects of fmn-specifi¢ human cspital on management equity investment and turnover, Unpublished Ph.D. thesis (University of Michigan, Ann Arbor, MI).
Coughlan, A. and ~ Sehmidt, 1985, Executive compensation, man~e~'~t turnover, and firm performance: An emphicai investisation, Journal of Accounting and Economics 7, 43-66.
Dodd, P., N. Dopuch, It. Holthausen, and R. Leftwich, 1984, Qualified audit opinions and stock priceS: In~on)~tion colltent, announcemezlt dates, and concurnmt disclosures, Journal of Accountin 8 and Economics 6, 3-38.
Dodd, P. and J.B. Warner, 1983, On corporate governance: A study of proxy contests, Journal of Financial Economics II, 401-439.
Fama, E., 1980, Agency pmbk, m~¢ and the theory of the finn, Journal of Political Economy 88, 288-307.
Fama, E.F. and M.C. Jemen, 1983, Separation of o ~ p and control, Journal of Law and Economics 26, 301-325.
Fm'tado, E.P., 1986, The wealth effects of manager inif, atcd zaaz~ement changes, Unpublished manuscript (Kansas State University, Manhattan, IC%').
Furtado, F.P. and M.S. Rozeff, 1987, The wealth effects of company initiated management dwatges, Journal of Financial Economics 18, 147-160.
Holthansen, g. and g. Leftwich, 1983, The economic consequences of accounting choice: Implications of costly contracting and monitoring, Journal of Acconnt;nZ and Economics 5, 77-117.
Klein, A., W. Kim, and A. Mehajau, 1985, Information content of m nnneement chan~es, Unpub!ighed manuscript (Baruch College, New York, NY).
Lazear, E.P. and S. Rosen, 1981, Rank orde~ t~t~ments as optimum labor contracts, Journal of Political Economy 89, 841-864.
Manne, H.G., 1965, Mersers and the market for corporate control, Journal of Political Economy 73, 110-120.
Patell, I.M., 1976, Corporate forecasts of earnings per share and stock price behavior: Pmpirical tests, Journal of Accounting Research 14, 246-2"/6.
Reinganum, M.K., 1985, The effect c[ executive su___ecession on stockholder wealth, Administrative Science Quarterly 30, 46-60.
Shleifer, A. and R.W. Vishny, 1986, Large shareholders and corporate control, Journal of Political Economy 95, 461-488.
Vancil, R.F., 1987, Passing the be ton: Manasin 8 the process of CEO succession (H~,~rvard Business School Press, Camt:~dge, I~,LA).
Weisbach, M.S., 1988, Outside directors and CEO .~umover, Jourcd of Financial Economics, this i~sue.