Embed Size (px)
Citation preview
1069IEEE Transactions on Nuclear Science, Vol. NS-30, No. 2, April 1983
STOPPING POWER FOR FAST NITROGENAND OXYGEN DICLUSTERS IN CARBON
Malcolm F. SteuerUniversity of Georgia, Athens, GA 30602
and
Donald S. Gemmell, Elliot P. Kanter, Edward A. Johnson and Bruce J. ZabranskyArgonne National Laboratory, Argonne, IL 60439
Summary
Measurements of stopping powers for severaldiatomic ions are presented and compared to values de-rived from well known wake models. While indepen-dently determined wake forces can be superposed tocalculate correctly the stopping forces on light fastions, such as H+, the method appears to be invalidfor slower, more highly charged N4 ions. To includenon-linear terms in the interaction wake charge dis-tributions must be determined for pairs of ioniccores. To avoid the complexities of a proper quantummechanical treatment a semi-classical calculation offree electron scattering by two screened ionic coreswas used to determine the stopping forces. While aquantum mechanical calculation is needed to obtaina definitive result the semi-classical calculationprovides qualitative agreement with experiment for3 MeV N2 ions in carbon.
Introduction
Measurements of stopping power for fast (MeV)ions have contributed much to our understanding of theion-solid interaction. Following the discovery byBrandt, Ratkowski and Ritchiel that a vicinage effectenhances the slowing down of fast H2 and Ht molecu-lar ions in solids several experiments with molecularion beams have shown that the correlated motions oftheir atomic components influence not only the stop-ping power but also the energy and angular distribu-tions of the fragments which emerge from thintargets.2 A measure of the vicinage effect is theratio R of the stopping power for the cluster to thesum of the stopping powers for its separated atomiccomponents.
Brandt et al.1 reported R values greater thanone for H2 and H+ ions having speeds in the range 1.6to 2.5 a.u. Tape et al.3 made similar measurementsand reported R values greater than one for H2 and °2ions whose speeds ranged from 2.0 to 6.4 a.u. Ineach of these experiments some R values less than onewere measured for the slowest ions in the thickesttargets. Eckhardt et al.4 were the first to notethat the stopping power ratio for H2 ions was lessthan one. The H2 velocity at which the vicinage ef-fect changes from enhancement to diminishment isabout one a.u. Laubert5 made extensive measurementsand reported R values less than one for H2 ions withspeeds below one a.u.
The earliest experiments were designed tomeasure the stopping power ratio for randomly ori-ented molecules only. In the experiment which is thebasis for the present work only those molecular frag-ment ions were detected which left the stopping foilwith their internuclear axes parallel to the beamdirection.6 This orientation is optimum to obtainthe greatest variation in the cluster stopping powerand also simplifies the comparison with theory.
Experimental Procedure
Self-supporting carbon foils ranging in thick-ness from 2-l9pg/cm2 were used as targets for
molecular-ion beams with energies in the range 0.8-3.6 MeV. Ion pairs, emerging from the foil withtheir internuclear axes aligned with the beam direc-tion, +0.15 mrad, were electrostatically energy ana-lyzed and centroids of the energy distribution cor-responding to the ions directed forward and backwardin the center-of-mass system were determined. Theenergy loss per ion was taken as the difference be-tween the average of these centroids and thecentroid of the central peak obtained by removingthe target and instead passing the same molecularion beam through a gas jet. The energy losses ofmonatomic beams, each having the same velocity as thecorresponding molecular beam, were measured in asimilar manner. Stopping power ratios were deter-mined from these measured molecular and atomic energylosses. The principal uncertainty in the energylosses derives from statistical uncertainties in thevalues obtained for the centroids of the measured dis-tributions. Calculations show that the positions ofthese centroids are not changed significantly bymultiple scattering.
Experimental Results
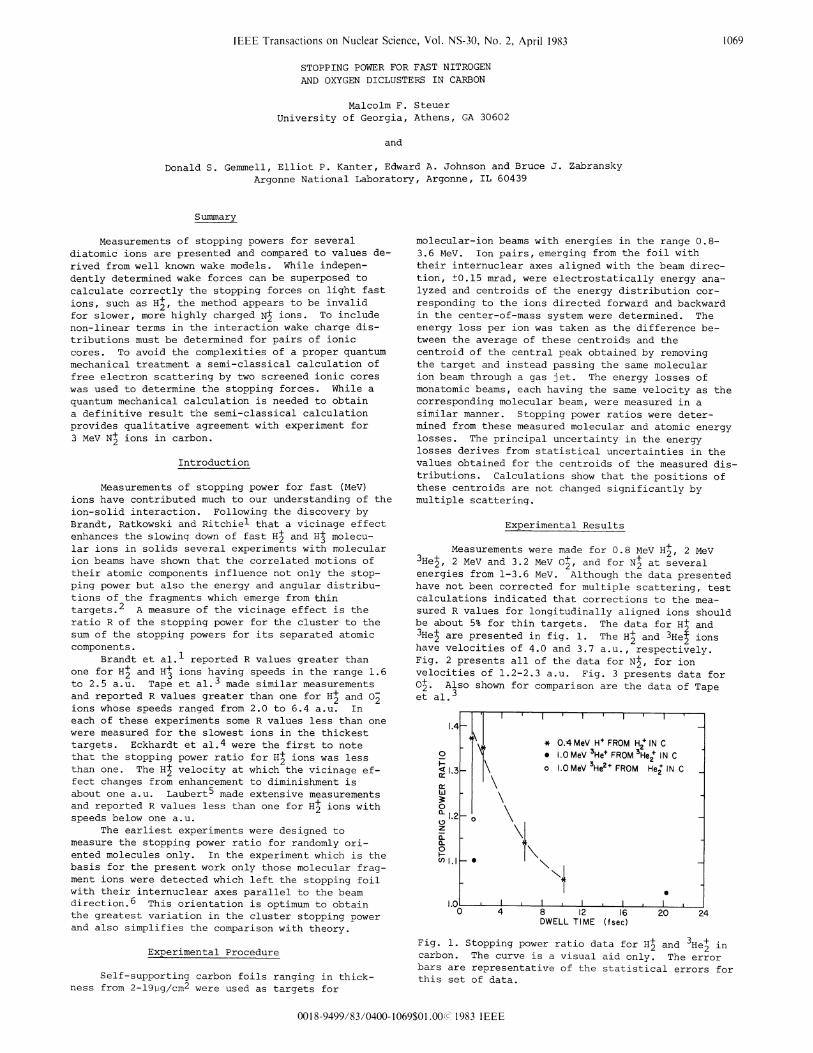
Measurements were made for 0.8 MeV H2, 2 MeVHel, 2 MeV and 3.2 MeV O°, and for N2 at severalenergies from 1-3.6 MeV. Although the data presentedhave not been corrected for multiple scattering, testcalculations indicated that corrections to the mea-sured R values for longitudinally aligned ions shouldbe about 5% for thin targets. The data for H+ and3He2 are presented in fig. 1. The H2 and 3He; ions2 2 adH2 inhave velocities of 4.0 and 3.7 a.u., respectively.Fig. 2 presents all of the data for NJ, for ionvelocities of 1.2-2.3 a.u. Fig. 3 presents data forO°. Also shown for comparison are the data of Tapeet al.
1.4
0
< 1.3
0
L 1.2z
a-1L
(n 1.
~* QOAi
-1\\ °~1.0
- '
-o0
"l
4 MeV H+ FROM H+4IN CMeV 3He+ FROM 3He2 IN C)MeV 3He2+ FROM He+ IN C
0 4 8 12 16DWELL TIME (f sec)
20 24
Fig. 1. Stopping power ratio data for H+ and3He2 in2 2 icarbon. The curve is a visual aid only. The errorbars are representative of the statistical errors forthis set of data.
0018-9499/83/0400-1069$01.00(c 1983 IEEE
-1 I I I
WI I
0
:
0
0-zEa-
0
Cr)
0.95- 1.8 MeV/ATOM Yv =2.28-
LOC~~~~~~~~~~~~~V0.90C Zeff = 3.45
Q95 * 1.5MeV/ATOM -v =2.080.90- Zeff =3.32
1.00
0.95 - ,~ . 1.2MeV/ATOMO
1.86-
0.90C _ to'+Zeff =3.191.00
095 L,0.OMeV/ATOM VO =1.700.8g~~ ~~~~~1 eff = 3.10
0.90 Zeff 3.2
0.85_
1.00
0.95- 0.5MeV/ATOM v -1.200.90C Zeff =2.93
0.80CU 10 20 30
DWELL TIME (fsec)
0.
0
z
0.9L
0.8
4U
Fig. 2. Stopping power ratio data for N2 in carbon.The curves are visual aids only. The error bars are
representative of the statistical errors for this set
of data.
Analysis
Wake Model
Experimental evidence has guided the developmentof a model in which an atomic ion entering a solid ex-
changes electrons with the medium and rapidly, typi-cally within 10-16s, establishes an ionic core of
charge which is maintained as it moves through the
medium by a statistical equilibrium of electron
capture-loss processes. The electrons of the medium
respond to the field of this charge, and in the frame
of the projectile, form a "wake" of polarized chargewhich provides a stopping force. A recent review of
wake models has been given by Gemmell and Vager7. The
interaction of molecular ions in solids has been
treated by an extension of these ideas in which each
atomic component induces a wake. Because of its fi-
nite spatial extension the wake induced by one ion can
influence the slowing down of other ions within the
cluster.Theoretical treatments of wake forces have been
formulated on the assumption that the solid can be
represented by a free electron gas in which there is a
uniformly distributed background of positive charge.The perturbation is taken to be that of a point chargeand generally the response of the medium to its field
is assumed to be linear. For projectiles other than
protons the charge is usually taken as a point chargeeZeff where (Zeff 2 is the ratio of the stopping powerof the projectile to that of a proton having the same
speed. The structures of the target atoms have been
neglected as well.
10DWELL TIME
20(fsec)
30
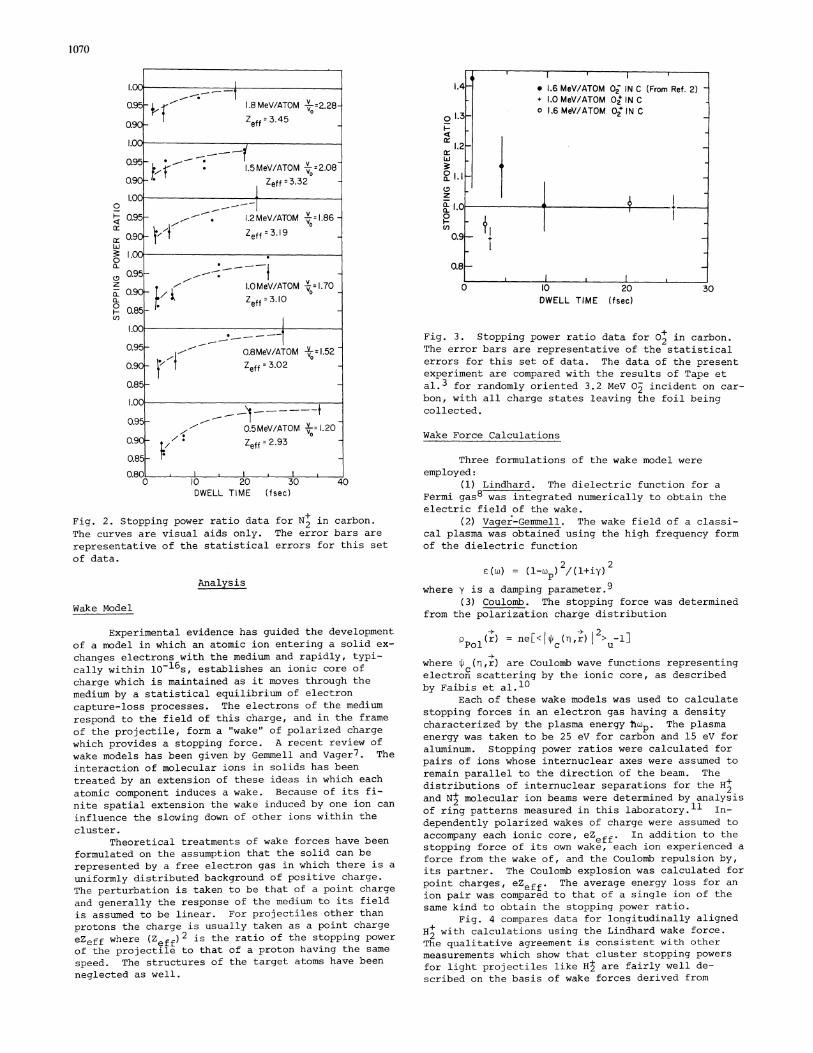
Fig. 3. Stopping power ratio data for 0° in carbon.
The error bars are representative of the statistical
errors for this set of data. The data of the present
experiment are compared with the results of Tape et
al.3 for randomly oriented 3.2 MeV °2 incident on car-
bon, with all charge states leaving the foil being
collected.
Wake Force Calculations
Three formulations of the wake model were
employed:(1) Lindhard. The dielectric function for a
8-Fermi gas8 was integrated numerically to obtain the
electric field of the wake.(2) Vager-Gemmell. The wake field of a classi-
cal plasma was obtained using the high frequency formof the dielectric function
C (w) = (1-w ) 2/(l+iy)2where y is a damping parameter.9
(3) Coulomb. The stopping force was determinedfrom the polarization charge distribution
PPol(r) = ne[< ( ,r)2> -1]
where (q,r) are Coulomb wave functions representingelectron scattering by the ionic core, as describedby Faibis et al.10
Each of these wake models was used to calculatestopping forces in an electron gas having a densitycharacterized by the plasma energy hw . The plasmaenergy was taken to be 25 eV for carbon and 15 eV foraluminum. Stopping power ratios were calculated forpairs of ions whose internuclear axes were assumed toremain parallel to the direction of the beam. Thedistributions of internuclear separations for the H+
2
and N2 molecular ion beams were determined by analysisof ring patterns measured in this laboratory.11 In-dependently polarized wakes of charge were assumed toaccompany each ionic core, eZeff. In addition to thestopping force of its own wake, each ion experienced a
force from the wake of, and the Coulomb repulsion by,its partner. The Coulomb explosion was calculated forpoint charges, eZeff. The average energy loss for an
ion pair was compared to that of a single ion of thesame kind to obtain the stopping power ratio.
Fig. 4 compares data for longitudinally alignedH+ with calculations using the Lindhard wake force.2The qualitative agreement is consistent with other
measurements which show that cluster stopping powersfor light projectiles like Ht are fairly well de-
scribed on the basis of wake forces derived from
1070
4l l l
1.4 * 1.6 MeV/ATOM O° IN C (From Ref. 2) -
+ 1.0 MeV/ATOM 0 +IN C
1.3 o 1.6 MeV/ATOM 0?+INC
91.2 _
,10:, . + 1I
~l
1071
DWELL TIME (fsec)
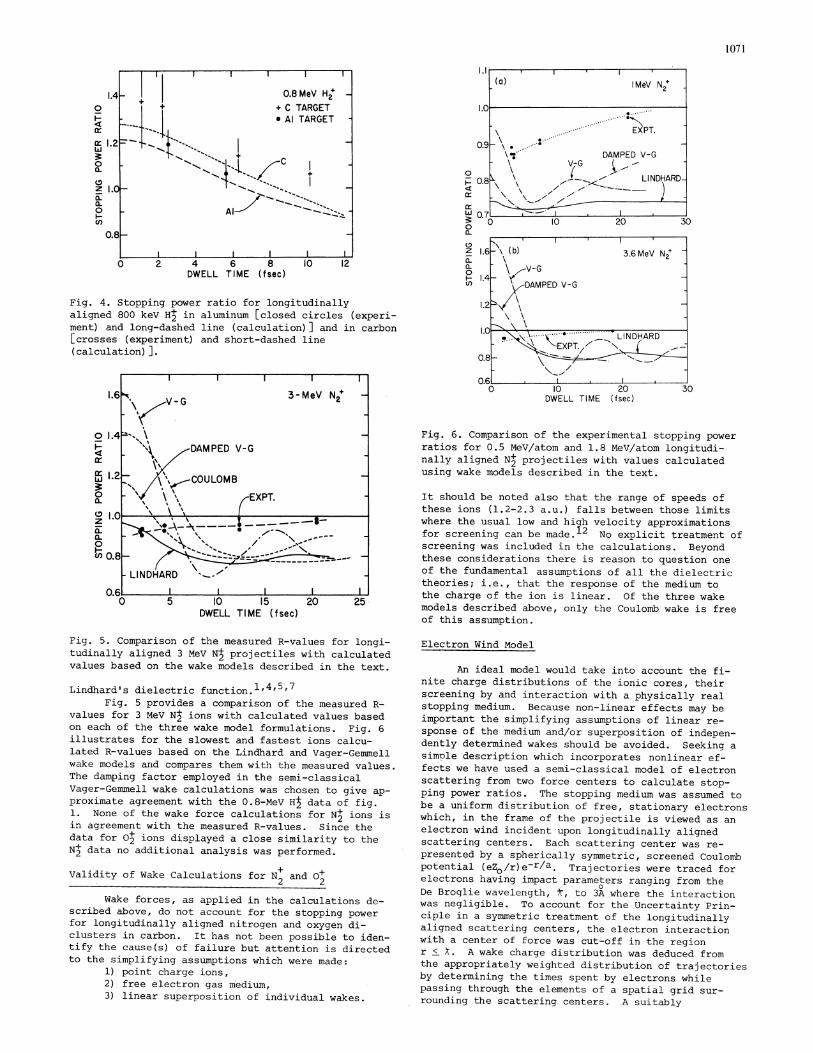
Fig. 4. Stopping power ratio for longitudinallyaligned 800 keV H2 in aluminum [closed circles (experi-ment) and long-dashed line (calculation)] and in carbon[crosses (experiment) and short-dashed line(calculation)].
DWELL TIME (fsec)
Fig. 5. Comparison of the measured R-values for longi-tudinally aligned 3 MeV NJ projectiles with calculatedvalues based on the wake models described in the text.
Lindhard's dielectric function.1,4,5'7Fig. 5 provides a comparison of the measured R-
values for 3 MeV NJ ions with calculated values basedon each of the three wake model formulations. Fig. 6illustrates for the slowest and fastest ions calcu-lated R-values based on the Lindhard and Vager-Gemmellwake models and compares them with the measured values.The damping factor employed in the semi-classicalVager-Gemmell wake calculations was chosen to give ap-proximate agreement with the 0.8-MeV HI data of fig.1. None of the wake force calculations for N2 ions isin agreement with the measured R-values. Since thedata for 02 ions displayed a close similarity to theN2 data no additional analysis was performed.
Validity of Wake Calculations for N+ and 0+2 2
Wake forces, as applied in the calculations de-scribed above, do not account for the stopping powerfor longitudinally aligned nitrogen and oxygen di-clusters in carbon. It has not been possible to iden-tify the cause(s) of failure but attention is directedto the simplifying assumptions which were made:
1) point charge ions,2) free electron gas medium,3) linear superposition of individual wakes.
0- O
00r3.0a.
0CL
0.
0.8
0 10 20DWELL TIME (fsec)
30
Fig. 6. Comparison of the experimental stopping powerratios for 0.5 MeV/atom and 1.8 MeV/atom longitudi-nally aligned N2 projectiles with values calculatedusing wake models described in the text.
It should be noted also that the range of speeds ofthese ions (1.2-2.3 a.u.) falls between those limitswhere the usual low and hi h velocity approximationsfor screening can be made.72 No explicit treatment ofscreening was included in the calculations. Beyondthese considerations there is reason to question oneof the fundamental assumptions of all the dielectrictheories; i.e., that the response of the medium tothe charge of the ion is linear. Of the three wakemodels described above, only the Coulomb wake is freeof this assumption.
Electron Wind Model
An ideal model would take into account the fi-nite charge distributions of the ionic cores, theirscreening by and interaction with a physically realstopping medium. Because non-linear effects may beimportant the simplifying assumptions of linear re-
sponse of the medium and/or superposition of indepen-dently determined wakes should be avoided. Seeking asimple description which incorporates nonlinear ef-fects we have used a semi-classical model of electronscattering from two force centers to calculate stop-ping power ratios. The stopping medium was assumed tobe a uniform distribution of free, stationary electronswhich, in the frame of the projectile is viewed as anelectron wind incident upon longitudinally alignedscattering centers. Each scattering center was re-
presented by a spherically symmetric, screened Coulombpotential (eZo/r)e-r/a. Trajectories were traced forelectrons having impact parameters ranging from theDe Broglie wavelength, X, to 3A where the interactionwas negligible. To account for the Uncertainty Prin-ciple in a symmetric treatment of the longitudinallyaligned scattering centers, the electron interactionwith a center of force was cut-off in the regionr < X. A wake charge distribution was deduced fromthe appropriately weighted distribution of trajectoriesby determining the times spent by electrons whilepassing through the elements of a spatial grid sur-
rounding the scattering centers. A suitably
(a) MeV N2+
0.**\~* ... EXPT.
19 .DAMPED V-G
i8i\ \\ ,- INLINDHARD
\_-..-7 . -I0 10 20 Y
1.6 -\\ ( b) 3.6 MeV N +-\ rV-G
1.4- DAMPED V-G
1.2 -. t _
In \.\\, t-EXP LINDTHARD _
7 / I_ W.
ri
2 4 6INTERNUCLEAR SEPARATION ( )
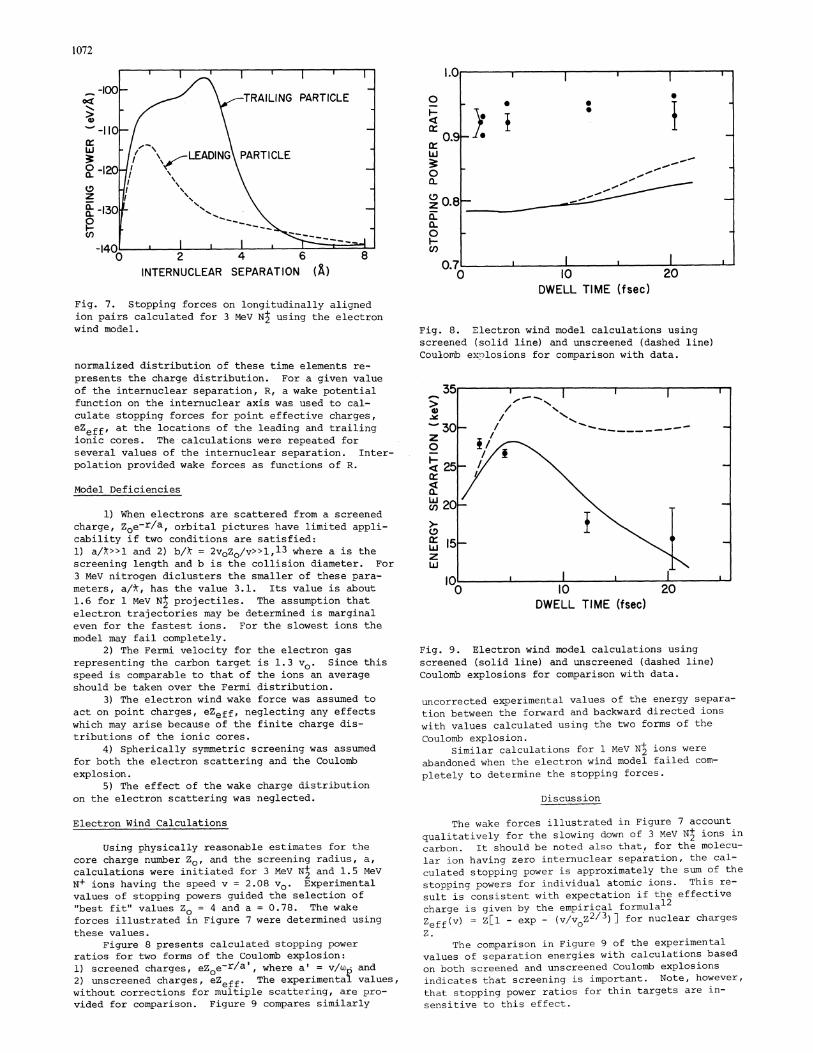
Fig. 7. Stopping forces on longitudinally aligned
ion pairs calculated for 3 MeV N2 using the electron
wind model.
normalized distribution of these time elements re-
presents the charge distribution. For a given value
of the internuclear separation, R, a wake potentialfunction on the internuclear axis was used to cal-
culate stopping forces for point effective charges,
eZeff, at the locations of the leading and trailing
ionic cores. The calculations were repeated for
several values of the internuclear separation. Inter-
polation provided wake forces as functions of R.
Model Deficiencies
1) When electrons are scattered from a screened
charge, Zoe-r/a, orbital pictures have limited appli-
cability if two conditions are satisfied:1) a/»>>l and 2) b/k = 2voZO/v>>l,l3 where a is thescreening length and b is the collision diameter. For
3 MeV nitrogen diclusters the smaller of these para-
meters, a/*, has the value 3.1. Its value is about1.6 for 1 MeV N2 projectiles. The assumption thatelectron trajectories may be determined is marginaleven for the fastest ions. For the slowest ions themodel may fail completely.
2) The Fermi velocity for the electron gas
representing the carbon target is 1.3 vo. Since thisspeed is comparable to that of the ions an average
should be taken over the Fermi distribution.3) The electron wind wake force was assumed to
act on point charges, eZeff, neglecting any effectswhich may arise because of the finite charge dis-tributions of the ionic cores.
4) Spherically symmetric screening was assumedfor both the electron scattering and the Coulombexplosion.
5) The effect of the wake charge distributionon the electron scattering was neglected.
Electron Wind Calculations
Using physically reasonable estimates for thecore charge number ZO, and the screening radius, a,
calculations were initiated for 3 MeV N2 and 1.5 MeVN+ ions having the speed v = 2.08 vo. Experimentalvalues of stopping powers guided the selection of"best fit" values ZO = 4 and a = 0.78. The wakeforces illustrated in Figure 7 were determined usingthese values.
Figure 8 presents calculated stopping power
ratios for two forms of the Coulomb explosion:1) screened charges, eZoe-r/a', where a' = v/W and
2) unscreened charges, eZeff. The experimentat values,without corrections for multiple scattering, are pro-
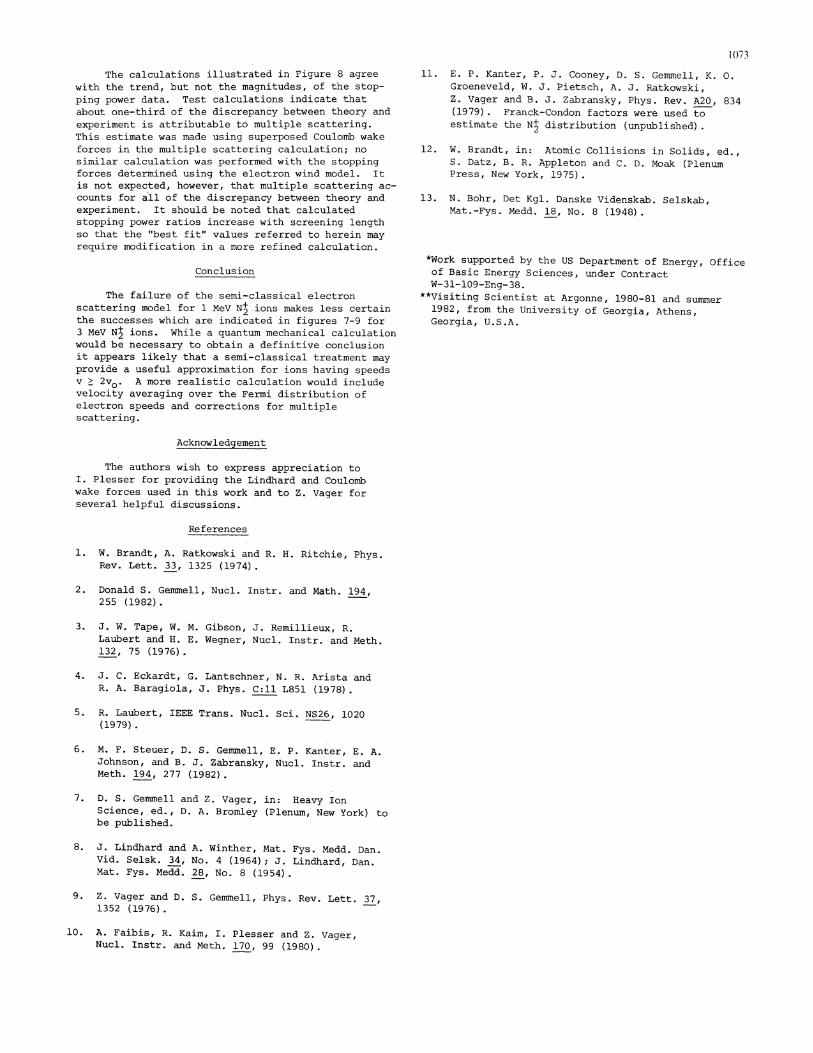
vided for comparison. Figure 9 compares similarly
DWELL TIME (fsec)
Fig. 8. Electron wind model calculations usingscreened (solid line) and unscreened (dashed line)Coulomb explosions for comparison with data.
3-0
0w
O 10020DWELL TIME (fsec)
Fig. 9. Electron wind model calculations using
screened (solid line) and unscreened (dashed line)
Coulomb explosions for comparison with data.
uncorrected experimental values of the energy separa-
tion between the forward and backward directed ions
with values calculated using the two forms of the
Coulomb explosion.
Similar calculations for 1 MeV N2 ions were
abandoned when the electron wind model failed com-
pletely to determine the stopping forces.
Discussion
The wake forces illustrated in Figure 7 account
qualitatively for the slowing down of 3 MeV N2ions in
carbon. It should be noted also that, for the molecu-
lar ion having zero internuclear separation, the cal-
culated stopping power is approximately the sum of the
stopping powers for individual atomic ions. This re-
sult is c~onsistent with expectation if the effective
charge is given by the empirical formula12
Zeff(v) - Z[1 - exp - (v/v0Z213)j for nuclear charges
Z.
-The comparison in Figure 9 of the experimental
values of separation energies with calculations based
on both screened and unscreened Coulomb explosions
inidicates that screening is important. Note, however,
that stopping power ratios for thin targets are in-
sensitive to this effect.
1072
, I I I
_2'
I I I I1 .-
1.0
0xa:
0.9w
0a-
z0.8a-0Uf)
0.7C 10 20
I I I-
The calculations illustrated in Figure 8 agreewith the trend, but not the magnitudes, of the stop-ping power data. Test calculations indicate thatabout one-third of the discrepancy between theory andexperiment is attributable to multiple scattering.This estimate was made using superposed Coulomb wakeforces in the multiple scattering calculation; nosimilar calculation was performed with the stoppingforces determined using the electron wind model. Itis not expected, however, that multiple scattering ac-counts for all of the discrepancy between theory andexperiment. It should be noted that calculatedstopping power ratios increase with screening lengthso that the "best fit" values referred to herein mayrequire modification in a more refined calculation.
Conclusion
The failure of the semi-classical electronscattering model for 1 MeV N+ ions makes less certainthe successes which are indicated in figures 7-9 for3 MeV N2 ions. While a quantum mechanical calculationwould be necessary to obtain a definitive conclusionit appears likely that a semi-classical treatment mayprovide a useful approximation for ions having speedsv > 2vo. A more realistic calculation would includevelocity averaging over the Fermi distribution ofelectron speeds and corrections for multiplescattering.
107311. E. P. Kanter, P. J. Cooney, D. S. Gemmell, K. 0.
Groeneveld, W. J. Pietsch, A. J. Ratkowski,Z. Vager and B. J. Zabransky, Phys. Rev. A20, 834(1979). Franck-Condon factors were used toestimate the N2 distribution (unpublished).
12. W. Brandt, in: Atomic Collisions in Solids, ed.,S. Datz, B. R. Appleton and C. D. Moak (PlenumPress, New York, 1975).
13. N. Bohr, Det Kgl. Danske Videnskab. Selskab,Mat.-Fys. Medd. 18, No. 8 (1948).
*Work supported by the US Department of Energy, Officeof Basic Energy Sciences, under ContractW-31-109-Eng-38.
**Visiting Scientist at Argonne, 1980-81 and summer1982, from the University of Georgia, Athens,Georgia, U.S.A.
Acknowledgement
The authors wish to express appreciation toI. Plesser for providing the Lindhard and Coulombwake forces used in this work and to Z. Vager forseveral helpful discussions.
References
1. W. Brandt, A. Ratkowski and R. H. Ritchie, Phys.Rev. Lett. 33, 1325 (1974).
2. Donald S. Gemmell, Nucl. Instr. and Math. 194,255 (1982).
3. J. W. Tape, W. M. Gibson, J. Remillieux, R.Laubert and H. E. Wegner, Nucl. Instr. and Meth.132, 75 (1976).
4. J. C. Eckardt, G. Lantschner, N. R. Arista andR. A. Baragiola, J. Phys. C:l1 L851 (1978).
5. R. Laubert, IEEE Trans. Nucl. Sci. NS26, 1020(1979).
6. M. F. Steuer, D. S. Gemmell, E. P. Kanter, E. A.Johnson, and B. J. Zabransky, Nucl. Instr. andMeth. 194, 277 (1982).
7. D. S. Gemmell and Z. Vager, in: Heavy IonScience, ed., D. A. Bromley (Plenum, New York) tobe published.
8. J. Lindhard and A. Winther, Mat. Fys. Medd. Dan.Vid. Selsk. 34, No. 4 (1964); J. Lindhard, Dan.Mat. Fys. Medd. 28, No. 8 (1954).
9. Z. Vager and D. S. Gemmell, Phys. Rev. Lett. 37,1352 (1976).
10. A. Faibis, R. Kaim, I. Plesser and Z. Vager,Nucl. Instr. and Meth. 170, 99 (1980).