Embed Size (px)
Citation preview
ISSN: 0971-1023 | NMIMS Management ReviewVolume XXXIV | Issue 1 | April 2017
Abstract
The aim of this paper is to conceptualize, purify, refine
and develop the multi-item scale of retail store
environment. The authors attempt to develop multi-
item scale by following a four-stage approach: defining
the construct, item generation and refining, data
collection and purification through exploratory factor
analysis and validation with the help of confirmatory
factor analysis. Data was collected from Chhattisgarh
state of Central India. The scale was tested and found
to be highly reliable with three factors of store
environment, namely, ambience, design and social
factors with 15 items in total. Organizations,
academicians and researchers will get insights on the
complex and multi-dimension framework of store
environment and will be able to measure the
dimension of store environment and consumer
behaviour relevant to their target group. After
identifying the gap on store environment literature,
analysis supports that focus on developing scale on all
dimensions of store environment was not yet
addressed.
Keywords: Ambience, Design, Scale development,
Social, Store Environment.
Store Environment in Organised Retail Outlet:Conceptual Framework and Scale Development
Pooja G. LuniyaManoj Verghese
Store Environment in Organised Retail Outlet:Conceptual Framework and Scale Development
73
cities of India, and therefore street
Contents
mall farmers. Majority of the
farmers (82%) borrow less than
Rs 5 lakhs, and 18% borrow
between Rs 5 – 10 lakhs on a
per annum basis. Most farmers
(65.79%) ar
Table sub source heading
** p < .01 + Reliability coefficie
References
Table 23: The Results of Mann-Whitney U Test for DOWJONES Index Daily Returns

ISSN: 0971-1023 | NMIMS Management ReviewVolume XXXIV | Issue 1 | April 2017
ISSN: 0971-1023 | NMIMS Management ReviewVolume XXXIV | Issue 1 | April 2017
Store Environment in Organised Retail Outlet:Conceptual Framework and Scale Development
Store Environment in Organised Retail Outlet:Conceptual Framework and Scale Development
1. Introduction:
According to the report of the Confederation of Indian
Textile Industry, the Indian economy will be one of the
fastest growing economies with 9.8% compounded
annual growth rate (CAGR) between years 2011 and
2020. It's being projected that the Indian retail market
will grow at a compounded annual growth rate (CAGR)
of 13% with an increase from USD 25 billion in 2007 to
USD 124 billion in 2020. The Indian retail market is
witnessing a dramatic change in market trends and
consumers' buying behaviour, especially in Tier-II and
Tier-III cities due to an upsurge in consumerism,
increased income levels, fluctuating consumption
pattern and spending habits, and change in lifestyle
pattern of consumers. India's organised retail market is
rigorously planning to expand the number of stores
across the country rapidly; that emerged as the biggest
challenge for retailers to position brand image among
consumers for gaining competitive advantage over
prevailing rivals in the offline market. An attractive
retail environment can be a possible way to achieve
the advantage.
The concept of store environment was addressed and
focussed upon by various researchers in recent
decades. From the past literature, it has been observed
that researchers emphasised on limited store
environmental factors. A few researchers constructed
a framework by demonstrating in-depth literature
review of several store environment variables (Turley
& Milliman, 2000; Bohl, 2012). Based on their
classification and body of knowledge, the present
study attempts to develop and validate the scales for
various store environment related items.
2. Store Environment – Concept:
Various research studies are directed towards this
issue and have addressed its influences. Store
e n v i r o n m e n t a n d a t m o s p h e r e a r e u s e d
interchangeably by several researchers. One of the
initial research studies by Kotler, (1973) defined store
atmosphere as “the effort to design buying
environments to produce specific emotional effects in
the buyer that enhance his purchase probability”.
Further, he explained the store as the place where
consumers buy products and which is more persuasive
than the product itself. Later, store atmosphere is
described in sensory terms, aural, olfactory and tactile
dimensions. Moreover, he established and explained
the causal chain connecting store atmosphere and
purchase probability, which reflects that there is a
close association between store atmosphere and
consumers' perception of retailers. Further,
application of store atmosphere was explained in a
variety of outlets viz. footwear retail, furniture,
antiques, restaurants, airports, offices, etc.
Another interesting research study was conducted on
the store environment by Baker (1987), who classified
the store environment into ambience, design and
social factors. On the other hand, Berman & Evans
(1995) suggested another classification where the
store was described into four categories viz. exterior of
the store, general interior variables, the layout and
design variables, point of purchase and decoration
variables, which was further extended with a fifth
variable, human variable (Turley & Milliman, 2000).
However Lin (2003) explained environmental cues in
terms of servicescape and identified three dimensions
viz. visual cues, auditory and olfactory cues.
Retailers invest a significant amount of capital in
designing a pleasant store environment. But at the
same time, it becomes a USP for retailers and if
planned and implemented properly, it promises good
returns for them. It is important to evaluate the impact
of store environment on consumers' buying behaviour
that ultimately leads to an increase in profitability. A
suitable measurement instrument is needed to
analyse the perceived importance of store
environment and its dimensions which will act as a
guide for retailers to make critical decisions regarding
store environment, which is a considerate cost point.
Recent studies focussed on selecting and developing a
few dimensions of retail store environment and its
scale. This study attempts to provide store
environment scale to measure the consumers'
perception of retailers for practical implementation in
the retail environment. Following are the objectives of
the present study:
i. To identify and analyse dimensions of store
environment through review of literature;
3. Major contribution on store environment
and its dimensions:
Several researchers focussed on some dimensions of
store environment that can be analysed with the help
of Table 1.
ii. To propose a scale for measuring the dimensions
of store environment and its factors;
iii. To test the developed scale for reliability and
validity, and
iv. To implement the developed scale in the retail
sector.
Table 1: Major studies in the area of store environment
Author Dimension of Store Environment
Items
Kotler (1973) Visual Colour, brightness, sizes and shapes
Aural Volume and pitch
Olfactory Scent, freshness
Tactile Softness, smoothness and temperature
Baker (1987) Ambience Temperature, Noise, Scent, cleanliness
Design Colour, style, materials, décor, shape, texture, pattern, layout, comfort, signage, accessories
Social
Other customers and service personnel (in terms of numbers, appearances, behaviour)
Turley & Milliman
(2000)
External
Exterior signs, entrance, height, size, colour of the building, lawns, location, surroundings, parking, traffic and exterior walls
General Interior Variables
Flooring, colours,
schemes, lighting, music, scents, tobacco smoke, width of aisles, paint, wallpapers, merchandise, cleanliness and
temperature.
Layout and design variables
Space design, placement and grouping of merchandise, placement of equipment, cash registers, waiting areas, traffic flow, racks and cases, waiting cues, furniture ,
etc.
Point of purchase and decoration variables
Point of purchase displays, signs and cards, wall decorations, pictures, product display, price displays ,
etc.
Human variables
Employee characteristics, crowding, customer characteristics,
etc.
74 75
cities of India, and therefore street
Contents
mall farmers. Majority of the
farmers (82%) borrow less than
Rs 5 lakhs, and 18% borrow
between Rs 5 – 10 lakhs on a
per annum basis. Most farmers
(65.79%) ar
Table sub source heading
** p < .01 + Reliability coefficie
References
Table 23: The Results of Mann-Whitney U Test for DOWJONES Index Daily Returns

ISSN: 0971-1023 | NMIMS Management ReviewVolume XXXIV | Issue 1 | April 2017
ISSN: 0971-1023 | NMIMS Management ReviewVolume XXXIV | Issue 1 | April 2017
4. Gap Analysis Based on Review of Literature:
The table below illustrates the identified gap in previously conducted studies, based on which objectives are
formed and an attempt has been made to fill the gap.
Table 2: Gap Analysis
SN
Authors
Ambient Factors Design Factors Social Factors
Ligh
tin
g
Mu
sic
Aro
ma
Tem
pe
ratu
re
Air
Cir
cula
tio
n
Cle
anlin
ess
Co
lou
rs
De
cora
tio
n
Wid
th o
f A
isle
s
Dis
pla
y B
oar
ds
Layo
ut
Sale
s P
ers
on
s’B
eh
avio
ur
Cro
wd
ing
Fello
w S
ho
pp
ers
1
Baker (1987)
√
√
√
√
√
2
Kumar, Garg
&
Rehman, (2010)
√
√
√
√
√
√
3
Khare (2010)
√
√
√
√
4
Joshi &
Kulkarni (2012)
√
√
√
√ √
5
Kazakeviciute
&
Bangte (2012)
√
6
Wright, et.al (2009)
√
√
√
7
Morrison et.al (2011)
√
√
8
Tendai
&
Crispen (2009)
√
√
√
√ √
9
Matilla
&
Wirtz (2001)
√
√
10
Han, et.al (2011)
√
√
√
√ √
11
You, Park &
Maclnnis (1998)
√
√
12
Mohan, Sivakumaran
& Sharma (2012)
√
√
√
√
√
√
13
Kumar & Kim (2013)
√
√
√
√
14
Singh &
Prashar (2011)
√
√
√
√
√
15
Quartier et. Al (2009)
√
16
Yalch
&
Spanberg (2000)
√
17 Matilla &Wirtz (2006) √ √
18 Erglou, Machleit & Chebat (2005) √ √
19 Hussain & Ali (2015) √ √ √ √ √ √ √
20 Mirabi & Simiey (2015) √ √ √ √ √
21 Machleit, Erglou & Mantel (2000) √
4.1 Store Ambience: Ambient factors refer to the non-
visual elements of a space that includes temperature,
music and lighting (Baker, 1987) or “background
conditions that exist below the level of our immediate
awareness”. In other words, ambience factors refer to
those factors, whose presence can be felt directly but
cannot be seen. These are the factors which influence
the shopping behaviour of consumers.
4.1.1. Music: Music plays a vital role in creating a
pleasant atmosphere in any place. No matter where
we are, we all listen to music irrespective of places. It
somehow helps create a cheerful mood and enhances
the ambience of the place. An individual listens to
music while studying, playing, driving, working and
shopping, which makes him feel the ambience in a
different way. So, this becomes a significant factor for
marketers to consider. Several research studies have
examined the impact of music on consumers'
behaviour through experiments (Milliman, 1982,
1986; Yalch & Spangenberg, 1990). Spangenberget et
al (2005) explained that music can affect an
individual's mood (Yalch & Spangenberg, 1988, 1990,
2000), perceptions of time (Kellaris & Altsech, 1992;
Kellaris & Kent, 1992), sales in food services (North &
Hargreaves, 1998), interactions between buyers and
sellers (Dube´ et al., 1995), product selection (North et
al., 1999) as well as actual shopping times and
associated purchase quantities (Milliman, 1982,
1986). Bitner (1992) explained the concept of music
with the service environment which acts as a mood
influencer. Bruner (1990) discussed three primary
dimensions of music viz. physical, emotional and
preferential dimensions. Milliman (1982, 1986)
conducted two separate experiments where he
manipulated music tempo and tracks, one in a
supermarket and the other in a restaurant. All these
findings reflect that music acts as a powerful stimulus
for consumer behaviours in a retail store environment
and should be addressed by researchers in a different
manner. Demoulin, (2011) found that music
congruency has a negative effect on arousal in a fast-
food restaurant context. Hussain & Ali, (2015) found
that music shows an insignificant impact on the
consumer purchase intention.
Another study examined the manipulations of scent
and music in a 3 (no music, pleasant low arousal and
high arousal music) by 3 (no scent, pleasant low and
high arousal scents) factorial design in a field setting
and found that consumers evaluate more positively
towards store environment when the arousal level of
scent and music were matched.
4.1.2 Lighting: Another important dimension of
ambience factor is lighting that influences consumers'
behaviour in the form of mood, buying behaviour,
preferences, approach behaviour and sales, etc. It has
been observed that bright lighting creates a positive
mood in shopping, enhances the shopping experience
of a shopper and increases the probability of buying.
Lighting attracts the eye of the consumer by
highlighting the product and leads to effective
evaluation of the product. So, retailers spend a huge
amount on lighting effects which may increase their
sales by exciting the mind and mood of the consumers.
Today, almost every retailer is focusing on designing an
attractive environment by arranging proper lights in
the store. Every store that one comes across has bright
lights to attract consumers' attention towards the
displayed products. Hussain & Ali, (2015) explain that
there is a significant positive influence of lighting on
the purchase intention.
4.2. Design Factors: Design factors can be classified as
aesthetic or functional. Aesthetic factors are physical
cues which customers observe (colour, architecture,
style, materials, etc.) and influence the level of
pleasure in the service experience (Aubert-Gamet
1997). Functional factors enable the behaviour of
customers in the servicescape and include layout,
signage and comfort (Baker 1987). Very few studies
have been conducted on store design, while some
elements of design factors have been considered by
researchers.
4.2.1. Colours: Bright and vibrant colours are more
eye-catching as compared to dull and light colours.
Colour is an important element in a retail setting for
drawing consumers' attention. As observed, some
colours are more pleasant for the eye and capable of
evoking consumers' response. Colours directly affect
consumers' emotional responses (Pham, Cohen,
Pracejus, & Hughes, 2001; Swinyard, 1993; Vida,
2008). Colour has a great impact on the consumer's
perception about the merchandise (Yuksel, 2009). It
has been observed that different colours stimulate
different moods and emotions of consumers. Colour
attracts the consumers and evokes emotional aspects
of an individual that leads to purchase behaviour, store
image, shopping experiences, store patronage and so
on. Use of a proper colour scheme on the walls and
ceiling of the store is a rational decision while
designing a store environment. Hussain & Ali, (2015)
explain that colour has an insignificant impact on the
consumer purchase intention which means that colour
of the retail chain outlets does not impact consumers
while shopping.
4.2.3 Space: Consumers prefer to visit stores with
Store Environment in Organised Retail Outlet:Conceptual Framework and Scale Development
Store Environment in Organised Retail Outlet:Conceptual Framework and Scale Development
76 77
cities of India, and therefore street
Contents
mall farmers. Majority of the
farmers (82%) borrow less than
Rs 5 lakhs, and 18% borrow
between Rs 5 – 10 lakhs on a
per annum basis. Most farmers
(65.79%) ar
Table sub source heading
** p < .01 + Reliability coefficie
References
Table 23: The Results of Mann-Whitney U Test for DOWJONES Index Daily Returns

sufficient space. It includes width of the aisles, traffic
flow, etc. Consumers usually seek an environment
where they can easily move and find their products.
Mohan et. al, (2013) discussed layout as the way in
which products, shopping carts and aisles are
arranged; the size and shape of those items and the
spatial relationships among them.
4.2.4 Display Boards: Display boards in the store
provide directions to the consumers within the store
regarding where to find different product categories,
availability, way to trial rooms, help desks, billing
counters, promotional offers, etc. Display boards
should be placed properly so that a consumer is
conveniently guided to the desired place within the
store. Hussain & Ali, (2015) discussed that there is a
significant relationship between the consumers'
purchase intention and product display/layout.
4.2.5 Store Design: Proper store design and its layout
encourage more exploration by consumers in the
store. This leads to an increase in store browsing and
helps the customer closely view the products and
varieties. Better the layout, better is the store image in
the mind of consumers, which, in turn, results in higher
sales, greater satisfaction, positive shopping
experience, more footfalls, etc.
4.3 Social factors: It's a proven fact that shoppers tend
to visit a store based on their past experience and
treatment they got during their last visit. On entering
any outlet, they come in contact with store employees
whose behaviour and skills may convert a prospect
into a buyer. Social factors also consist of people within
the store environment which includes the number,
types and behaviour of other consumers (Baker
&Grewal, 1994). Studies conducted examine the
influence of salespersons on consumers' emotions,
purchase behaviour and so on. Review of the literature
suggests that physical appearance of retail employees
is critical because it acts as a means to communicate
with customers about the store's image (Solomon,
1985).
4.3.1 Crowding: Limited studies have been conducted
on the effect of presence of other customers in a retail
store, or crowding. Studies on crowding have
investigated its influence on emotions (Hui and
Bateson, 1991), shopping satisfaction (Eroglu and
Machleit, 1990; Machleit, Eroglu and Mantel, 2000),
time spent in the store (Harrell, Hutt and Anderson,
1980), interpersonal behaviour (Hui and Bateson,
1991) and re-patronage intentions (Wakefield and
Blodgett, 1994). Perceived crowding is a psychological
state that occurs when a person's demand for space
exceeds the supply (Stokols, 1972).
Eroglu, Machleit, Barr (2005) and Lee, Kim, Li (2011)
discuss that consumers perceive retail crowding
differently depending on individual characteristics or
situational factors. It is quite obvious that if an
individual sees many consumers in a limited space of a
store, he perceives that the shop is crowded and tends
to avoid visiting the outlet at that moment. Many
studies conducted on crowding describe an increase in
the number of shoppers and objects in a limited store
space restrict physical body movement in the store
and the store is perceived as crowded. This is known as
spatial crowding (Machleit et. al, 2000). While in social
factors, the human dimension of crowding, on the
other hand, pertains to the number of individuals as
well as the rate and extent of social interactions among
individuals in a given environmental setting (Machleit
et. al, 2000). Literature shows that crowding has a
negative influence on consumers' psychology which
leads to dissatisfaction, comparisons with other shops,
postponement of shopping, negative store image, etc.
1.3.2 Store Employees: The store employee is another
dimension of social factors that directly and indirectly
st imulate sa les in the store. I t i s another
environmental cue which triggers the consumer by
their skills. In the present study, sales persons have
been measured in terms of their skills and behaviour,
number of employees and their appearance which
creates an environment in the store. Xu (2007), Tendai
and Crispen (2009), Kumar and Kim (2014), Mohan,
Sivakumaran & Sharma, (2012) Joshi & Kulkarni (2012)
were prominent researchers who focussed on store
employees.
5. Methodology:
5.1 Development of a Store Atmosphere Scale:
After rev iewing prev ious stud ies on sca le
development, the following scale development
process was adopted. Stages are modified w.r.t. study
in-hand, while maintaining the relevant flow of the
process.
Fig. 1: Scale Development Process.
Defining theConstruct
Final Assessment& Scale
Development
Item Generation& Refining
Data Collection& Scale
Purification
• Generate the construct by reviewing the literature.• In-depth interviewing with expert (n = 10).
• Generated items which are highly recommended by expert using Q-Sort.• Face & Construct validity.• Generated 16 items in three factors.
• Sample Representative (n=104)• Scale Reliabilty Test.• Conducted EFA.• Developed Purified Scale
• Assessing the scale through CFA.• Assess the factor structure and model fit.• Final scale for measuring store Environment.
Phase 1 - Defining the Construct:
Due consideration is given to a framework and
developing scales for accessing store ambience, design
and social factors. After extensive literature review,
three environmental factors i.e. ambience, design and
social factors, and their dimensions were identified.
On the basis of classification, initial sets of items were
extracted. Eleven experts (2 academicians, 4 retailers
and 4 doctoral students) were consulted seeking
advice on initial sets of items and asked to point out
key items which they felt should be included in store
environment scale. A set of 34 dimensions of store
environment were identified by them as mentioned in
Table 3. Some items were renamed and some were
removed from the list.
ISSN: 0971-1023 | NMIMS Management ReviewVolume XXXIV | Issue 1 | April 2017
ISSN: 0971-1023 | NMIMS Management ReviewVolume XXXIV | Issue 1 | April 2017
Store Environment in Organised Retail Outlet:Conceptual Framework and Scale Development
Store Environment in Organised Retail Outlet:Conceptual Framework and Scale Development
78 79
cities of India, and therefore street
Contents
mall farmers. Majority of the
farmers (82%) borrow less than
Rs 5 lakhs, and 18% borrow
between Rs 5 – 10 lakhs on a
per annum basis. Most farmers
(65.79%) ar
Table sub source heading
** p < .01 + Reliability coefficie
References
Table 23: The Results of Mann-Whitney U Test for DOWJONES Index Daily Returns

Table 3: Items identification through literature review
Researcher Environmental Dimensions Studied
Criterion Variable Limitations
Machleit, Erglou and Mantel (2000)
Crowding Shopping satisfaction Only focussed on crowding
Xu, (2007)
Ambience, design, employees
and crowding
Impulse buying
Undefined dimensions of store environment
Tendai
&
Crispen,
(2009)
Music, display, sales people, crowding
Impulse buying
Undefined dimensions of store environment
Kumar, Garg
&
Rehman, (2010)
Colour, lighting, music, crowding, design and layout,
olfactory and tactile factors
Purchase intentions, shopping satisfaction, positive word of mouth
Undefined dimensions of store environment
Chen and Hsieh
(2011)
Ambience, design and social factors
Customer
perception and customer behaviour
Undefined sub-dimensions of ambience, design and social factors
Khare (2011)
Aesthetics (interior, colour, lighting, decor), social
Mall shopping behaviour
Left some dimensions of store environment
Morrison et. al (2011)
Music and aroma
Shopping behaviour and shopping satisfaction
Only focussed on music and aroma
Maymand
& Ahmadinejad
(2011)
Store environment
Impulse buying
Undefined dimensions of store environment
Joshi &
Kulkarni (2012)
Store interior, store personnel, fellow shoppers, comfort, beauty, aesthetic, display
Consumer shopping experience
Left some dimensions of store environment
Mohan, Sivakumaran
& Sharma, (2012)
Music, scent, light, assortment, layout, employee
Variety seeking
Left some dimensions of store environment like temperature, colour, crowding etc.
Kumar & Kim (2014)
Lighting, music, colour, merchandise, store information, display, décor, employees
Customer response
Left some dimensions of store environment like temperature, cleanliness, crowding etc
Phase 2: Item Generation and Refining:
The store environment scale comprised of 3 second
order reflective factors which are each comprised of 5-
6 individual factors, which are reflected in 3-scale
items. A set consisting 34 items based on the literature
reviewed in Table 3 was provided to experts identified
in Phase 1 who were asked to rate them on a 5-point
Likert scale ranging from 'not at all important' to 'very
important'. Based on the items suggested by the
experts in the first stage and by Q-sort technique, 16
dimensions were finally sorted out as key store
environment elements representing three factors viz.
ambience, design and social factors. All dimensions of
store environment were mentioned on the card and
experts were asked to put that card on the 3 identified
factors. A set of 48 statements were framed based on
the literature representing 16 dimensions of store
environment mentioned in Table 4. Experts were also
asked to suggest on the wordings, clarity, conciseness,
readability and response format ensuring content and
face validity of the scale.
Table 4: Items included in each dimension and sub-dimension during the item generation, refining and purification stage by expert recommendation
Factors Initial Sub-dimension Initial Purification
Renamed Sub-Dimensions
Final Factors by Q-Sort Technique
General Interior Variables - (Turley & Milliman, 2000)
Flooring and carpeting Selected Decoration Design Factors
Colour schemes Selected Colour Design Factors
Lighting
Selected
Lighting
Ambience Factors
Music
Selected
Music
Ambience Factors
P.
A.
Usage
Rejected
Scents
Selected
Scents
Ambience Factors
Tobacco Smoke
Selected
Scents
Ambience Factors
Width of Aisles
Selected
Space
Design Factors
Wall Composition
Selected
Décor
Design Factors
Paint and Wall paper
Selected
Colour
Design Factors
Ceiling Composition
Selected
Décor
Design Factors
Air circulation (Baker, 1987)
Selected
Air circulation
Merchandise
Rejected
Temperature
Selected
Temperature
Ambience Factors
Cleanliness
Selected
Cleanliness
Ambience Factors
Layout & Design Variables -
(Turley &
Milliman, 2000)
Space Design and allocation
Selected
Space
Design Factors
Placement of merchandise
Selected
Layout
Design Factors
Grouping of merchandise
Selected
Layout
Design Factors
Workstation placement
Selected
Layout
Design Factors
Placement of equipment
Rejected
Placement of cash registers Rejected
Waiting areas Selected Layout Design Factors
Waiting rooms
Selected
Layout
Design Factors
Department locations
Selected
Layout
Design Factors
Traffic flow
Selected
Space
Design Factors
Racks and cases
Selected
Layout
Design Factors
Waiting Queues
Selected
Layout
Design Factors
Furniture Rejected
Dead areas Rejected
ISSN: 0971-1023 | NMIMS Management ReviewVolume XXXIV | Issue 1 | April 2017
ISSN: 0971-1023 | NMIMS Management ReviewVolume XXXIV | Issue 1 | April 2017
Store Environment in Organised Retail Outlet:Conceptual Framework and Scale Development
Store Environment in Organised Retail Outlet:Conceptual Framework and Scale Development
80 81
cities of India, and therefore street
Contents
mall farmers. Majority of the
farmers (82%) borrow less than
Rs 5 lakhs, and 18% borrow
between Rs 5 – 10 lakhs on a
per annum basis. Most farmers
(65.79%) ar
Table sub source heading
** p < .01 + Reliability coefficie
References
Table 23: The Results of Mann-Whitney U Test for DOWJONES Index Daily Returns

Table 4: Items included in each dimension and sub-dimension during the item generation, refining and purification stage by expert recommendation
Factors Initial Sub-dimension Initial Purification
Renamed Sub-Dimensions
Final Factors by Q-Sort Technique
Point of Purchase & Decoration Variables - (Turley & Milliman, 2000)
Point of purchase displays Rejected
Signs and cards Selected Display Boards Design Factors
Wall decorations Selected Décor Design Factors
Degrees and certificates Selected Décor Design Factors
Pictures
Selected
Décor
Design Factors
Artworks
Selected
Décor
Design Factors
Product displays
Rejected
Usage instructions
Selected
Display Boards
Design Factors
Price displays
Selected
Display Boards
Design Factors
Teletext
Rejected
Human Variables -
(Turley and Milliman, 2000)
Employee characteristics
Selected
Store employee assistance
Social Factors
Employee uniform
Selected
Salespersons’
appearance
Social Factors
Crowding
Selected
Crowding
Social Factors
Customer characteristics
Selected
Fellow shoppers
Social Factors
Privacy
Selected
Number of shoppers
Social Factors
Phase 3: Data Collection and Scale Purification:
The items retained in the previous process were
considered for further framing of instrument scale. On
the basis of experts' opinion, 48 statements
representing 16 dimensions were sorted out and
framed as scale statements seeking response. A total
of 117 consumers, while exiting the store, were
approached seeking response through a structured
questionnaire based on selected items at retail outlets
in malls in Raipur city. One research assistant was
assigned the job to approach and collect responses
near the entrance of the store. As soon as a consumer
left the store, the research assistant approached the
consumer requesting to participate in the survey. He
explained the purpose of conducting the research
while persuading and assisting the participants to fill
the questionnaire. Once the assistant got the
questionnaire filled in, he ensured completeness of
the survey form, thereby reducing the chances of error
in responses. However, some errors were found and
only 104 responses were completed in all aspects and
were considered for further analysis. Respondents
consisted of both male and female consumers; most of
them were young consumers in the age group of 21-40
years.
Further, items of store environment were analyzed for
reliability. For this, the length of the questionnaire was
shortened for conducting the study so as to encourage
respondents to participate (thereby helping reduce
time spent by respondents). A very lengthy
questionnaire creates boredom among respondents
which may lead to biased responses. The complete set
of items had Cronbach's Alpha value of more than 0.50
under purification stage. The reliability of the scale was
assessed using Cronbach's Alpha. The table illustrates
that scale so constructed consists of 48 statements
relating to 16 items' scale categorizing three variables
viz. ambience, design and social factors. The values of
alpha for each item range from 0.838 to 0.947. The
overall value of Cronbach's Alpha is 0.914 which shows
the scale is highly reliable. The value of Cronbach's
Alpha of ambience factors, design and social factors
are 0.896, 0.851 and 0.863 respectively, which
represent a highly reliable scale. The values of all the
16 individual items are more than .839 representing
higher reliability.
Table 5: Reliability Stats of the Scale
Factors
Dimensions & Alpha Value
Items Alpha
Ambience Music X11 Music played in the store was pleasurable .867
X12 The store music played was entertaining
X13
I was amused by the music played in the store
Lighting
X21
The store has bright lighting arrangement
.894
X22 Lighting of the store was sufficient
X23
Store lighting intensity was quite appropriate
Fragrance/Aroma
X31
Aroma in the store was gentle
.934
X32
Fragrance in the store was quite pleasurable
X33
Fragrance was appropriate in the store
Temperature
X41
Temperature within
the store was comfortable
.946
X42
Store temperature was suitable as per climate
X43
Store had a relaxing temperature
Air Circulation
X51
There was sufficient air circulation in the store
.934
X52
Air circulation arrangement of the store was up to the mark
X53
Store was suitably arranged for overall air circulation
Cleanliness
X61
Proper care was given to
cleanliness of the store
.912
X62 Store was appropriately hygienic
X63 Store was properly maintained for tidiness
ISSN: 0971-1023 | NMIMS Management ReviewVolume XXXIV | Issue 1 | April 2017
ISSN: 0971-1023 | NMIMS Management ReviewVolume XXXIV | Issue 1 | April 2017
Store Environment in Organised Retail Outlet:Conceptual Framework and Scale Development
Store Environment in Organised Retail Outlet:Conceptual Framework and Scale Development
82 83
cities of India, and therefore street
Contents
mall farmers. Majority of the
farmers (82%) borrow less than
Rs 5 lakhs, and 18% borrow
between Rs 5 – 10 lakhs on a
per annum basis. Most farmers
(65.79%) ar
Table sub source heading
** p < .01 + Reliability coefficie
References
Table 23: The Results of Mann-Whitney U Test for DOWJONES Index Daily Returns
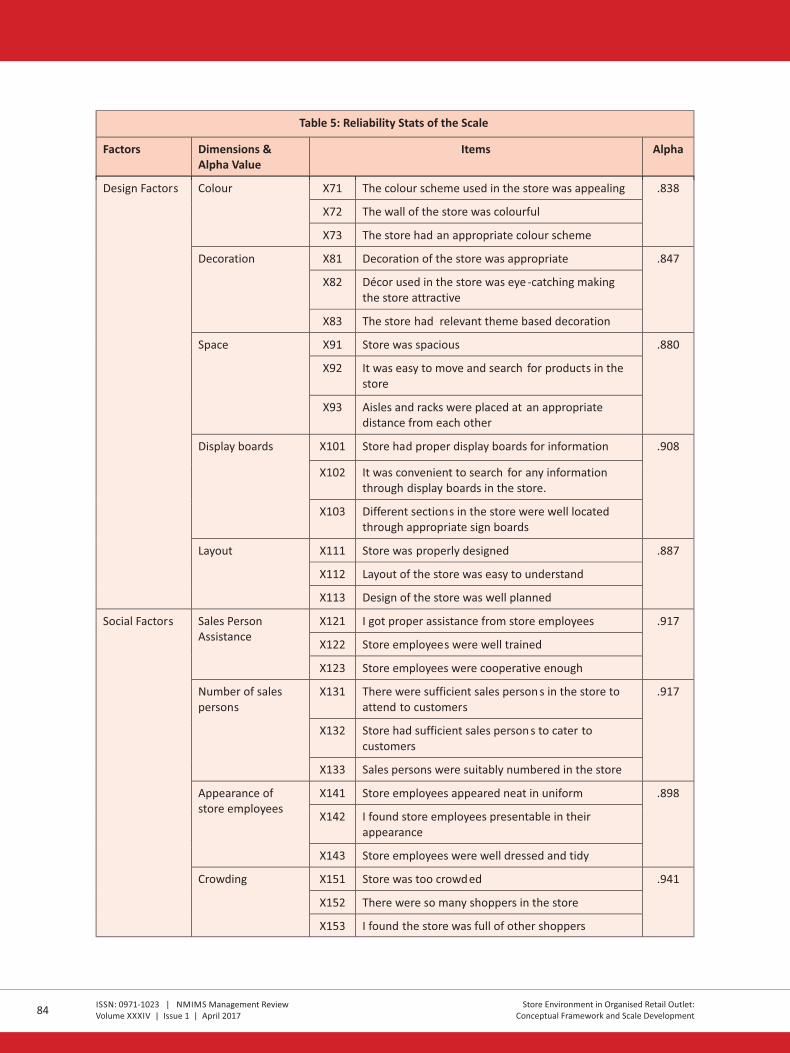
Table 5: Reliability Stats of the Scale
Factors
Dimensions & Alpha Value
Items Alpha
Design Factors
Colour X71 The colour scheme used in the store was appealing .838
X72 The wall of the store was colourful
X73 The store had an appropriate colour scheme
Decoration X81 Decoration of the store was appropriate .847
X82 Décor used in the store was eye -catching making the store attractive
X83
The store had
relevant theme based decoration
Space
X91
Store was spacious
.880
X92
It was easy to move and search for products
in the store
X93
Aisles and racks were placed at an appropriate distance from each other
Display boards
X101
Store had
proper display boards for information
.908
X102
It was convenient to search for any information through display boards in the store.
X103
Different sections
in the store were well located
through appropriate sign boards
Layout
X111
Store was properly designed
.887
X112
Layout of the store was easy to understand
X113
Design of the store was well planned
Social Factors
Sales Person Assistance
X121
I got proper assistance from store employees
.917
X122
Store employees
were well trained
X123
Store employees were cooperative enough
Number of sales persons
X131
There were sufficient sales person s
in the store to attend to customers
.917
X132
Store had sufficient sales person s
to cater to
customers
X133
Sales
persons were suitably numbered in the store
Appearance of store employees
X141
Store employees appeared neat in uniform
.898
X142
I found store employees presentable in their appearance
X143
Store employees were well dressed and tidy
Crowding
X151
Store was too crowded
.941
X152
There were so many shoppers in the store
X153
I found the store was full of other shoppers
Fellow Shoppers
X161
I found other customers in the store similar to my style
.900
X162
Fellow shoppers were appropriate in terms of behaviour.
X163 Other shoppers in the store were well -mannered
Table 5: Reliability Stats of the Scale
Factors
Dimensions & Alpha Value
Items Alpha
Before conducting exploratory factor analysis, KMO
measure of adequacy test was conducted to establish
the suitability of the data for factor analysis and
Barlett's test of sphericity was tested to analyse the
overall significance of the correlation matrix. The
Kaiser-Meyer-Olkin (KMO) measure of sampling
adequacy for store ambience factors showed a value of
0.795 and Barlett's test of sphericity (approx. Chi
square = 1119.461) were also found at acceptable
levels. Similarly, the Kaiser-Meyer-Olkin (KMO)
measure of sampling adequacy for design factors
showed a value of 0.728 and Barlett's test of sphericity
(approx. Chi square = 701.479) were also found at
acceptable levels. The Kaiser-Meyer-Olkin (KMO)
measure of sampling adequacy for social factors
showed a value of 0.766 and Barlett's test of sphericity
(approx. Chi square = 895.968) were also found at
acceptable levels. The outcome of both of these values
for all factors suggested going ahead with further
investigation.
Factor analysis with principle component method and
varimax rotation was used to validate, reduce and
analyze the factors. Loadings of dimensions of
ambience factors can be seen. Music was loaded on 5 th
component, lighting on 3 component, scent on 2 rd nd
component and cleanliness on 4 component while th
loadings of temperature and air circulation can be seen
on a single component 1 which are renamed as
temperature. The loading of all the dimensions of store
ambience ranges from .715 to .986 respectively.
After that, loadings of design factors were analyzed
through EFA. Colour was loaded on 5 component, th
decor on 3 component, layout on 2 component, rd nd
width of aisles on 4 component and display boards on th
1 component. The loading of all the dimensions of st
store ambience ranges from .791 to .976 respectively.
Lastly, the loadings of social factors were analysed.
Store employee was loaded on 5 component, th
appearance of sales persons on 3 component, rd
number of sales persons on 2 component, number of nd
fellow shoppers on 4 component and crowd on 1 th st
component. The loading of all the dimensions of store
ambience ranges from .755 to .978 respectively.
ISSN: 0971-1023 | NMIMS Management ReviewVolume XXXIV | Issue 1 | April 2017
ISSN: 0971-1023 | NMIMS Management ReviewVolume XXXIV | Issue 1 | April 2017
Store Environment in Organised Retail Outlet:Conceptual Framework and Scale Development
Store Environment in Organised Retail Outlet:Conceptual Framework and Scale Development
84 85
cities of India, and therefore street
Contents
mall farmers. Majority of the
farmers (82%) borrow less than
Rs 5 lakhs, and 18% borrow
between Rs 5 – 10 lakhs on a
per annum basis. Most farmers
(65.79%) ar
Table sub source heading
** p < .01 + Reliability coefficie
References
Table 23: The Results of Mann-Whitney U Test for DOWJONES Index Daily Returns

Table 6: Exploratory Factor Analysi s: Ambience factors
KMO and Bartlett's Test- Ambience factors
Kaiser-Meyer-Olkin Measure of Sampling Adequacy.
0.795
Bartlett's Test of Sphericity
Approx. Chi-Square
1119.461
Df
153
Sig.
0
Rotated Component Matrix
Component
1 2 3 4 5
X51 .881
X52 .827
X53
.815
X42
.767
X43
.753
X41
.740
X32
.916
X31
.901
X33
.874
X22
.843
X21
.830
X23
.824
X63
.896
X61
.891
X62
.877
x13
.751
x12
.743
x11
.733
Extraction Method: Principal Component Analysis.
Rotation Method: Varimax with Kaiser Normalization.
a. Rotation converged in 8 iterations.
Table 7: Exploratory Factor Analysis: Design factor
KMO and Bartlett's Test
Kaiser-Meyer-Olkin Measure of Sampling Adequacy. .728
Bartlett's Test of Sphericity
Approx. Chi-Square 701.479
Df 105
Sig.
.000
Rotated Component Matrixa
Component
1
2
3
4
5
X101
.917
X102
.863
X103
.857
X112
.892
X111
.882
X113
.870
X82
.881
X83
.833
X81
.802
X91
.857
X92
.856
X93
.787
X71
.897
X72
.832
X73
.799
Extraction Method: Principal Component Analysis.
Rotation Method: Varimax with Kaiser Normalization.
a. Rotation converged in 5 iterations.
ISSN: 0971-1023 | NMIMS Management ReviewVolume XXXIV | Issue 1 | April 2017
ISSN: 0971-1023 | NMIMS Management ReviewVolume XXXIV | Issue 1 | April 2017
Store Environment in Organised Retail Outlet:Conceptual Framework and Scale Development
Store Environment in Organised Retail Outlet:Conceptual Framework and Scale Development
86 87
cities of India, and therefore street
Contents
mall farmers. Majority of the
farmers (82%) borrow less than
Rs 5 lakhs, and 18% borrow
between Rs 5 – 10 lakhs on a
per annum basis. Most farmers
(65.79%) ar
Table sub source heading
** p < .01 + Reliability coefficie
References
Table 23: The Results of Mann-Whitney U Test for DOWJONES Index Daily Returns

Table 8: Exploratory Factor Analysis: Social factor
KMO and Bartlett's Test
Kaiser-Meyer-Olkin Measure of Sampling Adequacy. .766
Bartlett's Test of Sphericity Approx. Chi-Square 895.968
Df 105
Sig.
.000
Rotated Component Matrixa
Component
1
2
3
4
5
X152
.943
X151
.936
X153
.934
X133
.866
X132
.862
X131
.838
X141
.890
X143
.873
X142
.861
X162
.900
X161
.882
X163
.870
X121
.884
X122
.871
X123
.757
Extraction Method: Principal Component Analysis.
Rotation Method: Varimax with Kaiser Normalization.
a. Rotation converged in 6 iterations.
Stage 4: Final Assessment and Development of Scale:
A set of 15 items representing three factors were
further assessed and analysed by applying
confirmatory factor analysis. The value of Normed chi
square (χ2/df) for all three factors are below 3 which
can be seen from Table 9. The root mean square error
of approximation (RMSEA) avoids the issues related to
sample size. All three factors reflect acceptability as
values should lie between 0-1. The standardized root
mean square residual removes this difficulty in
interpretation, and ranges from 0 to 1; all factor values
are at an acceptable level. The values of GFI, AGFI and
NFI lie within the range, which are at acceptable levels.
Table 9: Model Fit Indices Ambience Factors Design Factors Social Factors
Normed Chi Square 2.3193 1.5345 1.465
RMSEA (Root Mean Square Error of Approximation)
.061
.058 .064
Standardised Root Mean Residual (RMR)
.079
.74 0.69
Goodness-of-fit Index (GFI)
.705
.829
.836
Adjusted
Goodness-of-fit (AGFI)
.896
.744
.754
(NFI)
.966
.939
0.980
Comparative Fit Index (CFI) .848 .935 957
Discussion and Conclusion:
In the era of globalisation and digitalisation, attracting
consumers to visit the store is the biggest challenge for
organisations and retailers. To achieve this, they need
to attract consumers to prefer visiting the store over
online shopping. Research on store environment scale
is an area which is addressed by them so as to plan and
implement strategy for increasing footfalls and
consumers.
The scale developed consists of 15 items representing
three dimensions viz. ambience, design and social
factors. This was done by following four stages defining
the constructs, item generation and refining, data
collection and purification, final assessment and scale
development. Initially, six dimensions of ambience
factors were taken for the analysis, which was reduced
to five, namely, music, lighting, temperature, scent and
cleanliness. Design factors like colours, décor, space,
display board and layout were the final dimensions
which were left. Lastly, social factors like store
employees' behaviour, number of employees and
appearance, crowding, fellow shoppers were left for
the final scale. The reliability of the scale was analysed
and all items were found to be highly reliable as the
values were above .80. Further, confirmatory factor
analysis was done for assessing the model fit. Overall,
CFA results favoured the three factors of store
environment and supported the validity of the scale.
Nowadays the service industry emphasizes on
designing an attractive environment for consumers to
make their visit pleasant experiences. Further, these
scales are not only limited to retail stores but also
applied to servicescape like restaurants and hotels
industry especially with factors like ambience and
design.
Managerial Implications:
The scale developed under this study has major
implications for retailers, academicians and
researchers. The store environment model developed
in this study helps retailers to gain an insight of store
environment. The final factors of store environment
identify its various dimensions underpinning apparel
retailers and will assist them to target the market
accordingly. These dimensions of store environment
provide a framework for retailers to build a favourable
store environment for consumers. Manipulating these
dimensions of store environment will enable retailers
to strategically increase footfalls leading to increase in
sales. Academicians and researchers will be able to
conduct several research studies with the help of these
scales that are already tested and validated.
Limitations and Future Research:
The present study focused on developing scales
particularly for store environment of the retail sector
and in one country; therefore, one must be cautious
while applying this analysis to other sectors. Further,
ISSN: 0971-1023 | NMIMS Management ReviewVolume XXXIV | Issue 1 | April 2017
ISSN: 0971-1023 | NMIMS Management ReviewVolume XXXIV | Issue 1 | April 2017
Store Environment in Organised Retail Outlet:Conceptual Framework and Scale Development
Store Environment in Organised Retail Outlet:Conceptual Framework and Scale Development
88 89
cities of India, and therefore street
Contents
mall farmers. Majority of the
farmers (82%) borrow less than
Rs 5 lakhs, and 18% borrow
between Rs 5 – 10 lakhs on a
per annum basis. Most farmers
(65.79%) ar
Table sub source heading
** p < .01 + Reliability coefficie
References
Table 23: The Results of Mann-Whitney U Test for DOWJONES Index Daily Returns

the study can be done on scales for different sectors as
well as for the online shopping environment. This
study lacks in analyzing store environment on cultural
differences. Cross industry and cross-national data
would be more useful and more generalized for future
research. Another limitation of this study is the use of a
relatively small sample size and restricted to specific
geographical location of Chhattisgarh state. Further
research could be undertaken with a large sample
representing different parts of India. A separate study
can be done on comparison of urban and rural retail
scale development.
References
• Anna S. Mattila & Jochen Wirtz, (2006). Arousal expectations and service evaluations. International Journal of
Service Industry Management.17(3), 229 – 244.
• Aubert-Gamet, V. (1997). Twisting Servicescapes: Diversion of the Physical Environment in a Re-Appropriation
Process. Journal of Service Management, 8(1), 26-41.
• Basera, C.H., Mutsikiwa, M., & Dhliwayo K. (2013). A Comparative Study on the Impact of Ambient Factors on
Patronage: A Case of Three Fast Foods Retail Brands in Masvingo, Zimbabwe . Journal of Arts, Science &
Commerce, IV(1), 24-32.
• Retail Management: A Strategic ApproachBerman, Barry, & Evans, Joel R.: , 6th Edition, Prentice-Hall, Inc.,
Englewood Cliffs, NJ. 1995.
• Bitner, M. J. (1990). Evaluating service encounters: The Effects of Physical Surroundings and Employee
Responses. (2),69-82.Journal of Marketing, 54
• Journal Bitner, M. J. (1992). Servicescapes: The Impact of Physical Surroundings on Customers and Employees.
of Marketing Research,56, 57-71.
• . Working Paper. Bohl, P. (2012). The Effects of Store Atmosphere on Shopping Behaviour - A Literature Review
BCE Marketing ésMédiaIntézet. Budapest.
• Journal of Marketing, 54Bruner, Gordon II (1990). Music, Mood and Marketing. (4), 94–100.
• Demoulin, N. T. M. (2011). Music Congruency in a service setting: The mediating role of emotional and
cognitive responses, 10-18.Journal of Retailing & Consumer services, 18,
• Dube´ Laurette, Chebat Jean-Charles, Morin Sylvie. (1995). The Effects of Background Music on Consumers'
Desire to Affiliate in Buyer/Seller Interactions, (4),305– 19.Psychology & Marketing,12
• Dubé, L. and Morin, S. (2001). Background music pleasure and store evaluation: Intensity effects and
psychological mechanisms. 2), 107- 113.Journal of Business Research, 54(
• Eroglu, S. A., & Machleit, K. A. (1990). An Empirical study of Retail Crowding: Antecedents and Consequences.
Journal of Retailing, 66, 201–221.
• Eroglu, S. A., Machleit, K., & Feldman Barr, T. (2005). Perceived retail crowding and shopping satisfaction: the
role of shopping values. Journal of Business Research, 58, 1146-1153.
• Harrell, G. D., Hutt, M. D., & Anderson, J. C. (1980). Path Analysis of Buyer Behavior under Conditions of
Crowding. 45–51.Journal of Marketing Research, 17,
• Hui, M. K., & Bateson, J. E. G. (1991). Perceived control and the effects of Crowding and Consumer choice on
the Service experience. 174–184.Journal of Consumer Research, 18,
• International Journal of Hussain & Ali. (2015). Effect of Store Atmosphere on Consumer Purchase Intention.
Marketing studies. 7(2),35-43.
• Joshi. J. V. & Kulkarni. V. R. (2012). A factorial study of impact of Store Atmospherics in Organized Retail Chain
Stores on Customers shopping experience. SMS, VIII(2), 89-98.
• Kellaris J, Altsech M. (1992). The Experience of Time as a function of Musical Loudness and Gender of Listener.
Association of Consumer Research, 19, 725–739.
• Kellaris James J, Kent Robert J. (1992). The Influence of Music on Consumers' Perceptions: Does Time Fly When
You're Having Fun? ogy. (4).365 –76.Journal of Consumer Psychol 1
• Kellaris, J. J., & Rice, R. C. (1993). The Influence of Tempo, Loudness, and Gender of Listener on Responses to
Music. (1), Psychology and Marketing, 10 http://dx.doi.org/10.1002/mar.4220100103
• Kazakevičiūtė & Banytė, (2012). The relationship between Retail Crowding and Consumers satisfaction.
Economics and management 17. (2), 652-658.
• Journal of Retailing, 49Kotler, P. (1973). Atmospherics as a Marketing Tool. (4).48-64.
• Kumar. I. Garg. R. & Rahman.I. (2010). Influence of Retail Atmospherics on Customer Value in an Emerging
Market Condition. Great Lakes Herald, 4(1), 1-13.
• Lee, S. Y., Kim, J.O., & Li, J. G. (2011). Impacts of store crowding on shopping behavior and store image.
Journal of Asian Architecture and Building Engineering, 10(1), 133-140.
• Machleit, K. A. and Eroglu, S.A. (2000). Describing and measuring Emotional response to Shopping Experience.
Journal of Business Research, 49(2), 101-11.
• Machleit Karen A, Tracy Meyer, Eroglu Sevgin A. (2005). Evaluating the nature of hassles and uplifts in the Retail
Shopping context. Journal of Business Research, 58 (5), 655–663.
• Journal of Milliman, R. E. (1982). Using background Music to affect the Behavior of Supermarket Shoppers.
Marketing, 46(3), 86–91.
• Journal of Milliman, R. E. (1986). The influence of background Music on the Behavior of Restaurant Patrons.
Consumer Research 13, (2), 286-89.
• Mirabi, V.R. & Simiey, E. (2015). Factors influencing Store Environment Perception (evidence from Iranian chain
stores). 171-177.Journal of Scientific Research & Development, 2(6),
• Mohan, G., Sivakumaran, B. and Sharma, P. (2013). Impact of Store Environment on Impulse buying behavior.
European Journal of Marketing,47(10),1711 – 1732.
• Mohan, G., Sivakumaran, B. and Sharma, P. (2012). Store Environment's impact on variety seeking behavior.
Journal of Retailing and consumer services,19,419 – 428.
• Morrison, M., Gan, S. Dubelaar, C. Oppewal, H. (2011). In-store Music and Aroma
• Journal of Business Research 64influences on Shopper Behaviour and Satisfaction. . (6), 558-64.
• North Adrian C, Hargreaves David J. (1998). The Effect of Music on Atmosphere and Purchase Intentions in a
Cafeteria. , (24), 22-54.Journal of Applied Social Psychology 28
• North Adrian C, Hargreaves David J, & McKendrick Jennifer. (1999). The influence of In-Store Music on Wine
selections. , (2), 271– 276.Journal of Applied Psychology 84
• Pham, M. T., Cohen, J. B., Pracejus, J. W., & Hughes, G. D. (2001). Affect Monitoring and the Primacy of Feelings
in Judgment. , 167–188.Journal of Consumer Research 28,
ISSN: 0971-1023 | NMIMS Management ReviewVolume XXXIV | Issue 1 | April 2017
ISSN: 0971-1023 | NMIMS Management ReviewVolume XXXIV | Issue 1 | April 2017
Store Environment in Organised Retail Outlet:Conceptual Framework and Scale Development
Store Environment in Organised Retail Outlet:Conceptual Framework and Scale Development
90 91
cities of India, and therefore street
Contents
mall farmers. Majority of the
farmers (82%) borrow less than
Rs 5 lakhs, and 18% borrow
between Rs 5 – 10 lakhs on a
per annum basis. Most farmers
(65.79%) ar
Table sub source heading
** p < .01 + Reliability coefficie
References
Table 23: The Results of Mann-Whitney U Test for DOWJONES Index Daily Returns
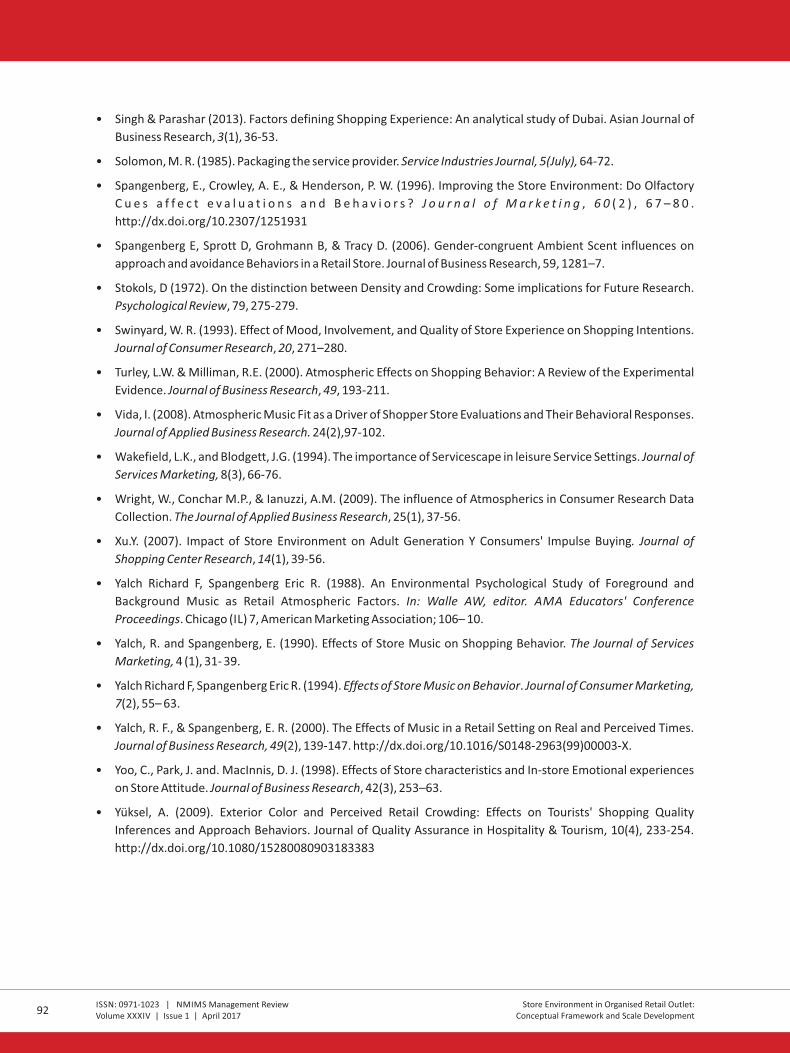
• Singh & Parashar (2013). Factors defining Shopping Experience: An analytical study of Dubai. Asian Journal of
Business Research, (1), 36-53.3
• Service Industries Journal, 5(July),Solomon, M. R. (1985). Packaging the service provider. 64-72.
• Spangenberg, E., Crowley, A. E., & Henderson, P. W. (1996). Improving the Store Environment: Do Olfactory
C u e s a f f e c t e v a l u a t i o n s a n d B e h a v i o r s ? , ( 2 ) , 6 7 – 8 0 . J o u r n a l o f M a r k e t i n g 6 0
http://dx.doi.org/10.2307/1251931
• Spangenberg E, Sprott D, Grohmann B, & Tracy D. (2006). Gender-congruent Ambient Scent influences on
approach and avoidance Behaviors in a Retail Store. Journal of Business Research, 59, 1281–7.
• Stokols, D (1972). On the distinction between Density and Crowding: Some implications for Future Research.
Psychological Review, 79, 275-279.
• Swinyard, W. R. (1993). Effect of Mood, Involvement, and Quality of Store Experience on Shopping Intentions.
Journal of Consumer Research 20, , 271–280.
• Turley, L.W. & Milliman, R.E. (2000). Atmospheric Effects on Shopping Behavior: A Review of the Experimental
Evidence. , , 193-211. Journal of Business Research 49
• Vida, I. (2008). Atmospheric Music Fit as a Driver of Shopper Store Evaluations and Their Behavioral Responses.
Journal of Applied Business Research. 24(2),97-102.
• Journal of Wakefield, L.K., and Blodgett, J.G. (1994). The importance of Servicescape in leisure Service Settings.
Services Marketing, 8(3), 66-76.
• Wright, W., Conchar M.P., & Ianuzzi, A.M. (2009). The influence of Atmospherics in Consumer Research Data
Collection. , 25(1), 37-56.The Journal of Applied Business Research
• Xu.Y. (2007). Impact of Store Environment on Adult Generation Y Consumers' Impulse Buying. Journal of
Shopping Center Research, 14(1), 39-56.
• Yalch Richard F, Spangenberg Eric R. (1988). An Environmental Psychological Study of Foreground and
Background Music as Retail Atmospheric Factors. In: Walle AW, editor. AMA Educators' Conference
Proceedings. Chicago (IL) 7, American Marketing Association; 106– 10.
• The Journal of Services Yalch, R. and Spangenberg, E. (1990). Effects of Store Music on Shopping Behavior.
Marketing, 4 (1), 31- 39.
• Yalch Richard F, Spangenberg Eric R. (1994). . Effects of Store Music on Behavior Journal of Consumer Marketing,
7(2), 55– 63.
• Yalch, R. F., & Spangenberg, E. R. (2000). The Effects of Music in a Retail Setting on Real and Perceived Times.
Journal of Business Research, 49(2), 139-147. http://dx.doi.org/10.1016/S0148-2963(99)00003-X.
• Yoo, C., Park, J. and. MacInnis, D. J. (1998). Effects of Store characteristics and In-store Emotional experiences
on Store Attitude. , 42(3), 253–63.Journal of Business Research
• Yüksel, A. (2009). Exterior Color and Perceived Retail Crowding: Effects on Tourists' Shopping Quality
Inferences and Approach Behaviors. Journal of Quality Assurance in Hospitality & Tourism, 10(4), 233-254.
http://dx.doi.org/10.1080/15280080903183383
Pooja G. Luniya is an Assistant Professor in the Department of Management - Rungta Group of Colleges,
Bhilai (C.G.) and holds Master's degree in Business Administration (MBA – Finance & HR), Commerce
(M.Com). Pooja is a recipient of National Eligibility Test (NET) and State Eligibility Test (SET) certificate
awarded by UGC, Govt. of India. She has effectual teaching involvement of 7 years. She is also a Research
Scholar with CSVTU, Bhilai (C.G.) tracking Doctorate Program. Her research interest includes the dynamics
of Consumer Behaviour and modern retailing styles. Recently she was awarded as Young Scientist 2017 by
Chhattisgarh Council of Science & Technology (CGCOST). She has contributed several research works to
national and international journals. Some of her research work was presented in conferences held at
B'schools of repute including IIM- A, IIM- I, IIM-R, Nirma University and many more. She can be reached at
Manoj Verghese is Dean (Student development) as well as Professor Head, Department of Management
Studies, Rungta College of Engineering and Technology, Bhilai. He has 17 years of teaching experience.
After doing M.Com and M.B.A, he did Ph.D. in management from Pt. Ravishankar Shukla University, Raipur
in the year 2009. He also has professional membership of IIAP (International Association to Applied
Psychology).
ISSN: 0971-1023 | NMIMS Management ReviewVolume XXXIV | Issue 1 | April 2017
ISSN: 0971-1023 | NMIMS Management ReviewVolume XXXIV | Issue 1 | April 2017
Store Environment in Organised Retail Outlet:Conceptual Framework and Scale Development
Store Environment in Organised Retail Outlet:Conceptual Framework and Scale Development
92 93
cities of India, and therefore street
Contents
mall farmers. Majority of the
farmers (82%) borrow less than
Rs 5 lakhs, and 18% borrow
between Rs 5 – 10 lakhs on a
per annum basis. Most farmers
(65.79%) ar
Table sub source heading
** p < .01 + Reliability coefficie
References
Table 23: The Results of Mann-Whitney U Test for DOWJONES Index Daily Returns