Embed Size (px)
Citation preview
Storm HydrographsStorm Hydrographs Yr12IB Drainage BasinsYr12IB Drainage Basins
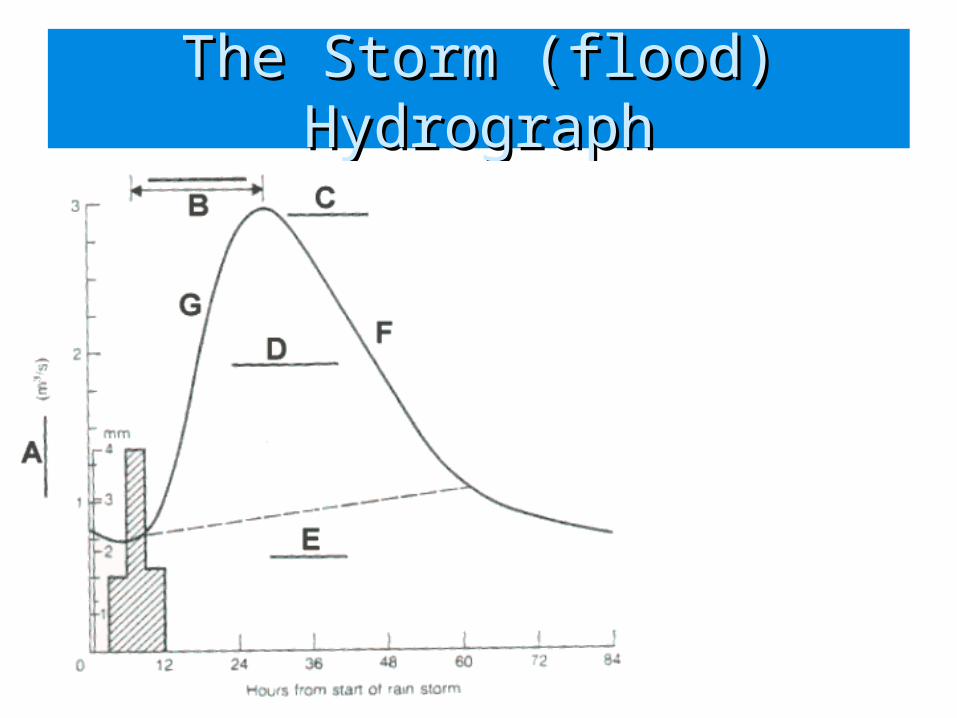
The Storm (flood) HydrographThe Storm (flood) Hydrograph
A = Discharge
B = Lag time
C = Peak discharge
D = Storm flow
E = Base flow
F = Falling limb
G = Rising limb
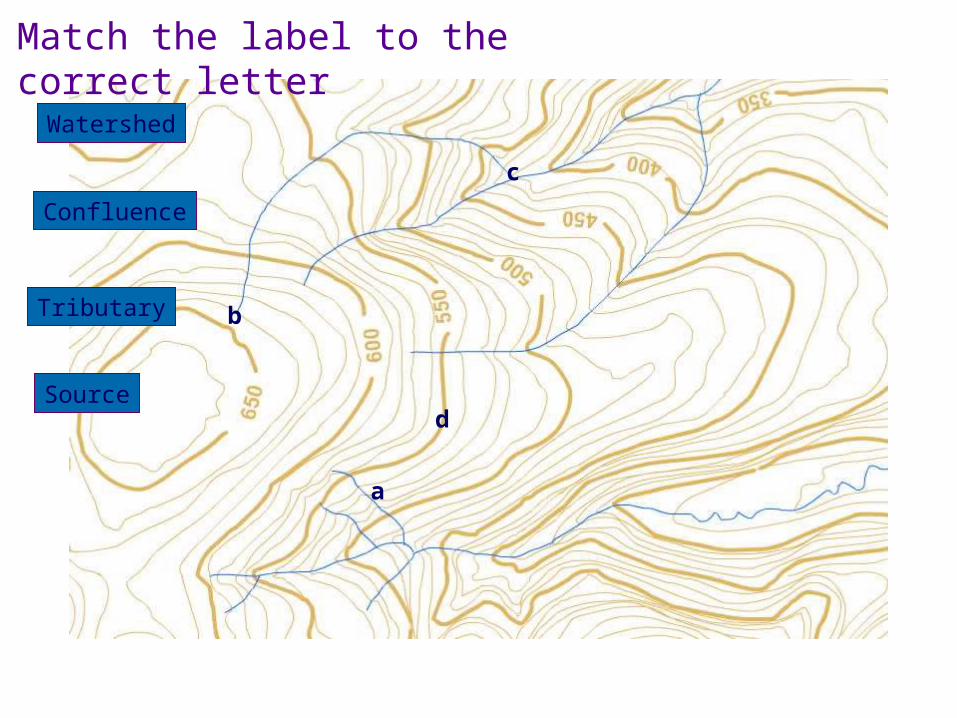
Watershed
Tributary
Match the label to the correct letter
Confluence
a
b
c
Sourced
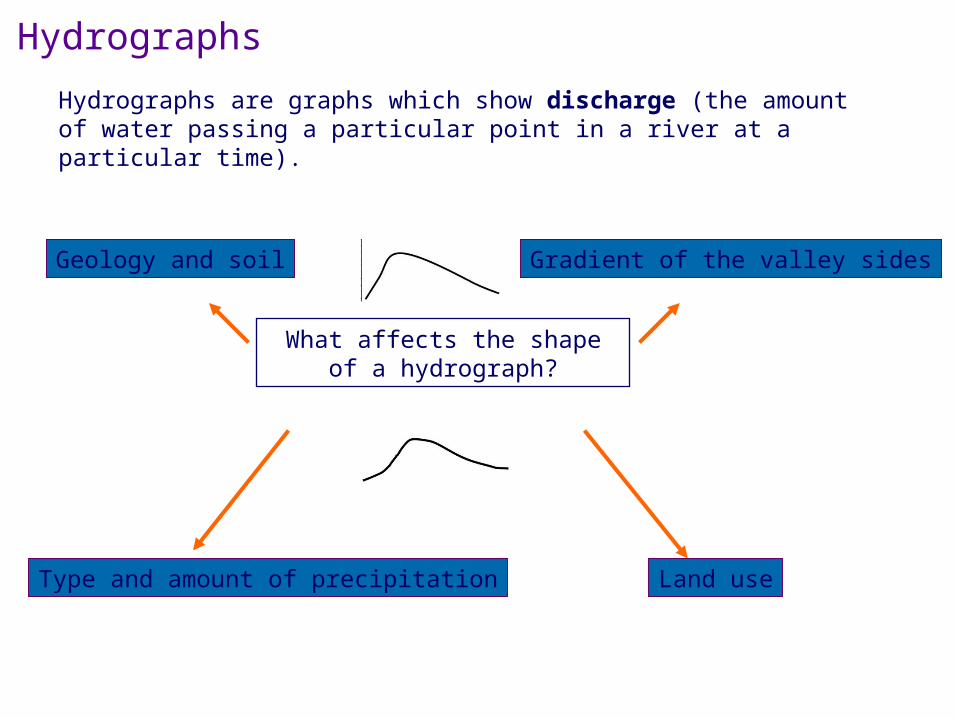
Hydrographs
Hydrographs are graphs which show discharge (the amount of water passing a particular point in a river at a particular time).
What affects the shape of a hydrograph?
Land useType and amount of precipitation
Geology and soil Gradient of the valley sides
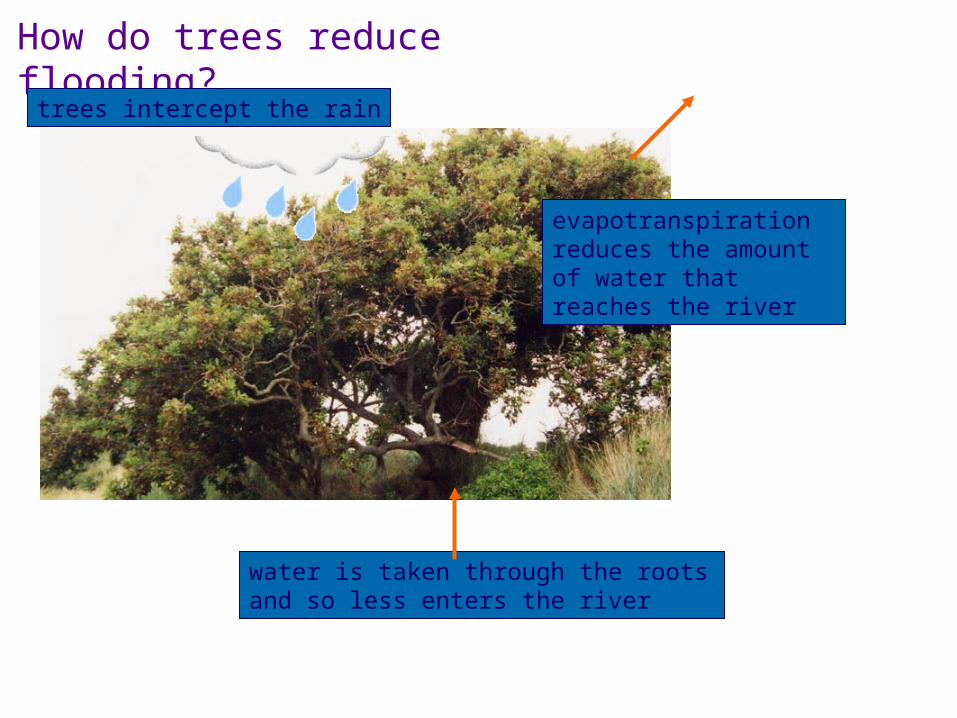
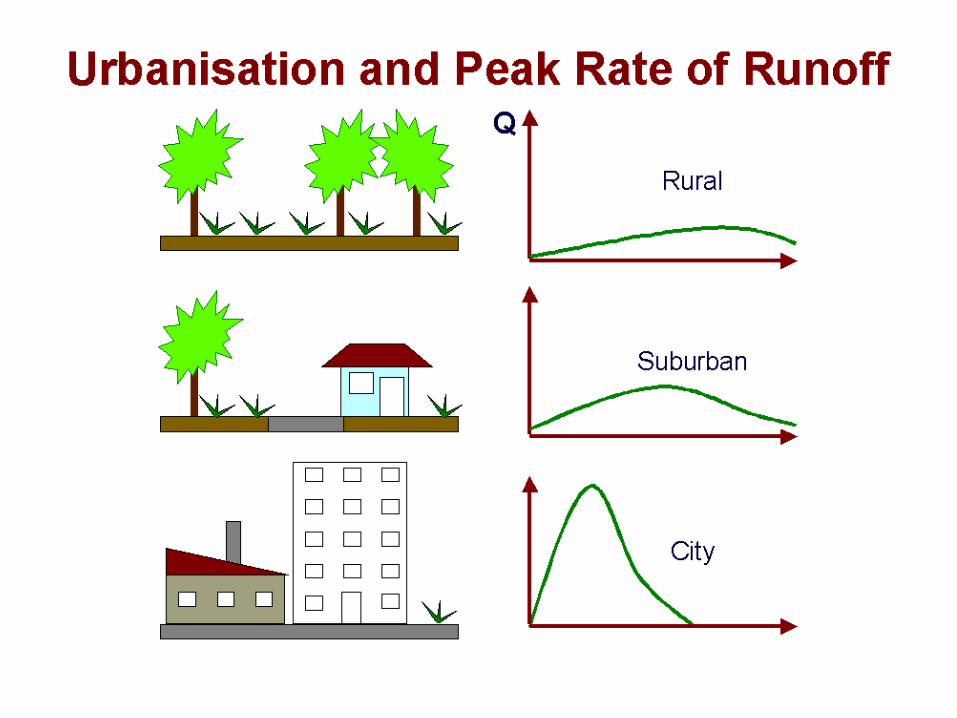
How do trees reduce flooding?
trees intercept the rain
evapotranspiration reduces the amount of water that reaches the river
water is taken through the roots and so less enters the river
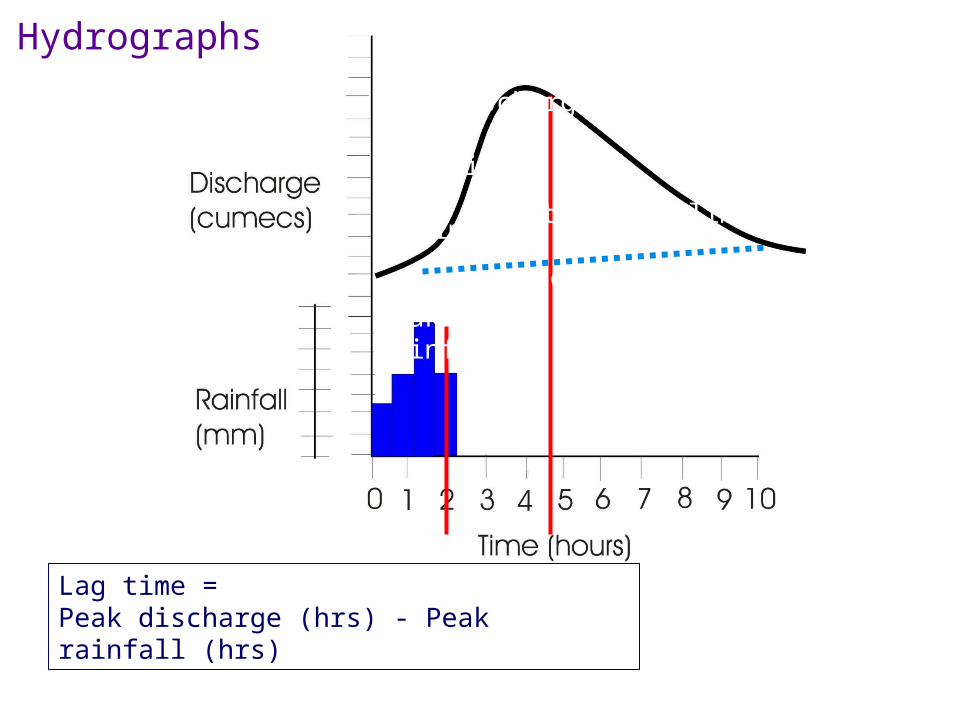
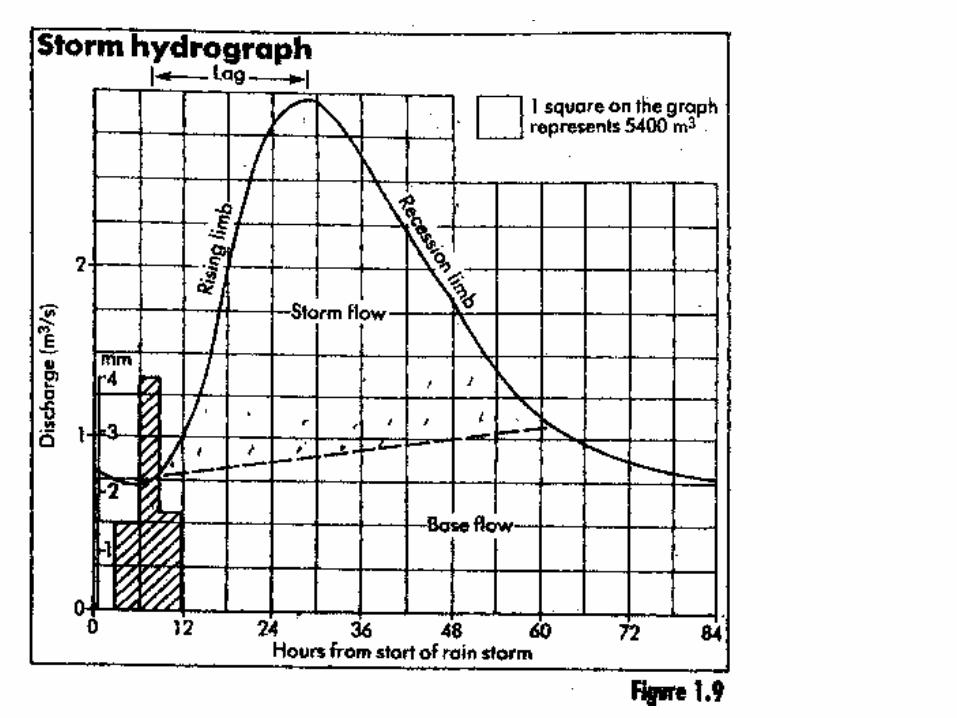
Rising limb
Falling limb
Peak discharge
Peak rainfall
Lag time = Peak discharge (hrs) - Peak rainfall (hrs)
storm flow
normal (base) flow
Hydrographs
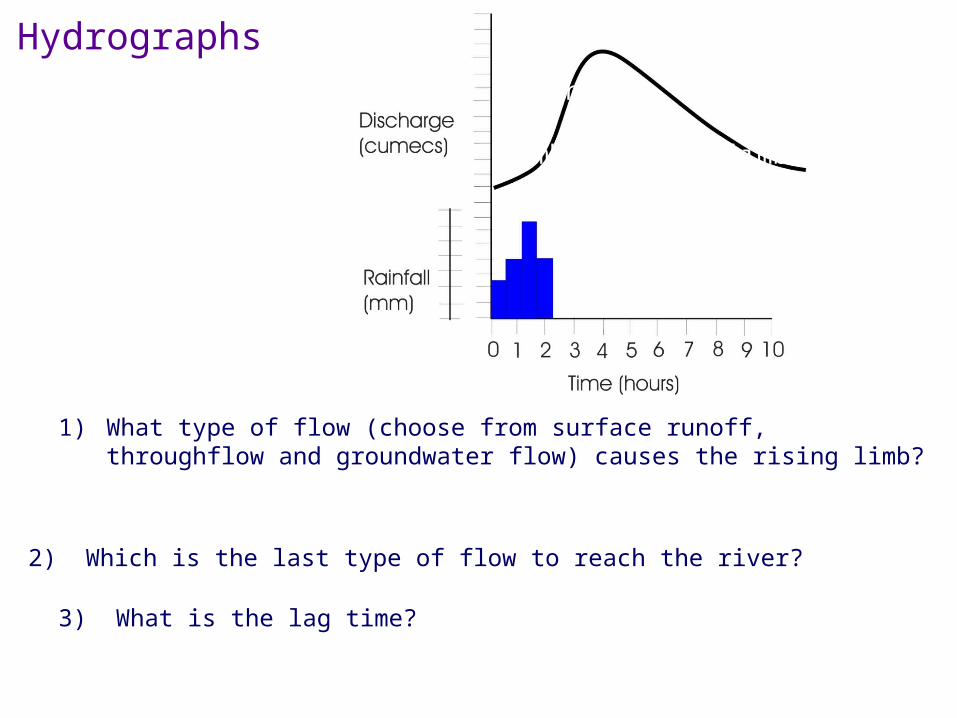
1) What type of flow (choose from surface runoff, throughflow and groundwater flow) causes the rising limb?
3) What is the lag time?
2) Which is the last type of flow to reach the river?
Rising limb
Falling limb
Hydrographs
a b
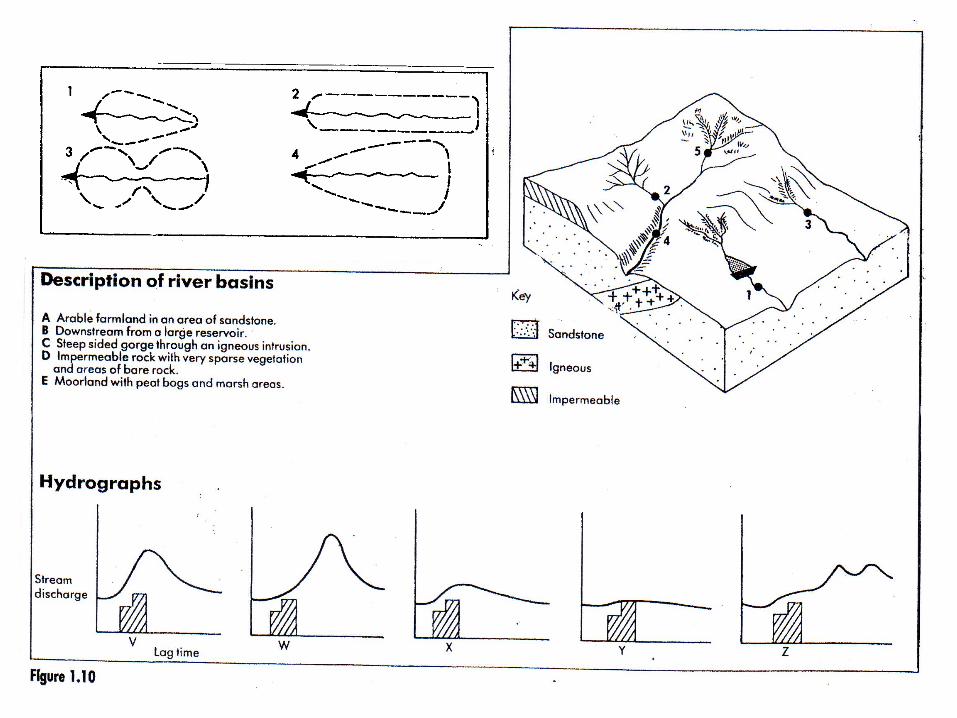
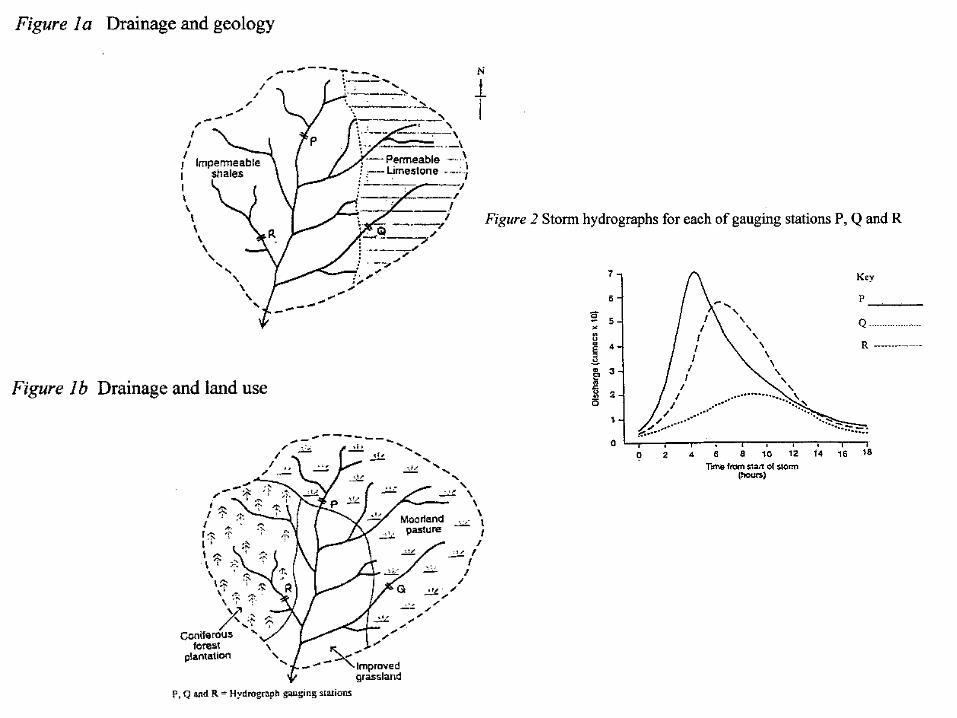
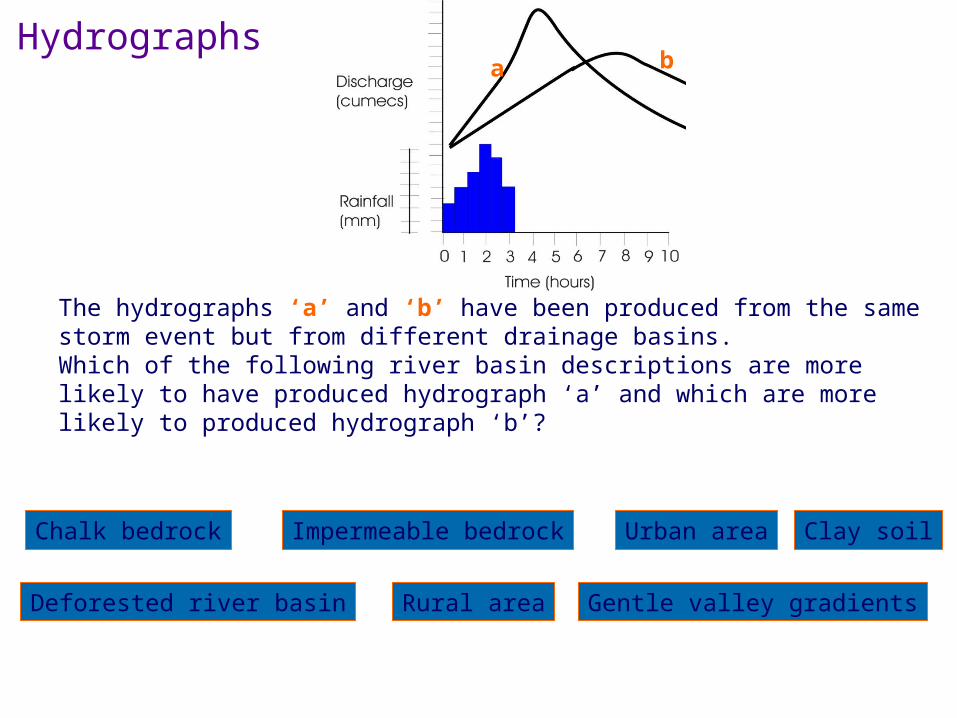
The hydrographs ‘a’ and ‘b’ have been produced from the same storm event but from different drainage basins. Which of the following river basin descriptions are more likely to have produced hydrograph ‘a’ and which are more likely to produced hydrograph ‘b’?
Urban area
Rural area
Impermeable bedrock Clay soil
Gentle valley gradientsDeforested river basin
Chalk bedrock
Hydrographs
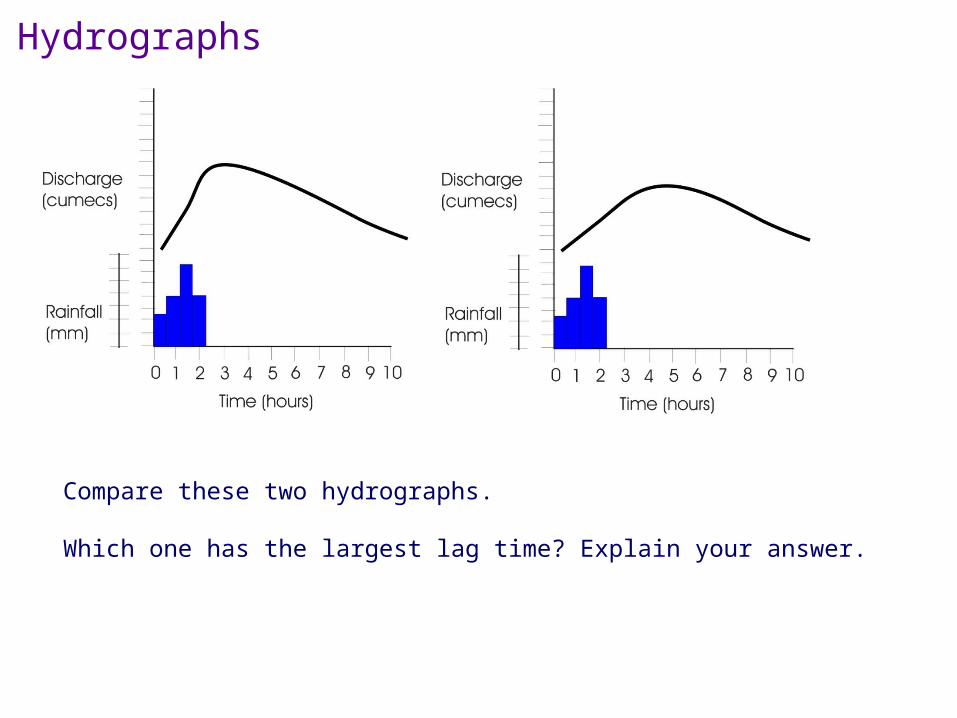
Compare these two hydrographs.
Which one has the largest lag time? Explain your answer.
Hydrographs
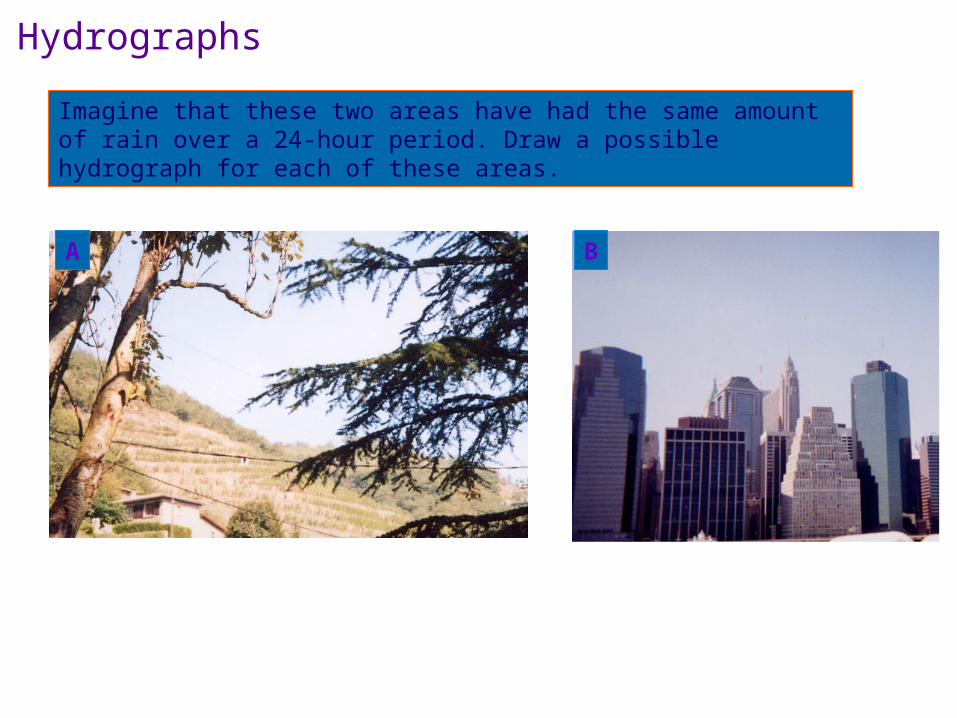
Imagine that these two areas have had the same amount of rain over a 24-hour period. Draw a possible hydrograph for each of these areas.
A B
Hydrographs
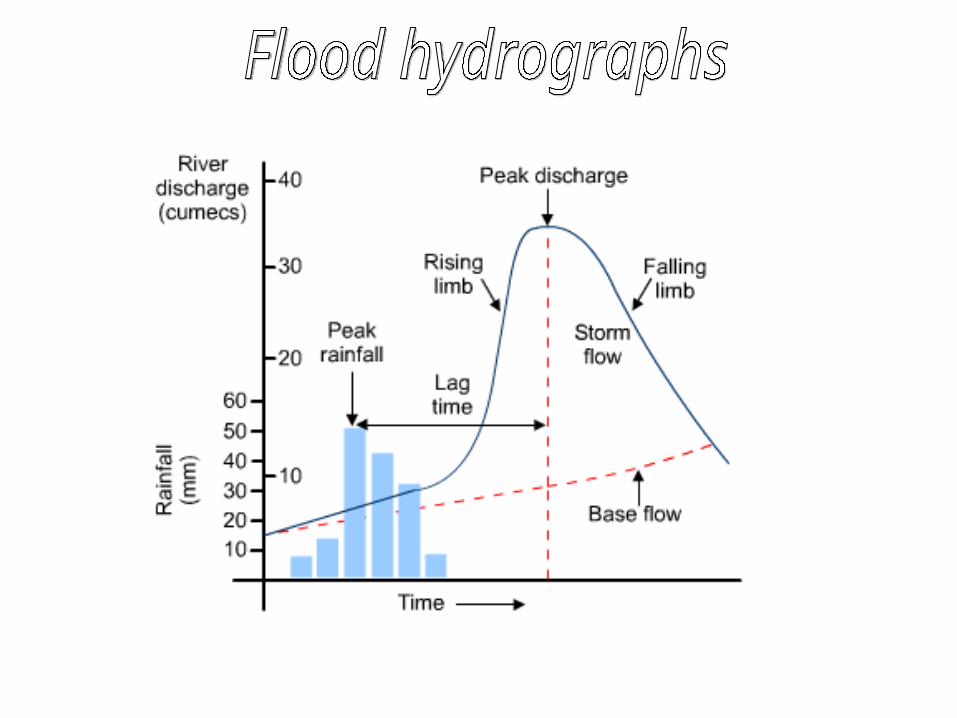
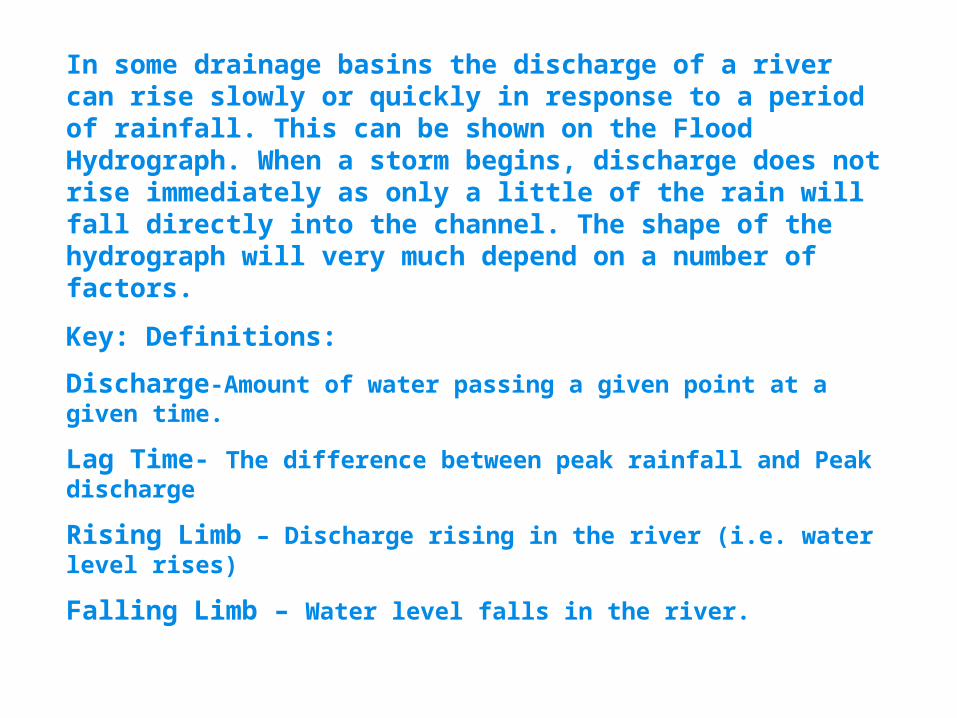
In some drainage basins the discharge of a river can rise slowly or quickly in response to a period of rainfall. This can be shown on the Flood Hydrograph. When a storm begins, discharge does not rise immediately as only a little of the rain will fall directly into the channel. The shape of the hydrograph will very much depend on a number of factors.
Key: Definitions:
Discharge-Amount of water passing a given point at a given time.
Lag Time- The difference between peak rainfall and Peak discharge
Rising Limb – Discharge rising in the river (i.e. water level rises)
Falling Limb – Water level falls in the river.
Which conditions give a Which conditions give a Flashy Hydrograph?Flashy Hydrograph?
Which will give a lower, Which will give a lower, later peak discharge?later peak discharge?
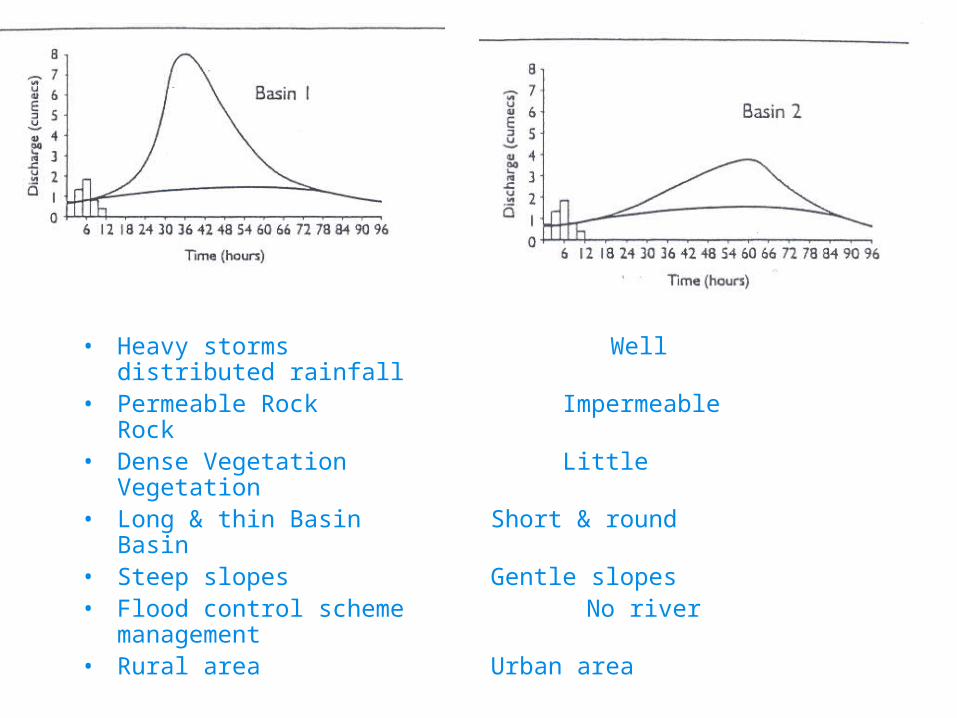
• Heavy storms Well distributed rainfall• Permeable Rock Impermeable Rock • Dense Vegetation Little Vegetation• Long & thin Basin Short & round Basin• Steep slopes Gentle slopes• Flood control scheme No river management• Rural area Urban area