Embed Size (px)
Citation preview

Trees & StormTrees & StormTrees & StormTrees & StormTrees & StormWind LoadsWind LoadsWind LoadsWind LoadsWind Loads
1
4
5
89
WASH.
TX.
MN.
AZ.
CO.UT.
OR.
MONT.
ID.
OK.
NM.
KS.
NB.
ND.
SD.
WY. IOWA
WS.
IL. IN.OH.
KY.
ARK.
AL.
LA.
MO.
NV.
GA.
SC.
FL.
NC.
VA. W.VA.
PA.
DL.
NJ.
NY.
VT. NH.
MAINE
RI.CT.
MASS.
MD.
MICH.
MICH.
TN.
MS.
CA.
Coder Storm Intensity Map of composite potential risks for tree damage.
6
70
2 3
Trees & StormTrees & StormTrees & StormTrees & StormTrees & StormWind LoadsWind LoadsWind LoadsWind LoadsWind Loads
by Dr. Kim D. CoderProfessor of Tree Biology & Health Care
Warnell School of Forestry & Natural Resources, University of Georgia
10

2Dr. Kim D. Coder Warnell School University of Georgia
This publication is an educational product designed for helping treeprofessionals appreciate and understand basic aspects of tree mechanicalloading during storms. This educational product is a synthesis andintegration of weather data and educational concepts regarding how stormswind loads impact trees. This product is for awareness building andeducational development.
At the time it was finished, this publication contained information regardingstorm wind loads on trees thought by the author to provide the best meansfor considering fundamental tree health care issues surrounding treebiomechanics. The University of Georgia, the Warnell School of Forestry &Natural Resources, and the author are not responsible for any errors,omissions, misinterpretations, or misapplications from this educationalproduct. The author assumed professional users would have some basictree structure and mechanics background. This product was not designed,nor is suited, for homeowner use. Always seek the advice and assistanceof professional tree health providers for tree care and structuralassessments.
This publication is copyrighted by the author. This educational product isonly for noncommercial, nonprofit use and may not be copied orreproduced by any means, in any format, or in any media includingelectronic forms, without explicit written permission of the author.
Scientific Citation:Coder, Kim D. 2018. Trees & storm wind loads.
University of Georgia Warnell School of Forestry& Natural Resources outreach publicationWSFNR-18-36. Pp.48.
C copyright 2018 by Kim D. CoderAll rights reserved.

3Dr. Kim D. Coder Warnell School University of Georgia
Trees must withstand wind to survive. Wind and gravity both impact trees in storms, but thedominant load is from wind. Storm winds push on tree crowns and stems causing root plates to wobble,and all tree parts to twist and bend leading to either tree part or supporting soil failure. Trees sensestructural stress and attempt to minimize failures through adaptive growth. Trees modify their structureover time as they are challenged by wind. Trees are biologically designed to sustain average wind loads.What are the mechanical loads applied by storms to trees?
Sailing AlongA tree has a large sail area (leaves and twigs) held upright high into air by a tapered mast (stem).
The stem is held aloft by a thick horizontal mat of large structural roots at the stem base which forms aroot plate. Rapidly tapering roots growing away from the stem base provide a tree with a structuralframework and an absorbing surface. The center of gravity (effective weight center) of a tree is usuallysomewhere in the middle of a stem above the root plate and below the crown base. Gravity is pullingdown on the tree all over, but has a total effect focused at the center of gravity. Wind is pushing the treearound its center of gravity.
The weight of a tree is pulled down onto the soil surface. As long as its center of gravity remainspositioned above its supporting base, the stem is usually stiff enough to keep a tree upright. If the centerof gravity for a tree is not positioned over its supporting base, gravity may topple a tree if the tensile andcompressive strength of the stem and root base is compromised or inadequate. Storm winds can pushthe center of gravity in the stem out from over its supporting base. The combined result is wind movinga tree laterally and gravity pulling a tree downward, providing a rotation force acting to roll a tree out ofthe ground -- a load wheel. Figure 1.
GravityTrees seldom fail under their own weight -- external loads stress and strain a tree until failure.
Gravity loads trees in tandem with wind to initiate these failures, but wind loads greatly exceed gravityloads in most situations. Wind is an acute mechanical variable for which trees must constantly adjustgrowth processes. Gravity is a chronic stress and strain with which trees must cope. Adding mass to atree in the form of growth (size, extent, and reach), or in applied water, ice or snow loads, can magnifygravity’s impact on a tree, causing fiber creep (permanent tissue changes) and failures. But, it is stormwinds which push tree structures to their limits.
Impact TrinityIn order to more clearly understand storm initiated failures in trees, wind loads must be fully
appreciated. Wind has three primary components which impact trees:
1) velocity or speed (mile per hour or feet per second);2) acceleration (velocity changes over time or velocity squared); and,3) throw weight (mass of air and its contents).
Wind speed is a simple concept easily measured and applied against a tree. It is not solely wind speedwhich pushes trees to catastrophic failures.
Trees & Storm Wind Loads
Dr. Kim D. Coder, Professor of Tree Biology & Health Care, Warnell School, UGA

4Dr. Kim D. Coder Warnell School University of Georgia
Dynamic PressureWind acceleration is a dynamic load variable which is not easily measured. How fast wind
speeds change through acceleration and deceleration place constantly changing loads on trees. Theduration of time between minimum and peak velocity (gusts), and then peak velocity and minimumvelocity (calms) greatly impact trees. Is the changing wind load applied over one second or one hour?A load gently applied over time can be more easily dealt with in a tree than a hammer blow of windapplied suddenly. Rapid changes in wind velocity impact trees proportionally to wind velocity squared.
Wind at increasingly greater velocity does not exist in a perfect linear, laminar, and continuousflow. Storm winds are not equivalent to wind tunnel winds. Not only are storm winds gusting in largewave forms, wind can show many smaller periodic patterns which constantly and quickly load andunload trees. Wind is a complex of pulsing and rotating pressure waves with multiple periods. Some-times these wave peaks or pulses of wind combine to generate extraordinary gusts, other times the calmsbetween the different wave patterns combine to generate relatively still periods.
Another component of wind impacting trees is the mass of the wind stream, sometimes called thethrow weight of the wind. Wind propelling rain, ice, snow, soil, or debris is heavier (has more mass)than atmospheric gas components. For the same wind velocity, the more materials in the windstream,the more impact this wind will have on a tree. There is a weight class difference among storm windswhich all impact trees differently. In addition to twisting and bending loads applied by “heavier” winds,tissue scouring from wind bourne debrie can greatly damage trees.
DragOnce the dynamic nature of wind is appreciated, tree resistance or drag can be considered. Drag
is caused by air hitting and moving past a standing tree. Drag represents the resistance or friction of atree to wind. Force on a tree is generated due to the velocity of wind and air density striking and movingpast tree surfaces. Because a tree is not a solid unmoving object, but a flexible, bending, porous object,only a part of the total wind force is applied to the tree (a portion represented by a drag coefficient). Thefaster wind velocity (V), the greater the pressure placed onto a tree (V2), but the smaller drag coefficientscan become to some minimum point.
Trees reconfigure stem, branches, twigs, and foliage under increasing wind loads by falling backagainst the wind or streamlining, including changes in stem and branch flexing / twisting, twig andfoliage folding / rolling, generating a smaller frontal area, and effectively increasing crown porosity. Thefrontal area of a tree can be reduced by more than 50% as wind velocity increases. Because of treereconfigurating in wind, drag coefficients change (decrease) with increasing wind velocity. There isgreat variability in tree drag coefficients across the research literature (range = 1.35 - 0.10). Here a dragcoefficient of 1.0 is used to simplify understandings of storm wind loads.
Wind HammerWind loads on trees can be summarized as a constant pressure, additional pulsing of short wind
bursts, a rolling shock wave of high pressure occasionally applied, an overall acceleration and decelera-tion around an average value, and a variable weight windstream. Trees in storms are hammered with adynamic combination of blows. Note the average wind velocity values and gust peaks measured formedia meteorology information do not adequately represent the full dynamic nature of storm winds ontrees.
For example, it is both gusts and calms which impact trees. Trees bend and twist back againstthe force of wind and rebound in calm periods between gusts. Winds load and unload trees in differentways, over various time frames, and on different tree parts. Dynamic storm winds are more difficult to

5Dr. Kim D. Coder Warnell School University of Georgia
successfully resist over time than a simple straight wind. The periodicity of tree swaying, coupled withthe frequency of wind pressure peaks, can generate tremendous synergies of load and resistance in trees.
StormingAs small scale winds differ over time, large scale meteorologic events differ in the amount and
intensity of energy applied to trees and landscapes. The six major forms of storms considered whenexamining tree impacts are thunderstorms, hurricanes, glazing (ice) events, tornadoes, derechos (hori-zontal rolling squall lines with clusters of downbursts), and snow events. Lightning is an additional treedamaging feature of storms. Every storm event has a different size, power, duration, and residual im-pact. Different areas of a landscape receives different combinations of storm wind energy not predict-able based solely upon typography, aspect, openness, or history.
T-StormsThunderstorms can be found across the continent. Thunderstorms generate updrafts in the
atmosphere, large columns of falling rain and air, and ground level winds. The straight line winds in athunderstorm can be caused by downbursts of various sizes: microbursts (<1 mile diameter & 160 mphwinds); macrobursts (>2.5 miles diameter & 130 mph winds); and, derechos (band of downburstclusters >240 miles long & >100 mph winds).
Figure 2 is a map of the average number of thunderstorm days in the continental United States.Hot, humid air running into colder air masses tend to generate storms with massive air flows. Note theSoutheastern and Central United States have many events per year which could potentially overload anddamage trees. Florida leads the nation with thunderstorm days. Figure 3 provides an estimate of theaverage number of storms each year with winds greater than 50 mph.
Beaufort ScaleWind in thunderstorms are usually reported in average miles per hour and peak gust speeds.
Historically, winds from thunderstorms were classified by a 0-12 numerical force scale. These classescomprised the Beaufort Wind Scale developed for mariners. Beaufort Wind Scale force numbers aretied to a miles per hour wind velocity range and a simple descriptive title. Figure 4 provides the Beau-fort Wind Scale force number, wind speed range in miles per hour, a mid-point wind pressure value inpounds per square feet, and wind force classification description. Figure 5 provides potential tree im-pacts from Beaufort wind scale forces.
For example, a “force 8" wind is called a “fresh gale” and has a velocity between 39 and 46 milesper hour, breaking twigs on some trees. A force 12 wind is 73 miles per hour or greater, which beginsthe hurricane classifications. Note the wind pressure values represent a drag coefficient of 1.0.
HurricanesFigure 6 is a map of historic hurricane landfalls in the Eastern United States over the last 50
years. Any land form which juts out into the Atlantic Ocean is prone to being slammed by a hurricanebeing driven north and east by prevailing winds. Most of the coast bordering the Gulf of Mexico hasseen many hurricane landfalls. Florida which borders both the Atlantic and Gulf is ideally positioned totake hits from many hurricanes.
How often hurricane level storms make landfall in any one area of the coast is important to riskmanagement of trees and community forests. A statistical estimate of how many years are expectedbetween major hurricanes is shown in Figure 7. Places like the Georgia bite, and the DelMar peninsulaand North can receive hurricane winds, but at greater times between landfalls.

6Dr. Kim D. Coder Warnell School University of Georgia
Figure 8 shows the distribution of hurricanes from a 100 year period grouped across the monthsof the year. September is the peak month and September 10 is the peak day on average. Hurricanes inJune and December have occurred. The cumulative impacts of hurricane events on maritime forest treesis to limit height, and modify crown and stem shape, generating a “flagged” tree canopy form.
Saffir-Simpson ScaleAs wind velocity climbs past 73 miles per hour, a different wind classification system is used
instead of the Beaufort scale. The hurricane “category” value is spouted by the public and in the sim-plest weather forecasts. This classification system is the Saffir-Simpson Hurricane Scale. Figure 9provides a summary of the Saffir-Simpson Hurricane Scale with category number, wind speed in milesper hour, midpoint velocity range wind pressure value in pounds per square feet, and potential treeimpacts. Note the wind pressure value represents a drag coefficient of 1.0. This hurricane scale has anoticeably uneven level of increasing wind velocity classes topping out at greater than 155 miles perhour in a category 5 hurricane.
The hurricane categories also contain ocean storm surge heights in feet. Storm surge and hurri-cane wind speeds are not strongly coupled, as many land, sea, and tide conditions modify water volumesand heights. Figure 10.
For example, a category 3 hurricane would have top sustained winds of 111-130 miles per hourand push ashore a storm surge of water 9 to 12 feet in height. A category 3 hurricane would be expectedto strip leaves from trees and topple trees with large sail areas. Trees with full frontal exposure tocategory 3 winds would be expected to fail.
SurgingTrees are impacted by hurricane storm surges. A storm surge is usually composed of near ocean
level salinity water pushed ashore. Knowing the height of a surge and topography of the area can helppredict present and future tree problems from soil salt. Storm surges also can lead to plastic and liquidsoil limits being reached in finer soils, and within finer soil layers in coarse soils. Water logging of soilscan greatly reduce soil strength and root resistance to slipping under wind loads. On the other hand, astrees are flooded, and flood waters rise, the weight of the water over the root plate can off-set (by stabi-lizing the tree) some of the soil strength loss.
Inland from beach areas are places lower in the landscape than their surroundings, or placesprotected by levees and berms. As storm surges rise, the chance of inundation increases and the diffi-culty in removing accumulated brackish water can increase. In low-lying areas protected by levees,levee height would have to be taller than any storm surge, plus additional height to prevent overtoppingand erosion of the levee.
Inland WindsOne poorly understood and planned for aspect of a hurricane landfall is how far from the coast
wind damage can occur as remnants of the storm moves inland. Hurricanes can spawn other types ofstorms (like tornadoes) and other types of winds (isolated thunderstorm events), but the primary hurri-cane winds generated over the ocean decline as land is crossed. The declining wind speeds do not dropinstantaneously. Figure 11 shows how many miles inland maximum hurricane winds could be felt and atwhat velocity for a category 3 storm.
The time between landfall and maximum wind impact on any tree will depend upon the groundspeed of the storm as it moves inland and the distance inland of a tree. Figure 12 shows the distanceinland from the coast where a category 3 hurricane landfall would still generate 60 mph sustained windsas it moved inland. Of course, higher category storms would deliver faster wind speeds farther inland.

7Dr. Kim D. Coder Warnell School University of Georgia
TornadoesTornadoes can be a component of many types of storms. This intense, high velocity, rotating
storm event plagues trees. The top momentary wind speeds can be tremendous. Direction of the heavi-est winds change with passage of the storm. Trees near the direct track of a tornado must withstand thebending loads applied by winds as well as twisting (torque). In addition, tornadoes are often accompa-nied by heavy rains, damaging hail, and intense lightning activity, all of which impact trees.
Tornado events are on the rise in the United States. Figure 13 provides a trend line for increasingtornado events over the last 55 years. Note since 1950, tornado events have increased roughly seven-hundred percent (7X). Figure 14 is a map developed from storm data from the last 45 years showing theaverage number of tornadoes per year for the continental United States. The map categories are broad,but demonstrate a concentration of storms in the legendary “tornado alley” of the Great Plains.
Old TornadoesTornadoes in the United States used to be (up till 2/1/2007) categorized using the Fujita Tornado
Scale. Figure 15 provides the historic “F” category number, wind velocity range, midpoint velocityrange wind pressure value, and generic tornado description. Figure 16 provides potential tree impacts oftornado scale forces. Note the wind pressure value represents a drag coefficient of 1.0. Fujita TornadoScale categories always begin with the letter “F” to assure there is no confusion with hurricane categorynumbers. This scale was originally designed for nuclear explosions shock waves.
For example, a F3 tornado would have wind speeds of 158-206 miles per hour, wind pressure at182 miles per hour of 87 pounds per square feet, and is called a severe tornado. Trees and forests nearthe storm-track are expected to be flattened and twisted apart. Because of the narrow band of the mostintense winds within a tornado, many trees survive near-misses by tornadoes.
Note the Fujita Tornado Scale ranges from a F0 gale tornado with winds ranging from 40-72miles per hour to a F6 inconceivable tornado with winds ranging from 319-379 miles per hour. A F6tornado has not been identified in North America. F2 to F5 tornadoes snap stems, strip branches, anduproot trees close to the storm track. Overall storm damage to trees often seems less in tornadoes thanin other less violent but more widespread storms because the devastation is along a narrow band whichcan be reached from either side by clean-up and removal equipment. Wind pressures generated intornadoes are clearly the most extreme of any storm type.
Enhanced TornadoesRecently a new tornado scale has been developed emphasizing the resulting damage, not neces-
sarily the maximum wind gust speed. The new scale is called the Enhanced Fujita (EF) scale. Figure 17provides a comparison of the tradition Fujita scale and the new EF scale for tornado events. Note the EFscale stops measuring wind gust velocity at 200 mph, and at an Enhanced Fujita scale number of EF-5.
Figure 18 graphically shows the difference between the old F and the new EF scales. Figure 19provides gust speeds, wind pressure, and tornado descriptors. Figure 20 provides tree impacts for EFscale forces. Note the wind pressure values represent a drag coefficient of 1.0. The EF scale for tornadoevents now includes some specific tree damage information. Figure 21 provides general damage ratingsfor hardwoods and softwood trees under the EF scale.
Remember actual wind speed values can vary widely for the same storm event and same gustdepending upon the technique used to measure wind velocity and the statistical means used to describewind velocity. A wind speed value could represent a maximum gust or a variety of average speeds.Common measures include fastest mile, greatest 3-second gust, or averaging over 5 or 10 minute inter-vals.

8Dr. Kim D. Coder Warnell School University of Georgia
Euro-TornadoThe Fujita and Enhanced Fujita Scales for tornadoes were designed for special uses in the ener-
getic storms of North America. It does not easily coincide with other wind scales. Another tornadoscale is used elsewhere in the world which categorizes tornadoes with less intensity and wind velocity.This tornado wind scale is the Meaden Tornado T-Scale. This scale was designed to fit well with andcompliment the Beaufort Wind Scale. Figure 22 provides the category “T” number, wind velocity rangein miles per hour, midpoint velocity range wind pressure value in pounds per square feet, and generictornado description. Figure 23 provides potential tree impacts from Meaden Tornado Scale forces. Notethe wind pressure values represent a drag coefficient of 1.0.
Glazing IceIce storms can impact most of the United States. Figure 24 shows the average number of days in
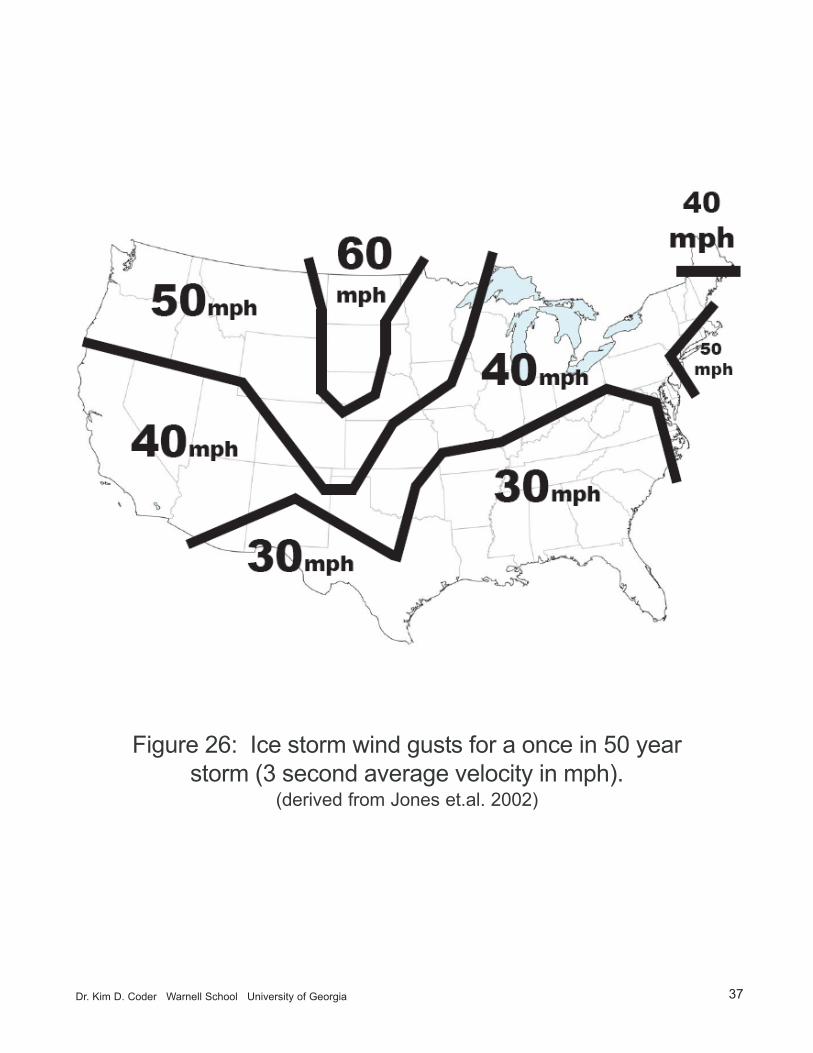
a year with freezing precipitation. Figure 25 shows ice accumulation (in radial inches) for a 50-year icestorm across the United States. Generally, the farther north, the greater the chances of glazing eventsimpacting trees, on average. Figure 26 provides wind gusts associated with a 50-year ice storms acrossthe United States. The combination of ice and wind conspire to damge trees worse than each alone. It isin more southern parts of the nation where chance ice storms, especially with strong winds, greatly loadand damage trees.
Ice accumulation on trees can amount to 20X - 50X the dry weight of branches and twigs. Iceglazing makes branches and twigs stiff, increasing resistance (drag) to the wind and prevents crownreconfiguration, leading to structural failures. Glazing events also cause severe wood creep, an irrevers-ible decline and drooping of tissues. Wind loads on ice covered trees can greatly multiply any branchweight and stiffness (lack of reconfiguration -- increased drag) loads. Figure 27 shows an ice damageseverity index (range 0-5, with 5 being severe) for combined ice and wind loads. Small ice loads withlarge wind loads, or large ice loads with little wind, can be equally damaging to trees.
DelugeThe force of wind upon tree crowns can be immense. Trees remaining upright and stable depend
upon the integrity of many mechanical components of a tree and site. One site component sometimesoverlooked in storms is soil strength. Storms apply wind loads to trees which distribute loads throughtheir stems and into their base woven into soil. Storms can also apply large amount of water onto a sitealong with wind.
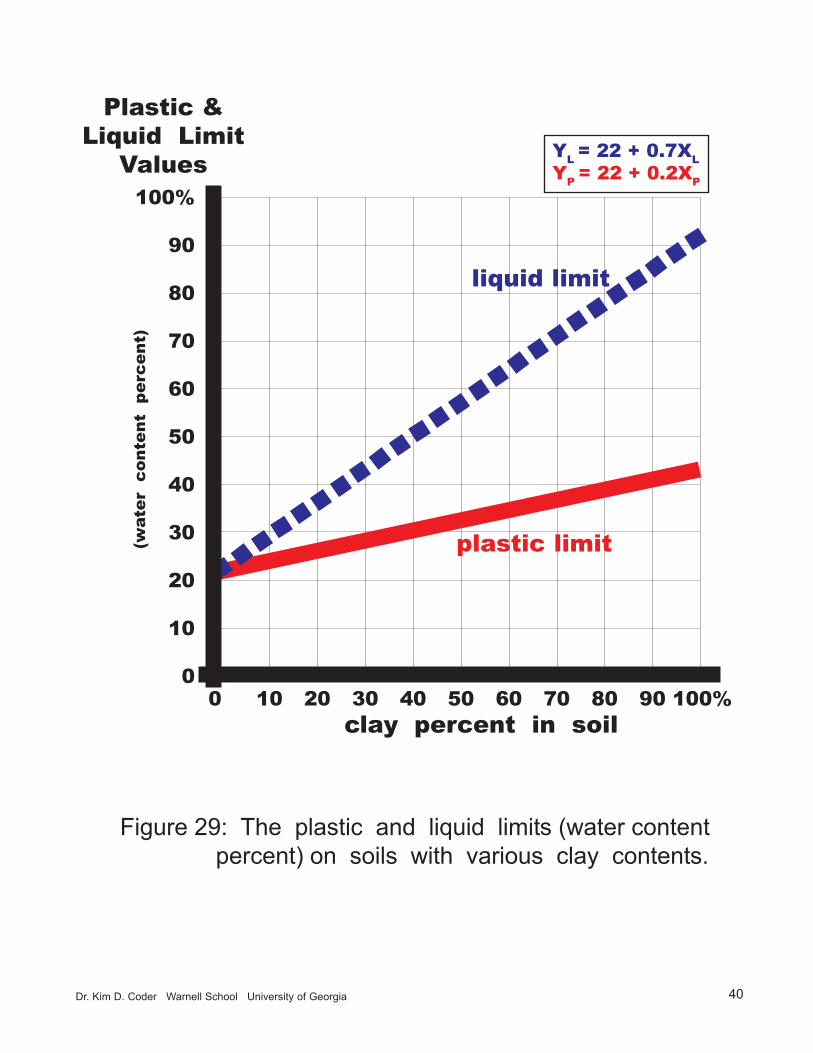
Figure 28 shows a generalized map for the maximum rainfall in inches falling in one 24 hourperiod across the United States. If the water content of a soil exceeds the plastic or liquid limit of a soil,the soil will not behave as a solid matrix holding tree roots, but as either a slowly deforming plasticmaterial or a rapidly flowing liquid. Figure 29 shows the plastic and liquid limits of soils with variousamounts of fine textured materials. Rainfall amounts modifying soil strength can lead to to tree failuresespecially when combined with wind loads.
Storm Intensity ZonesIn trying to summarize storm winds and associated damage to trees, the Coder Storm Intensity
Map was developed for the continental United States. This map was created using cluster analysis ofaverage historic data for thunderstorms, hurricanes, tornadoes, lightning ground strike frequency, iceglazing events, snow fall accumulation values, and general wind speed values. Figure 30 is a map ofstorm intensity as it relates to potential tree damage. The range of storm intensity impacting trees arecategorized into zones from 0 to 10. Note these zones include both wind and gravity related tree struc-

9Dr. Kim D. Coder Warnell School University of Georgia
tural impacts. The most intense area of potential tree damage from storms is in zone 10, the southern tipof Florida.
The value of the Coder Storm Intensity map is in appreciating areas which share common stormintensity and associated risks of tree damage. For example, most of Georgia is in the same zone as mostof Kansas, the heart of tornado alley. The storm types may be different but the total yearly impactpotential on trees from storms is roughly the same.
GustingIn all of the meteorological scales presented here, wind speed in miles per hour is a common
means of demonstrating storm strength and potential for tree damage. Unfortunately, for most peoplelistening to media reports of storm conditions, both wind speeds and associated tree impacts can beunderestimated. The traditional way of presenting wind speeds to a general audience has been a groundmeasurement in miles per hour taken at an airport or in an open field averaged over some time period(usually every 10 minutes to one hour). This average wind speed is helpful in appreciating the intensityof any storm.
Remember it is gusts and calms which are critical to understanding wind loads and associatedrisks of tree damage. An average wind speed of X could have gusts of 1.5X to 2X hidden within thewind speed value. For example, an average wind speed may hover around 50 miles per hour for a periodof time in the middle of a storm. It is entirely possible for maximum wind speeds to have reached 75 to100 miles per hour in short duration gusts.
Force Not SpeedStorm wind loads on trees are not well represented by wind velocity values. Wind impacts on
trees are directly related to the force or pressure wind applies to tree parts. The pressure of the windapplied to a tree can be estimated by multiplying the square of wind speed times one-half the density ofair moved. The pressure of wind on trees is usually calculated at some standard temperature (like 68oF)at sea level. A simplified formula for quick estimates of wind pressure is given below:
wind pressure in pounds per square foot =(0.013) X ( wind speed in mph X (0.45) )2.
Figure 31 presents the comparison between wind velocity in miles per hour and wind pressure inpounds per square foot created using the simplified formula above. Wind pressure values have beenadded to storm wind classification scales to help tree professionals appreciate the magnitude of forceapplied to trees. Note that as wind speed doubles, the wind pressure against a tree per square foot offrontal area would not simply double, but quadruple. Please remember the wind pressure values repre-sent a drag coefficient of 1.0.
For example, if wind velocity is 20 miles per hour, the wind pressure applied to the front aspectarea of a tree is 1.1 pounds per square feet (drag coefficient = 1.0). If storm wind velocity then acceler-ates and levels off at 40 miles per hour, the wind pressure is 4.2 pounds per square feet (drag coefficient= 1.0). A small increase in wind velocity can have great impacts on wind pressure applied to a tree.Figure 32 provides a graphical view of the greatly increasing wind force generated with increasing windvelocity.
Wind SpeedsFrom the many proceeding wind and storm scales, a single wind speed scale was derived for
trees. The Coder Wind Scale of load factors on trees in given in Figure 33. Conversions of Coder Wind
10Dr. Kim D. Coder Warnell School University of Georgia
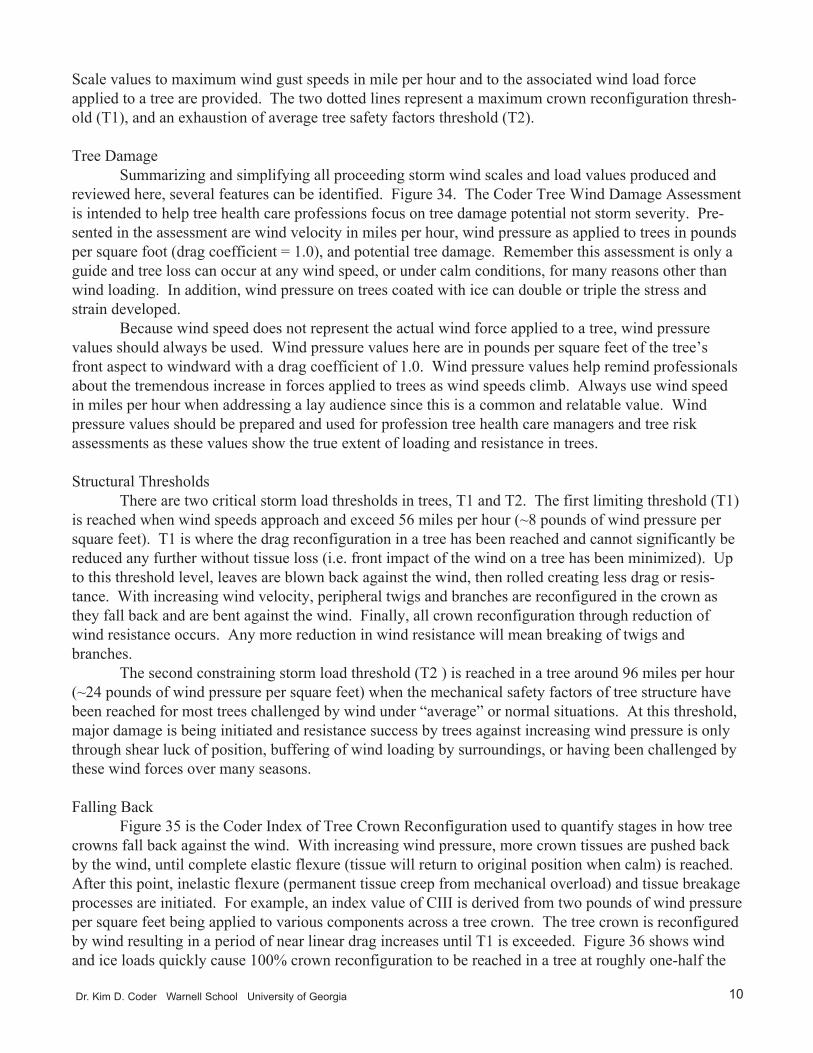
Scale values to maximum wind gust speeds in mile per hour and to the associated wind load forceapplied to a tree are provided. The two dotted lines represent a maximum crown reconfiguration thresh-old (T1), and an exhaustion of average tree safety factors threshold (T2).
Tree DamageSummarizing and simplifying all proceeding storm wind scales and load values produced and
reviewed here, several features can be identified. Figure 34. The Coder Tree Wind Damage Assessmentis intended to help tree health care professions focus on tree damage potential not storm severity. Pre-sented in the assessment are wind velocity in miles per hour, wind pressure as applied to trees in poundsper square foot (drag coefficient = 1.0), and potential tree damage. Remember this assessment is only aguide and tree loss can occur at any wind speed, or under calm conditions, for many reasons other thanwind loading. In addition, wind pressure on trees coated with ice can double or triple the stress andstrain developed.
Because wind speed does not represent the actual wind force applied to a tree, wind pressurevalues should always be used. Wind pressure values here are in pounds per square feet of the tree’sfront aspect to windward with a drag coefficient of 1.0. Wind pressure values help remind professionalsabout the tremendous increase in forces applied to trees as wind speeds climb. Always use wind speedin miles per hour when addressing a lay audience since this is a common and relatable value. Windpressure values should be prepared and used for profession tree health care managers and tree riskassessments as these values show the true extent of loading and resistance in trees.
Structural ThresholdsThere are two critical storm load thresholds in trees, T1 and T2. The first limiting threshold (T1)
is reached when wind speeds approach and exceed 56 miles per hour (~8 pounds of wind pressure persquare feet). T1 is where the drag reconfiguration in a tree has been reached and cannot significantly bereduced any further without tissue loss (i.e. front impact of the wind on a tree has been minimized). Upto this threshold level, leaves are blown back against the wind, then rolled creating less drag or resis-tance. With increasing wind velocity, peripheral twigs and branches are reconfigured in the crown asthey fall back and are bent against the wind. Finally, all crown reconfiguration through reduction ofwind resistance occurs. Any more reduction in wind resistance will mean breaking of twigs andbranches.
The second constraining storm load threshold (T2 ) is reached in a tree around 96 miles per hour(~24 pounds of wind pressure per square feet) when the mechanical safety factors of tree structure havebeen reached for most trees challenged by wind under “average” or normal situations. At this threshold,major damage is being initiated and resistance success by trees against increasing wind pressure is onlythrough shear luck of position, buffering of wind loading by surroundings, or having been challenged bythese wind forces over many seasons.
Falling BackFigure 35 is the Coder Index of Tree Crown Reconfiguration used to quantify stages in how tree
crowns fall back against the wind. With increasing wind pressure, more crown tissues are pushed backby the wind, until complete elastic flexure (tissue will return to original position when calm) is reached.After this point, inelastic flexure (permanent tissue creep from mechanical overload) and tissue breakageprocesses are initiated. For example, an index value of CIII is derived from two pounds of wind pressureper square feet being applied to various components across a tree crown. The tree crown is reconfiguredby wind resulting in a period of near linear drag increases until T1 is exceeded. Figure 36 shows windand ice loads quickly cause 100% crown reconfiguration to be reached in a tree at roughly one-half the

11Dr. Kim D. Coder Warnell School University of Georgia
wind velocity as a tree under wind loads with no ice. The result is a tree under increasing wind and iceloads reaching maxiumum crown reconfiguration quickly and accelerating drag.
Conclusions
Trees are amazing for their successful growth and longevityunder conditions of severe structural loading from storms. We willcontinue to be surprised and inspired by trees surviving stormswhich stripped human structures from the soil surface. Storm windloads on trees must be accounted for in assessing tree structure andappreciating risks. It is wind load, not tree resistance, which mustplay a greater role in our observations and understandings of treesstanding against the wind.

12Dr. Kim D. Coder Warnell School University of Georgia
WIND
gravity
Figure 1: Storm wind forces, and to a lesser degree gravity,act to rotate a tree out of the soil as a combined load wheel.
tree crown
tree
st
em
root plate transport &absorbing roots
treecenter
of gravity

13Dr. Kim D. Coder Warnell School University of Georgia
NJ.
20
40
6080
40
20
40
20
60
6060
Figure 2: Average number of days withthunderstorm events per year.
WASH.
TX.
MN.
AZ.
CO.
CA.
UT.
OR.
MONT.
ID.
OK.NM.
KS.
NB.
ND.
SD.
WY. IOWA
WS.
IL. IN.OH.
KY.
ARK.
AL.
LA.
MO.
NV.
GA.
SC.
FL.
NC.
VA. W.VA.
PA.
DL.
NY.
VT.
NH.
MAINE
RI.CT.
MASS.
MD.
MICH.
MICH.
TN.
MS.

14Dr. Kim D. Coder Warnell School University of Georgia
Figure 3: Estmated average number of wind eventseach year with winds greater than 50 miles perhour. (NOAA data)
2
22
4
44
4
46 6>10
8
8 6
6WASH.
TX.
MN.
AZ.
CO.
CA.
UT.
OR. MONT.ID.
OK.
NM.
KS.
NB.
ND.
SD.WY.
IOWA
WS.
IL. IN.OH.
KY.
ARK.
AL.
LA.
MO.
NV.
GA.
SC.
FL.
NC.
VA.
W.VA.
PA.
DL.
NJ.
NY.
VT.NH.
MAINE
RI.CT.
MASS.
MD.
MICH.
MICH.
TN.
MS.

15Dr. Kim D. Coder Warnell School University of Georgia
mid-point wind wind
force speed pressure* wind forcenumber mph lbs/ft2 description
0 < 1 < 0.003 calm
1 1-3 0.01 light air 2 4-7 0.08 light breeze
3 8-12 0.26 gentle breeze 4 13-18 0.63 moderate breeze
5 19-24 1.2 fresh breeze 6 25-31 2.1 strong breeze
7 32-38 3.2 moderate gale 8 39-46 4.8 fresh gale
9 47-54 6.7 strong gale10 55-63 9.2 whole gale
11 64-72 12 violent storm12 > 73 >14 hurricane
(* column is not part of wind scale but added by author)
Figure 4: Beaufort Wind Scale.

16Dr. Kim D. Coder Warnell School University of Georgia
mid-point wind wind
force speed pressure*number mph lbs/ft2 tree impacts
0 < 1 < 0.003
1 1-3 0.01 2 4-7 0.08 leaves rustle
3 8-12 0.26 small twigs move 4 13-18 0.63 large twigs move
5 19-24 1.2 small trees sway 6 25-31 2.1 large branches
move
7 32-38 3.2 large trees sway 8 39-46 4.8 twigs break
9 47-54 6.7 small & medium /branch break
10 55-63 9.2 trees breakor uproot
11 64-72 12 forests destroyed12 > 73 > 14 massive tree loss
(* column is not part of wind scale but added by author)
Figure 5: Beaufort Wind Scale with tree impacts.

17Dr. Kim D. Coder Warnell School University of Georgia
Figure 6: Historic hurricane landfalls over a 50 yearperiod in the Eastern United States. (from NOAA data)
TX.
MN.
OK.
KS.
NB.
ND.
SD.
IOWA
WS.
IL. IN.OH.
KY.
ARK.
AL.
LA.
MO.
GA.
SC.
FL.
NC.
VA. W.VA.
PA.
DL.
NJ.
NY.
VT. NH.
MAINE
RI.CT.
MASS.
MD.
MICH.
MICH.
TN.
MS.

18Dr. Kim D. Coder Warnell School University of Georgia
SH.
TX.
MN.
AZ.
CO.
.
UT.
OR.
MONT.
ID.
OK.
NM.
KS.
NB.
ND.
SD.
WY. IOWA
WS.
IL. IN.OH.
KY.
ARK.
AL.
LA.
MO.
NV.
GA.
SC.
FL.
NC.
VA. W.VA.
PA.
DL.
NJ.
NY.
VT. NH.
MAINE
RI.CT.
MASS.
MD.
MICH.
MICH.
TN.
MS.
Figure 7: Estimated number of years between acatagory 3 hurricane landfall. (after NOAA data)
4030
50 30
10
204075 40
30 20
>100
70
90

19Dr. Kim D. Coder Warnell School University of Georgia
50
40
30
20
10
0
hurricanesin 100 years
time of year
MA
Y
JUN
JUL
AU
G
SE
P
OC
T
NO
V
DE
C
Figure 8: Estimated number of hurricanesin the United States over a 100 year period.
September 10 is peak. (from NOAA data)

20Dr. Kim D. Coder Warnell School University of Georgia
mid-point wind wind
storm speed pressure*category mph lbs/ft2 tree impacts
1 74-95 19 branch &tree failures
2 96-110 28 major treefailures
3 111-130 38 large treefailures –leaves gone
4 131-155 54 massive treeblow-downs
5 > 155 > 63 most treesdown
(* column is not part of wind scale but added by author)
Figure 9: Saffir-Simpson Hurricane Scale with tree impacts.

21Dr. Kim D. Coder Warnell School University of Georgia
mid-point wind wind storm
storm speed pressure* surge category mph lbs/ft2 feet
1 74-95 19 4-5
2 96-110 28 6-8
3 111-130 38 9-12
4 131-155 54 13-18
5 > 155 > 63 > 18(* column is not part of wind scale but added by author)
Figure 10: Saffir-Simpson Hurricane Scaleand associated ocean storm surge levels.

22Dr. Kim D. Coder Warnell School University of Georgia
Figure11: Estimated maximum wind speed at variousdistances inland from a catagory 3 hurricane landfall.(NOAA data)
0 50 100 150 200 250 miles inland from storm landfall
120
100
80
60
40
20
0
maximumwind speed
(mph) hurricane winds

23Dr. Kim D. Coder Warnell School University of Georgia
WASH.
TX.
MN.
AZ.
CO.
CA.
UT.
OR.
MONT.
ID.
OK.
NM.
KS.
NB.
ND.
SD.
WY. IOWA
WS.
IL. IN.OH.
KY.
ARK.
AL.
LA.
MO.
NV.
GA.
SC.
FL.
NC.
VA. W.VA.
PA.
DL.
NJ.
NY.
VT. NH.
MAINE
RI.CT.
MASS.
MD.
MICH.
MICH.
TN.
MS.
Figure 12: Estimated sustained ~60 mph wind speedline for inland areas after a catagory 3hurricane landfall. (after NOAA data)

24Dr. Kim D. Coder Warnell School University of Georgia
1950 1960 1970 1980 1990 2000 year
1500
1200
900
600
300
0
Figure 13: General trend line for tornado numbers. (NOAA data)
number oftornadoes

25Dr. Kim D. Coder Warnell School University of Georgia
11
Figure 14: Average historic number of tornadoes per year.
63
2
2
2
23
1
<1/2
<1/9
<1/9
1
WASH.
TX.
MN.
AZ.
CO.CA.
UT.
OR.
MONT.
ID.
OK.NM.
KS.
NB.
ND.
SD.
WY. IOWA
WS.
IL.IN.
OH.
KY.
ARK.AL.
LA.
MO.NV.
GA.SC.
FL.
NC.
VA. W.VA.
PA.
DL.
NJ.
NY.VT.
NH.
MAINE
RI.CT.MASS.
MD.
MICH.
MICH.
TN.
MS.
1

26Dr. Kim D. Coder Warnell School University of Georgia
wind mid-point speed wind tornado
category range pressure descriptor (mph) (lbs/ft2)*
F0 40-73 ~8 gale tornado F1 73-112 23 moderate
F2 113-157 48 significant F3 158-206 87 severe
F4 207-260 144 devastating F5 261-318 221 incredible
F6 319-379 321 inconceivable (* column is not part of the wind scale but added by the author)
Figure 15: Fujita Tornado Scale. (used before 2/1/2007)

27Dr. Kim D. Coder Warnell School University of Georgia
wind mid-point speed wind
category range pressure tree impacts (mph) (lbs/ft2)*
F0 40-73 ~8 minimal damage– branch breakage
F1 73-112 23 moderate damage– trees uprooted
F2 113-157 48 major damage – largetrees snapped &uprooted
F3 158-206 87 severe damage– forests flattened
F4 207-260 144 devastating damage– all trees destroyed
F5 261-318 221 incredible damage– tree parts debarked
F6 319-379 321 inconceivabledamage – everythingflattened
(* column is not part of the wind scale but added by the author)
Figure 16: Fujita Tornado Scale with tree impacts.(used before 2/1/2007)

28Dr. Kim D. Coder Warnell School University of Georgia
Figure 17: Comparison of historic Fujita tornado scale(F number) with new Enhanced Fujita tornado scale
(EF number), and the speed of wind gusts inmiles per hour sustained. (NOAA data)
F gust EF gust number mph number mph
0 45 - 78 0 65 - 85
1 79 - 117 1 86 - 110
2 118 - 161 2 111 - 135
3 162 - 209 3 136 - 165
4 210 - 261 4 166 - 200
5 262 - 317 5 >200 mph
6 318 - 380

29Dr. Kim D. Coder Warnell School University of Georgia
0 1 2 3 4 5
300
250
200
150
100
50
0
Wind GustSpeedmph
Figure 18: Comparison of F-Scale (solid line) andEF-Scale (dotted line) values. Note both scalesare curves but are shown here as straight lines.
F-Scale
EF-Scale
Scale (Category) Number

30Dr. Kim D. Coder Warnell School University of Georgia
wind mid-point speed wind tornado
category range pressure damge (mph) (lbs/ft2)* descriptor
EF0 65-85 15 light
EF1 86-110 25 moderate
EF2 111-135 40 considerable
EF3 136-165 60 severe
EF4 166-200 88 devastating
EF5 > 200 >105 incredible
(* column is not part of the wind scale but added by the author)
Figure 19: Enhanced Fujita Tornado Scale(used after 2/1/2007) (NOAA data)

31Dr. Kim D. Coder Warnell School University of Georgia
wind mid-point speed wind
category range pressure tree impacts (mph) (lbs/ft2)*
EF0 65-85 15 branchesbreak
EF1 86-110 25 trees uproot,trees snap
EF2 111-135 40 treesdebarked -only branchstubs remain
EF3 136-165 60 treesdestroyed
EF4 166-200 88EF5 > 200 >105
(* column is not part of the wind scale but added by the author)
Figure 20: Enhanced Fujita Tornado Scalewith tree impacts. (used after 2/1/2007) (NOAA data)

32Dr. Kim D. Coder Warnell School University of Georgia
160
120
80
40
01 2 3 4 5 Tree Damage Rating
WindSpeedmph
Figure 21: General damage ratings of the EF Scale,in linear form, by wind speed in miles per hour forhardwood (solid line) and softwood (dotted line) trees.Tree damage rating descriptors: 1 = small limbs broken; 2 = large branchesbroken; 3 = uprooting; 4 = snapped trunks; 5 = debarked with only branchstubs remaining. (NOAA data)
softwoods
hardwoods

33Dr. Kim D. Coder Warnell School University of Georgia
wind mid-point speed wind
category range pressure tornado (mph) (lbs/ft2)* descriptor
T0 39-54 7.7 light
T1 55-72 11 mild T2 73-92 18 moderate T3 93-114 28 strong
T4 115-136 42 severe T5 137-160 58 intense T6 161-186 79 moderately
devastating
T7 187-212 105 stronglydevastating
T8 213-240 135 severelydevastating
T9 241-269 171 intenselydevastating
T10 270-299 213 super(* column is not part of the wind scale but added by author)
Figure 22: Meaden Tornado T-Scale.

34Dr. Kim D. Coder Warnell School University of Georgia
wind mid-point speed wind
category range pressure (mph) (lbs/ft2)* tree impacts
T0 39-54 7.7 twig breakage
T1 55-72 11 slight damage
T2 73-92 18 branch twist &breakage / smalltrees uprooted
T3 93-114 28 some trees broken
T4 115-136 42 many trees uprootedor broken
T5 137-160 58 most trees uprootedor broken
T6 161-186 79 trees destroyed
T7 187-212 105 partial debarking
T8 213-240 135 trees flattened
T9 241-269 171 complete debarking
T10 270-299 213 all trees blownapart & toppled
(* column is not part of the wind scale but added by author)
Figure 23: Meaden Tornado T-Scale with tree impacts.

35Dr. Kim D. Coder Warnell School University of Georgia
<0.52
2
4
4
4 8
8
8
815
15
2515WASH.
TX.
MN.
AZ.
CO.
CA.
UT.
OR.
MONT.
ID.
OK.
NM.
KS.
NB.
ND.
SD.
WY. IOWA
WS.
IL.IN.
OH.
KY.
ARK.
AL.
LA.
MO.
NV.
GA.
SC.
FL.
NC.
VA. W.VA.
PA.
DL.
NJ.
NY.
VT. NH.
MAINE
RI.CT.
MASS.
MD.
MICH.
MICH.
TN.
MS.
2525
4
<0.5
Figure 24: Estimated average number of days in ayear with freezing precipitation. (NOAA data)

36Dr. Kim D. Coder Warnell School University of Georgia
Figure 25: Ice storm ice accumulations (uniform radialthickness in inches) for a once in 50 year storm.
(derived from Jones et.al. 2002)
37Dr. Kim D. Coder Warnell School University of Georgia
Figure 26: Ice storm wind gusts for a once in 50 yearstorm (3 second average velocity in mph).
(derived from Jones et.al. 2002)

38Dr. Kim D. Coder Warnell School University of Georgia
0 5 10 15 20 25 30 35wind speed (mph)
1.75
1.50
1.25
1.00
0.75
0.50
0.25
00.10
110
2
3
4
43
22
4
33 4
iceaccumulation
(inches)
Figure 27: Ice damage severity catagories (SPIA Index)using ice accumulation (inches) and wind speed (mph).
(derived from NOAA 2009)
55
5
5
0

39Dr. Kim D. Coder Warnell School University of Georgia
Figure 28: Maximum rainfall in inchesby state for one 24 hour period.
40
30
20
WASH.
TX.
MN.
AZ.
CO.
CA.
UT.
OR.
MONT.
ID.
OK.
NM.
KS.
NB.
ND.
SD.
WY. IOWA
WS.
IL. IN.
OH.
KY.
ARK.
AL.
LA.
MO.
NV.
GA.
SC.
FL.
NC.
VA.
W.VA.
PA.
DL.
NJ.
NY.
VT. NH.
MAINE
RI.CT.
MASS.
MD.
MICH.
MICH.
TN.
MS.
3020
10
2030
10
40Dr. Kim D. Coder Warnell School University of Georgia
0 10 20 30 40 50 60 70 80 90 100% clay percent in soil
100%
90
80
70
60
50
40
30
20
10
0
Plastic &Liquid Limit
Values
Figure 29: The plastic and liquid limits (water contentpercent) on soils with various clay contents.
liquid limit
plastic limit
YL = 22 + 0.7XLYP = 22 + 0.2XP
(wat
er c
onte
nt p
erce
nt)

41Dr. Kim D. Coder Warnell School University of Georgia
Figure 30: Coder Storm Intensity Map of potential risksfor tree damage. Zone 10 represents the greatest storm
intensity area, leading to the greatest risk of tree damage.
1
4
5
89
0
WASH.
TX.
MN.
AZ.
CO.
CA.
UT.
OR.
MONT.
ID.
OK.NM.
KS.
NB.
ND.
SD.
WY. IOWA
WS.
IL. IN.
KY.
ARK.
AL.
LA.
MO.
NV.
GA.
SC.
FL.
NC.
VA. W.VA.
PA.
DL.
NJ.
NY.
VT.NH.
MAINE
RI.CT.
MASS.
MD.
MICH.
MICH.
TN.
MS.7
2 3
OH.
6
10

42Dr. Kim D. Coder Warnell School University of Georgia
wind velocity pounds per square (mph) feet (lbs/ft2)
5 0.1 10 0.3 15 0.6 20 1.1 25 1.7
30 2.4 35 3.2 40 4.2 45 5.3 50 6.6
55 8.0 60 9.5 65 11 70 13 75 15
wind velocity pounds per square (mph) feet (lbs/ft2)
80 17 85 19 90 21 95 24100 26
110 32120 38130 45140 52150 59
175 81200 105225 133250 165275 199
Figure 31: Estimated wind pressures in pounds per squarefeet (lbs/ft2) calculated under standard conditions
for various wind velocities in miles per hour (mph).(drag coefficient = 1.0)
wind pressure in pounds per square foot =(0.013) X ( wind speed in mph X (0.45) )2

43Dr. Kim D. Coder Warnell School University of Georgia
Figure 32: Estmated pressure of storm winds atdifferent wind speeds applied to trees.(drag coefficient = 1.0)
wind pressure in pounds per square feet = (0.013) X ( wind speed in miles per hour X (0.45) )2
0 50 100 150 200 wind speed (mph)
win
d p
ress
ure
(lbs/
ft2 ) 100
80
60
40
20
0

44Dr. Kim D. Coder Warnell School University of Georgia
wind wind C-scale speed force value mph lbs/ft2
1 1.0mph -- 2 5.7 0.09 3 15.6 0.64 4 32 2.7 5 56 8.3 6 88 20.4
7 130 44.5 8 181 86 9 243 15610 316 263lbs/ft2
Figure 33: Coder Wind Scale (C-scale) of load factors on treeswith associated wind speeds in miles per hour and windloading force in pounds per square foot. (drag coefficient = 1.0)
( C-scale value ) 2.5 = wind speed mph(( C-scale value ) 2.5 X 0.45 ) 2 X 0.013 = wind force lbs/ft2
T1
6.2 T2 ~96 ~24 ]

45Dr. Kim D. Coder Warnell School University of Georgia
wind windspeed pressure (mph) (lbs/ft2) tree damage descriptor
20 1.1 root / soil interfacefractures initiated
40 4.2 major stem & crown sway –branch failures
** T1T1T1T1T1 = end of crown drag reconfigurations =~56mph (~8 lbs/ft2) **
60 9.5 stem breakage – uprooting
90 21 major tree failures** T2T2T2T2T2 = tree safety factors consumed =
~96mph (~24 lbs/ft2) **
125 41 catastrophic tree losses
>160 67 massive tree destruction
Figure 34: Coder Tree Wind Damage Assessment showingwind velocity in miles per hour, wind pressure in pounds
per square foot (drag coefficient = 1.0), potential treedamage, and two wind load thresholds where
tree resistance to loads change rapidly.

46Dr. Kim D. Coder Warnell School University of Georgia
wind wind tree crown tree crown index speed pressure reconfiguration reconfiguration value (mph) (lbs/ft2) descriptor value (%)
C0 0 0 gravity impacts only 0 %
CI 10 0.3 petiole & blade deforming, & twig swaying 5 %
CII 19 1.0 leaves rolled back & large peripheral twigs sway 10 %
CIII 28 2.0 twigs pulled back & peripheral branches sway 25 %
CIV 37 3.6 branches pulled back & stem swaying 45 %
CV 46 5.6 twig breakage, stem pushed / held downwind 70 %
CVI 55mph 8.0lbs/ft2 twig & branch breakage (~ T1 threshold)(~ T1 threshold)(~ T1 threshold)(~ T1 threshold)(~ T1 threshold) 100 %
Figure 35: Coder Index of Tree Crown Reconfigurationgiving index value symbol, wind speed in miles per hour,wind pressure in pounds per square feet, a tree crown
reconfiguration description, and a tree crownreconfiguration percentage. (drag coefficient = 1.0)

47Dr. Kim D. Coder Warnell School University of Georgia
Figure 36: Coder Index of Tree Crown Reconfigurationunder wind load (drag coefficient = 1.0), and under
combined wind and ice loading. (Coder 2014)
tree crown wind wind reconfiguration
index speed pressure value (%) value (mph) (lbs/ft2) wind wind + ice
C0 0 0 0 10
CI 10 0.3 5 30
CII 19 1.0 10 60
CIII 28 2.0 25 100
CIV 37 3.6 45
CV 46 5.6 70
CVI 55 8.0 100

The University of Georgia Warnell School of Forestry and Natural Resources offers educational programs, assistance andmaterials to all people without regard to race, color, national origin, age, gender or disability.
The University of Georgia is committed to principles of equal opportunity and affirmative action.
Publication WSFNR-18-36 April 2018
Citation:Coder, Kim D. 2018. Trees & storm wind loads. Warnell
School of Forestry & Natural Resources, Universityof Georgia, Outreach Publication WSFNR-18-36. Pp.48.