Embed Size (px)
Citation preview

a limited liability company
Analysis Background and Purpose
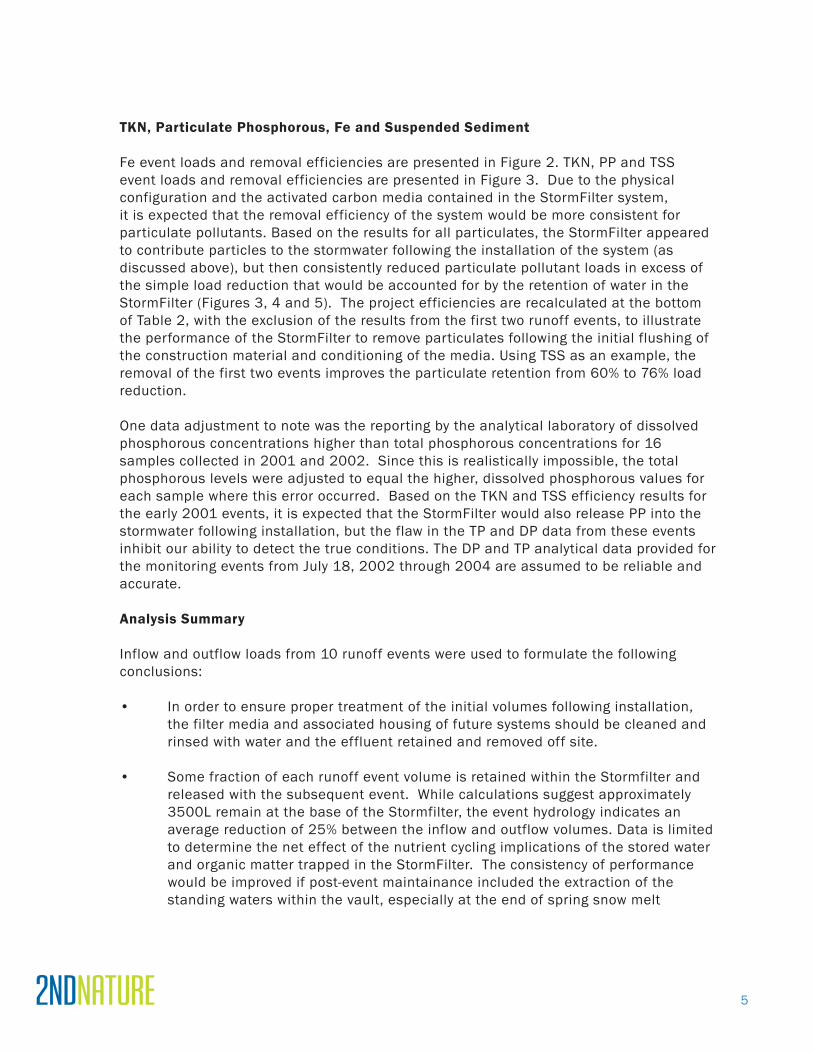
A StormFilter system was installed in the Ski Run Marina parking lot by the City of South Lake Tahoe in 2001 (Photos 1). The StormFilter is a unique Stormwater Treatment System developed by Stormwater Management, Inc. The StormFilter is a passive, flow through storm water filtration system that contains rechargeable cartridges filled with a variety of filter media housed within a concrete vault (Photos 1). The StormFilter works by passing stormwater through media-filled cartridges, which trap particulates and adsorb pollutants including dissolved metals, nutrients and hydrocarbons. A StormFilter animation can be viewed at http://www.stormwaterinc.com/products/stormfilter.shtml. The City of South Lake Tahoe established automated storm water monitoring equipment at the inlet and outlet of the StormFilter system to quantitatively evaluate the in-situ ability of the StormFilter to reduce nutrient and fine sediment loads from stormwater runoff at Ski Run Marina in South Lake Tahoe. This report summarizes the findings of 2.5 years of storm water quality monitoring at this site.
Stormwater monitoring
The City of South Lake Tahoe (CSLT) installed two Sigma 900 MAX automated water samplers with area velocity flow meters at both the inlet (Site S
in) and the outlet (Site S
out) of the StormFilter vault to collect flow-
weighted stormwater samples during a variety of runoff events (Photos 1). Both sampling units were equipped with 24 sample bottles (1L) and flow pacing was adjusted to collect a number of samples during each individual event that provided a representative selection of the entire storm hydrograph at both the inlet and outlet. The instruments were well maintained and serviced prior to each anticipated runoff event. The two monitoring systems and the associated data were installed, maintained and managed primarily by Russ Wigart, an engineer with CSLT.
A total of 10 events were successfully monitored at both the inlet and outlet for flow and water sample collection. All samples were placed on ice and submitted to WetLab Analytical and processed for the constituents listed in Table 1 within 48 hours of collection by the auto samplers. Upon arrival at the analytical laboratory, a subsample was filtered and subsequently analyzed for dissolved phosphorous. All of the other constituent values presented herein are the analytical results from unfiltered samples, including nitrate, nitrite, ammonium and orthophosphate. Thus the interpretations are limited to the total fractions of the nutrients of interest, with the exception of the dissolved phosphorous pool.
StormFilter Performance AnalysisSouth Lake Tahoe, California
April 2005
2
On three instances, samples were collected by the Sigma sampler but the flow data was unavailable due to instrument malfunction and thus are not included in this analysis. All of the hydrologic and water sample analytical data was provided to a consulting firm (2ND NATURE) in November 2004 for analysis, interpretation and the preparation of this final report.
Table 1. Constituent analyses performed on inflow and outflow water samples.
ConstituentsAcronym or
chemical nomenclature
Sample handling
WetLab Detection Limit (mg/L)
Nitrate NO3- unfiltered 0.01
Nitrite NO2- unfiltered 0.01
Ammonium NH3 unfiltered 0.05
Total Organic Nitrogen TKN unfiltered 0.05
Total Nitrogen TNcalculated (sum of TKN
nitrate and nitrite)
Orthophosphate ORP (PO42-) unfiltered 0.005
Dissolved Phosphorous DP filtered 0.005
Particulate Phosphorous PP unfiltered calculated (TP-DP)
Total Phosphorous TP unfiltered 0.005
Total Suspended Solids TSS unfiltered 1
Total Iron Fe unfiltered 0.01
Data Analysis
A total of 81 water samples were collected from Sin and 70 samples from S
out,
representing 10 runoff events and analyzed for the above constituents by WetLab Analytical. Based on the sampling history maintained by the automated sampler, the total event water volume represented by the automated sample collection was calculated. The flow-weighted sampling technique ensured that samples were collected at an even distribution throughout the event hydrograph. The constituent concentrations for each sample from a unique runoff event were averaged and used to calculate the total event loads introduced to, and lost from, the StormFilter system (Table 2, Figures 1-3). All samples that were below the detection limit for a given constituent were reported at the detection limit for calculation purposes to determine the average sample concentration. This data analysis method produces an over estimate for the event average concentrations and event loads. Since the majority of the samples below detection were observed at the outlet of the StormFilter, the approach will result in more conservative removal efficiency values than if a non-detection was assumed to be a concentration of zero.
For each event the following calculations were performed for each constituent. Constituent load into StormFilter � ∑ Q
in * mean C
in = L
in
Constituent load into StormFilter � ∑ Qout
* mean Cout
= Lout
Constituent load reduction as a result ofStormFilter interaction (% removal efficiency) (L
in-L
out)/L
in
3
If % removal efficiency was negative, the following calculation was performed:Constituent load increase as a
result of StormFilter interaction (% contribution) (Lout
- Lin)/L
out
∑ (Qin/Q
out): water volume inflow/outflow represented by 1 sample collected during a given event
Cin/C
out : 1 sample concentration collected at inlet/outlet for a given event
Lin/L
out : total load (mass) of a constituent imported/exported to/from the
StormFilter system.
To determine the performance efficiency for the 2.5 years of monitoring, the sum of the inflow and outflow loads were calculated for all of the events sampled and then the project efficiency was calculated for each constituent and presented at the bottom of Table 2. The average and standard deviation of the individual event efficiencies for each parameter are also provided.
Results and Discussion
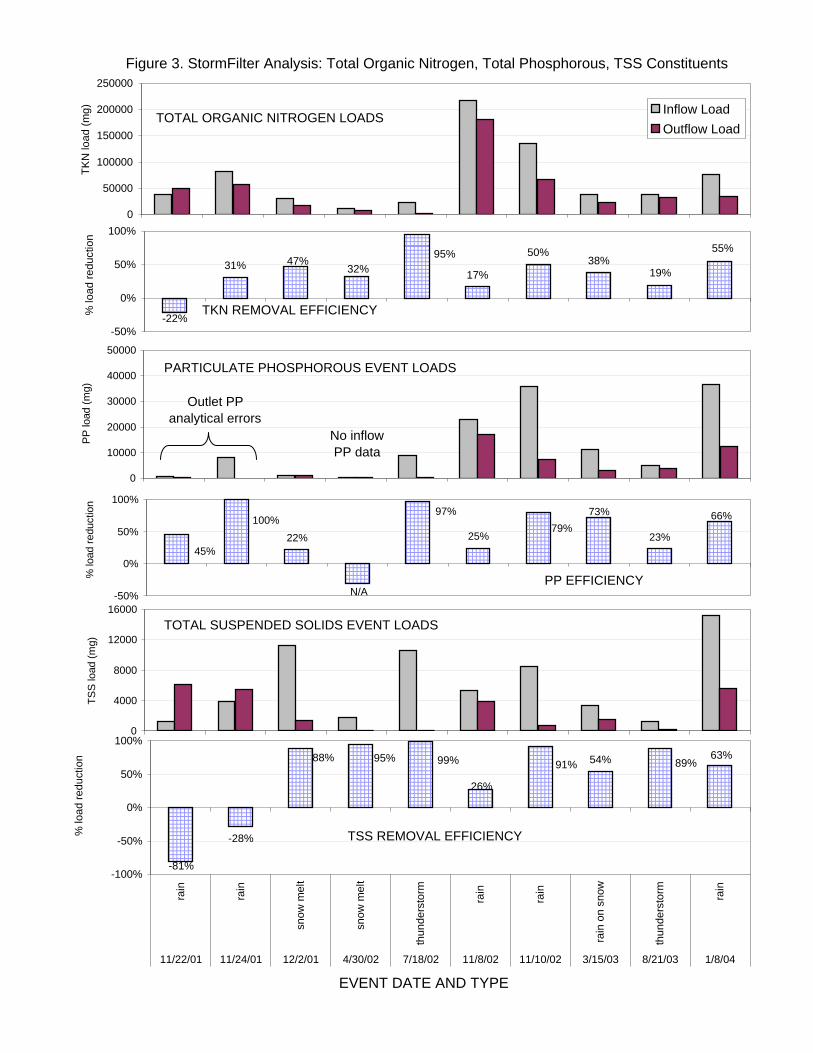
Figures 1-3 graphically display the respective inflow and outflow loads for each constituent for the 10 events successfully sampled. Also included in Figures 1-3 are the % load reductions observed as a result of stormwater interaction with the StormFilter system (Table 2 presents the numerical concentrations, event loads and pollutant removal values). A positive value indicates a net retention of the constituent from the stormwater and a negative value signifies that the load of the constituent was greater in the outflowing than in the inflowing waters. For all 10 events, some fraction of the inflowing water volume was retained in the StormFilter system (Figure 4), thus a negative % load change value indicates that the concentrations in the outflowing samples were consistently higher than the inflowing samples and the StormFilter unit was a source of the constituent to the passing stormwater. On average, the outflow volume was 25% less than the inflow for each event. Based on the dimensions of the Stormfilter vault (25’ x 10’) and a reported 6” water level at the base the unit (R. Wigart CSLT), approximatley 3500L is retained within the bottom of the vault following each runoff event. Since 3500L still does not account for the observed inflow and outflow volume discrepancies observed for all events, there may be some fraction of each event volume that is not accounted for if flow depths are below 0.08’ and undetectable by the flow meter sensors. Regardless of the mechanisms responsible for the volume discrepancies, the event volume reduction (%) should be compared to the % removal efficiency of each pollutant calculated to evaluate if the load reduction in the outflow is merely the result of temporary water retention within the system itself.
The first two runoff events (Nov 2001) following the construction and installation of the Stormfilter indicate a significant source of particulate matter from the Stormfilter due to the high negative efficiencies of TSS. Discussions with Stormfilter Management Inc. following these findings suggest that post installation cleaning of the cement vault and conditioning of the filters is necessary to ensure adequate performance of the system to retain particulates during the first runoff event. Future installations of any media filtration system in the Lake Tahoe Basin should include proper cleaning of construction residues and flushing of the new media.
4
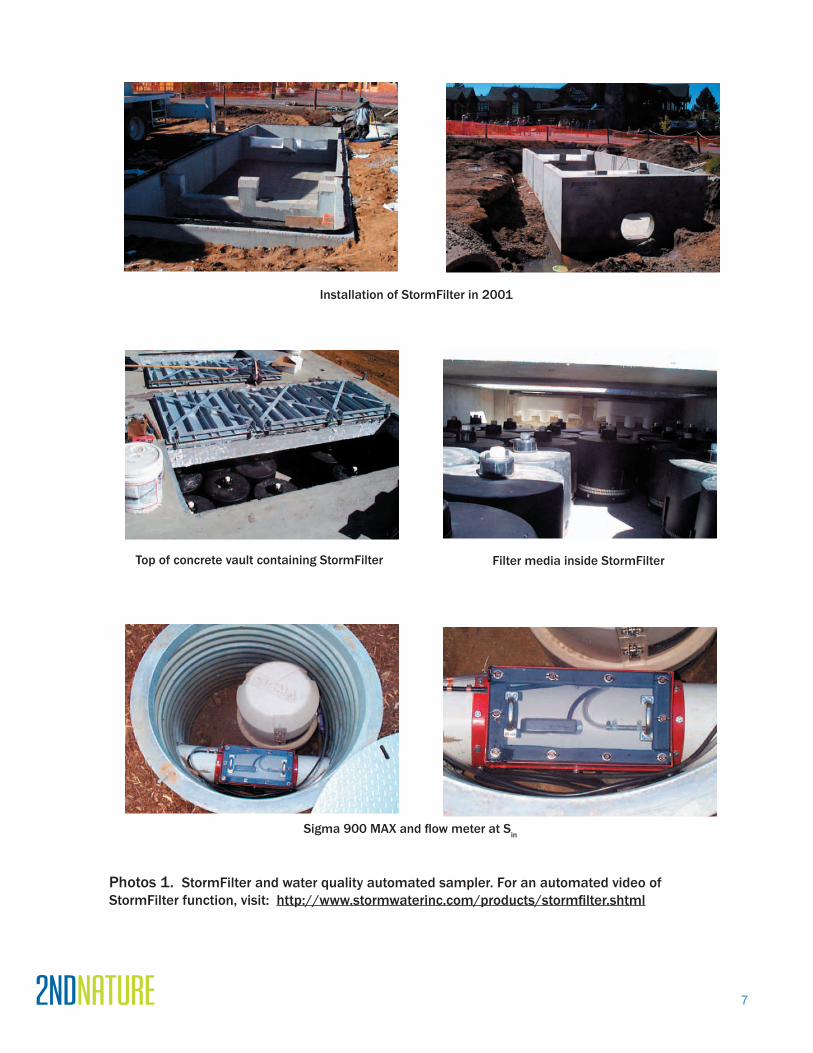
Nitrogen Species
Nitrate is consistently the primary biologically available N species found in Lake Tahoe stormwater due to atmospheric deposition (Lake Tahoe Watershed Assessment 2000). Nitrate was the primary nitrogen species in most winter rain and rain on snow events monitored, but ammonium loads exceeded nitrate in all snow melt events introduced to the StormFilter. These findings are consistent with partial decomposition of nitrate to ammonium at the base of the snow pack over the duration of the winter months. Nitrite samples collected at both the inlet and the outlet were consistently at or below the analytical detection limit (0.01 mg/L), which is not surprising since nitrite is a reduced species of nitrate and not common in stormwater. However, the peak winter rain event in 2002 did have a number of samples with detectable levels of nitrite, including elevated nitrite outlet concentrations.
The StormFilter system displayed a variable ability to retain some fraction of the total nitrate (Figure 1) ranging from 89% to -94 % (contribution). The StormFilter did not reduce the inflowing nitrate or nitrite loads during the largest storm runoff event of the monitoring effort (November 8, 2002). The significant outflow loads of nitrite during the winter rain event in 2002 may be the result of flushing waters retained in the StormFilter from the previous event 4 months earlier. It is reasonable to assume that the decomposition of organic matter retained in the vault during the summer months would result in an increase in the nitrite and ammonium concentrations within the trapped water held at the base of the vault. Organic cycling would be less of a concern during the cold winter months when respiration rates are substantially repressed. Unfortunately, the first winter rain of 2003 (November 1, 2003) was not sampled to provide additional information on the characterization of waters that remain in the StormFilter during the warm months of the year. Ammonium load removal from inflowing stormwater was consistent throughout the monitoring efforts. Figure 5 reiterates the consistent ability of the StormFilter to reduce ammonium as well as the variable performance of the system to remove nitrate and nitrite loads from stormwater.
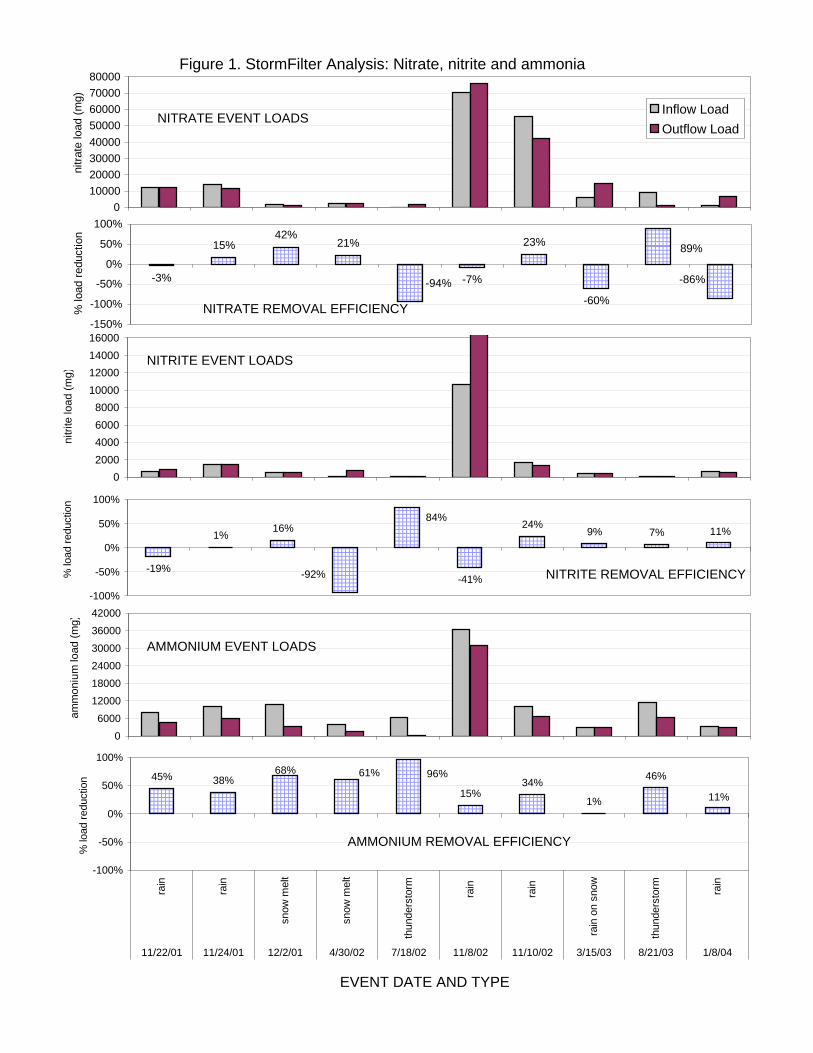
Phosphorous
Total orthophosphate (ORP) concentrations delivered to the StormFilter ranged from 10 to 200 ug/L. The StormFilter reduced the ORP loads by 21% and the DP by 22% (coincidentally very close to the event volume difference of 21%) during the largest rain storm of the year (November 8, 2002), when nitrate and nitrite constituents were both elevated in the outflowing waters. Based on the available data, the ability of the StormFilter to remove ORP is similar to its inconsistent performance with other dissolved species, ammonium being the exception. The variability (error bars) in Figure 6 summarize the occasional negative efficiency of the StormFilter with respect to nitrate, nitrite, ORP and dissolved phosphorous constituents.
5
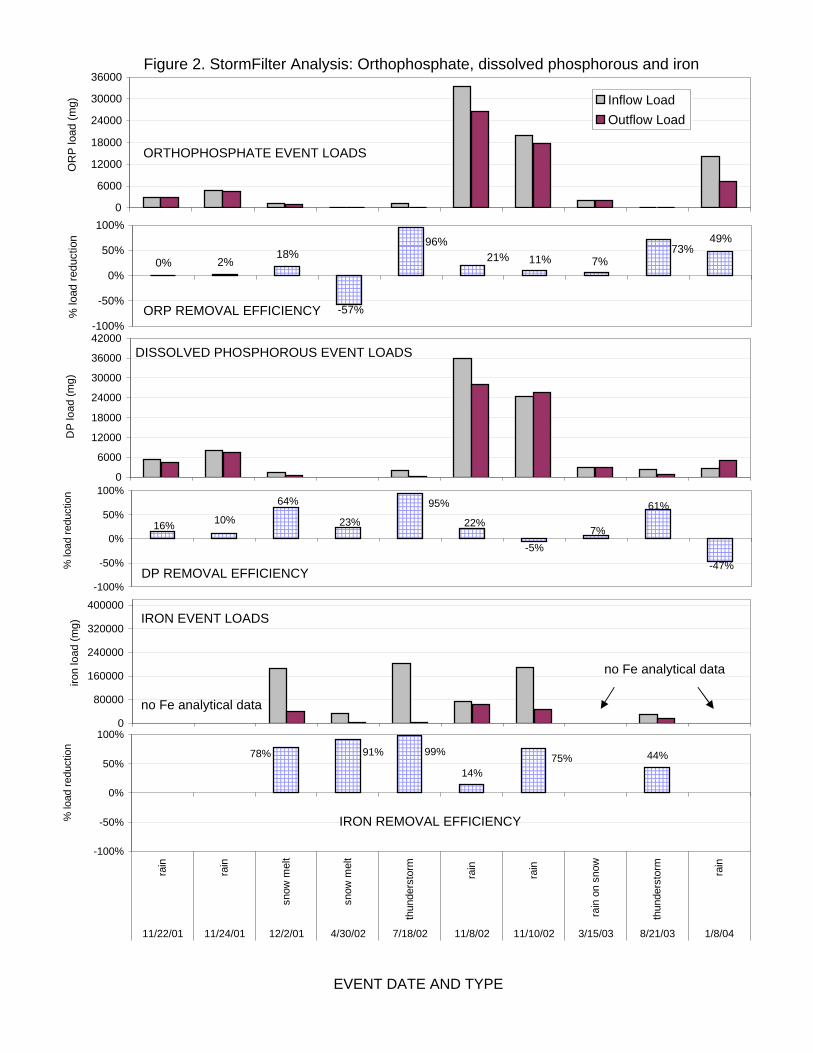
TKN, Particulate Phosphorous, Fe and Suspended Sediment
Fe event loads and removal efficiencies are presented in Figure 2. TKN, PP and TSS event loads and removal efficiencies are presented in Figure 3. Due to the physical configuration and the activated carbon media contained in the StormFilter system, it is expected that the removal efficiency of the system would be more consistent for particulate pollutants. Based on the results for all particulates, the StormFilter appeared to contribute particles to the stormwater following the installation of the system (as discussed above), but then consistently reduced particulate pollutant loads in excess of the simple load reduction that would be accounted for by the retention of water in the StormFilter (Figures 3, 4 and 5). The project efficiencies are recalculated at the bottom of Table 2, with the exclusion of the results from the first two runoff events, to illustrate the performance of the StormFilter to remove particulates following the initial flushing of the construction material and conditioning of the media. Using TSS as an example, the removal of the first two events improves the particulate retention from 60% to 76% load reduction.
One data adjustment to note was the reporting by the analytical laboratory of dissolved phosphorous concentrations higher than total phosphorous concentrations for 16 samples collected in 2001 and 2002. Since this is realistically impossible, the total phosphorous levels were adjusted to equal the higher, dissolved phosphorous values for each sample where this error occurred. Based on the TKN and TSS efficiency results for the early 2001 events, it is expected that the StormFilter would also release PP into the stormwater following installation, but the flaw in the TP and DP data from these events inhibit our ability to detect the true conditions. The DP and TP analytical data provided for the monitoring events from July 18, 2002 through 2004 are assumed to be reliable and accurate.
Analysis Summary
Inflow and outflow loads from 10 runoff events were used to formulate the following conclusions:
• In order to ensure proper treatment of the initial volumes following installation, the filter media and associated housing of future systems should be cleaned and rinsed with water and the effluent retained and removed off site.
• Some fraction of each runoff event volume is retained within the Stormfilter and released with the subsequent event. While calculations suggest approximately 3500L remain at the base of the Stormfilter, the event hydrology indicates an average reduction of 25% between the inflow and outflow volumes. Data is limited to determine the net effect of the nutrient cycling implications of the stored water and organic matter trapped in the StormFilter. The consistency of performance would be improved if post-event maintainance included the extraction of the standing waters within the vault, especially at the end of spring snow melt

6
and following any summer thunderstorm events. This maintainance effort will eliminate the in-situ decomposition of organic matter and the release of dissolved nutrients during warm climatic conditions.
• Based on the available data, the StormFilter has a variable ability to remove dissolved nutrients from stormwater. Figure 5 illustrates a lower project performance for nitrate, nitrite, ORP and dissolved P than the other constituents and Figure 6 illustrates the event variablity associated with the treatment of these nutrients. The exception to this rule is ammonium that is consistently retained within the StormFilter. Post-event maintainence of the unit may improve the consistency of the StormFilter to treat dissolved constituents.
• Following the initial conditioning of the system, the StormFilter consistently reduces the particulate pollutants (N, P, Fe, and TSS) in urban stormwater, with the one exception being the April 30th snowmelt event which showed increases in PP and TP.
If planned, future monitoring of the Ski Run StormFilter should:
• Sample to address the potential of the StormFilter to be a source of nitrate, nitrite and ORP to effluent waters during the first rain event the year following the retention of water in the system during the year’s peak temperatures.
• Samples should be filtered prior to analysis of nitrate, nitrite, ammonium, orthophosphate and dissolved phosphorous to improve our understanding of the fate of dissolved constituents introduced to the StormFilter.
7
Sigma 900 MAX and flow meter at Sin
Installation of StormFilter in 2001
Top of concrete vault containing StormFilter Filter media inside StormFilter
Photos 1. StormFilter and water quality automated sampler. For an automated video of StormFilter function, visit: http://www.stormwaterinc.com/products/stormfilter.shtml
01000020000300004000050000600007000080000
nitra
te lo
ad (m
g)
Inflow LoadOutflow Load
02000400060008000
10000120001400016000
nitri
te lo
ad (m
g)
-3%
15%42%
21%
-7%
23%
-60%-94% -86%
89%
-150%
-100%
-50%
0%
50%
100%
% lo
ad re
duct
ion
-19%
1%16%
-41%
24%9%
-92%
84%11%7%
-100%
-50%
0%
50%
100%
% lo
ad re
duct
ion
0
6000
12000
18000
24000
30000
36000
42000
amm
oniu
m lo
ad (m
g)
45% 38%15%
34%
1%
68% 46%
11%
96%61%
-100%
-50%
0%
50%
100%
rain
rain
snow
mel
t
snow
mel
t
thun
ders
torm
rain
rain
rain
on
snow
thun
ders
torm rain
11/22/01 11/24/01 12/2/01 4/30/02 7/18/02 11/8/02 11/10/02 3/15/03 8/21/03 1/8/04
% lo
ad re
duct
ion
Figure 1. StormFilter Analysis: Nitrate, nitrite and ammonia
EVENT DATE AND TYPE
NITRATE EVENT LOADS
NITRITE EVENT LOADS
NITRATE REMOVAL EFFICIENCY
AMMONIUM EVENT LOADS
NITRITE REMOVAL EFFICIENCY
AMMONIUM REMOVAL EFFICIENCY
0
6000
12000
18000
24000
30000
36000O
RP
load
(mg) Inflow Load
Outflow Load
0
6000
12000
18000
24000
30000
36000
42000
DP
load
(mg)
0% 2%18%
49%
7%
-57%
21%96% 73%
11%
-100%
-50%
0%
50%
100%
% lo
ad re
duct
ion
64%
22%
-5%7%16% 10% 23%
95%
-47%
61%
-100%
-50%
0%
50%
100%
% lo
ad re
duct
ion
0
80000
160000
240000
320000
400000
iron
load
(mg)
14%75%78% 44%99%91%
-100%
-50%
0%
50%
100%
rain
rain
snow
mel
t
snow
mel
t
thun
ders
torm
rain
rain
rain
on
snow
thun
ders
torm rain
11/22/01 11/24/01 12/2/01 4/30/02 7/18/02 11/8/02 11/10/02 3/15/03 8/21/03 1/8/04
% lo
ad re
duct
ion
Figure 2. StormFilter Analysis: Orthophosphate, dissolved phosphorous and iron
EVENT DATE AND TYPE
ORTHOPHOSPHATE EVENT LOADS
DISSOLVED PHOSPHOROUS EVENT LOADS
ORP REMOVAL EFFICIENCY
IRON EVENT LOADS
DP REMOVAL EFFICIENCY
IRON REMOVAL EFFICIENCY
no Fe analytical data
no Fe analytical data
0
50000
100000
150000
200000
250000TK
N lo
ad (m
g) Inflow LoadOutflow Load
0
10000
20000
30000
40000
50000
PP
load
(mg)
31%17%
50%38%
-22%
32%47% 95% 55%
19%
-50%
0%
50%
100%
% lo
ad re
duct
ion
22% 25% 23%
66%97%
N/A
79%100%
45%
73%
-50%
0%
50%
100%
% lo
ad re
duct
ion
0
4000
8000
12000
16000
TSS
load
(mg)
-28%
54%
-81%
26%
91%88% 89%63%99%95%
-100%
-50%
0%
50%
100%
rain
rain
snow
mel
t
snow
mel
t
thun
ders
torm
rain
rain
rain
on
snow
thun
ders
torm rain
11/22/01 11/24/01 12/2/01 4/30/02 7/18/02 11/8/02 11/10/02 3/15/03 8/21/03 1/8/04
% lo
ad re
duct
ion
Figure 3. StormFilter Analysis: Total Organic Nitrogen, Total Phosphorous, TSS Constituents
EVENT DATE AND TYPE
TOTAL ORGANIC NITROGEN LOADS
PARTICULATE PHOSPHOROUS EVENT LOADS
TKN REMOVAL EFFICIENCY
TOTAL SUSPENDED SOLIDS EVENT LOADS
PP EFFICIENCY
TSS REMOVAL EFFICIENCY
No inflowPP data
Outlet PP analytical errors
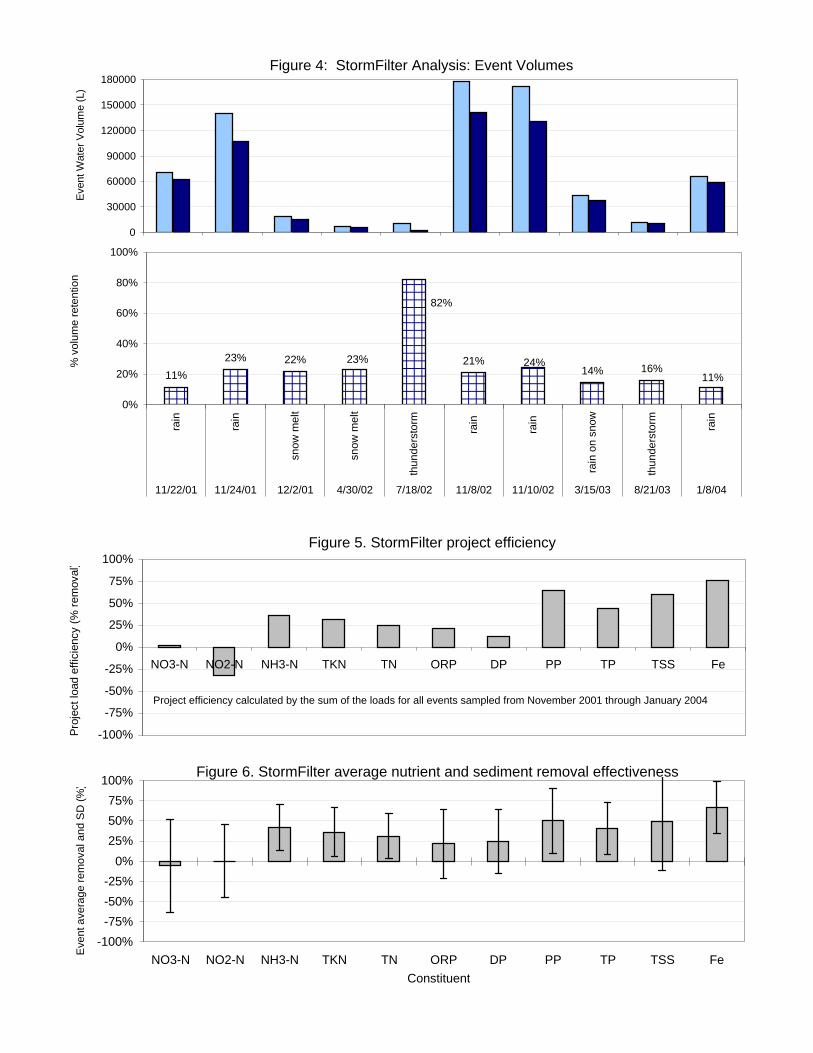
Figure 4: StormFilter Analysis: Event Volumes
0
30000
60000
90000
120000
150000
180000Ev
ent W
ater
Vol
ume
(L)
11%23% 22% 21%
14%24% 16%
11%
82%
23%
0%
20%
40%
60%
80%
100%
rain
rain
snow
mel
t
snow
mel
t
thun
ders
torm
rain
rain
rain
on
snow
thun
ders
torm rain
11/22/01 11/24/01 12/2/01 4/30/02 7/18/02 11/8/02 11/10/02 3/15/03 8/21/03 1/8/04
% v
olum
e re
tent
ion
Figure 6. StormFilter average nutrient and sediment removal effectiveness
-100%-75%-50%-25%
0%25%50%75%
100%
NO3-N NO2-N NH3-N TKN TN ORP DP PP TP TSS FeConstituent
Eve
nt a
vera
ge re
mov
al a
nd S
D (%
)
Figure 5. StormFilter project efficiency
-100%
-75%
-50%
-25%
0%
25%
50%
75%
100%
NO3-N NO2-N NH3-N TKN TN ORP DP PP TP TSS Fe
Pro
ject
load
effi
cien
cy (%
rem
oval
)
Project efficiency calculated by the sum of the loads for all events sampled from November 2001 through January 2004
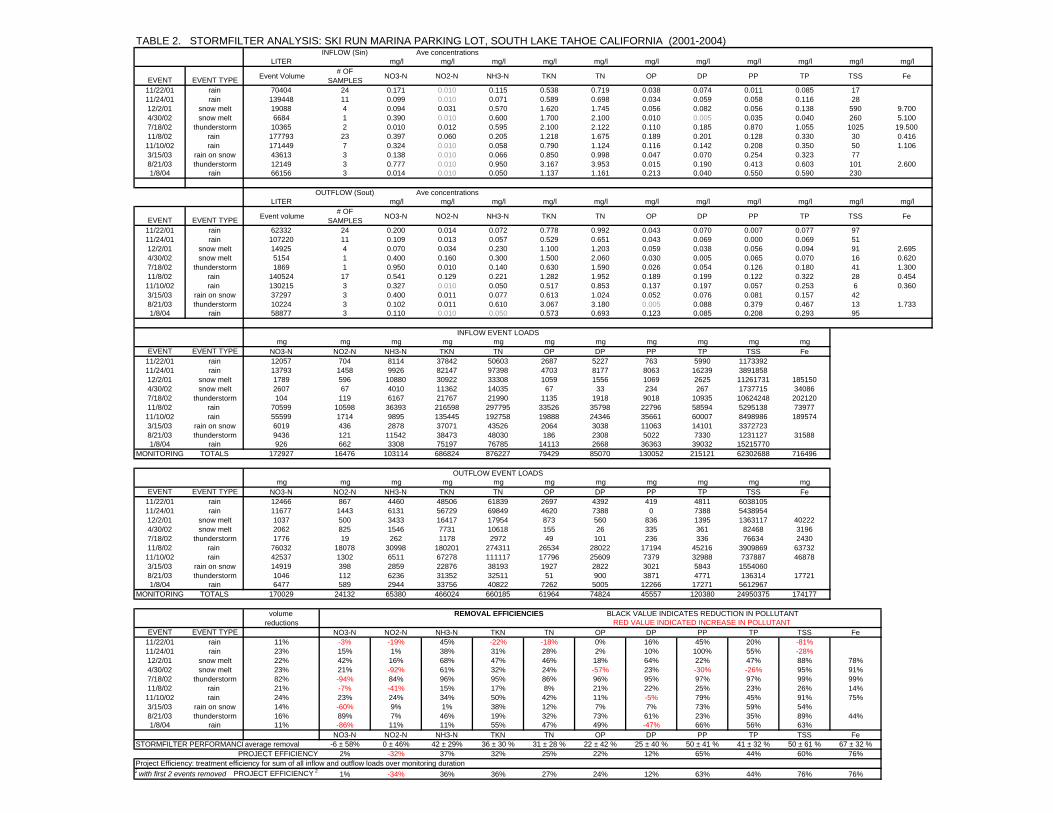
TABLE 2. STORMFILTER ANALYSIS: SKI RUN MARINA PARKING LOT, SOUTH LAKE TAHOE CALIFORNIA (2001-2004)INFLOW (Sin) Ave concentrations
LITER mg/l mg/l mg/l mg/l mg/l mg/l mg/l mg/l mg/l mg/l mg/l
EVENT EVENT TYPE Event Volume # OF SAMPLES NO3-N NO2-N NH3-N TKN TN OP DP PP TP TSS Fe
11/22/01 rain 70404 24 0.171 0.010 0.115 0.538 0.719 0.038 0.074 0.011 0.085 1711/24/01 rain 139448 11 0.099 0.010 0.071 0.589 0.698 0.034 0.059 0.058 0.116 2812/2/01 snow melt 19088 4 0.094 0.031 0.570 1.620 1.745 0.056 0.082 0.056 0.138 590 9.7004/30/02 snow melt 6684 1 0.390 0.010 0.600 1.700 2.100 0.010 0.005 0.035 0.040 260 5.1007/18/02 thunderstorm 10365 2 0.010 0.012 0.595 2.100 2.122 0.110 0.185 0.870 1.055 1025 19.50011/8/02 rain 177793 23 0.397 0.060 0.205 1.218 1.675 0.189 0.201 0.128 0.330 30 0.41611/10/02 rain 171449 7 0.324 0.010 0.058 0.790 1.124 0.116 0.142 0.208 0.350 50 1.1063/15/03 rain on snow 43613 3 0.138 0.010 0.066 0.850 0.998 0.047 0.070 0.254 0.323 778/21/03 thunderstorm 12149 3 0.777 0.010 0.950 3.167 3.953 0.015 0.190 0.413 0.603 101 2.6001/8/04 rain 66156 3 0.014 0.010 0.050 1.137 1.161 0.213 0.040 0.550 0.590 230
OUTFLOW (Sout) Ave concentrationsLITER mg/l mg/l mg/l mg/l mg/l mg/l mg/l mg/l mg/l mg/l mg/l
EVENT EVENT TYPE Event volume # OF SAMPLES NO3-N NO2-N NH3-N TKN TN OP DP PP TP TSS Fe
11/22/01 rain 62332 24 0.200 0.014 0.072 0.778 0.992 0.043 0.070 0.007 0.077 9711/24/01 rain 107220 11 0.109 0.013 0.057 0.529 0.651 0.043 0.069 0.000 0.069 5112/2/01 snow melt 14925 4 0.070 0.034 0.230 1.100 1.203 0.059 0.038 0.056 0.094 91 2.6954/30/02 snow melt 5154 1 0.400 0.160 0.300 1.500 2.060 0.030 0.005 0.065 0.070 16 0.6207/18/02 thunderstorm 1869 1 0.950 0.010 0.140 0.630 1.590 0.026 0.054 0.126 0.180 41 1.30011/8/02 rain 140524 17 0.541 0.129 0.221 1.282 1.952 0.189 0.199 0.122 0.322 28 0.45411/10/02 rain 130215 3 0.327 0.010 0.050 0.517 0.853 0.137 0.197 0.057 0.253 6 0.3603/15/03 rain on snow 37297 3 0.400 0.011 0.077 0.613 1.024 0.052 0.076 0.081 0.157 428/21/03 thunderstorm 10224 3 0.102 0.011 0.610 3.067 3.180 0.005 0.088 0.379 0.467 13 1.7331/8/04 rain 58877 3 0.110 0.010 0.050 0.573 0.693 0.123 0.085 0.208 0.293 95
INFLOW EVENT LOADSmg mg mg mg mg mg mg mg mg mg mg
EVENT EVENT TYPE NO3-N NO2-N NH3-N TKN TN OP DP PP TP TSS Fe11/22/01 rain 12057 704 8114 37842 50603 2687 5227 763 5990 117339211/24/01 rain 13793 1458 9926 82147 97398 4703 8177 8063 16239 389185812/2/01 snow melt 1789 596 10880 30922 33308 1059 1556 1069 2625 11261731 1851504/30/02 snow melt 2607 67 4010 11362 14035 67 33 234 267 1737715 340867/18/02 thunderstorm 104 119 6167 21767 21990 1135 1918 9018 10935 10624248 20212011/8/02 rain 70599 10598 36393 216598 297795 33526 35798 22796 58594 5295138 7397711/10/02 rain 55599 1714 9895 135445 192758 19888 24346 35661 60007 8498986 1895743/15/03 rain on snow 6019 436 2878 37071 43526 2064 3038 11063 14101 33727238/21/03 thunderstorm 9436 121 11542 38473 48030 186 2308 5022 7330 1231127 315881/8/04 rain 926 662 3308 75197 76785 14113 2668 36363 39032 15215770
MONITORING TOTALS 172927 16476 103114 686824 876227 79429 85070 130052 215121 62302688 716496
OUTFLOW EVENT LOADSmg mg mg mg mg mg mg mg mg mg mg
EVENT EVENT TYPE NO3-N NO2-N NH3-N TKN TN OP DP PP TP TSS Fe11/22/01 rain 12466 867 4460 48506 61839 2697 4392 419 4811 603810511/24/01 rain 11677 1443 6131 56729 69849 4620 7388 0 7388 543895412/2/01 snow melt 1037 500 3433 16417 17954 873 560 836 1395 1363117 402224/30/02 snow melt 2062 825 1546 7731 10618 155 26 335 361 82468 31967/18/02 thunderstorm 1776 19 262 1178 2972 49 101 236 336 76634 243011/8/02 rain 76032 18078 30998 180201 274311 26534 28022 17194 45216 3909869 6373211/10/02 rain 42537 1302 6511 67278 111117 17796 25609 7379 32988 737887 468783/15/03 rain on snow 14919 398 2859 22876 38193 1927 2822 3021 5843 15540608/21/03 thunderstorm 1046 112 6236 31352 32511 51 900 3871 4771 136314 177211/8/04 rain 6477 589 2944 33756 40822 7262 5005 12266 17271 5612967
MONITORING TOTALS 170029 24132 65380 466024 660185 61964 74824 45557 120380 24950375 174177
volume REMOVAL EFFICIENCIES BLACK VALUE INDICATES REDUCTION IN POLLUTANTreductions RED VALUE INDICATED INCREASE IN POLLUTANT
EVENT EVENT TYPE NO3-N NO2-N NH3-N TKN TN OP DP PP TP TSS Fe11/22/01 rain 11% -3% -19% 45% -22% -18% 0% 16% 45% 20% -81%11/24/01 rain 23% 15% 1% 38% 31% 28% 2% 10% 100% 55% -28%12/2/01 snow melt 22% 42% 16% 68% 47% 46% 18% 64% 22% 47% 88% 78%4/30/02 snow melt 23% 21% -92% 61% 32% 24% -57% 23% -30% -26% 95% 91%7/18/02 thunderstorm 82% -94% 84% 96% 95% 86% 96% 95% 97% 97% 99% 99%11/8/02 rain 21% -7% -41% 15% 17% 8% 21% 22% 25% 23% 26% 14%11/10/02 rain 24% 23% 24% 34% 50% 42% 11% -5% 79% 45% 91% 75%3/15/03 rain on snow 14% -60% 9% 1% 38% 12% 7% 7% 73% 59% 54%8/21/03 thunderstorm 16% 89% 7% 46% 19% 32% 73% 61% 23% 35% 89% 44%1/8/04 rain 11% -86% 11% 11% 55% 47% 49% -47% 66% 56% 63%
NO3-N NO2-N NH3-N TKN TN OP DP PP TP TSS FeSTORMFILTER PERFORMANCEaverage removal -6 ± 58% 0 ± 46% 42 ± 29% 36 ± 30 % 31 ± 28 % 22 ± 42 % 25 ± 40 % 50 ± 41 % 41 ± 32 % 50 ± 61 % 67 ± 32 %
PROJECT EFFICIENCY 2% -32% 37% 32% 25% 22% 12% 65% 44% 60% 76%
2 with first 2 events removed PROJECT EFFICIENCY 2 1% -34% 36% 36% 27% 24% 12% 63% 44% 76% 76%Project Efficiency: treatment efficiency for sum of all inflow and outflow loads over monitoring duration