Embed Size (px)
Citation preview
`
DRAINAGE STUDY
PHASE 2 – ALTERNATIVE IMPROVEMENTS
CRYSTAL LAKE
ALTERNATIVE 4C IMPROVEMENTS
FOR:
LAKEWOOD – PIRATELAND SWASH HORRY COUNTY, SC
APPENDIX A
J-23453.0001
Prepared by:
Savannah, GA | Charleston, SC | Myrtle Beach, SC | Brunswick, GA | Wilmington, NC
REPORT OF GEOTECHNICAL EXPLORATION
Crystal Lake Modifications
Horry County, South Carolina S&ME Project No. 1633-13-127
Prepared For:
Thomas & Hutton Post Office Box 1522
Mount Pleasant, South Carolina 29465
Prepared By:
1330 Highway 501 Business Conway, South Carolina 29526
May 16, 2013
May 16, 2013 Thomas & Hutton Post Office Box 1522 Mount Pleasant, South Carolina 29465 Attention: Mr. Rick Karkowski, P.E. Reference: Report for Geotechnical Exploration Crystal Lake Modifications
Horry County, South Carolina S&ME Project No. 1633-13-127 Dear Mr. Karkowski: S&ME, Inc. is pleased to submit this report of soil test boring results for the referenced site. The exploration was performed to evaluate subsurface conditions surrounding Crystal Lake, and was performed in general accordance with S&ME Proposal number 1633-0357-12.r1, dated January 4, 2013, and authorized on April 15, 2013 via email correspondence. This report presents a brief discussion of our understanding of the project and the results of our exploration.
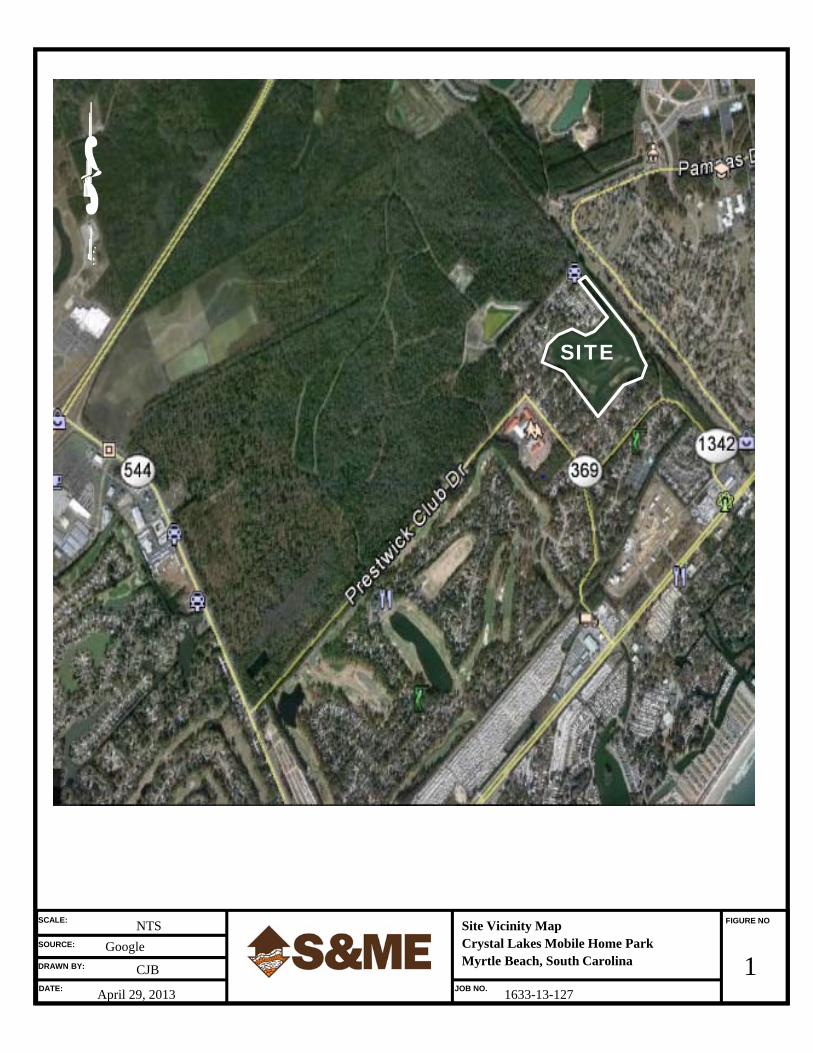
PROJECT INFORMATION AND SITE DESCRIPTION Crystal Lake is an existing lake of approximately 39.46 acres in area, located within a residential area of Horry County, near Surfside Beach, South Carolina. We understand that modifications to the lake and related drainage features are under consideration by Horry County, in order to improve stormwater drainage in the local area. The modifications may include dredging and/or excavation of the existing lake and altering the lake normal water level (NWL) by design and construction of replacement downstream control structures. Although design is in the preliminary stages at this time, we understand that the existing lake NWL will likely be lowered about 4.4 feet, and that the post-construction lake bottom will be about 6 feet below the new NWL. It is anticipated that dredging depths of up to about 10 feet may be required to remove existing materials beneath the lake and achieve design contours. According to the available information, Crystal Lake was created after the site was utilized as a local borrow source for residential development. It is presumed that borrow
Report of Geotechnical Exploration S&ME Project No. 1633-13-127 Crystal Lake Modifications – Horry County, South Carolina May 16, 2013
2
excavation did not extend to depths beneath the existing lake bottom surface, such that materials underlying the lake are relatively undisturbed Coastal Plain deposits, rather than fill materials placed back into an over excavated borrow area. The lake was observed to be relatively shallow, with several area grassy area sandbars observed and water depths of about 6 feet or less. A site vicinity plan of the project site is provided in the Appendix as Figure 1.
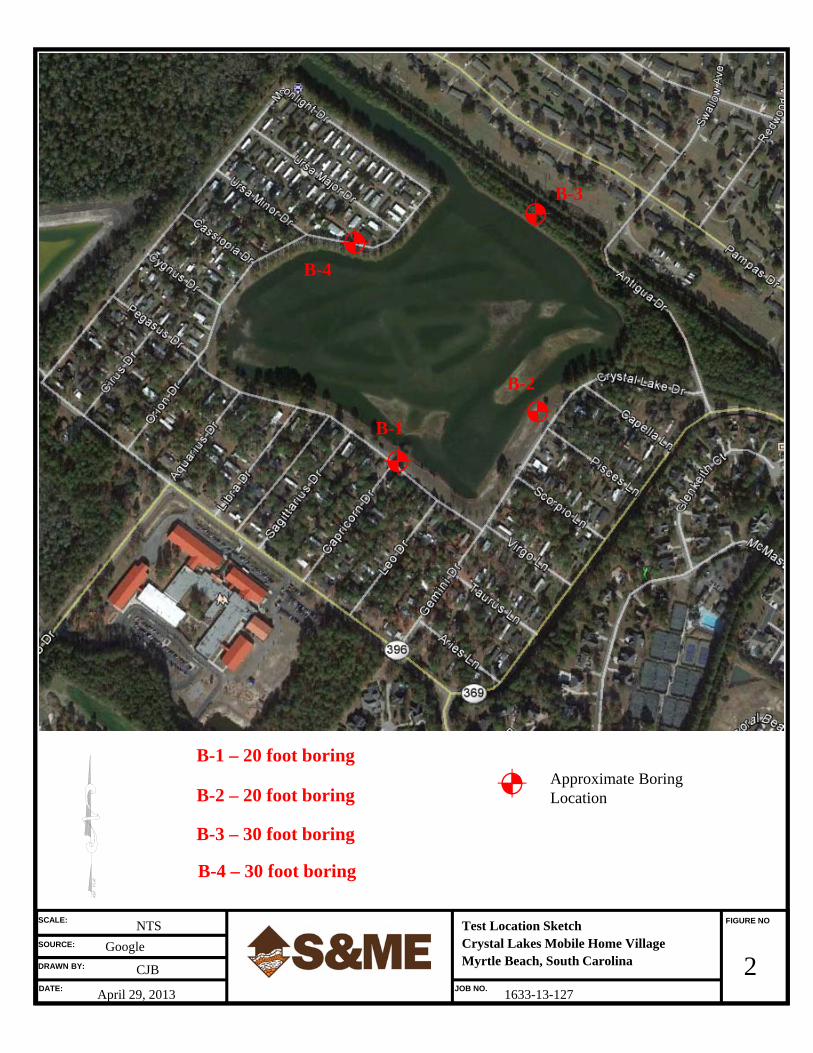
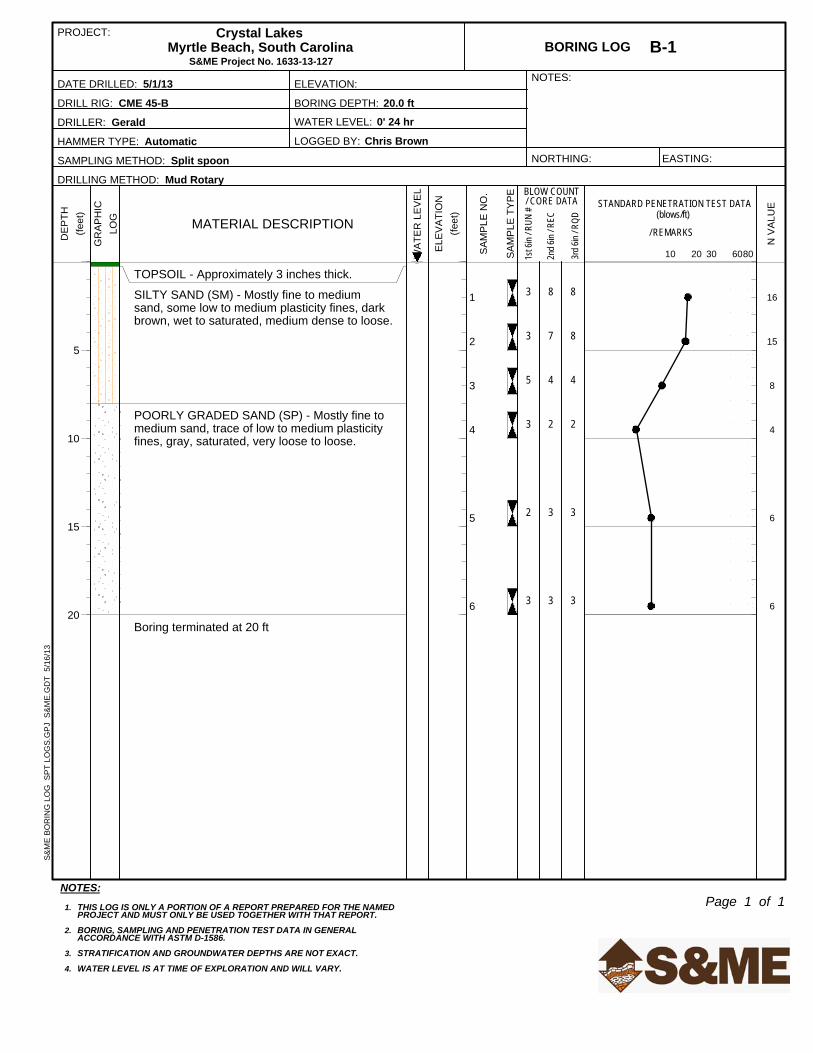
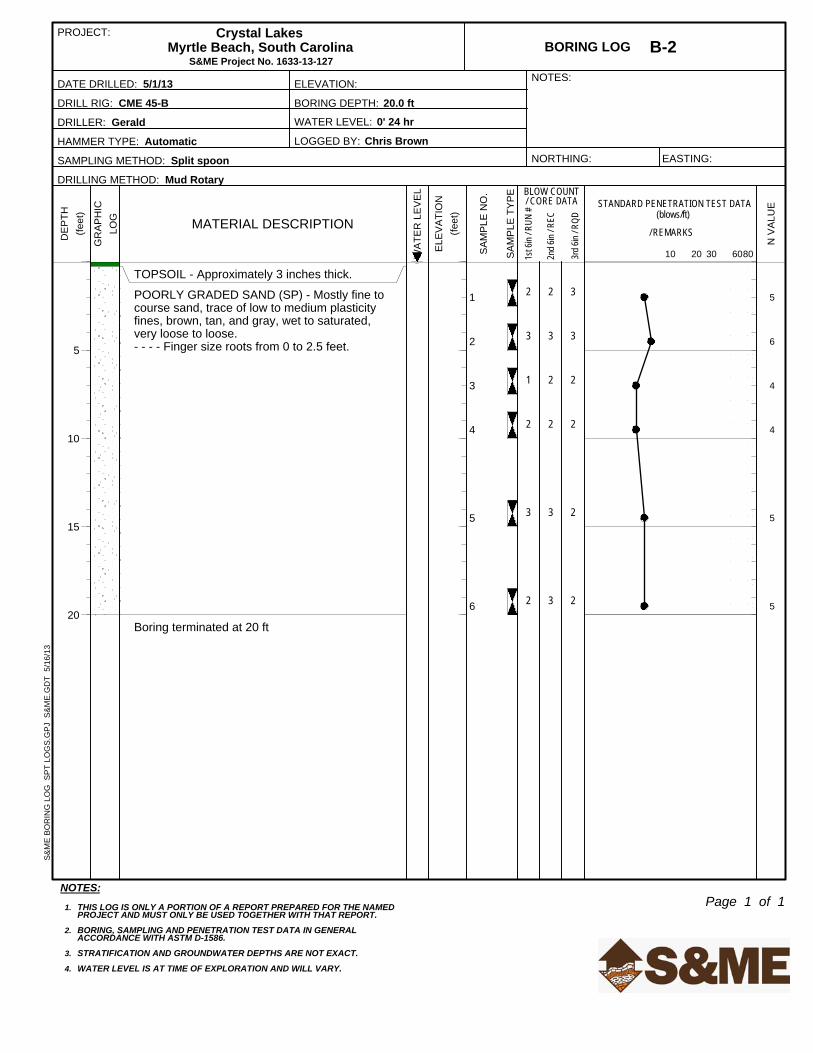
EXPLORATION PROGRAM Four soil test borings were conducted at the approximate locations shown on the Test Location Sketch in the Appendix as Figure 2. The borings were performed using a trailer drill rig. Mud rotary techniques were used to advance the boring to the termination depth of 20 feet for B-1 and B-2 and 30 feet for B-3 and B-4. Standard Penetration Tests (SPT) were performed in the borings using an automatic hammer, at 2.5-foot intervals in the top 10 feet, then at 5-foot intervals thereafter, in general accordance with ASTM D 1586, to provide an index for estimating strength parameters and relative consistency of subsurface soils. Subsurface water measurements were unable to be accurately measured upon completion of drilling due to use of drilling fluids. However water level measurements were obtained approximately 24 hours after the completion of drilling of the test borings. Split-spoon samples routinely obtained from the standard penetration tests were transported to our laboratory and visually classified according to the textural nomenclature of the Unified Soil Classification System (ASTM D 2488).
SUBSURFACE CONDITIONS Detailed descriptions and stratifications are provided on the Boring Logs located in the Appendix. A brief summary of the conditions encountered at our boring locations for each proposed sign location is provided below.
Surface Conditions At boring locations B-1, B-2, and B-4 sparse grass was encountered at the surface with approximately 3 inches of topsoil. No topsoil was encountered at boring location B-3. Soil Stratification Starting from the surface at boring B-3 and underlying the 3 inches of topsoil at the remaining borings we generally encountered poorly graded sand (SP), and silty sands (SP-SM) until termination of borings. These soils consisted of mostly fine to medium sands with few to trace of low to medium plasticity fines. These soils were typically tan, brown, and gray in color, and were moist to saturated. The SPT N-value of these soils ranged from 3 to 17 blows per foot (bpf) indicating a very loose to medium dense relative density. These soils are suitable for reuse as construction materials after the soils are excavated and allowed to dry to within 3 percent of their optimum moisture contents.
Report of Geotechnical Exploration S&ME Project No. 1633-13-127 Crystal Lake Modifications – Horry County, South Carolina May 16, 2013
3
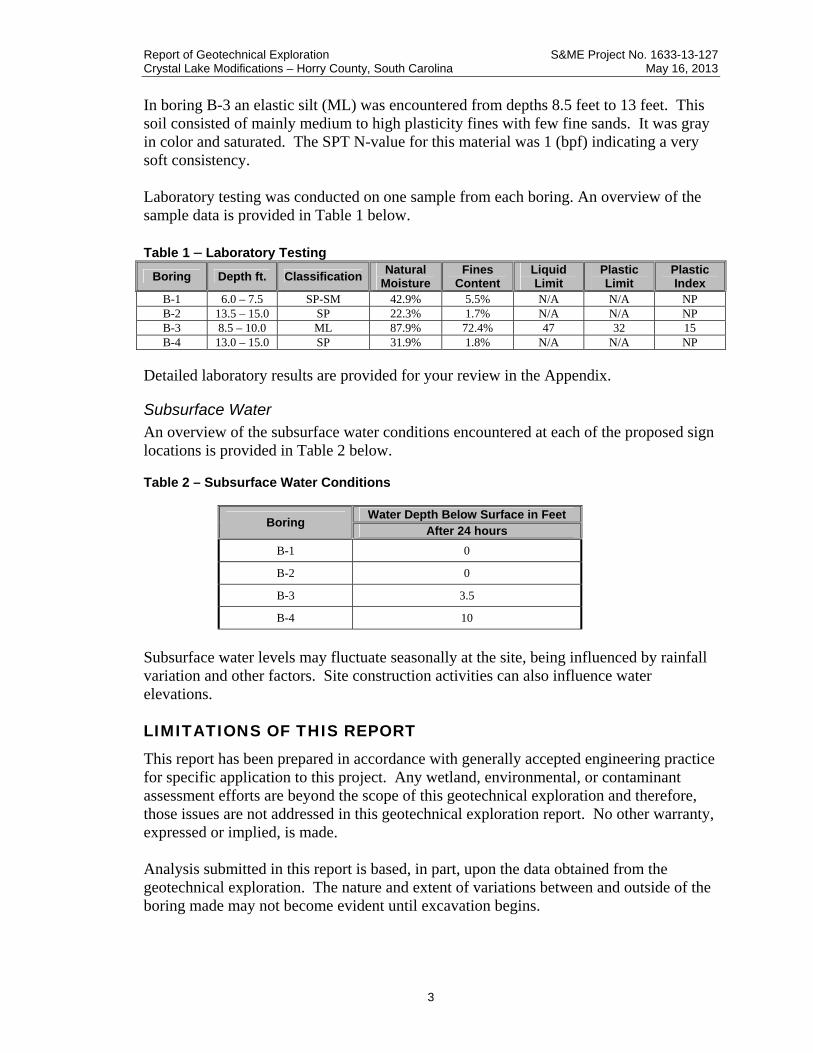
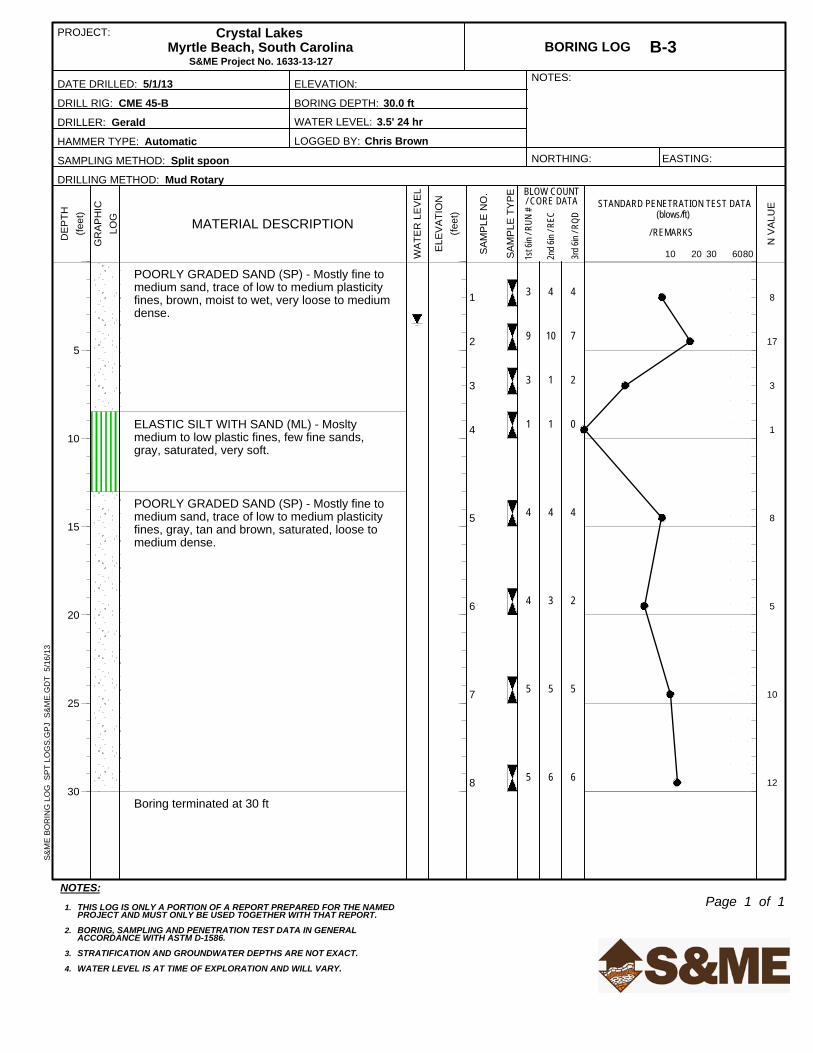
In boring B-3 an elastic silt (ML) was encountered from depths 8.5 feet to 13 feet. This soil consisted of mainly medium to high plasticity fines with few fine sands. It was gray in color and saturated. The SPT N-value for this material was 1 (bpf) indicating a very soft consistency. Laboratory testing was conducted on one sample from each boring. An overview of the sample data is provided in Table 1 below. Table 1 – Laboratory Testing
Boring Depth ft. ClassificationNatural
Moisture Fines
Content Liquid Limit
Plastic Limit
Plastic Index
B-1 6.0 – 7.5 SP-SM 42.9% 5.5% N/A N/A NP B-2 13.5 – 15.0 SP 22.3% 1.7% N/A N/A NP B-3 8.5 – 10.0 ML 87.9% 72.4% 47 32 15 B-4 13.0 – 15.0 SP 31.9% 1.8% N/A N/A NP
Detailed laboratory results are provided for your review in the Appendix.
Subsurface Water An overview of the subsurface water conditions encountered at each of the proposed sign locations is provided in Table 2 below. Table 2 – Subsurface Water Conditions
Boring Water Depth Below Surface in Feet
After 24 hours
B-1 0
B-2 0
B-3 3.5
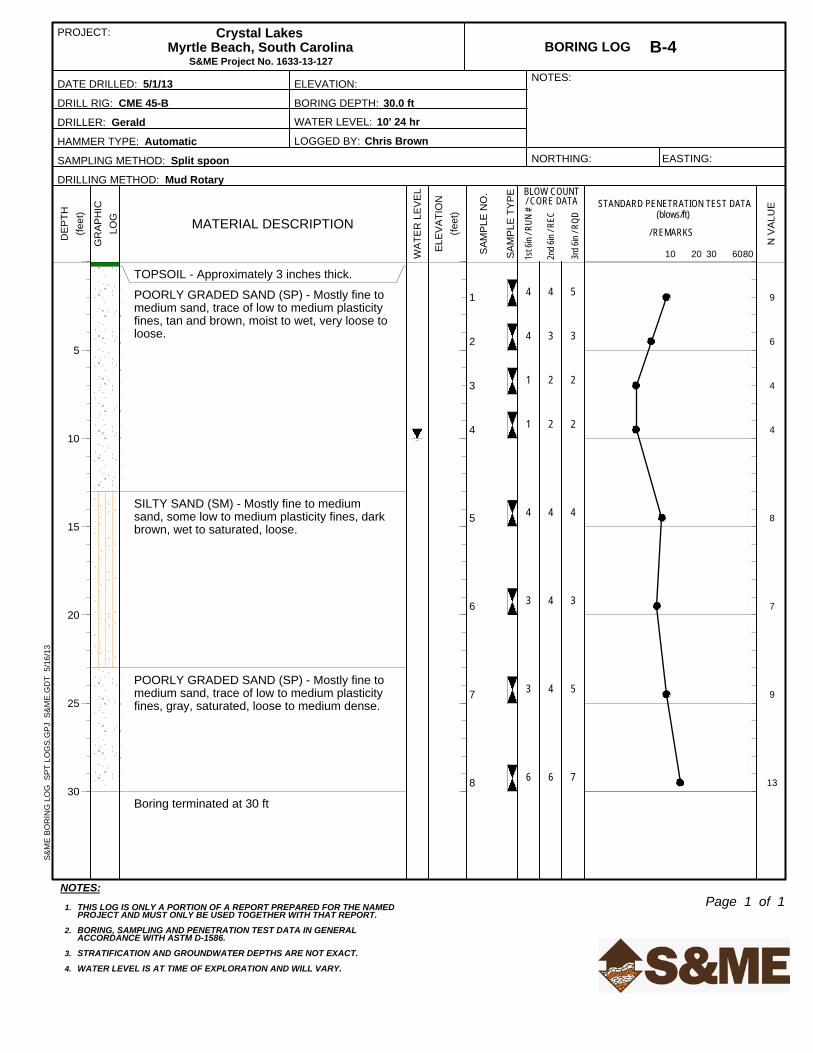
B-4 10
Subsurface water levels may fluctuate seasonally at the site, being influenced by rainfall variation and other factors. Site construction activities can also influence water elevations.
LIMITATIONS OF THIS REPORT This report has been prepared in accordance with generally accepted engineering practice for specific application to this project. Any wetland, environmental, or contaminant assessment efforts are beyond the scope of this geotechnical exploration and therefore, those issues are not addressed in this geotechnical exploration report. No other warranty, expressed or implied, is made. Analysis submitted in this report is based, in part, upon the data obtained from the geotechnical exploration. The nature and extent of variations between and outside of the boring made may not become evident until excavation begins.

APPENDIX
SITE VICINITY PLAN
TEST LOCATION SKETCH
SUMMARY OF EXPLORATION PROCEDURES
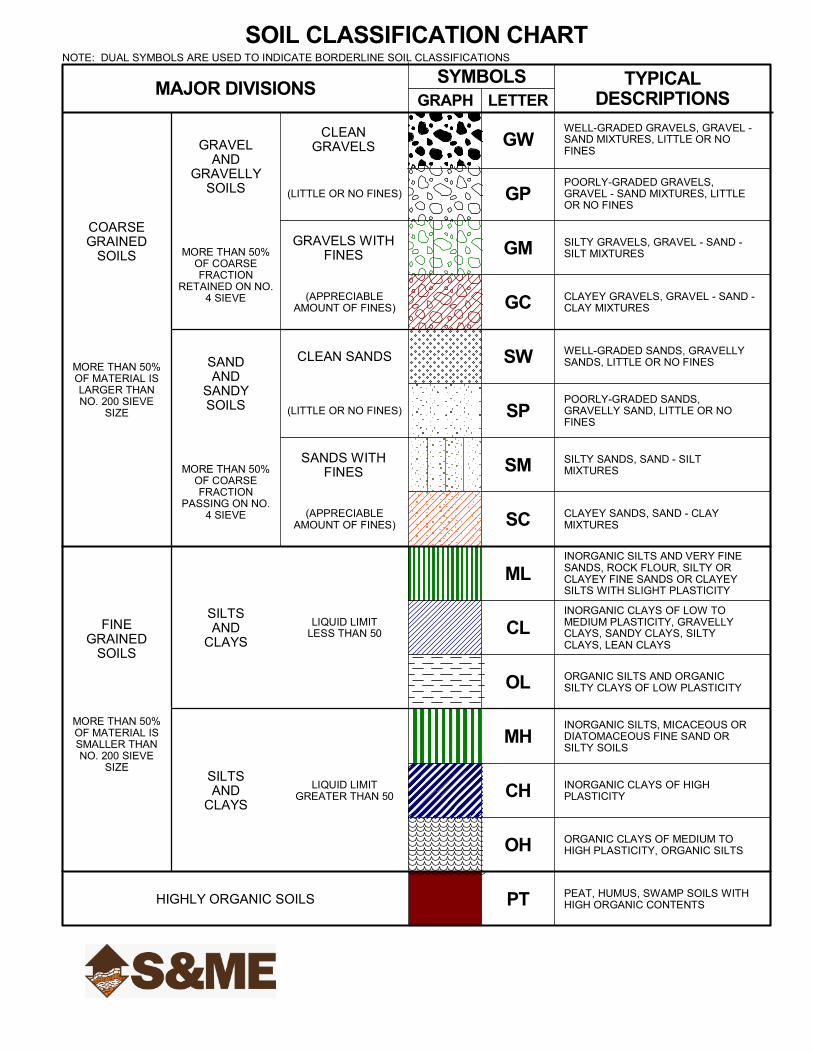
SOIL CLASSIFICATION CHART
SOIL TEST BORING LOGS
LABORATORY TEST RESULTS
SCALE:
SOURCE:
DRAWN BY:
DATE: JOB NO.
FIGURE NO
1
NTS
CJB
April 29, 2013
Site Vicinity Map
Myrtle Beach, South CarolinaCrystal Lakes Mobile Home ParkGoogle
1633-13-127
SITE
SCALE:
SOURCE:
DRAWN BY:
DATE: JOB NO.
FIGURE NO
2
NTS
CJB
April 29, 2013
Test Location Sketch
Myrtle Beach, South CarolinaCrystal Lakes Mobile Home VillageGoogle
1633-13-127
B-1
B-2
B-3
B-4
Approximate Boring Location
B-1 – 20 foot boring
B-2 – 20 foot boring
B-3 – 30 foot boring
B-4 – 30 foot boring
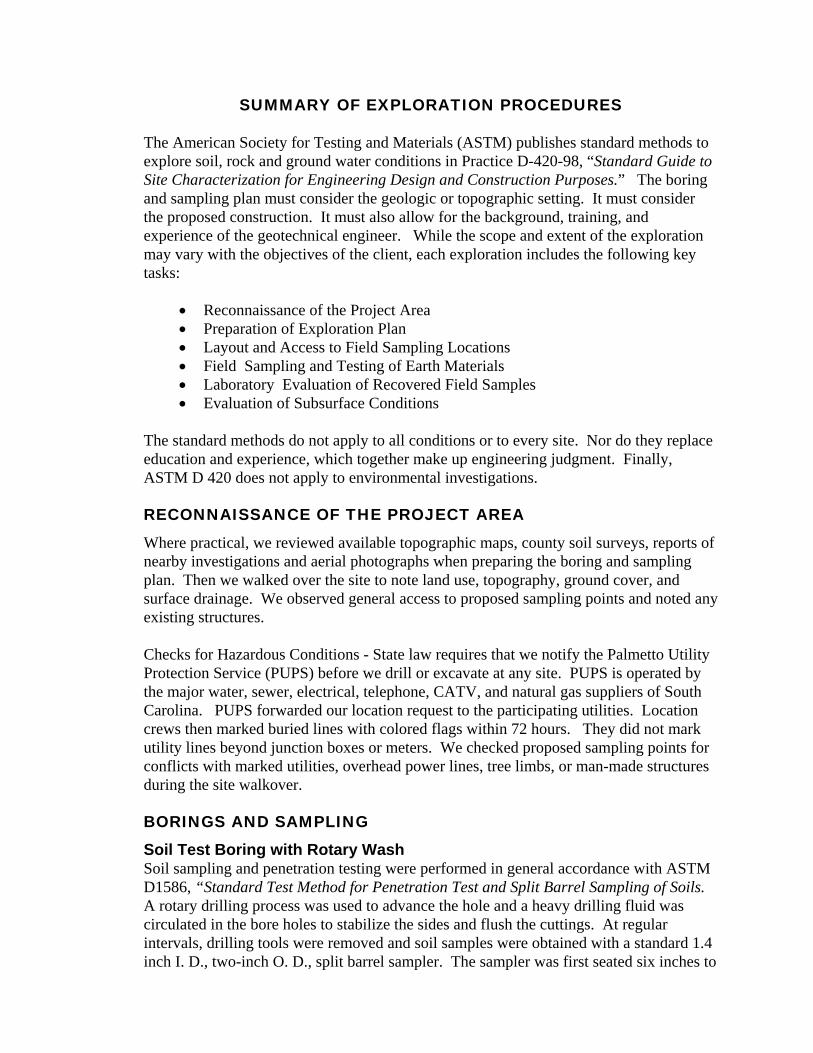
SUMMARY OF EXPLORATION PROCEDURES The American Society for Testing and Materials (ASTM) publishes standard methods to explore soil, rock and ground water conditions in Practice D-420-98, “Standard Guide to Site Characterization for Engineering Design and Construction Purposes.” The boring and sampling plan must consider the geologic or topographic setting. It must consider the proposed construction. It must also allow for the background, training, and experience of the geotechnical engineer. While the scope and extent of the exploration may vary with the objectives of the client, each exploration includes the following key tasks:
Reconnaissance of the Project Area Preparation of Exploration Plan Layout and Access to Field Sampling Locations Field Sampling and Testing of Earth Materials Laboratory Evaluation of Recovered Field Samples Evaluation of Subsurface Conditions
The standard methods do not apply to all conditions or to every site. Nor do they replace education and experience, which together make up engineering judgment. Finally, ASTM D 420 does not apply to environmental investigations.
RECONNAISSANCE OF THE PROJECT AREA
Where practical, we reviewed available topographic maps, county soil surveys, reports of nearby investigations and aerial photographs when preparing the boring and sampling plan. Then we walked over the site to note land use, topography, ground cover, and surface drainage. We observed general access to proposed sampling points and noted any existing structures. Checks for Hazardous Conditions - State law requires that we notify the Palmetto Utility Protection Service (PUPS) before we drill or excavate at any site. PUPS is operated by the major water, sewer, electrical, telephone, CATV, and natural gas suppliers of South Carolina. PUPS forwarded our location request to the participating utilities. Location crews then marked buried lines with colored flags within 72 hours. They did not mark utility lines beyond junction boxes or meters. We checked proposed sampling points for conflicts with marked utilities, overhead power lines, tree limbs, or man-made structures during the site walkover.
BORINGS AND SAMPLING
Soil Test Boring with Rotary Wash Soil sampling and penetration testing were performed in general accordance with ASTM D1586, “Standard Test Method for Penetration Test and Split Barrel Sampling of Soils. A rotary drilling process was used to advance the hole and a heavy drilling fluid was circulated in the bore holes to stabilize the sides and flush the cuttings. At regular intervals, drilling tools were removed and soil samples were obtained with a standard 1.4 inch I. D., two-inch O. D., split barrel sampler. The sampler was first seated six inches to

penetrate any loose cuttings, then driven an additional 12 inches with blows of a 140-pound hammer falling 30 inches. The number of hammer blows required to drive the sampler through the two final six inch increments was recorded as the penetration resistance (SPT N) value. The N-value, when properly interpreted by qualified professional staff, is an index of the soil strength and foundation support capability. Subsurface Water Level Determination Subsurface water levels in the borings were measured during the onsite exploration by measuring depths from the existing grade to the current water level using a tape.
SUMMARY OF LABORATORY TESTING PROCEDURES
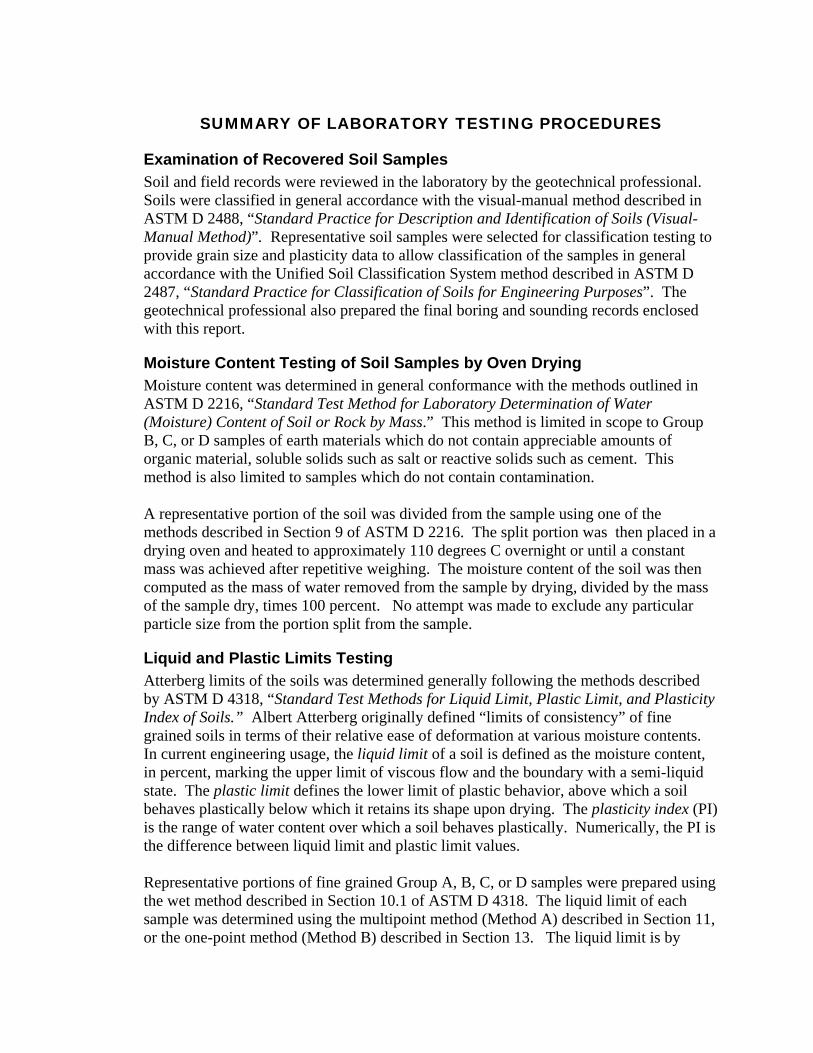
Examination of Recovered Soil Samples Soil and field records were reviewed in the laboratory by the geotechnical professional. Soils were classified in general accordance with the visual-manual method described in ASTM D 2488, “Standard Practice for Description and Identification of Soils (Visual-Manual Method)”. Representative soil samples were selected for classification testing to provide grain size and plasticity data to allow classification of the samples in general accordance with the Unified Soil Classification System method described in ASTM D 2487, “Standard Practice for Classification of Soils for Engineering Purposes”. The geotechnical professional also prepared the final boring and sounding records enclosed with this report.
Moisture Content Testing of Soil Samples by Oven Drying Moisture content was determined in general conformance with the methods outlined in ASTM D 2216, “Standard Test Method for Laboratory Determination of Water (Moisture) Content of Soil or Rock by Mass.” This method is limited in scope to Group B, C, or D samples of earth materials which do not contain appreciable amounts of organic material, soluble solids such as salt or reactive solids such as cement. This method is also limited to samples which do not contain contamination. A representative portion of the soil was divided from the sample using one of the methods described in Section 9 of ASTM D 2216. The split portion was then placed in a drying oven and heated to approximately 110 degrees C overnight or until a constant mass was achieved after repetitive weighing. The moisture content of the soil was then computed as the mass of water removed from the sample by drying, divided by the mass of the sample dry, times 100 percent. No attempt was made to exclude any particular particle size from the portion split from the sample.
Liquid and Plastic Limits Testing Atterberg limits of the soils was determined generally following the methods described by ASTM D 4318, “Standard Test Methods for Liquid Limit, Plastic Limit, and Plasticity Index of Soils.” Albert Atterberg originally defined “limits of consistency” of fine grained soils in terms of their relative ease of deformation at various moisture contents. In current engineering usage, the liquid limit of a soil is defined as the moisture content, in percent, marking the upper limit of viscous flow and the boundary with a semi-liquid state. The plastic limit defines the lower limit of plastic behavior, above which a soil behaves plastically below which it retains its shape upon drying. The plasticity index (PI) is the range of water content over which a soil behaves plastically. Numerically, the PI is the difference between liquid limit and plastic limit values. Representative portions of fine grained Group A, B, C, or D samples were prepared using the wet method described in Section 10.1 of ASTM D 4318. The liquid limit of each sample was determined using the multipoint method (Method A) described in Section 11, or the one-point method (Method B) described in Section 13. The liquid limit is by
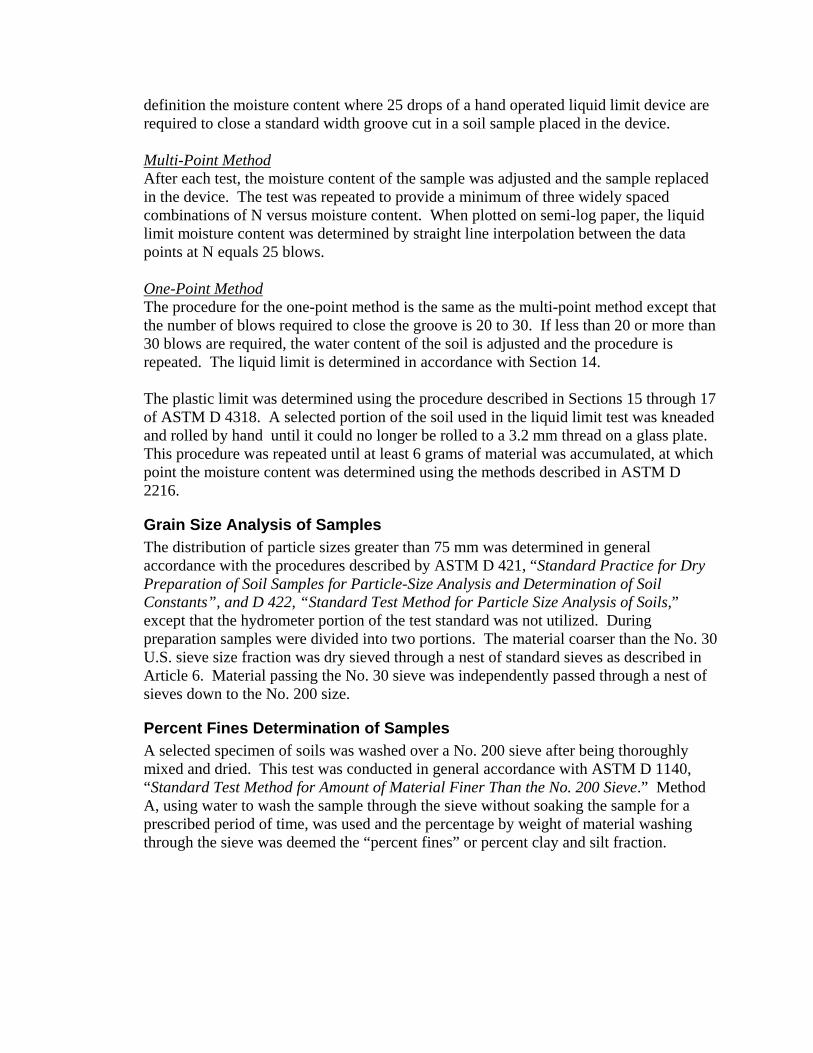
definition the moisture content where 25 drops of a hand operated liquid limit device are required to close a standard width groove cut in a soil sample placed in the device. Multi-Point Method After each test, the moisture content of the sample was adjusted and the sample replaced in the device. The test was repeated to provide a minimum of three widely spaced combinations of N versus moisture content. When plotted on semi-log paper, the liquid limit moisture content was determined by straight line interpolation between the data points at N equals 25 blows. One-Point Method The procedure for the one-point method is the same as the multi-point method except that the number of blows required to close the groove is 20 to 30. If less than 20 or more than 30 blows are required, the water content of the soil is adjusted and the procedure is repeated. The liquid limit is determined in accordance with Section 14. The plastic limit was determined using the procedure described in Sections 15 through 17 of ASTM D 4318. A selected portion of the soil used in the liquid limit test was kneaded and rolled by hand until it could no longer be rolled to a 3.2 mm thread on a glass plate. This procedure was repeated until at least 6 grams of material was accumulated, at which point the moisture content was determined using the methods described in ASTM D 2216.
Grain Size Analysis of Samples The distribution of particle sizes greater than 75 mm was determined in general accordance with the procedures described by ASTM D 421, “Standard Practice for Dry Preparation of Soil Samples for Particle-Size Analysis and Determination of Soil Constants”, and D 422, “Standard Test Method for Particle Size Analysis of Soils,” except that the hydrometer portion of the test standard was not utilized. During preparation samples were divided into two portions. The material coarser than the No. 30 U.S. sieve size fraction was dry sieved through a nest of standard sieves as described in Article 6. Material passing the No. 30 sieve was independently passed through a nest of sieves down to the No. 200 size.
Percent Fines Determination of Samples A selected specimen of soils was washed over a No. 200 sieve after being thoroughly mixed and dried. This test was conducted in general accordance with ASTM D 1140, “Standard Test Method for Amount of Material Finer Than the No. 200 Sieve.” Method A, using water to wash the sample through the sieve without soaking the sample for a prescribed period of time, was used and the percentage by weight of material washing through the sieve was deemed the “percent fines” or percent clay and silt fraction.
CLAYEY GRAVELS, GRAVEL - SAND -CLAY MIXTURES
WELL-GRADED SANDS, GRAVELLYSANDS, LITTLE OR NO FINES
POORLY-GRADED SANDS,GRAVELLY SAND, LITTLE OR NOFINES
SILTY SANDS, SAND - SILTMIXTURES
CLAYEY SANDS, SAND - CLAYMIXTURES
INORGANIC SILTS AND VERY FINESANDS, ROCK FLOUR, SILTY ORCLAYEY FINE SANDS OR CLAYEYSILTS WITH SLIGHT PLASTICITY
SYMBOLS
SANDAND
SANDYSOILS
GRAPH
INORGANIC CLAYS OF LOW TOMEDIUM PLASTICITY, GRAVELLYCLAYS, SANDY CLAYS, SILTYCLAYS, LEAN CLAYS
ORGANIC SILTS AND ORGANICSILTY CLAYS OF LOW PLASTICITY
INORGANIC SILTS, MICACEOUS ORDIATOMACEOUS FINE SAND ORSILTY SOILS
MH
OL
CL
ML
SC
SM
SP
COARSEGRAINED
SOILS
TYPICALDESCRIPTIONS
POORLY-GRADED GRAVELS,GRAVEL - SAND MIXTURES, LITTLEOR NO FINES
SILTY GRAVELS, GRAVEL - SAND -SILT MIXTURES
SOIL CLASSIFICATION CHART
GC
GM
GP
SW
CLEANGRAVELS
ORGANIC CLAYS OF MEDIUM TOHIGH PLASTICITY, ORGANIC SILTS
PEAT, HUMUS, SWAMP SOILS WITHHIGH ORGANIC CONTENTS
GRAVELS WITHFINES
CLEAN SANDS
(LITTLE OR NO FINES)
SANDS WITHFINES
LIQUID LIMITLESS THAN 50
LIQUID LIMITGREATER THAN 50
HIGHLY ORGANIC SOILS
GRAVELAND
GRAVELLYSOILS
(APPRECIABLEAMOUNT OF FINES)
(APPRECIABLEAMOUNT OF FINES)
(LITTLE OR NO FINES)
FINEGRAINED
SOILS
SILTSAND
CLAYS
INORGANIC CLAYS OF HIGHPLASTICITY
WELL-GRADED GRAVELS, GRAVEL -SAND MIXTURES, LITTLE OR NOFINES
SILTSAND
CLAYS
MORE THAN 50%OF MATERIAL ISLARGER THANNO. 200 SIEVE
SIZE
MORE THAN 50%OF MATERIAL ISSMALLER THANNO. 200 SIEVE
SIZE
LETTER
MORE THAN 50%OF COARSEFRACTION
PASSING ON NO.4 SIEVE
MORE THAN 50%OF COARSEFRACTION
RETAINED ON NO.4 SIEVE
NOTE: DUAL SYMBOLS ARE USED TO INDICATE BORDERLINE SOIL CLASSIFICATIONS
GW
MAJOR DIVISIONS
PT
OH
CH
3
3
5
3
2
3
8
8
4
2
3
3
16
15
8
4
6
6
8
7
4
2
3
3
1
2
3
4
5
6
TOPSOIL - Approximately 3 inches thick.
SILTY SAND (SM) - Mostly fine to mediumsand, some low to medium plasticity fines, darkbrown, wet to saturated, medium dense to loose.
POORLY GRADED SAND (SP) - Mostly fine tomedium sand, trace of low to medium plasticityfines, gray, saturated, very loose to loose.
Boring terminated at 20 ft
THIS LOG IS ONLY A PORTION OF A REPORT PREPARED FOR THE NAMEDPROJECT AND MUST ONLY BE USED TOGETHER WITH THAT REPORT.
BORING, SAMPLING AND PENETRATION TEST DATA IN GENERALACCORDANCE WITH ASTM D-1586.
STRATIFICATION AND GROUNDWATER DEPTHS ARE NOT EXACT.
WATER LEVEL IS AT TIME OF EXPLORATION AND WILL VARY.
1.
2.
3.
4.
PROJECT:
B-1
EASTING:
BORING DEPTH: 20.0 ft
LOGGED BY: Chris Brown
3rd
6in
/ RQ
D
GR
AP
HIC
LO
G
N V
AL
UE
DE
PT
H
(fee
t)
Page 1 of 1NOTES:
2nd
6in
/ REC
DATE DRILLED: 5/1/13
DRILL RIG: CME 45-B
DRILLER: Gerald
HAMMER TYPE: Automatic
SAMPLING METHOD: Split spoon
DRILLING METHOD: Mud Rotary
5
10
15
20
MATERIAL DESCRIPTION
BORING LOG
NOTES:
S&ME Project No. 1633-13-127
Crystal LakesMyrtle Beach, South Carolina
NORTHING:
ELEVATION:
WATER LEVEL: 0' 24 hr
REMARKS
1st 6
in /
RU
N #
EL
EV
AT
ION
(fee
t)
WA
TE
R L
EV
EL
SA
MP
LE
NO
.
SA
MP
LE
TY
PE BLOW COUNT
/ CORE DATA
S&
ME
BO
RIN
G L
OG
S
PT
LO
GS
.GP
J S
&M
E.G
DT
5/
16/1
3
8060302010
/
STANDARD PENETRATION TEST DATA(blows/ft)
2
3
1
2
3
2
3
3
2
2
2
2
5
6
4
4
5
5
2
3
2
2
3
3
1
2
3
4
5
6
TOPSOIL - Approximately 3 inches thick.
POORLY GRADED SAND (SP) - Mostly fine tocourse sand, trace of low to medium plasticityfines, brown, tan, and gray, wet to saturated,very loose to loose.- - - - Finger size roots from 0 to 2.5 feet.
Boring terminated at 20 ft
THIS LOG IS ONLY A PORTION OF A REPORT PREPARED FOR THE NAMEDPROJECT AND MUST ONLY BE USED TOGETHER WITH THAT REPORT.
BORING, SAMPLING AND PENETRATION TEST DATA IN GENERALACCORDANCE WITH ASTM D-1586.
STRATIFICATION AND GROUNDWATER DEPTHS ARE NOT EXACT.
WATER LEVEL IS AT TIME OF EXPLORATION AND WILL VARY.
1.
2.
3.
4.
PROJECT:
B-2
EASTING:
BORING DEPTH: 20.0 ft
LOGGED BY: Chris Brown
3rd
6in
/ RQ
D
GR
AP
HIC
LO
G
N V
AL
UE
DE
PT
H
(fee
t)
Page 1 of 1NOTES:
2nd
6in
/ REC
DATE DRILLED: 5/1/13
DRILL RIG: CME 45-B
DRILLER: Gerald
HAMMER TYPE: Automatic
SAMPLING METHOD: Split spoon
DRILLING METHOD: Mud Rotary
5
10
15
20
MATERIAL DESCRIPTION
BORING LOG
NOTES:
S&ME Project No. 1633-13-127
Crystal LakesMyrtle Beach, South Carolina
NORTHING:
ELEVATION:
WATER LEVEL: 0' 24 hr
REMARKS
1st 6
in /
RU
N #
EL
EV
AT
ION
(fee
t)
WA
TE
R L
EV
EL
SA
MP
LE
NO
.
SA
MP
LE
TY
PE BLOW COUNT
/ CORE DATA
S&
ME
BO
RIN
G L
OG
S
PT
LO
GS
.GP
J S
&M
E.G
DT
5/
16/1
3
8060302010
/
STANDARD PENETRATION TEST DATA(blows/ft)
3
9
3
1
4
4
5
5
4
7
2
0
4
2
5
6
8
17
3
1
8
5
10
12
4
10
1
1
4
3
5
6
1
2
3
4
5
6
7
8
POORLY GRADED SAND (SP) - Mostly fine tomedium sand, trace of low to medium plasticityfines, brown, moist to wet, very loose to mediumdense.
ELASTIC SILT WITH SAND (ML) - Mosltymedium to low plastic fines, few fine sands,gray, saturated, very soft.
POORLY GRADED SAND (SP) - Mostly fine tomedium sand, trace of low to medium plasticityfines, gray, tan and brown, saturated, loose tomedium dense.
Boring terminated at 30 ft
THIS LOG IS ONLY A PORTION OF A REPORT PREPARED FOR THE NAMEDPROJECT AND MUST ONLY BE USED TOGETHER WITH THAT REPORT.
BORING, SAMPLING AND PENETRATION TEST DATA IN GENERALACCORDANCE WITH ASTM D-1586.
STRATIFICATION AND GROUNDWATER DEPTHS ARE NOT EXACT.
WATER LEVEL IS AT TIME OF EXPLORATION AND WILL VARY.
1.
2.
3.
4.
PROJECT:
B-3
EASTING:
BORING DEPTH: 30.0 ft
LOGGED BY: Chris Brown
3rd
6in
/ RQ
D
GR
AP
HIC
LO
G
N V
AL
UE
DE
PT
H
(fee
t)
Page 1 of 1NOTES:
2nd
6in
/ REC
DATE DRILLED: 5/1/13
DRILL RIG: CME 45-B
DRILLER: Gerald
HAMMER TYPE: Automatic
SAMPLING METHOD: Split spoon
DRILLING METHOD: Mud Rotary
5
10
15
20
25
30
MATERIAL DESCRIPTION
BORING LOG
NOTES:
S&ME Project No. 1633-13-127
Crystal LakesMyrtle Beach, South Carolina
NORTHING:
ELEVATION:
WATER LEVEL: 3.5' 24 hr
REMARKS
1st 6
in /
RU
N #
EL
EV
AT
ION
(fee
t)
WA
TE
R L
EV
EL
SA
MP
LE
NO
.
SA
MP
LE
TY
PE BLOW COUNT
/ CORE DATA
S&
ME
BO
RIN
G L
OG
S
PT
LO
GS
.GP
J S
&M
E.G
DT
5/
16/1
3
8060302010
/
STANDARD PENETRATION TEST DATA(blows/ft)
4
4
1
1
4
3
3
6
5
3
2
2
4
3
5
7
9
6
4
4
8
7
9
13
4
3
2
2
4
4
4
6
1
2
3
4
5
6
7
8
TOPSOIL - Approximately 3 inches thick.
POORLY GRADED SAND (SP) - Mostly fine tomedium sand, trace of low to medium plasticityfines, tan and brown, moist to wet, very loose toloose.
SILTY SAND (SM) - Mostly fine to mediumsand, some low to medium plasticity fines, darkbrown, wet to saturated, loose.
POORLY GRADED SAND (SP) - Mostly fine tomedium sand, trace of low to medium plasticityfines, gray, saturated, loose to medium dense.
Boring terminated at 30 ft
THIS LOG IS ONLY A PORTION OF A REPORT PREPARED FOR THE NAMEDPROJECT AND MUST ONLY BE USED TOGETHER WITH THAT REPORT.
BORING, SAMPLING AND PENETRATION TEST DATA IN GENERALACCORDANCE WITH ASTM D-1586.
STRATIFICATION AND GROUNDWATER DEPTHS ARE NOT EXACT.
WATER LEVEL IS AT TIME OF EXPLORATION AND WILL VARY.
1.
2.
3.
4.
PROJECT:
B-4
EASTING:
BORING DEPTH: 30.0 ft
LOGGED BY: Chris Brown
3rd
6in
/ RQ
D
GR
AP
HIC
LO
G
N V
AL
UE
DE
PT
H
(fee
t)
Page 1 of 1NOTES:
2nd
6in
/ REC
DATE DRILLED: 5/1/13
DRILL RIG: CME 45-B
DRILLER: Gerald
HAMMER TYPE: Automatic
SAMPLING METHOD: Split spoon
DRILLING METHOD: Mud Rotary
5
10
15
20
25
30
MATERIAL DESCRIPTION
BORING LOG
NOTES:
S&ME Project No. 1633-13-127
Crystal LakesMyrtle Beach, South Carolina
NORTHING:
ELEVATION:
WATER LEVEL: 10' 24 hr
REMARKS
1st 6
in /
RU
N #
EL
EV
AT
ION
(fee
t)
WA
TE
R L
EV
EL
SA
MP
LE
NO
.
SA
MP
LE
TY
PE BLOW COUNT
/ CORE DATA
S&
ME
BO
RIN
G L
OG
S
PT
LO
GS
.GP
J S
&M
E.G
DT
5/
16/1
3
8060302010
/
STANDARD PENETRATION TEST DATA(blows/ft)