Embed Size (px)
Citation preview

Straightforward guidance for livestock farmers to minimisepollution and benefit your business
1
Foreword
When we launched A Forward Strategy for Scottish Agriculture in 2001 we committed ourselves towork with the farming industry to develop solutions that were both good for the environment and goodfor business. In Scotland’s Bathing Waters A Strategy for Improvement we recognised the need toprotect our water environment from diffuse pollution. Tackling diffuse pollution was also highlighted asa priority in the Custodians for Change report published in June this year.
I am therefore delighted to endorse The 4 Point Plan because it is straightforward practical guidancedeveloped in partnership with the industry with the aim of tackling this important issue. Individualfarmers have contributed their own expertise to ensure that this guidance makes sense on the ground.I thank them and the others involved in putting together the plan. I am sure it will make an importantcontribution to our goal of a sustainable agricultural industry alive to its environmental responsibilities.
Ross FinnieMSP, Minister for Environment and Rural Development
For generations farmers have looked after the countryside. It is in our interest to do so. Our reputationfor managing the environment is important as it affects what consumers think of our products. Andmore people generally are becoming increasingly aware of the need for good environmentalmanagement. Our industry must respond to these twin challenges.
The complication in improving environmental performance is that the costs of doing the right thingsare bound to affect the business. I welcome this practical guide to “doing the right things” but weshould be under no illusions about the difficulty of absorbing new costs in a very hard pressedindustry.
The guide shows that there can be cost savings from better management of the nutrients in slurry andmanure. But the real issue is the cost of not doing the right things. These costs are not onlyenvironmental ones, but with our business reputation increasingly at stake, they could also pose a realthreat to the viability of our businesses.
Jim WalkerPresident, NFU Scotland
Agriculture and the environment are inseparably linked. As we all know, they depend on each other. Ofcourse, there are impacts. Over recent years many of these have been positive. Farming hasmaintained much of the natural world that we value deeply.But some impacts are negative. One of the biggest is that of diffuse pollution. This has complexcauses - the solution therefore requires action at many levels.This document outlines practical steps that farmers, crofters and contractors can take to reducefarming's contribution to diffuse pollution. Many involve only minor changes, others are designed tohave no cost or even to save money, and much of this is already being done by many farmers. But allof it shows how agriculturalists can play their part as stewards of our shared environment.
Simon PepperDirector, WWF (Scotland).
2
Introducing The Four Point PlanThe Four Point Plan contains simple guidance on how to reduce dirty water around the
farm, improve nutrient use, carry out a land risk assessment for slurry and manure and
manage your water margins. The pack has been developed with guidance from working
farmers, information from the Scottish Executive Code of Good Practice for the Prevention
of Environmental Pollution From Agricultural Activity (the PEPFAA Code) and current
scientific research to benefit your business, minimise the risk of pollution and improve
environmental standards.
Pollution – What is the problem?Pollution is both an urban and a rural issue. It can be split into point source pollution and diffuse pollution.Point source pollution can be traced to one specific outlet, e.g. the end of a pipe. Diffuse pollution is a gradual
and often unnoticed seepage of polluting material
from a number of sources into the surrounding
environment, making it harder to define, locate and
control. Individually, these discharges can be of
little significance. However, collectively each
discharge can contribute to a much bigger problem.
The quality of Scotland’s water is at risk from diffuse pollution containing nutrients and *bacteria from both
human and animal sources. Bacteria found in excreta can have far-reaching consequences for human,
livestock and wildlife health. For these reasons the agricultural sector, as well as many other industries, is now
having to take a second look at some previously accepted practices.* For the purposes of this information, 'bacteria' is used as a general term and includes parasites and viruses.
What can farmers do?Farmers already follow good agricultural practice but occasionally accidents or ongoing losses lead to the
pollution of rivers and burns by livestock slurry and manure. Following the guidance in The Four Point Plan will
demonstrate you are taking risks into account and
following good practice as highlighted in the
PEPFAA Code and the PEPFAA Do’s and Don’ts
Guide. Some quality assurance or environmental
schemes require statements on manure and slurry
handling or steps taken to reduce the risk of environmental pollution, for example points are awarded under the
Rural Stewardship Scheme (RSS) for addressing pollution issues. Following the plan will help to achieve these
requirements.
The first three sections of The Four Point Plan include calculations that can be applied to your farm. These
“Working it out” sections will help you to;
� estimate the amount of dirty water and rainwater produced around the steading and its contribution to
storage
Slurry spread on to land and washed-off by rainfall into a nearbyburn is a common example of diffuse pollution. Magnified overseveral fields, this small quantity will add to the concentration ofnutrients and bacteria downstream, potentially leading to thepollution of freshwater burns, rivers, coastal waters andgroundwater.
Nitrate Vulnerable Zones.Additional guidance is available for farmers in Nitrate VulnerableZones (NVZs). The NVZ guidelines give an in-depth description ofhow to draw up a fertiliser and manure plan to comply with theAction Programmes that apply in these areas.
3
� know the nutrient value of slurry and manure produced by housed livestock
� draw up a risk assessment for spreading manure and slurry on your land
You can use this information to review current practices, identify any financial savings and reduce pollution risk
from your farm.
Finding out moreUseful addresses and contact details are contained in Appendix 1. Your local Scottish Executive Environment
and Rural Affairs Department (SEERAD), Scottish Environment Protection Agency (SEPA), SAC (Scottish
Agricultural College), Farming and Wildlife Advisory Group (FWAG Scotland) or other agricultural adviser should
be able to assist you in finding out more about the various aspects of The Four Point Plan. Additional copies of
the plan are available via SEERAD, SAC, SEPA, NFU Scotland, SNH, FWAG Scotland and WWF (Scotland)
websites. See Appendix 1 for details.
Farm waste management planning.Having a professionally produced Farm Waste Management Plan (FWMP) for your farm may be used to justify less than sixmonths slurry storage capacity under the Control of Pollution (Silage, Slurry and Agricultural Fuel Oil (Scotland) Regulations2001. A full FWMP for the purposes of the 2001 Regulations requires more detail than is provided by the step by step advicein this plan. Guidance on how to move towards a FWMP should always be sought via a suitably accredited agriculturaladviser. More information on farm waste management planning is contained in Appendix 5 and the PEPFAA Code.
4
Minimising dirty water around the steading
Dirty water around farm buildings may seem insignificant, but it can contain valuable
nutrients and harmful bacteria from livestock manure and slurry, giving it a high polluting
potential.
What are the benefits to you and your business?Reducing dirty water around the steading can –
� Leave more space for slurry or silage effluent storage. Cutting down dirty and contaminated areas
around the steading will reduce the amount of water you have to collect and handle, saving time and costs
on storage and disposal.
� Reduce your contractor bill. Smaller amounts of slurry and dirty water require less handling.
� Reduce the risk of causing pollution from nutrients and bacteria washed down your farm drains and into
local ditches, burns and rivers or into groundwater.
Taking a closer look There are many sources of dirty water around yards and steadings. Cattle crossing yards can deposit a
significant amount of manure and slurry on yard surfaces; rainfall will wash some of these materials into drains
and ditches around the farm. Rainfall running though middens, silage clamps, feeding areas and on to dirty
yards collects nutrients and bacteria, adding to the problem of slurry and dirty water storage. Any run-off
containing faecal matter, e.g. from yards or a midden, must be collected and contained in accordance with the
Control of Pollution (Silage, Slurry and Agricultural Fuel Oil) (Scotland) Regulations 2001.
Silage effluent may not necessarily contain any faecal bacteria, but it is very acidic and highly polluting.
Applications of silage effluent to land should not exceed 25m3/ha (2225 gallons/acre) at a dilution rate of 1:1 with
water.
Use the steading dirty water audit at the end of this section to look at some of the problem areas around the
farm and possible solutions. The calculations in the “Working it out” section can identify which sources make the
biggest contributions to your storage facilities.
Recommended measures.� Keep clean and dirty water separate.
� Work out how much contaminated yard water goes into your slurry or dirty water collection systems using
the “Working it out” section; it may be much more than you think. Cutting down on this water entering your
store leaves more space for more slurry storage.
� Consider current hosing practices. More water used in hosing produces more dirty water. Where practical,
scraping down surfaces to remove solid material before hosing makes it easier and reduces the amount of
dirty water to collect and store. Using less water could increase financial savings if using a mains supply.
5
� Look at stock routes around the steading. Could these be shorter or part-roofed to minimise the
contaminated water produced, reducing the water you have to collect and handle?
� Consider roofing the midden. This could reduce the amount of water running through the midden and
therefore the amount of effluent produced.
� Consider an alternative to the midden. Using a few well-sited temporary field heaps and leaving your
midden clean and empty reduces the amount of effluent you have to collect. When choosing a location, try
to avoid sites on sandy soil or gravel to protect groundwater. Temporary field heaps should not be sited
within 10m of a field drain or watercourse or within 50m of a well, spring or borehole.
� Ensure that guttering and down pipes are fitted to buildings and are not blocked with leaves or debris.
Down pipes may be broken by stock or machinery. Replacement or repair of these is a quick and simple
job that could save you money.
� Collect and use roof rainwater. Installing a collection system and using clean rainwater for hosing down is
an excellent additional source of water, especially if you are paying for mains water.
� Maintain drinking troughs in good condition. Leaking troughs add to yard water.
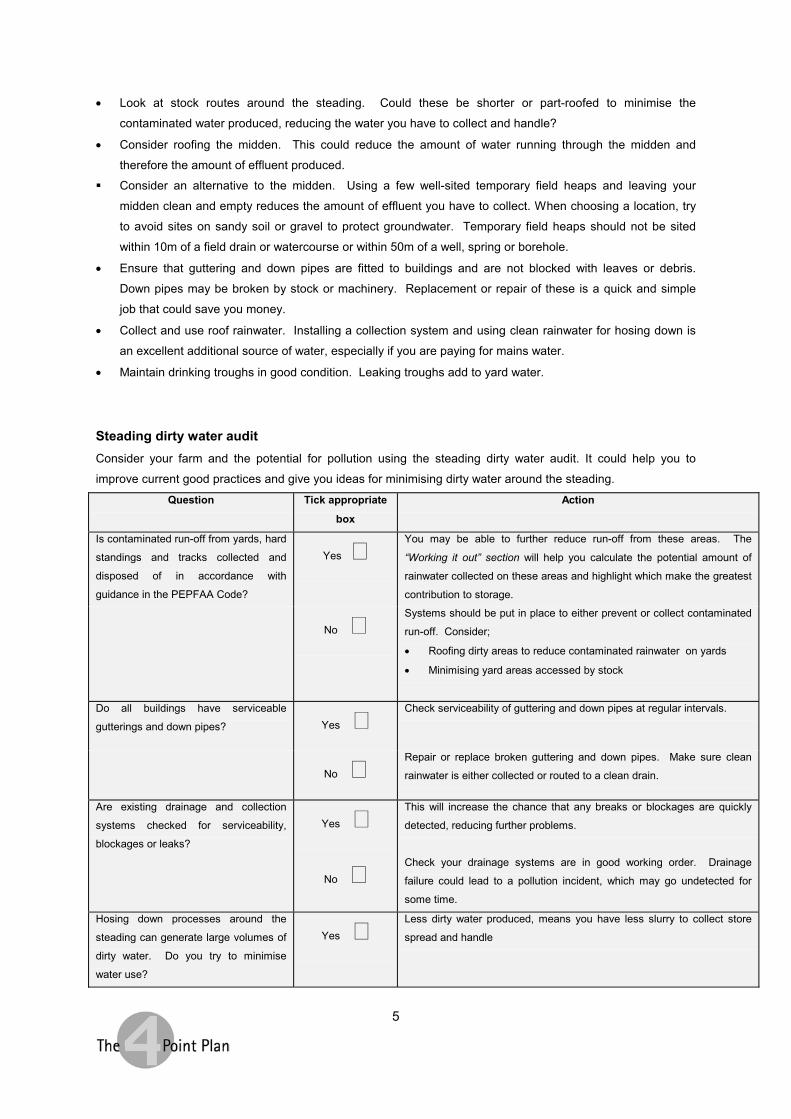
Steading dirty water auditConsider your farm and the potential for pollution using the steading dirty water audit. It could help you to
improve current good practices and give you ideas for minimising dirty water around the steading.
Question Tick appropriate
box
Action
Is contaminated run-off from yards, hard
standings and tracks collected and
disposed of in accordance with
guidance in the PEPFAA Code?
Yes � You may be able to further reduce run-off from these areas. The
“Working it out” section will help you calculate the potential amount of
rainwater collected on these areas and highlight which make the greatest
contribution to storage.
No � Systems should be put in place to either prevent or collect contaminated
run-off. Consider;
� Roofing dirty areas to reduce contaminated rainwater on yards
� Minimising yard areas accessed by stock
Do all buildings have serviceable
gutterings and down pipes? Yes � Check serviceability of guttering and down pipes at regular intervals.
No � Repair or replace broken guttering and down pipes. Make sure clean
rainwater is either collected or routed to a clean drain.
Are existing drainage and collection
systems checked for serviceability,
blockages or leaks?
Yes � This will increase the chance that any breaks or blockages are quickly
detected, reducing further problems.
No � Check your drainage systems are in good working order. Drainage
failure could lead to a pollution incident, which may go undetected for
some time.
Hosing down processes around the
steading can generate large volumes of
dirty water. Do you try to minimise
water use?
Yes � Less dirty water produced, means you have less slurry to collect store
spread and handle
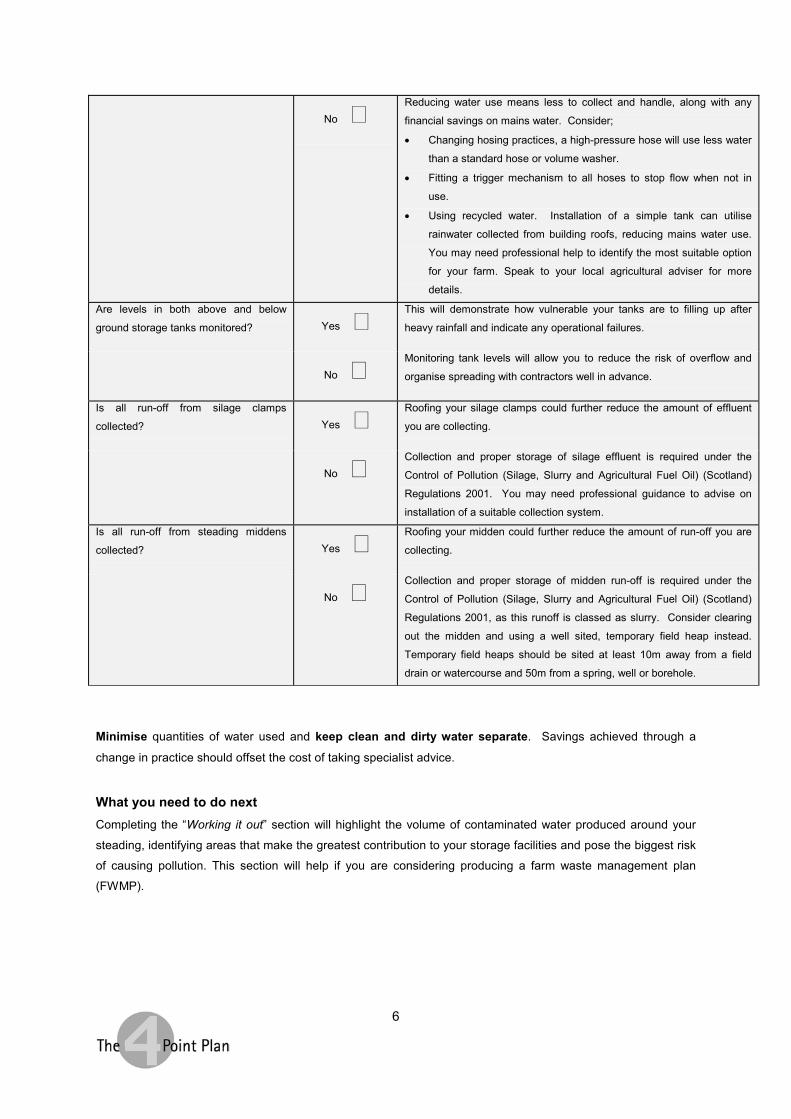
6
No � Reducing water use means less to collect and handle, along with any
financial savings on mains water. Consider;
� Changing hosing practices, a high-pressure hose will use less water
than a standard hose or volume washer.
� Fitting a trigger mechanism to all hoses to stop flow when not in
use.
� Using recycled water. Installation of a simple tank can utilise
rainwater collected from building roofs, reducing mains water use.
You may need professional help to identify the most suitable option
for your farm. Speak to your local agricultural adviser for more
details.
Are levels in both above and below
ground storage tanks monitored? Yes � This will demonstrate how vulnerable your tanks are to filling up after
heavy rainfall and indicate any operational failures.
No � Monitoring tank levels will allow you to reduce the risk of overflow and
organise spreading with contractors well in advance.
Is all run-off from silage clamps
collected? Yes � Roofing your silage clamps could further reduce the amount of effluent
you are collecting.
No � Collection and proper storage of silage effluent is required under the
Control of Pollution (Silage, Slurry and Agricultural Fuel Oil) (Scotland)
Regulations 2001. You may need professional guidance to advise on
installation of a suitable collection system.
Is all run-off from steading middens
collected? Yes � Roofing your midden could further reduce the amount of run-off you are
collecting.
No � Collection and proper storage of midden run-off is required under the
Control of Pollution (Silage, Slurry and Agricultural Fuel Oil) (Scotland)
Regulations 2001, as this runoff is classed as slurry. Consider clearing
out the midden and using a well sited, temporary field heap instead.
Temporary field heaps should be sited at least 10m away from a field
drain or watercourse and 50m from a spring, well or borehole.
Minimise quantities of water used and keep clean and dirty water separate. Savings achieved through a
change in practice should offset the cost of taking specialist advice.
What you need to do nextCompleting the “Working it out” section will highlight the volume of contaminated water produced around your
steading, identifying areas that make the greatest contribution to your storage facilities and pose the biggest risk
of causing pollution. This section will help if you are considering producing a farm waste management plan
(FWMP).
7
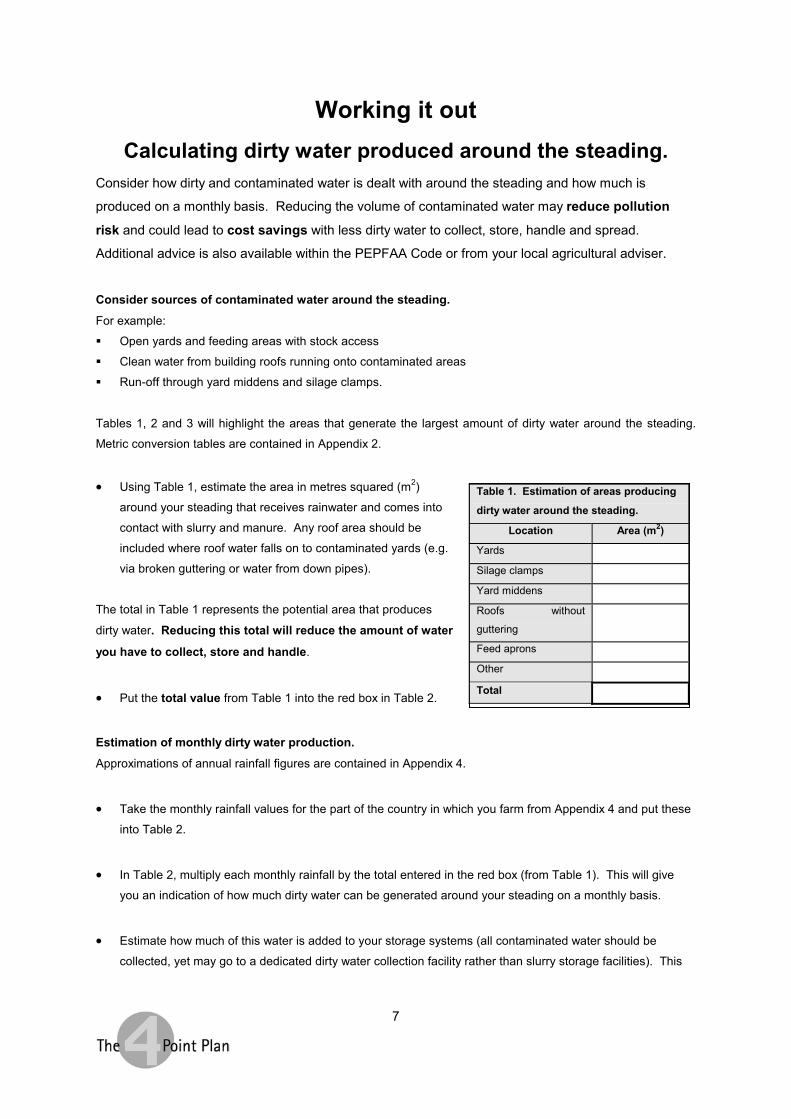
Working it outCalculating dirty water produced around the steading.
Consider how dirty and contaminated water is dealt with around the steading and how much is
produced on a monthly basis. Reducing the volume of contaminated water may reduce pollution
risk and could lead to cost savings with less dirty water to collect, store, handle and spread.
Additional advice is also available within the PEPFAA Code or from your local agricultural adviser.
Consider sources of contaminated water around the steading.For example:
� Open yards and feeding areas with stock access
� Clean water from building roofs running onto contaminated areas
� Run-off through yard middens and silage clamps.
Tables 1, 2 and 3 will highlight the areas that generate the largest amount of dirty water around the steading.
Metric conversion tables are contained in Appendix 2.
� Using Table 1, estimate the area in metres squared (m2)
around your steading that receives rainwater and comes into
contact with slurry and manure. Any roof area should be
included where roof water falls on to contaminated yards (e.g.
via broken guttering or water from down pipes).
The total in Table 1 represents the potential area that produces
dirty water. Reducing this total will reduce the amount of water
you have to collect, store and handle.
� Put the total value from Table 1 into the red box in Table 2.
Estimation of monthly dirty water production.Approximations of annual rainfall figures are contained in Appendix 4.
� Take the monthly rainfall values for the part of the country in which you farm from Appendix 4 and put these
into Table 2.
� In Table 2, multiply each monthly rainfall by the total entered in the red box (from Table 1). This will give
you an indication of how much dirty water can be generated around your steading on a monthly basis.
� Estimate how much of this water is added to your storage systems (all contaminated water should be
collected, yet may go to a dedicated dirty water collection facility rather than slurry storage facilities). This
Table 1. Estimation of areas producing
dirty water around the steading.
Location Area (m2)
Yards Silage clamps Yard middens Roofs without
guttering
Feed aprons Other Total
8
will show what contribution dirty water is making to your store on a monthly basis. You can calculate how
many extra trips to the field this could be costing you.
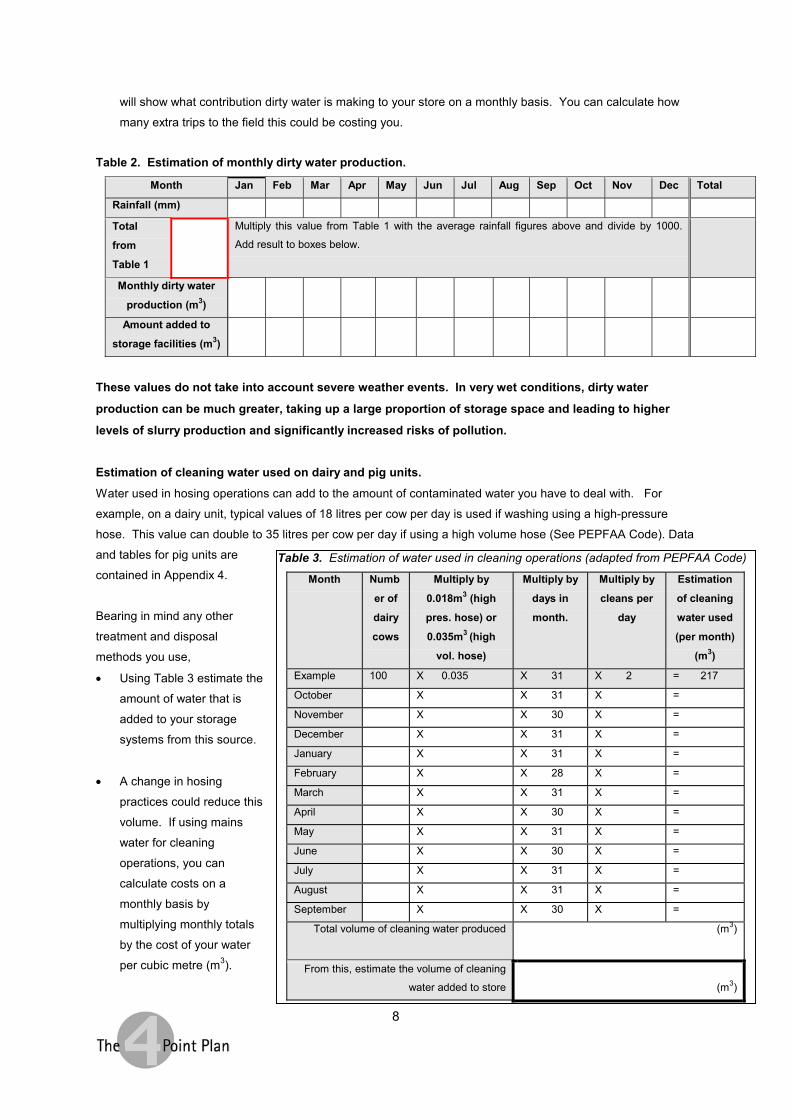
Table 2. Estimation of monthly dirty water production.
Month Jan Feb Mar Apr May Jun Jul Aug Sep Oct Nov Dec Total
Rainfall (mm)
Total
from
Table 1
Multiply this value from Table 1 with the average rainfall figures above and divide by 1000.
Add result to boxes below.
Monthly dirty water
production (m3)
Amount added to
storage facilities (m3)
These values do not take into account severe weather events. In very wet conditions, dirty water
production can be much greater, taking up a large proportion of storage space and leading to higher
levels of slurry production and significantly increased risks of pollution.
Estimation of cleaning water used on dairy and pig units.Water used in hosing operations can add to the amount of contaminated water you have to deal with. For
example, on a dairy unit, typical values of 18 litres per cow per day is used if washing using a high-pressure
hose. This value can double to 35 litres per cow per day if using a high volume hose (See PEPFAA Code). Data
and tables for pig units are
contained in Appendix 4.
Bearing in mind any other
treatment and disposal
methods you use,
� Using Table 3 estimate the
amount of water that is
added to your storage
systems from this source.
� A change in hosing
practices could reduce this
volume. If using mains
water for cleaning
operations, you can
calculate costs on a
monthly basis by
multiplying monthly totals
by the cost of your water
per cubic metre (m3).
Table 3. Estimation of water used in cleaning operations (adapted from PEPFAA Code)
Month Numb
er of
dairy
cows
Multiply by
0.018m3 (high
pres. hose) or
0.035m3 (high
vol. hose)
Multiply by
days in
month.
Multiply by
cleans per
day
Estimation
of cleaning
water used
(per month)
(m3)
Example 100 X 0.035 X 31 X 2 = 217
October X X 31 X =
November X X 30 X =
December X X 31 X =
January X X 31 X =
February X X 28 X =
March X X 31 X =
April X X 30 X =
May X X 31 X =
June X X 30 X =
July X X 31 X =
August X X 31 X =
September X X 30 X =
Total volume of cleaning water produced (m3)
From this, estimate the volume of cleaning
water added to store (m3)
9
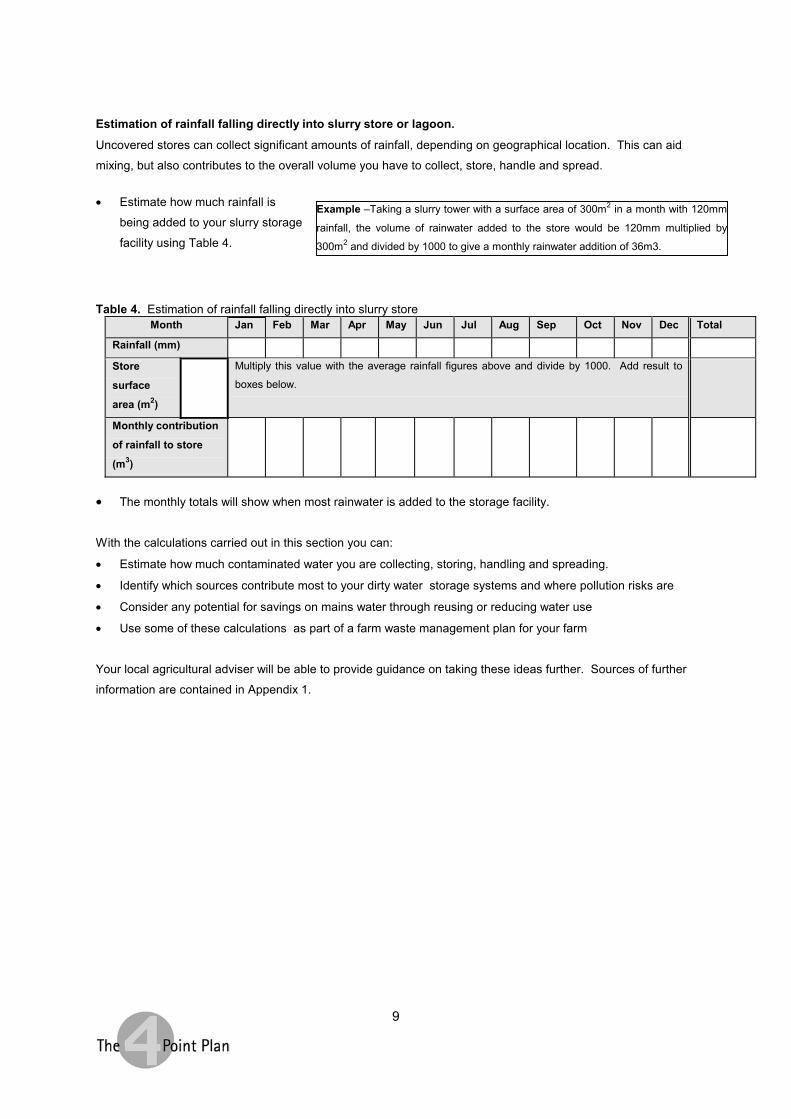
Estimation of rainfall falling directly into slurry store or lagoon.Uncovered stores can collect significant amounts of rainfall, depending on geographical location. This can aid
mixing, but also contributes to the overall volume you have to collect, store, handle and spread.
� Estimate how much rainfall is
being added to your slurry storage
facility using Table 4.
Table 4. Estimation of rainfall falling directly into slurry storeMonth Jan Feb Mar Apr May Jun Jul Aug Sep Oct Nov Dec Total
Rainfall (mm)
Store
surface
area (m2)
Multiply this value with the average rainfall figures above and divide by 1000. Add result to
boxes below.
Monthly contribution
of rainfall to store
(m3)
� The monthly totals will show when most rainwater is added to the storage facility.
With the calculations carried out in this section you can:
� Estimate how much contaminated water you are collecting, storing, handling and spreading.
� Identify which sources contribute most to your dirty water storage systems and where pollution risks are
� Consider any potential for savings on mains water through reusing or reducing water use
� Use some of these calculations as part of a farm waste management plan for your farm
Your local agricultural adviser will be able to provide guidance on taking these ideas further. Sources of further
information are contained in Appendix 1.
Example –Taking a slurry tower with a surface area of 300m2 in a month with 120mm
rainfall, the volume of rainwater added to the store would be 120mm multiplied by
300m2 and divided by 1000 to give a monthly rainwater addition of 36m3.
10
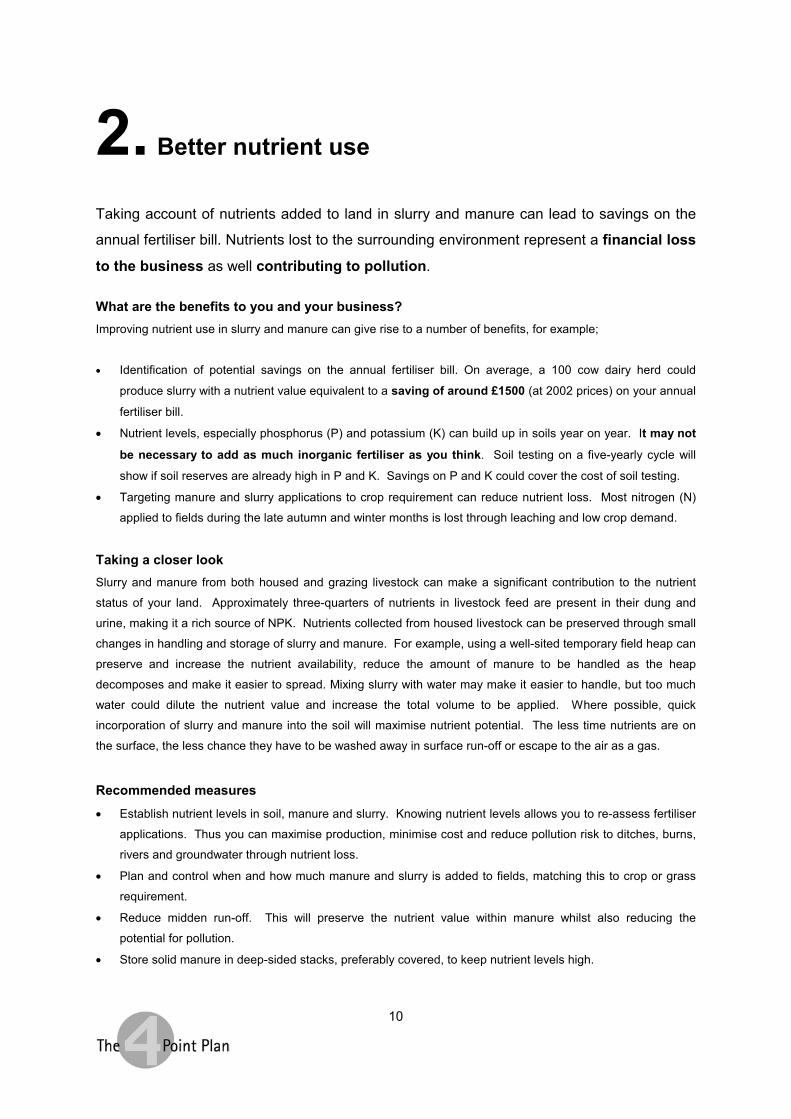
Better nutrient use
Taking account of nutrients added to land in slurry and manure can lead to savings on the
annual fertiliser bill. Nutrients lost to the surrounding environment represent a financial loss
to the business as well contributing to pollution.
What are the benefits to you and your business?Improving nutrient use in slurry and manure can give rise to a number of benefits, for example;
� Identification of potential savings on the annual fertiliser bill. On average, a 100 cow dairy herd could
produce slurry with a nutrient value equivalent to a saving of around £1500 (at 2002 prices) on your annual
fertiliser bill.
� Nutrient levels, especially phosphorus (P) and potassium (K) can build up in soils year on year. It may not
be necessary to add as much inorganic fertiliser as you think. Soil testing on a five-yearly cycle will
show if soil reserves are already high in P and K. Savings on P and K could cover the cost of soil testing.
� Targeting manure and slurry applications to crop requirement can reduce nutrient loss. Most nitrogen (N)
applied to fields during the late autumn and winter months is lost through leaching and low crop demand.
Taking a closer lookSlurry and manure from both housed and grazing livestock can make a significant contribution to the nutrient
status of your land. Approximately three-quarters of nutrients in livestock feed are present in their dung and
urine, making it a rich source of NPK. Nutrients collected from housed livestock can be preserved through small
changes in handling and storage of slurry and manure. For example, using a well-sited temporary field heap can
preserve and increase the nutrient availability, reduce the amount of manure to be handled as the heap
decomposes and make it easier to spread. Mixing slurry with water may make it easier to handle, but too much
water could dilute the nutrient value and increase the total volume to be applied. Where possible, quick
incorporation of slurry and manure into the soil will maximise nutrient potential. The less time nutrients are on
the surface, the less chance they have to be washed away in surface run-off or escape to the air as a gas.
Recommended measures� Establish nutrient levels in soil, manure and slurry. Knowing nutrient levels allows you to re-assess fertiliser
applications. Thus you can maximise production, minimise cost and reduce pollution risk to ditches, burns,
rivers and groundwater through nutrient loss.
� Plan and control when and how much manure and slurry is added to fields, matching this to crop or grass
requirement.
� Reduce midden run-off. This will preserve the nutrient value within manure whilst also reducing the
potential for pollution.
� Store solid manure in deep-sided stacks, preferably covered, to keep nutrient levels high.

11
� Reduce the amount of water mixing with slurry or manure. Less water in the mixture will keep slurry and
manure volume low and nutrient value high. The information on “Minimising dirty water around the steading”
provides more information.
� Site field heaps away from sandy or gravely sites and recently drained land. Make sure the heap is at least
10m away from any watercourse and 50m away form a spring, well or borehole..
� Devise a nutrient budget for your farm. This can highlight your nutrient efficiency and suggest ways of
making the most out of nutrients in slurry and manure. Your agricultural adviser will be able to assist you
with this.
What you need to do next Working through the following section will allow you to estimate the nutrient potential of slurry and manure from
your housed livestock and consider potential savings whilst building on current good practices.
12
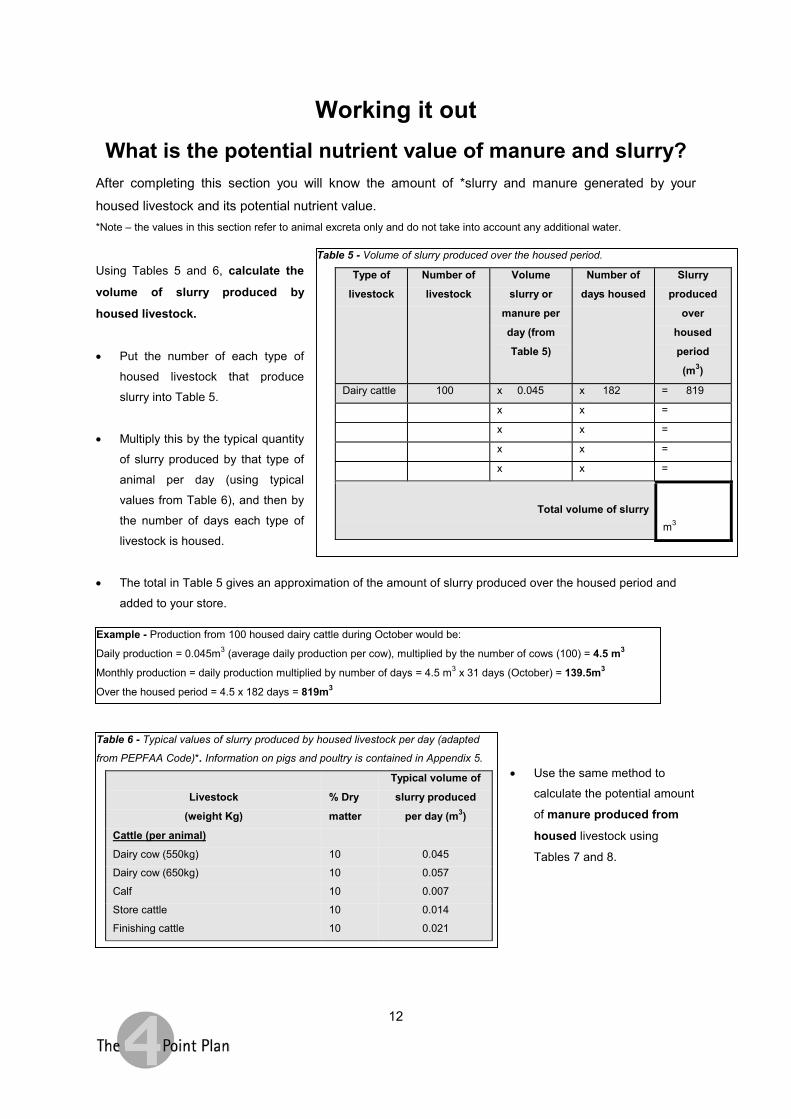
Working it out What is the potential nutrient value of manure and slurry?
After completing this section you will know the amount of *slurry and manure generated by your
housed livestock and its potential nutrient value. *Note – the values in this section refer to animal excreta only and do not take into account any additional water.
Using Tables 5 and 6, calculate the
volume of slurry produced by
housed livestock. � Put the number of each type of
housed livestock that produce
slurry into Table 5.
� Multiply this by the typical quantity
of slurry produced by that type of
animal per day (using typical
values from Table 6), and then by
the number of days each type of
livestock is housed.
� The total in Table 5 gives an approximation of the amount of slurry produced over the housed period and
added to your store.
� Use the same method to
calculate the potential amount
of manure produced from
housed livestock using
Tables 7 and 8.
Table 6 - Typical values of slurry produced by housed livestock per day (adapted
from PEPFAA Code)*. Information on pigs and poultry is contained in Appendix 5.
Livestock
(weight Kg)
% Dry
matter
Typical volume of
slurry produced
per day (m3)
Cattle (per animal) Dairy cow (550kg) 10 0.045
Dairy cow (650kg) 10 0.057
Calf 10 0.007
Store cattle 10 0.014
Finishing cattle 10 0.021
Table 5 - Volume of slurry produced over the housed period.
Type of
livestock
Number of
livestock
Volume
slurry or
manure per
day (from
Table 5)
Number of
days housed
Slurry
produced
over
housed
period
(m3)
Dairy cattle 100 x 0.045 x 182 = 819
x x =
x x =
x x =
x x =
Total volume of slurrym3
Example - Production from 100 housed dairy cattle during October would be:
Daily production = 0.045m3 (average daily production per cow), multiplied by the number of cows (100) = 4.5 m3
Monthly production = daily production multiplied by number of days = 4.5 m3 x 31 days (October) = 139.5m3
Over the housed period = 4.5 x 182 days = 819m3
13
You can use these
methods to calculate
how much slurry and/or
manure from your
housed livestock is
added to storage
systems on a monthly
basis.
Calculate the potential nutrient value contained in slurry and manure.� Keeping totals for slurry and manure separate, calculate the potential nutrient values contained in slurry and
manure using Table 9.
� Add your potential total and available nutrient values to Table 10.
Total or Available…?
Total nutrients refer to the amount
of nutrients contained within the
slurry or manure. Availablenutrients refer to the amount
available to the crop in the season
of application.
Note – for the purposes of this
information, P2O5 and K2O are used as
units to describe P and K values in
fertilisers and manures.
Table 9. Typical values of total NPK and available PK contained in slurry and manure.
Potential total nutrients Potential available
nutrients % dry
matter
N P2O5 K2O P2O5 K2O
Slurry (kg/m3) Dairy cattle 10 4 2.3 4.3 1.2 3.6
Young cattle
250kg
10 5 2.3 4.3 1.2 3.6
Fattening
cattle 400kg
10 3.5 2.0 3.8 1.0 3.0
Manure (kg/tonne) Cattle (fresh) 25 6 3.5 8.0 2.0 5.0
Table 8 - Typical values of manure produced by housed livestock per day
(adapted from SAC Technical note T309). Information on pigs and poultry is
contained in Appendix 5.
Livestock
(weight Kg)
% Dry
matter
Typical weight of
solid manure
produced per day
(tonnes)
Cattle (per animal) Beef cow (500kg) 25 0.030
Calf 25 0.008
Fattening cattle 25 0.019
Table 7 – Weight of solid manure produced over the housed period.
Type of
livestock
Number of
livestock
Weight of
manure per day
(from Table 8)
Number of
days housed
Manure produced
over housed
period
(tonnes)
Beef cattle 100 x 0.030 x 182 = 546
x x =
x x =
x x =
x x =
Total volume of manure
14
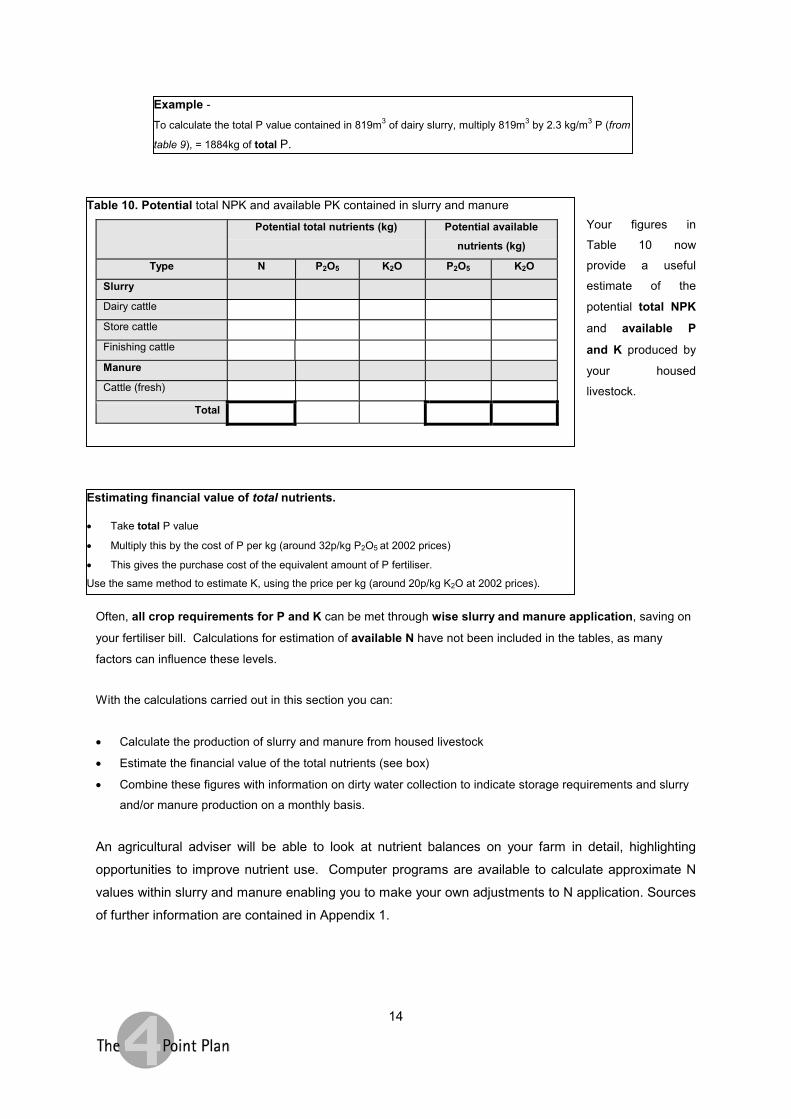
Your figures in
Table 10 now
provide a useful
estimate of the
potential total NPK
and available P
and K produced by
your housed
livestock.
Often, all crop requirements for P and K can be met through wise slurry and manure application, saving on
your fertiliser bill. Calculations for estimation of available N have not been included in the tables, as many
factors can influence these levels.
With the calculations carried out in this section you can:
� Calculate the production of slurry and manure from housed livestock
� Estimate the financial value of the total nutrients (see box)
� Combine these figures with information on dirty water collection to indicate storage requirements and slurry
and/or manure production on a monthly basis.
An agricultural adviser will be able to look at nutrient balances on your farm in detail, highlighting
opportunities to improve nutrient use. Computer programs are available to calculate approximate N
values within slurry and manure enabling you to make your own adjustments to N application. Sources
of further information are contained in Appendix 1.
Table 10. Potential total NPK and available PK contained in slurry and manure
Potential total nutrients (kg) Potential available
nutrients (kg)
Type N P2O5 K2O P2O5 K2O
Slurry
Dairy cattle
Store cattle
Finishing cattle
Manure
Cattle (fresh)
Total
Example - To calculate the total P value contained in 819m3 of dairy slurry, multiply 819m3 by 2.3 kg/m3 P (from
table 9), = 1884kg of total P.
Estimating financial value of total nutrients.
� Take total P value
� Multiply this by the cost of P per kg (around 32p/kg P2O5 at 2002 prices)
� This gives the purchase cost of the equivalent amount of P fertiliser.
Use the same method to estimate K, using the price per kg (around 20p/kg K2O at 2002 prices).
15
RAMS – a Risk Assessment for Manure andSlurryCarrying out a simple Risk Assessment for Manure and Slurry (RAMS) is an easy way to
plan applications of manure and slurry whilst following good agricultural practice and
reducing pollution risk.
What are the benefits to you and your business?RAMS can help to plan applications around your farm; it looks at land suitability and takes into account pollution
risks. A RAMS will:
� identify “no-spread zones” and spreading risks, providing a clear guide for contractors and farmers
spreading manure and slurry. Precautions, spreading areas and spreading rate must always be identified
and agreed in advance with contractors so that water pollution does not result.
� demonstrate improvements to current good practices. Following good agricultural practice means less
likelihood of pollution occurring from your land, protecting wildlife and habitats around the farm. Taking a closer look All slurry, manure, silage effluent and contaminated run-off (such as rain water on dirty yards or wash water)
around the steading must be collected, stored and spread in accordance with guidance in the PEPFAA Code.
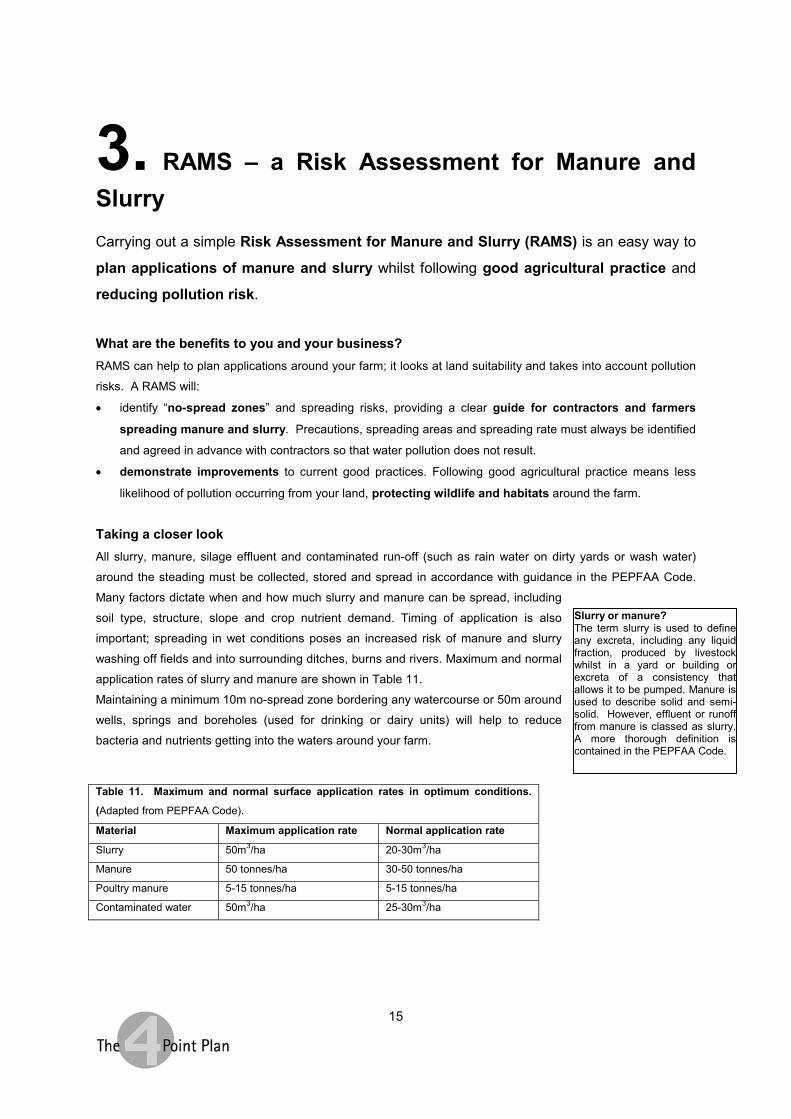
Many factors dictate when and how much slurry and manure can be spread, including
soil type, structure, slope and crop nutrient demand. Timing of application is also
important; spreading in wet conditions poses an increased risk of manure and slurry
washing off fields and into surrounding ditches, burns and rivers. Maximum and normal
application rates of slurry and manure are shown in Table 11.
Maintaining a minimum 10m no-spread zone bordering any watercourse or 50m around
wells, springs and boreholes (used for drinking or dairy units) will help to reduce
bacteria and nutrients getting into the waters around your farm.
Table 11. Maximum and normal surface application rates in optimum conditions.
(Adapted from PEPFAA Code).
Material Maximum application rate Normal application rate
Slurry 50m3/ha 20-30m3/ha
Manure 50 tonnes/ha 30-50 tonnes/ha
Poultry manure 5-15 tonnes/ha 5-15 tonnes/ha
Contaminated water 50m3/ha 25-30m3/ha
Slurry or manure?The term slurry is used to defineany excreta, including any liquidfraction, produced by livestockwhilst in a yard or building orexcreta of a consistency thatallows it to be pumped. Manure isused to describe solid and semi-solid. However, effluent or runofffrom manure is classed as slurry.A more thorough definition iscontained in the PEPFAA Code.
16
Recommended measures� Carry out a RAMS for your farm. The “Working it out” section guides you through this.
� Target your manure and slurry applications. Controlling when and how much manure and slurry is added to
your land means you will be making the most of valuable plant nutrients and could allow you to reduce
inorganic fertiliser applications, saving on the annual fertiliser bill.
� Keep a spreading logbook. A notebook in the tractor cab simply listing the date and time of application,
which fields received either slurry or manure, how much was applied and by whom. This record will help
you plan future of applications and demonstrate that applications on your land are within good practice
guidelines.
� Follow good practice and observe the minimum 10m no-spread zone around watercourses and a
minimum of 50m no-spread zone around springs, wells and boreholes used for drinking water or dairy
units. This will reduce the likelihood of nutrients and bacteria entering watercourses and help to prevent
deterioration of water quality.
� Use a competent and appropriately trained contractor who is aware of the pollution risk associated with
spreading on your land.
What you need to do next Complete the “Working it out” section. It contains step by step guidance on how to draw up a RAMS land plan
for your farm. The land plan can be used to form the basis of a farm waste management plan (FWMP). More
information on farm waste management planning is contained in Appendix 3.
17
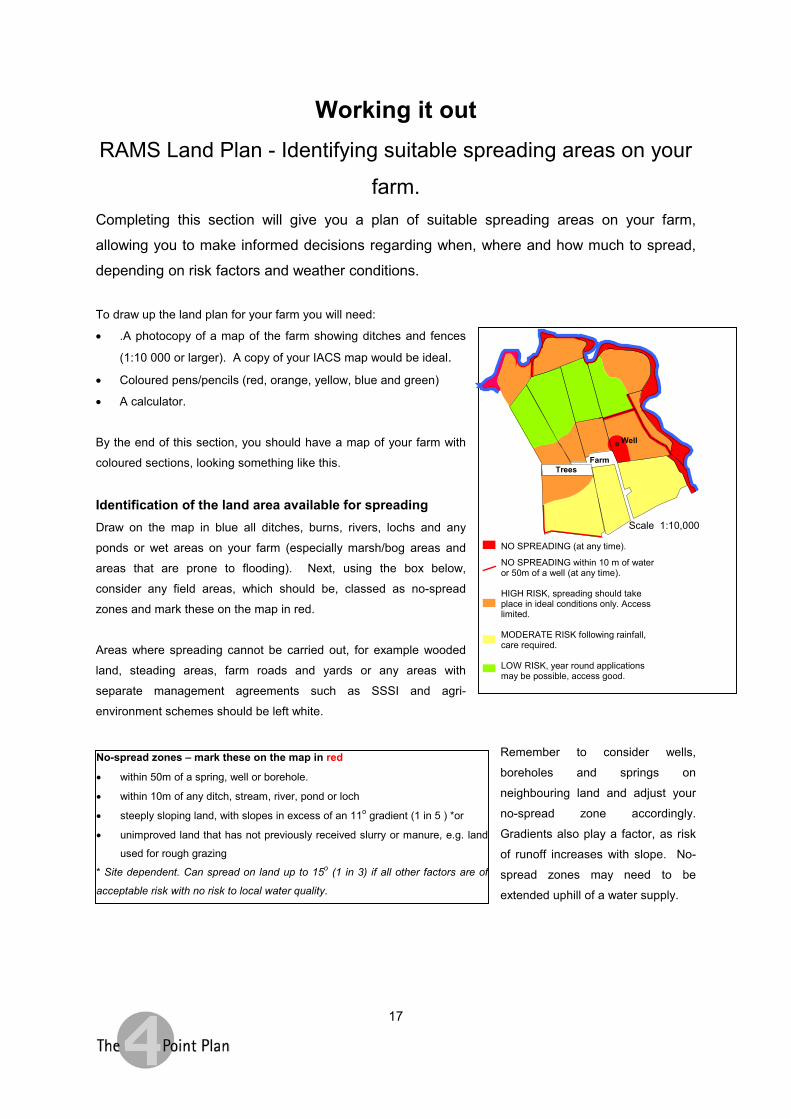
Working it out RAMS Land Plan - Identifying suitable spreading areas on your
farm. Completing this section will give you a plan of suitable spreading areas on your farm,
allowing you to make informed decisions regarding when, where and how much to spread,
depending on risk factors and weather conditions. To draw up the land plan for your farm you will need:
� .A photocopy of a map of the farm showing ditches and fences
(1:10 000 or larger). A copy of your IACS map would be ideal.� Coloured pens/pencils (red, orange, yellow, blue and green)
� A calculator.
By the end of this section, you should have a map of your farm with
coloured sections, looking something like this.
Identification of the land area available for spreadingDraw on the map in blue all ditches, burns, rivers, lochs and any
ponds or wet areas on your farm (especially marsh/bog areas and
areas that are prone to flooding). Next, using the box below,
consider any field areas, which should be, classed as no-spread
zones and mark these on the map in red.
Areas where spreading cannot be carried out, for example wooded
land, steading areas, farm roads and yards or any areas with
separate management agreements such as SSSI and agri-
environment schemes should be left white.
Remember to consider wells,
boreholes and springs on
neighbouring land and adjust your
no-spread zone accordingly.
Gradients also play a factor, as risk
of runoff increases with slope. No-
spread zones may need to be
extended uphill of a water supply.
No-spread zones – mark these on the map in red
� within 50m of a spring, well or borehole.
� within 10m of any ditch, stream, river, pond or loch
� steeply sloping land, with slopes in excess of an 11o gradient (1 in 5 ) *or
� unimproved land that has not previously received slurry or manure, e.g. land
used for rough grazing
* Site dependent. Can spread on land up to 15o (1 in 3) if all other factors are of
acceptable risk with no risk to local water quality.
NO SPREADING (at any time).
NO SPREADING within 10 m of wateror 50m of a well (at any time).
HIGH RISK, spreading should takeplace in ideal conditions only. Accesslimited.
MODERATE RISK following rainfall,care required.
LOW RISK, year round applicationsmay be possible, access good.
TreesFarm
Scale 1:10,000
Well
18
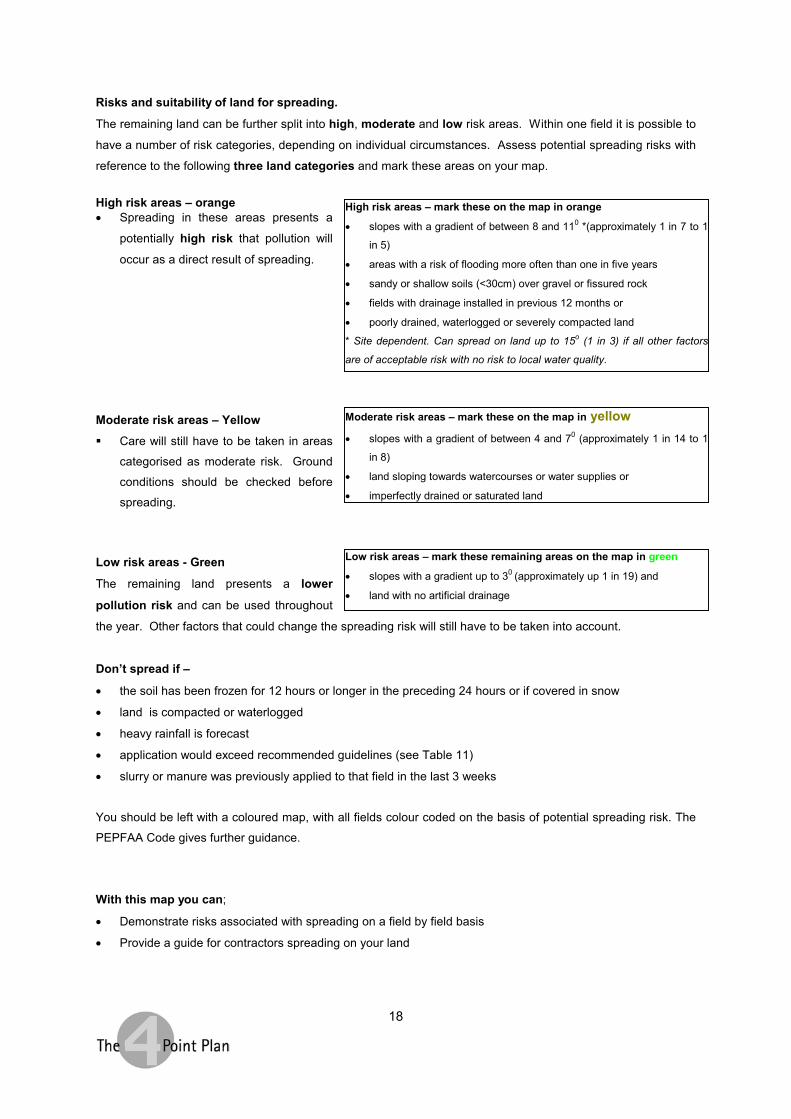
Risks and suitability of land for spreading.
The remaining land can be further split into high, moderate and low risk areas. Within one field it is possible to
have a number of risk categories, depending on individual circumstances. Assess potential spreading risks with
reference to the following three land categories and mark these areas on your map.
High risk areas – orange� Spreading in these areas presents a
potentially high risk that pollution will
occur as a direct result of spreading.
Moderate risk areas – Yellow� Care will still have to be taken in areas
categorised as moderate risk. Ground
conditions should be checked before
spreading.
Low risk areas - Green
The remaining land presents a lower
pollution risk and can be used throughout
the year. Other factors that could change the spreading risk will still have to be taken into account.
Don’t spread if –
� the soil has been frozen for 12 hours or longer in the preceding 24 hours or if covered in snow
� land is compacted or waterlogged
� heavy rainfall is forecast
� application would exceed recommended guidelines (see Table 11)
� slurry or manure was previously applied to that field in the last 3 weeks
You should be left with a coloured map, with all fields colour coded on the basis of potential spreading risk. The
PEPFAA Code gives further guidance.
With this map you can;
� Demonstrate risks associated with spreading on a field by field basis
� Provide a guide for contractors spreading on your land
High risk areas – mark these on the map in orange
� slopes with a gradient of between 8 and 110 *(approximately 1 in 7 to 1
in 5)
� areas with a risk of flooding more often than one in five years
� sandy or shallow soils (<30cm) over gravel or fissured rock
� fields with drainage installed in previous 12 months or
� poorly drained, waterlogged or severely compacted land
* Site dependent. Can spread on land up to 15o (1 in 3) if all other factors
are of acceptable risk with no risk to local water quality.
Low risk areas – mark these remaining areas on the map in green
� slopes with a gradient up to 30 (approximately up 1 in 19) and
� land with no artificial drainage
Moderate risk areas – mark these on the map in yellow� slopes with a gradient of between 4 and 70 (approximately 1 in 14 to 1
in 8)
� land sloping towards watercourses or water supplies or
� imperfectly drained or saturated land
19
Managing water margins
Spreading operations and livestock access to burns and rivers have the potential to pollute
watercourses with nutrients and faecal bacteria. Reducing pollution entering the water
could benefit your livestock as well as improving local water quality and wildlife
habitat.
What are the benefits to you and your business?Looking after your water margins can;
� Improve biosecurity – Keeping livestock out of water can reduce the risk of stock contracting or spreading
water-borne diseases to other animals up and downstream.
� Intercept run-off reducing the risk of pollution from your land entering the water.
� Allow plant growth, which in turn could
� act as an effective barrier or buffer strip to prevent or reduce diffuse pollution entering
the water.
� provide shelter for stock.
� improve bank-side stability,
� reduce flooding
� increase beneficial insect and wildlife populations
Taking a closer lookPreventing stock access to ditches and burns will allow plant growth and the development of a buffer strip in the
area of land next to the water known as the water margin. A simple buffer strip bordering ditches, burns and
rivers could intercept contaminated run-off from fields and take up excess nutrients, helping to protect the
watercourse and improve water quality and wildlife habitat. Keeping livestock away from the bank and
watercourses using temporary or permanent fencing can reduce poaching, soil damage and prevent dung being
deposited directly into the water with no time on land to allow natural decomposition. Restricting livestock access
also benefits stock, as it may minimise exposure to infections and reduce disease transfer. Parasitic infections
from Cryptosporidium, fluke and worms or diseases caused by leptospirosis and E.coli can all be transferred by
water leading to illness and loss of condition of stock. Your livestock may be healthy, but what about other
animals drinking and defecating into the water further up stream?
Siting of troughs, pumps and ring feeders should be carefully considered, as these areas are most prone to
poaching and contamination by livestock defecation.
Recommended measures� Site feeding rings and drinking troughs on flat ground as far away as is practical from watercourses, recent
drainage schemes and open ditches to minimise dung and urine gaining direct access to the water.

20
� Consider permanent or temporary fencing around watercourses in grazed fields.
� Investigate getting into the Rural Stewardship Scheme or other conservation or woodland schemes.
Financial assistance can be gained for protecting watercourses through fencing and buffer strip creation.
Your agricultural adviser will be able to provide details.
� Re-route stock or vehicle crossing points over rivers or burns using a hard crossing point or culvert.
� Remember the recommended minimum 10m no-spread zone around watercourses and minimum 50m
no-spread zone around springs, wells and boreholes.
What you need to do next
Buffer strips around ditches, burns and rivers will reduce the risk of pollution entering the water. Try to
prevent direct access of livestock to watercourses around your farm. Consider your watercourses on the farm
and decide where you could add a buffer strip or prevent livestock access to protect stock health and reduce
pollution risk. Sources of further information are contained in Appendix 1.

21
Appendices to The Four Point Plan
Further copies of The Four Point Plan are available via SEERAD, SEPA, SAC, FWAG
Scotland, NFU Scotland, SNH and WWF (Scotland) websites, details contained in
Appendix 1.
22
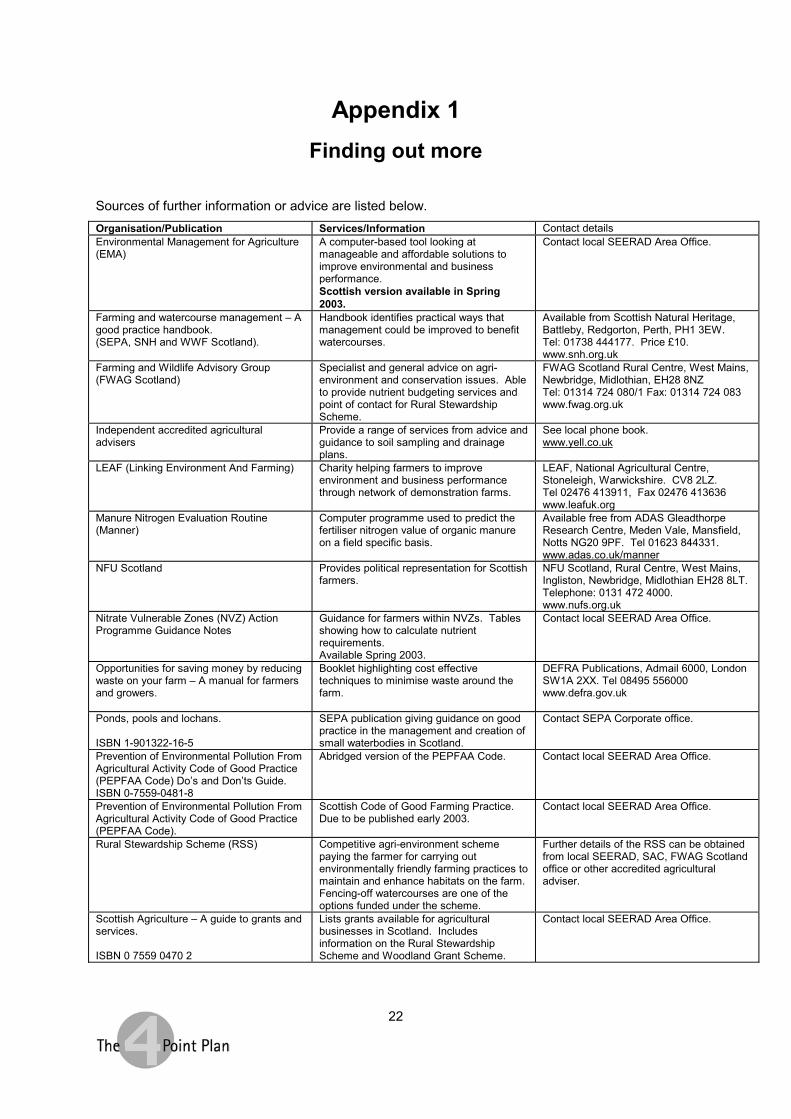
Appendix 1Finding out more
Sources of further information or advice are listed below.Organisation/Publication Services/Information Contact detailsEnvironmental Management for Agriculture(EMA)
A computer-based tool looking atmanageable and affordable solutions toimprove environmental and businessperformance.Scottish version available in Spring2003.
Contact local SEERAD Area Office.
Farming and watercourse management – Agood practice handbook.(SEPA, SNH and WWF Scotland).
Handbook identifies practical ways thatmanagement could be improved to benefitwatercourses.
Available from Scottish Natural Heritage,Battleby, Redgorton, Perth, PH1 3EW.Tel: 01738 444177. Price £10.www.snh.org.uk
Farming and Wildlife Advisory Group(FWAG Scotland)
Specialist and general advice on agri-environment and conservation issues. Ableto provide nutrient budgeting services andpoint of contact for Rural StewardshipScheme.
FWAG Scotland Rural Centre, West Mains,Newbridge, Midlothian, EH28 8NZTel: 01314 724 080/1 Fax: 01314 724 083www.fwag.org.uk
Independent accredited agriculturaladvisers
Provide a range of services from advice andguidance to soil sampling and drainageplans.
See local phone book.www.yell.co.uk
LEAF (Linking Environment And Farming) Charity helping farmers to improveenvironment and business performancethrough network of demonstration farms.
LEAF, National Agricultural Centre,Stoneleigh, Warwickshire. CV8 2LZ.Tel 02476 413911, Fax 02476 413636www.leafuk.org
Manure Nitrogen Evaluation Routine(Manner)
Computer programme used to predict thefertiliser nitrogen value of organic manureon a field specific basis.
Available free from ADAS GleadthorpeResearch Centre, Meden Vale, Mansfield,Notts NG20 9PF. Tel 01623 844331.www.adas.co.uk/manner
NFU Scotland Provides political representation for Scottishfarmers.
NFU Scotland, Rural Centre, West Mains,Ingliston, Newbridge, Midlothian EH28 8LT.Telephone: 0131 472 4000.www.nufs.org.uk
Nitrate Vulnerable Zones (NVZ) ActionProgramme Guidance Notes
Guidance for farmers within NVZs. Tablesshowing how to calculate nutrientrequirements.Available Spring 2003.
Contact local SEERAD Area Office.
Opportunities for saving money by reducingwaste on your farm – A manual for farmersand growers.
Booklet highlighting cost effectivetechniques to minimise waste around thefarm.
DEFRA Publications, Admail 6000, LondonSW1A 2XX. Tel 08495 556000www.defra.gov.uk
Ponds, pools and lochans.
ISBN 1-901322-16-5
SEPA publication giving guidance on goodpractice in the management and creation ofsmall waterbodies in Scotland.
Contact SEPA Corporate office.
Prevention of Environmental Pollution FromAgricultural Activity Code of Good Practice(PEPFAA Code) Do’s and Don’ts Guide.ISBN 0-7559-0481-8
Abridged version of the PEPFAA Code. Contact local SEERAD Area Office.
Prevention of Environmental Pollution FromAgricultural Activity Code of Good Practice(PEPFAA Code).
Scottish Code of Good Farming Practice.Due to be published early 2003.
Contact local SEERAD Area Office.
Rural Stewardship Scheme (RSS) Competitive agri-environment schemepaying the farmer for carrying outenvironmentally friendly farming practices tomaintain and enhance habitats on the farm.Fencing-off watercourses are one of theoptions funded under the scheme.
Further details of the RSS can be obtainedfrom local SEERAD, SAC, FWAG Scotlandoffice or other accredited agriculturaladviser.
Scottish Agriculture – A guide to grants andservices.
ISBN 0 7559 0470 2
Lists grants available for agriculturalbusinesses in Scotland. Includesinformation on the Rural StewardshipScheme and Woodland Grant Scheme.
Contact local SEERAD Area Office.
23
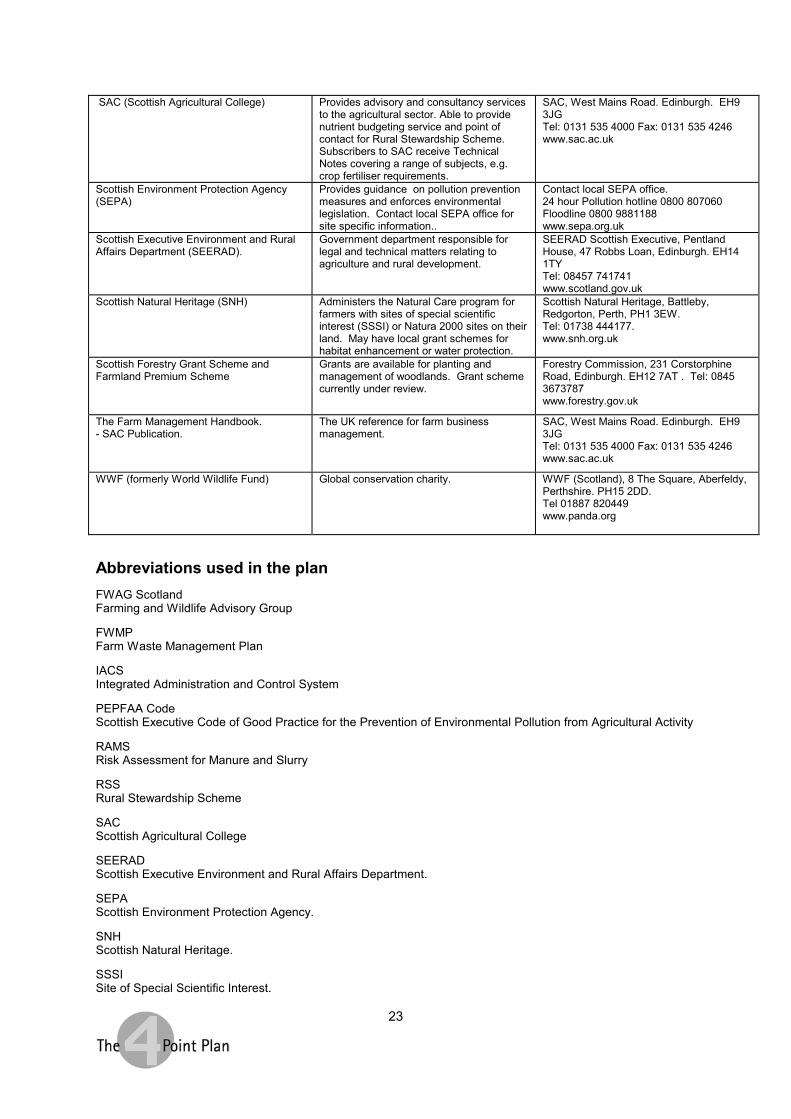
SAC (Scottish Agricultural College) Provides advisory and consultancy servicesto the agricultural sector. Able to providenutrient budgeting service and point ofcontact for Rural Stewardship Scheme.Subscribers to SAC receive TechnicalNotes covering a range of subjects, e.g.crop fertiliser requirements.
SAC, West Mains Road. Edinburgh. EH93JGTel: 0131 535 4000 Fax: 0131 535 4246www.sac.ac.uk
Scottish Environment Protection Agency(SEPA)
Provides guidance on pollution preventionmeasures and enforces environmentallegislation. Contact local SEPA office forsite specific information..
Contact local SEPA office.24 hour Pollution hotline 0800 807060Floodline 0800 9881188www.sepa.org.uk
Scottish Executive Environment and RuralAffairs Department (SEERAD).
Government department responsible forlegal and technical matters relating toagriculture and rural development.
SEERAD Scottish Executive, PentlandHouse, 47 Robbs Loan, Edinburgh. EH141TYTel: 08457 741741www.scotland.gov.uk
Scottish Natural Heritage (SNH) Administers the Natural Care program forfarmers with sites of special scientificinterest (SSSI) or Natura 2000 sites on theirland. May have local grant schemes forhabitat enhancement or water protection.
Scottish Natural Heritage, Battleby,Redgorton, Perth, PH1 3EW.Tel: 01738 444177.www.snh.org.uk
Scottish Forestry Grant Scheme andFarmland Premium Scheme
Grants are available for planting andmanagement of woodlands. Grant schemecurrently under review.
Forestry Commission, 231 CorstorphineRoad, Edinburgh. EH12 7AT . Tel: 08453673787www.forestry.gov.uk
The Farm Management Handbook.- SAC Publication.
The UK reference for farm businessmanagement.
SAC, West Mains Road. Edinburgh. EH93JGTel: 0131 535 4000 Fax: 0131 535 4246www.sac.ac.uk
WWF (formerly World Wildlife Fund) Global conservation charity. WWF (Scotland), 8 The Square, Aberfeldy,Perthshire. PH15 2DD.Tel 01887 820449www.panda.org
Abbreviations used in the planFWAG ScotlandFarming and Wildlife Advisory Group
FWMPFarm Waste Management Plan
IACSIntegrated Administration and Control System
PEPFAA CodeScottish Executive Code of Good Practice for the Prevention of Environmental Pollution from Agricultural Activity
RAMSRisk Assessment for Manure and Slurry
RSSRural Stewardship Scheme
SACScottish Agricultural College
SEERADScottish Executive Environment and Rural Affairs Department.
SEPAScottish Environment Protection Agency.
SNHScottish Natural Heritage.
SSSISite of Special Scientific Interest.
24
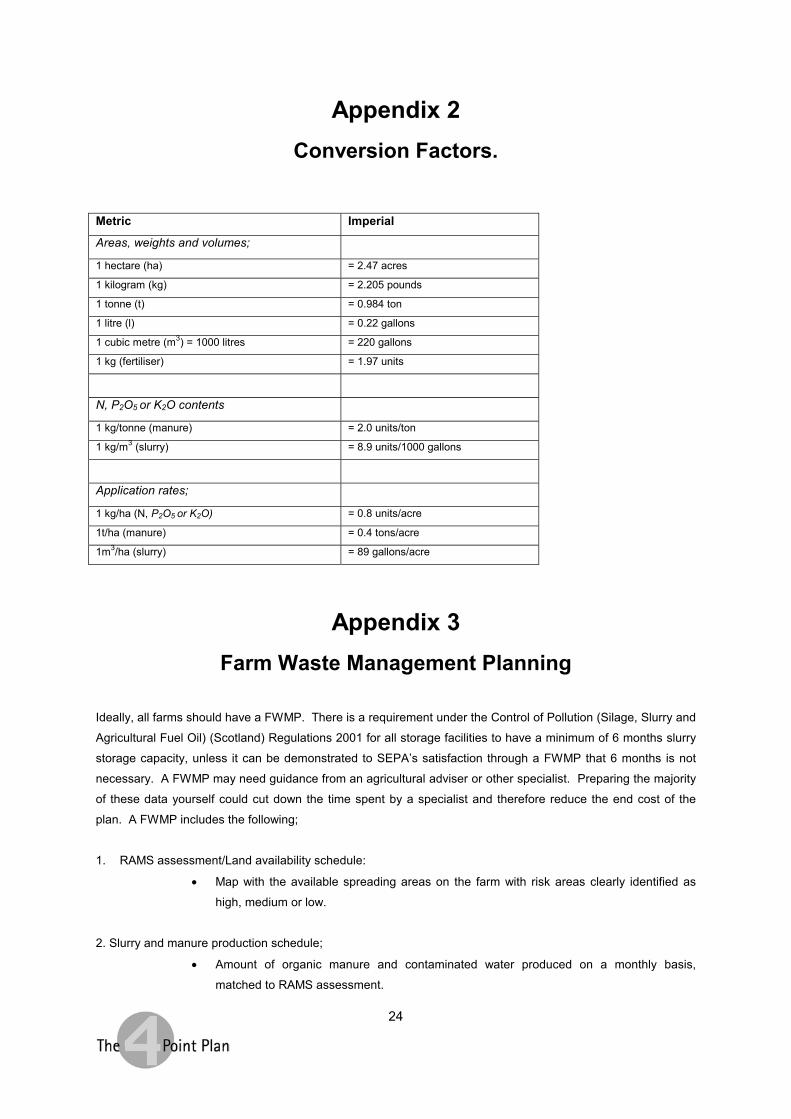
Appendix 2Conversion Factors.
Metric Imperial
Areas, weights and volumes;
1 hectare (ha) = 2.47 acres
1 kilogram (kg) = 2.205 pounds
1 tonne (t) = 0.984 ton
1 litre (l) = 0.22 gallons
1 cubic metre (m3) = 1000 litres = 220 gallons
1 kg (fertiliser) = 1.97 units
N, P2O5 or K2O contents
1 kg/tonne (manure) = 2.0 units/ton
1 kg/m3 (slurry) = 8.9 units/1000 gallons
Application rates;
1 kg/ha (N, P2O5 or K2O) = 0.8 units/acre
1t/ha (manure) = 0.4 tons/acre
1m3/ha (slurry) = 89 gallons/acre
Appendix 3Farm Waste Management Planning
Ideally, all farms should have a FWMP. There is a requirement under the Control of Pollution (Silage, Slurry and
Agricultural Fuel Oil) (Scotland) Regulations 2001 for all storage facilities to have a minimum of 6 months slurry
storage capacity, unless it can be demonstrated to SEPA’s satisfaction through a FWMP that 6 months is not
necessary. A FWMP may need guidance from an agricultural adviser or other specialist. Preparing the majority
of these data yourself could cut down the time spent by a specialist and therefore reduce the end cost of the
plan. A FWMP includes the following;
1. RAMS assessment/Land availability schedule:
� Map with the available spreading areas on the farm with risk areas clearly identified as
high, medium or low.
2. Slurry and manure production schedule;
� Amount of organic manure and contaminated water produced on a monthly basis,
matched to RAMS assessment.
25
3. Description of the systems in place for:
� collection, storage, transport and land application of slurry, farmyard manure and
contaminated water;
� Detailed information about each system, including the storage capacity, how it is
operated, how those operations are recorded and how the system is monitored and
maintained
4. Details of available spreading days:
� taking account of average monthly rainfall, dry days and frost days
5. Calculations to demonstrate that the systems in place are adequate to deal with the quantities of organic
wastes produced.
To be effective, a FWMP needs to be used and updated. Contractors should be made aware of the risk areas
and ensure the FWMP is followed.
26
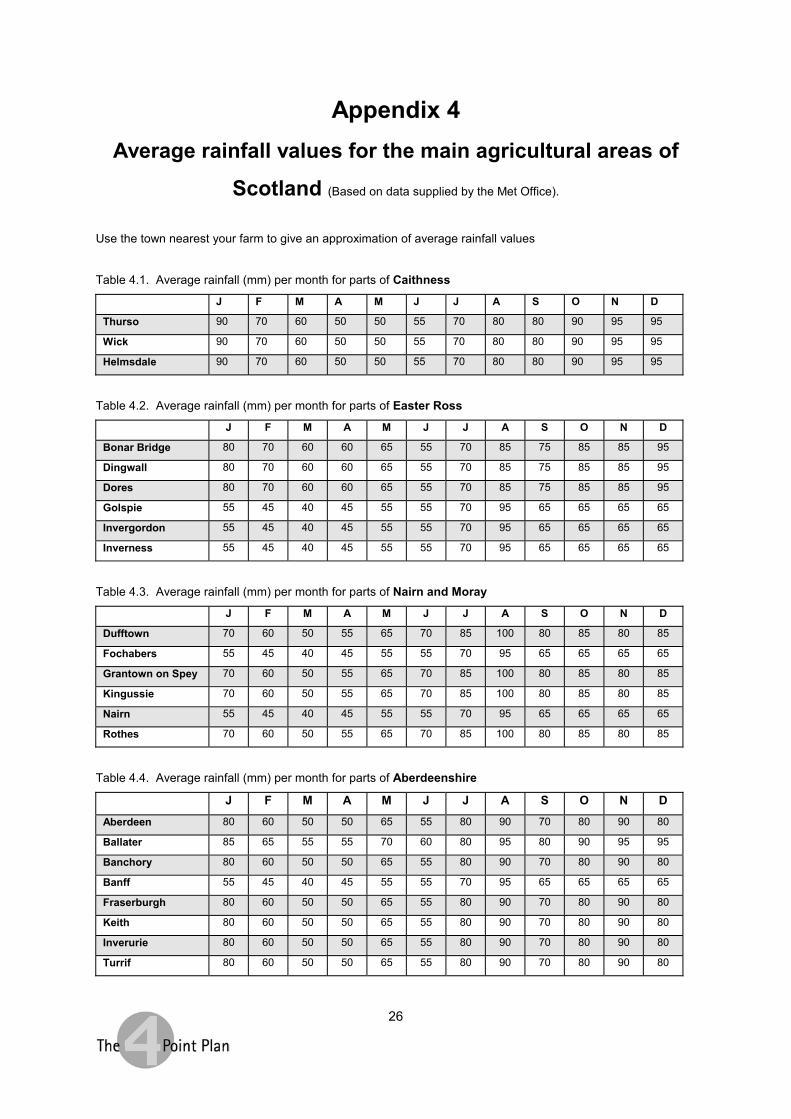
Appendix 4Average rainfall values for the main agricultural areas of
Scotland (Based on data supplied by the Met Office).
Use the town nearest your farm to give an approximation of average rainfall values
Table 4.1. Average rainfall (mm) per month for parts of CaithnessJ F M A M J J A S O N D
Thurso 90 70 60 50 50 55 70 80 80 90 95 95
Wick 90 70 60 50 50 55 70 80 80 90 95 95
Helmsdale 90 70 60 50 50 55 70 80 80 90 95 95
Table 4.2. Average rainfall (mm) per month for parts of Easter RossJ F M A M J J A S O N D
Bonar Bridge 80 70 60 60 65 55 70 85 75 85 85 95
Dingwall 80 70 60 60 65 55 70 85 75 85 85 95
Dores 80 70 60 60 65 55 70 85 75 85 85 95
Golspie 55 45 40 45 55 55 70 95 65 65 65 65
Invergordon 55 45 40 45 55 55 70 95 65 65 65 65
Inverness 55 45 40 45 55 55 70 95 65 65 65 65
Table 4.3. Average rainfall (mm) per month for parts of Nairn and MorayJ F M A M J J A S O N D
Dufftown 70 60 50 55 65 70 85 100 80 85 80 85
Fochabers 55 45 40 45 55 55 70 95 65 65 65 65
Grantown on Spey 70 60 50 55 65 70 85 100 80 85 80 85
Kingussie 70 60 50 55 65 70 85 100 80 85 80 85
Nairn 55 45 40 45 55 55 70 95 65 65 65 65
Rothes 70 60 50 55 65 70 85 100 80 85 80 85
Table 4.4. Average rainfall (mm) per month for parts of Aberdeenshire
J F M A M J J A S O N DAberdeen 80 60 50 50 65 55 80 90 70 80 90 80
Ballater 85 65 55 55 70 60 80 95 80 90 95 95
Banchory 80 60 50 50 65 55 80 90 70 80 90 80
Banff 55 45 40 45 55 55 70 95 65 65 65 65
Fraserburgh 80 60 50 50 65 55 80 90 70 80 90 80
Keith 80 60 50 50 65 55 80 90 70 80 90 80
Inverurie 80 60 50 50 65 55 80 90 70 80 90 80
Turrif 80 60 50 50 65 55 80 90 70 80 90 80
27
Table 4.5. Average rainfall (mm) per month for parts of Kincardineshire, Angus and PerthshireJ F M A M J J A S O N D
Blairgowerie 85 60 55 55 70 60 80 90 85 85 85 90
Carnoustie 65 45 45 45 65 50 70 80 65 65 70 70
Coupar Angus 65 45 45 45 65 50 70 80 65 65 70 70
Montrose 65 45 45 45 65 50 70 80 65 65 70 70
Perth 65 45 45 45 65 50 70 80 65 65 70 70
Pitlochry 85 60 55 55 70 60 80 90 85 85 85 90
Stonehaven 85 60 55 55 70 60 80 90 85 85 85 90
Table 4.6. Average rainfall (mm) per month for parts of Perthshire, Stirlingshire, Renfrewshire and
ClackmannanshireJ F M A M J J A S O N D
Armadale 80 60 55 55 70 65 85 95 85 80 90 90
Auchterader 100 75 70 70 75 75 85 110 115 110 100 115
Doune 100 75 70 70 75 75 85 110 115 110 100 115
Dunblane 100 75 70 70 75 75 85 110 115 110 100 115
Dunfermline (N) 80 60 55 55 70 65 85 95 85 80 90 90
Dunfermline (S) 60 50 45 45 60 55 75 85 65 65 70 65
Glasgow SE 80 60 55 55 65 65 80 90 95 90 85 90
Kirkcaldy 60 50 45 45 60 55 75 85 65 65 70 65
Ladybank 60 50 45 45 60 55 75 85 65 65 70 65
St Andrews 60 50 45 45 60 55 75 85 65 65 70 65
Stirling 80 60 55 55 70 65 85 95 85 80 90 90
Tillicoultry 100 75 70 70 75 75 85 110 115 110 100 115
Table 4.7. Average rainfall (mm) per month for parts of the Lothians and BordersJ F M A M J J A S O N D
Biggar 80 65 50 55 70 60 80 95 85 80 90 85
Carluke 75 60 50 55 65 65 85 90 95 85 85 85
Coldstream 65 50 40 45 55 55 65 85 65 65 75 65
Dalkeith 55 40 40 40 55 45 65 85 60 60 70 60
Dunbar 55 40 40 40 55 45 65 85 60 60 70 60
Duns 65 50 40 45 55 55 65 85 65 65 75 65
Edinburgh 55 40 40 40 55 45 65 85 60 60 70 60
Eyemouth 65 50 40 45 55 55 65 85 65 65 75 65
Galashiels 65 50 40 45 55 55 65 85 65 65 75 65
Jedburgh 65 50 40 45 55 55 65 85 65 65 75 65
Lanark 75 60 50 55 65 65 85 90 95 85 85 85
Lauder 65 50 40 45 55 55 65 85 65 65 75 65
Livingstone 80 60 55 55 70 65 85 95 85 80 90 90
Penicuik 80 65 50 55 70 60 80 95 85 80 90 85
Selkirk 80 65 50 55 70 60 80 95 85 80 90 85

28
Table 4.8. Average rainfall (mm) per month for parts of AyrshireJ F M A M J J A S O N D
Ayr 85 55 55 55 60 65 80 95 105 100 90 95
Cumnock 95 70 65 65 65 70 95 105 120 120 110 115
Girvan 95 70 65 65 65 70 95 105 120 120 110 115
Newmilns 95 70 65 65 65 70 95 105 120 120 110 115
Saltcoats 95 70 65 65 65 70 95 105 120 120 110 115
Table 4.9. Average rainfall (mm) per month for parts of Dumfries and GallowayJ F M A M J J A S O N D
Annan 105 70 65 65 75 70 85 105 115 105 105 105
Dalbeattie 105 70 65 65 75 70 85 105 115 105 105 105
Dumfries 105 70 65 65 75 70 85 105 115 105 105 105
Kirkudbright 105 65 70 65 70 65 80 100 115 115 115 115
Lochmaben 105 70 65 65 75 70 85 105 115 105 105 105
Newton Stewart 105 65 70 65 70 65 80 100 115 115 115 115
Stranraer 105 65 70 65 70 65 80 100 115 115 115 115
29
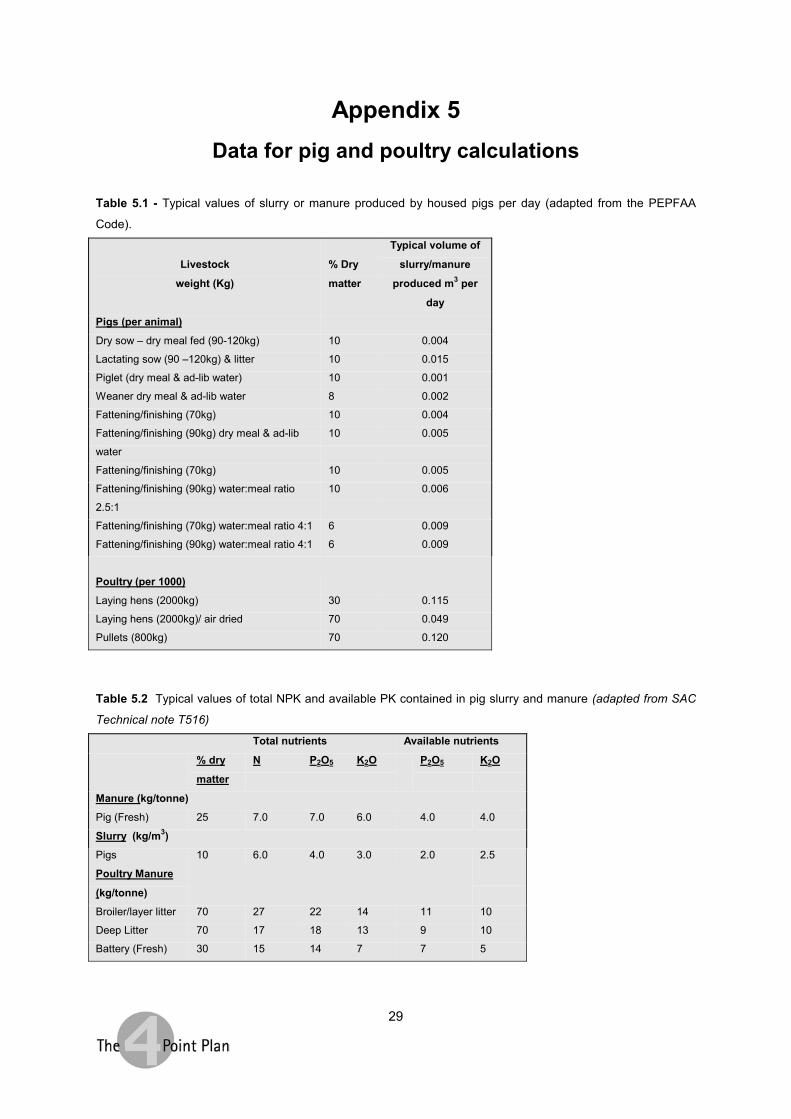
Appendix 5Data for pig and poultry calculations
Table 5.1 - Typical values of slurry or manure produced by housed pigs per day (adapted from the PEPFAA
Code).
Livestock
weight (Kg)
% Dry
matter
Typical volume of
slurry/manure
produced m3 per
day
Pigs (per animal)Dry sow – dry meal fed (90-120kg) 10 0.004
Lactating sow (90 –120kg) & litter 10 0.015
Piglet (dry meal & ad-lib water) 10 0.001
Weaner dry meal & ad-lib water 8 0.002
Fattening/finishing (70kg) 10 0.004
Fattening/finishing (90kg) dry meal & ad-lib
water
10 0.005
Fattening/finishing (70kg) 10 0.005
Fattening/finishing (90kg) water:meal ratio
2.5:1
10 0.006
Fattening/finishing (70kg) water:meal ratio 4:1 6 0.009
Fattening/finishing (90kg) water:meal ratio 4:1 6 0.009
Poultry (per 1000)Laying hens (2000kg) 30 0.115
Laying hens (2000kg)/ air dried 70 0.049
Pullets (800kg) 70 0.120
Table 5.2 Typical values of total NPK and available PK contained in pig slurry and manure (adapted from SAC
Technical note T516)
Total nutrients Available nutrients
% dry
matter
N P2O5 K2O P2O5 K2O
Manure (kg/tonne)Pig (Fresh) 25 7.0 7.0 6.0 4.0 4.0
Slurry (kg/m3)Pigs 10 6.0 4.0 3.0 2.0 2.5
Poultry Manure
(kg/tonne)Broiler/layer litter 70 27 22 14 11 10
Deep Litter 70 17 18 13 9 10
Battery (Fresh) 30 15 14 7 7 5