Embed Size (px)
Citation preview
Submitted 3 March 2014Accepted 15 May 2014Published 27 May 2014
Corresponding authorsChristopher W. Beitel,[email protected] E. Darling,[email protected]
Academic editorKeith Crandall
Additional Information andDeclarations can be found onpage 16
DOI 10.7717/peerj.415
Copyright2014 Beitel et al.
Distributed underCreative Commons CC-BY 4.0
OPEN ACCESS
Strain- and plasmid-level deconvolutionof a synthetic metagenome by sequencingproximity ligation productsChristopher W. Beitel1, Lutz Froenicke1, Jenna M. Lang1, Ian F. Korf1,2,Richard W. Michelmore1,2,3, Jonathan A. Eisen1,4,5 and Aaron E. Darling6
1 The University of California, Davis Genome Center, Davis, CA, USA2 Department of Molecular and Cellular Biology, University of California, Davis, CA, USA3 Department of Plant Sciences, University of California, Davis, CA, USA4 Department of Medical Microbiology and Immunology, University of California,
Davis, CA, USA5 Department of Evolution and Ecology, University of California, Davis, CA, USA6 ithree institute, University of Technology Sydney, Sydney, NSW, Australia
ABSTRACTMetagenomics is a valuable tool for the study of microbial communities but has beenlimited by the difficulty of “binning” the resulting sequences into groups correspond-ing to the individual species and strains that constitute the community. Moreover,there are presently no methods to track the flow of mobile DNA elements suchas plasmids through communities or to determine which of these are co-localizedwithin the same cell. We address these limitations by applying Hi-C, a technologyoriginally designed for the study of three-dimensional genome structure in eukary-otes, to measure the cellular co-localization of DNA sequences. We leveraged Hi-Cdata generated from a simple synthetic metagenome sample to accurately clustermetagenome assembly contigs into groups that contain nearly complete genomes ofeach species. The Hi-C data also reliably associated plasmids with the chromosomesof their host and with each other. We further demonstrated that Hi-C data providesa long-range signal of strain-specific genotypes, indicating such data may be usefulfor high-resolution genotyping of microbial populations. Our work demonstratesthat Hi-C sequencing data provide valuable information for metagenome analysesthat are not currently obtainable by other methods. This metagenomic Hi-C methodcould facilitate future studies of the fine-scale population structure of microbes,as well as studies of how antibiotic resistance plasmids (or other genetic elements)mobilize in microbial communities. The method is not limited to microbiology; thegenetic architecture of other heterogeneous populations of cells could also be studiedwith this technique.
Subjects Bioengineering, Bioinformatics, Computational Biology, Genomics, MicrobiologyKeywords Hi-C, Microbial ecology, Metagenomics, Plasmids, Synthetic microbial commu-nities, Markov clustering, Metagenome assembly, Strain differentiation, Haplotype phasing,Genome scaffolding
How to cite this article Beitel et al. (2014), Strain- and plasmid-level deconvolution of a synthetic metagenome by sequencing proximityligation products. PeerJ 2:e415; DOI 10.7717/peerj.415
INTRODUCTIONMicrobial ecology is the study of microbial communities in terms of their composition,
functional diversity, interactions, stability, and emergent properties (Handelsman, 2004;
Konopka, 2009). Knowledge of the roles microbes play in ecosystems is essential for
understanding how these ecosystems function (Konopka, 2009). Readily-cultivated
organisms are estimated to constitute less than 1% of all microbial species, leading to
the development of culture-independent methods for studying microbial communities
(Gilbert & Dupont, 2011; Hugenholtz, 2002; Staley, 1985). These culture-independent
methods allow communities to be characterized directly.
Current sequencing-based metagenomic methods do not capture some of the most
informative genetic information in microbial communities, in particular the long-range
sequence contiguity and associations of genetic material in individual cells. In nearly all
metagenomic methods, cells from the microbial community are lysed en masse to obtain
a bulk DNA sample. This results in DNA from many different cells being mixed together,
so that the genotype and species identity of individual cells are lost. Chromosomal DNA
is then fragmented into pieces (∼500 bp–40 kbp, depending on the sequencing strategy),
further reducing contiguity.
Improved sample-processing workflows might preserve this information and thereby
yield greater insight into the genetic structure of microbial communities. High throughput
single-cell genomics (e.g., applied to thousands of cells) offers a promising alternative to
shotgun metagenomics that preserves information about cellular compartmentalization
of genetic material. These approaches are exquisitely sensitive to contamination by
foreign DNA (from the sample itself, the laboratory environment, and from “ultra-pure”
commercial reagents), necessitating the use of specialized equipment and reagents
(Blainey, 2013; Woyke et al., 2011). Long-read technologies, such as Pacific Biosciences
(Eid et al., 2009) and nanopore (Maitra, Kim & Dunbar, 2012) sequencing, may help
address this challenge but are still constrained by the difficulty of preparing adequate
amounts of very long DNA fragments.
Computational methods have been developed to infer genomic contiguity from
metagenomic data by binning metagenome assembly contigs by species. These binning
procedures pose a significant analytical challenge. Several methods have been developed
that can be divided into comparative, compositional, and assembly approaches. Compar-
ative approaches use alignments to reference sequences to assign contigs to species within
existing taxonomies (Droge & McHardy, 2012). Comparative approaches are limited by
their reliance on existing taxonomies. Compositional approaches form clusters of contigs
that share similar oligomer (usually 4 bp–8 bp) composition (Droge & McHardy, 2012).
Compositional approaches tend to be limited as well due to their underlying assumption
that contigs with similar sequence composition belong together. Horizontal gene transfer
complicates both of these analysis methods because it can introduce gene content from a
taxonomically distant relative with unusual nucleotide composition. Thirdly, metagenome
assembly can be viewed as a metagenome binning approach since sequences placed on
the same scaffold are necessarily present in the same bin for any downstream binning
Beitel et al. (2014), PeerJ, DOI 10.7717/peerj.415 2/19
procedure. As with all genome assembly approaches, metagenome assembly seeks to infer
sequence adjacencies from paired- and long-read technologies. This approach is limited by
the availability of such data that span large repetitive regions (Treangen & Salzberg, 2012;
Howe et al., 2014; Treangen et al., 2013).
Binning seeks to address the challenge of determining which sequences were present
within cells of the same species prior to DNA extraction. We reasoned that such
co-localizations could be inferred from Hi-C data, a method originally developed
for the study of three-dimensional genome structure in eukaryotes (Lieberman-Aiden
et al., 2009). This method relies on cross-linking molecules in close physical proximity
and consequently identifies both intra- and inter-chromosomal associations, reflecting
the spatial arrangement of DNA at the time of cross-linking within intact nuclei or
non-nucleated cells (Umbarger et al., 2011). We predicted that sequences of DNA not
present in the same cell at the time of cross-linking would not be cross-linked together and
should not be associated by Hi-C reads (Fig. S1). Herein we demonstrate the utility of Hi-C
as a tool for addressing metagenomic binning and related problems in microbial ecology.
To do so we first constructed a synthetic microbial community by culturing and mixing five
organisms with available reference genomes. We then performed a metagenome assembly
on sequences that were simulated in silico from the genomes of these organisms. Our first
objective was to group these metagenome assembly contigs according to species using
Hi-C reads that were generated from the synthetic microbial community. We then sought
to differentiate two closely related E. coli strains included within this mixture. To do so
we constructed contig and variant graphs and analyzed those graphs to characterize the
extent to which Hi-C data might resolve the genotypes of species and strains present in our
synthetic community.
MATERIALS AND METHODSConstruction of a synthetic microbial communityPediococcus pentosaceus and Lactobacillus brevis were provided by the UC Davis Enology
Culture Collection (http://wineserver.ucdavis.edu). Single colonies were used to start
cultures in 5 ml liquid MRS broth. Escherichia coli BL21 (ATCC# PTA-5073), E. coli K12
DH10B (ATCC# 207214), and Burkholderia thailandensis (ATCC# 700388) were obtained
as freeze-dried stocks from the American Type Culture Collection (ATCC). The E. coli
strains were re-suspended in 5 ml of LB liquid medium (10 g/L Tryptone, 10 g/L NaCl,
5 g/L Yeast Extract) and the B. thailandensis was re-suspended in 5 ml of Nutrient Broth
(Peptone 15.0 g/L, yeast extract 3 g/L, sodium chloride 6 g/L, D(+)glucose 1 g/L). All were
incubated, with shaking, overnight at 37 ◦C to produce starter cultures.
A separate 50 ml culture for each organism was created by inoculation with 10 µl of the
appropriate starter culture and grown, with shaking, at 37 ◦C, for 24 h. The cell density
of each culture was estimated by measuring the OD600. The cultures were then mixed in
quantities proportional to their optical density, seeking to have equal representation of
each organism in the synthetic community. Glycerol was added to a final concentration of
7% and the final mixture was divided into 2 ml tubes and frozen at −80 ◦C.
Beitel et al. (2014), PeerJ, DOI 10.7717/peerj.415 3/19
Simulated metagenome assembliesWe simulated Illumina paired-end sequencing of the synthetic microbial community
to obtain metagenomic assemblies that we could subsequently attempt to bin using
experimentally derived Hi-C reads. Reads were simulated using Grinder (Angly et al., 2012)
v0.4.5, a tool for simulating metagenomic shotgun sequence reads. Replicons were sampled
assuming uniform abundance of species. A total of 61,063,000 reads were simulated to
cover the genomes at 500x. From this set, paired-end read datasets of varying levels of
coverage (100, 50, and 5x) were formed. Read length was simulated to 165 bp and fragment
size was simulated with a normal distribution around 550 bp with a standard deviation of
50 bp (“grinder -am uniform -cf $cov-rd 165 -id 550 normal 50 -rf $ref -fq 1 -ql 30 10 -bn
grinder.dp$cov.$tag”).
Assembly from each of the simulated metagenomic read sets was performed using
SOAPdenovo (Luo et al., 2012) with a k-mer length of 23, yielding assemblies of varying
quality (Table S1). Reads were aligned to the resulting assembly contigs using BWA MEM
(Li, 2013). The rate of misassembly was determined by mapping contigs back to the refer-
ence assemblies (BWA-MEM with default parameters and a quality filter of MapQ > 20)
and counting the number of contigs that joined sequences from different species. These as-
semblies are available on Figshare: http://dx.doi.org/10.6084/m9.figshare.1004473, http://
dx.doi.org/10.6084/m9.figshare.1004472, http://dx.doi.org/10.6084/m9.figshare.1004471.
Application of Hi-C to the synthetic microbial communityWe performed Hi-C on the synthetic microbial community for the purpose of obtaining
information that could be used to group (by species) the simulation-derived contigs
described above, as well as to differentiate closely related strains present in our synthetic
community. Hi-C was carried out by combining the cross-linking and cell wall digestion
procedures described by Umbarger et al. (2011) for bacterial 3-C experiments and the
Hi-C protocol developed for mammalian cells (Lieberman-Aiden et al., 2009) with minor
modifications. For additional details, see Supplemental Information: Hi-C of Mixed
Bacterial Cultures. Cells were transferred into a 50 ml centrifuge tube and washed three
times in 25 ml of TE buffer (pH = 8.0) by centrifugation for 5 min at 4000 rpm at 4 ◦C.
Cells were re-suspended at an OD600 of 0.2 in TE and 37% formaldehyde was added
to a final concentration of 1% to cross-link proteins in the cell. Cells were incubated at
room temperature for 30 min and subsequently for another 30 min on ice (Umbarger et
al., 2011). The formaldehyde was quenched by adding glycine to a final concentration of
0.125 M and incubated on ice for 10 min. After centrifugation, cells were re-suspended
in TE and lysozyme digestion was carried out as described to release the protein-DNA
complexes (Umbarger et al., 2011). The samples were centrifuged and re-suspended
in Hi-C lysis buffer and incubated on ice for 15 min (Lieberman-Aiden et al., 2009).
From this step on the original Hi-C protocol employing HindIII (Lieberman-Aiden et
al., 2009) was applied with some modifications. To summarize the Lieberman-Aiden et
al. (2009) protocol, DNA in the cross-linked protein complexes is digested with HindIII
endonuclease following cell lysis and free DNA ends are tagged with biotin. Blunt-ended
Beitel et al. (2014), PeerJ, DOI 10.7717/peerj.415 4/19

DNA fragments are ligated under highly dilute conditions, resulting in preferential
ligation of fragments that are within the same cross-linked DNA/protein complex. Next,
crosslinks are removed, DNA is purified, biotin is eliminated from un-ligated ends, DNA
is size-selected, and ligation products are selected for through a biotin pull-down. One
modification we made to the published procedure was to reduce the concentration
of biotin-14-dCTP (Life Technologies) by half. Also, ligation to Illumina-compatible
sequencing adapters (Bioo Scientific) was carried out in solution before capture with
streptavidin beads. The DNA sample was size selected after end-repair and before adapter
ligation by gel extraction for fragment sizes ranging from 280 to 420 bp. The bead-captured
Hi-C library was amplified by 10 cycles of PCR before a final cleanup with Ampure XP
beads (Agencourt). The library was sequenced in a single run on an Illumina Miseq
machine using 160 bp paired-end reads.
Sequence alignment and quality filteringReference assembly sequences were obtained from the NCBI RefSeq database (Pruitt et al.,
2012) with the following accession numbers for each of P. pentosaceus (NC 008525), L. bre-
vis (NC 008497, NC 008498, NC 008499), E. coli BL21 (NC 012892), E. coli K12 DH10B
(NC 010473), and B. thailandensis (NC 007651, NC 007650). These sequences were
pooled into a single reference database for sequence alignment. No quality filtering was
performed on raw reads, leaving this to be performed later using alignment quality scores.
Split-read sequence alignment was performed (independently for each read in a pair) using
BWA MEM (Li, 2013; default parameters) against the pooled reference assemblies as well
as (separately) against the metagenome assembly described above. Heat map visualizations
and insert distribution plots were generated from unfiltered alignments using custom R
(The R Core Development Team, 2010) scripts (see http://github.com/cb01/proxmine).
We investigated the effect of various alignment filtering parameters on the subsequent
variant graph analysis (illustration of the concept of a variant graph can be found in
Fig. S7). To this end, alignments of Hi-C reads to the reference genomes were filtered
according to 24 parameter combinations, with three minimum mapping quality (0, 20,
60), two CIGAR filtering (none, CIGAR = 160 M), and four minimum insert filtering
(0, 1 kb, 10 kb, 40 kb) conditions. In the latter, Hi-C read pairs were excluded when their
alignments within the reference assembly had an insert size below the specified minimum,
including cases of alignments spanning the linearization points of these assemblies
(e.g., for E. coli, near coordinates 0 and 4686137). An open-source graph visualization tool,
Gephi (0.8.2-beta), was used to visualize the Hi-C contig association network (Bastian,
Heymann & Jacomy, 2009).
Contig clusteringWe inferred grouping of metagenome assembly contigs by applying the Markov Clustering
Algorithm (MCL) to a matrix of contig association data (van Dongen, 2000). MCL is
an unsupervised clustering algorithm which simulates flow and accumulation of edge
weights within a given weighted graph structure. It has a computational complexity of
O(Nk2) given an implementation designed for sparse matrices. The matrix of edge weights
Beitel et al. (2014), PeerJ, DOI 10.7717/peerj.415 5/19

provided to this algorithm was computed from contig association counts by normalizing
edge weights according to the following formula, which corrects for the expected inflation
of association between large contigs. Specified formally, let L be a set of contig lengths
with member li denoting the length of contig i. Given a contig pair {i,j}, let cij denote the
number of Hi-C read pairs with one end aligning in contig i and the other end in contig j.
This count was normalized by the ratio of the square of the maximum contig length and
the lengths li and lj of contigs i and j, respectively.
c′
ij =max(L)2ci,j
lilj.
Prior to normalization, we filtered the contig association data for (1) contig associations
greater than some minimum k, and (2) associations between contigs of size greater than L.
We explored the (k,L) parameter space by performing normalization and MCL clustering
for 205 parameter combinations, with 41 contig size minimums chosen evenly across [0,
40000] and five contact minimums, {0, 3, 5, 7, 9}. For each of the 205 filtering parameter
combinations, clustering was performed using 100 different MCL inflation values chosen
to span the interval [1, 2] in increments of 0.01.
Assessment of clustering qualityEach metagenome assembly contig was aligned to the reference assemblies to determine
its species or strain of origin, allowing us to determine which strains were present in each
cluster of contigs. This was done by extracting every 70 bp substring of the available contig
sequences and aligning each of those back to the reference assemblies with BWA-MEM
(default parameters, MapQ > 20). A contig was designated as originating from the species
to which the greatest number of these substrings aligned. A measure of clustering quality
was computed by sampling random pairs of contigs (N = 100,000 pairs) and comparing
their cluster assignments to their species of origin. This random sampling was weighted
according to the size of each contig such that the probability of sampling any contig from
the set was equal to the size of that contig divided by the sum total of all contig sizes.
Any contig not present in the clustering solution (but which was present as input for the
clustering run that generated that solution) was added to the solution in a singleton cluster.
For each sampled contig pair, if those contigs belonged to the same species and had been
placed in the same cluster, they were counted as a true positive (“TP”). If they originated
from the same species but had been placed in different clusters, they were counted as a false
negative (“FN”). Likewise, contigs originating from different species that were placed in the
same or different clusters were counted as false positives (“FP”) and true negatives (“TN”),
respectively. The true positive rate (a.k.a. sensitivity, recall), false positive rate, positive
predictive value (a.k.a. precision), and negative predictive value were calculated from these
counts according to standard formulae. All clustering quality measures were computed
in two ways, one treating the two E. coli strains as independent classes (strain-level) and
another treating them as the same (species-level).
Beitel et al. (2014), PeerJ, DOI 10.7717/peerj.415 6/19
Analysis of SNP graph connectivityA SNP graph is an undirected graph wherein SNP sites are nodes and edges link pairs of
SNP sites that were observed together in a sequence read pair. We expected SNP graphs that
were constructed using Hi-C data to be more densely connected than SNP graphs that were
constructed using mate-pair data because Hi-C read pairs can span entire chromosomes
while reads from mate-pair libraries span no more than 40 kb +/− 5 kb. In this way, Hi-C
provides global information while that provided by mate pairs is locally constrained. To
quantify this, SNP graphs were constructed for the Hi-C data and simulated mate-pair
data and the shortest path between randomly chosen SNP pairs was plotted relative to
the distance between the those variants within the reference assembly. These graphs were
constructed from alignments of reads to the E. coli K12 reference assembly after it had been
masked at variant positions identified through pairwise sequence alignment of E. coli K12
and BL21 using progressiveMauve (Darling, Mau & Perna, 2010). In this way, the masked
K12 reference assembly was used as a scaffold for our analysis of Hi-C and mate-pair
variant graphs.
Hi-C read datasets typically contain a mixture of reads derived from ligation and
non-ligation products, the latter having short inserts. In our analysis of SNP graph
connectivity we sought to understand the contribution of these non-ligation products
on the connectivity gains seen with Hi-C reads over mate-pairs. For comparison to our
Hi-C reads, mate-pair read sets were computationally simulated for a range of sizes (5 kb,
10 kb, 20 kb, 40 kb). These were compared to three Hi-C read sets: the entire Hi-C dataset,
Hi-C reads with inserts below 1 kb, and Hi-C reads with inserts above 1 kb.
SNP graph connectivity was analyzed using the simulated mate-pair read sets described
above combined with Hi-C reads aligned and filtered for alignment qualities above or
equal to 60 and for CIGAR encodings of 160 M Read pairs with both ends aligning to
SNP positions were identified and for each corresponding SNP pair an edge was formed.
Shortest path lengths between sampled SNP positions were computed using a custom
breadth-first search program, relying on the Boost Graph Library (http://boost.org).
The program constructs a graph from a user-specified SNP edge list and performs a
breadth-first search to identify the shortest path length between a user-specified number of
randomly selected SNP pairs. We calculated path lengths between 10,000 randomly chosen
SNP pairs. To aid in visualization, the full range of variant separation distances was divided
into 20 kb segments and the average path length was computed for each segment. These
data were smoothed using locally-weighted scatterplot smoothing (LOWESS).
RESULTSThe synthetic microbial community for metagenomic Hi-CFive microorganisms were chosen to test the metagenomic Hi-C approach: Lactobacillus
brevis, Pediococcus pentosaceus, Burkholderia thailandensis, Escherichia coli K12 DH10B
and E. coli BL21 (DE3). These were selected because high quality reference genomes are
available. In addition, the multiple replicons of B. thailandensis and plasmids present in
L. brevis allowed us to explore whether Hi-C might link separate replicons present in the
Beitel et al. (2014), PeerJ, DOI 10.7717/peerj.415 7/19
same cell. We selected two strains of E. coli (K12 and BL21) to evaluate whether Hi-C
sequence data could be used to resolve inter-strain differences. Genome alignment of
these two E. coli shows that 87.9% of their genomes can be aligned and that the average
nucleotide identity across aligned regions is 99.5%. Finally, because differences in cell
membrane structure and GC content could potentially lead to bias in DNA extraction
and/or cross-linking efficiency, we selected two lactic acid bacteria (P. pentosaceus and
L. brevis), which are low-GC, Gram-positive organisms for which only 39.5% of their
genomes can be aligned with 84.3% average nucleotide identity across aligned regions.
Metagenome assemblyWe generated a metagenome assembly of the synthetic microbial community that we could
use as input for our analysis of the utility of Hi-C for species clustering. Hi-C sequencing
data is biased by the distribution of restriction sites for the restriction enzyme used to
construct the library as well as by other factors including GC content, restriction fragment
length, and “mappability” (Yaffe & Tanay, 2011). Hi-C data contain numerous chimeric
sequences and thus are not suitable for de novo contig assembly. Therefore, we simulated
and assembled Illumina metagenomic sequence data at varying coverage levels to yield
the assemblies summarized in (Table S1). The size (bp) of each of these assemblies was
approximately 77% of the sum of the synthetic community reference genome sizes and
this fraction did not change when increasing the quantity of input reads from 5x to 100x.
Alignment of assembled contigs to the collection of reference genomes indicates that
similar regions of the two E. coli genomes were co-assembled into single contigs (data not
shown). The assembly on the lowest amount of input sequence (5x coverage) contained
two misassembled contigs and three misassembled scaffolds. Assemblies at 50x and 100x
coverage were free from misassembled contigs and scaffolds and were similar in terms of
their contig counts, N50s, and total amounts of sequence assembled. We used the 100x
coverage assembly (SOAP-3) for all further analysis.
Hi-C library statisticsA total of 20,623,187 read pairs were obtained from a single MiSeq run to yield ∼6.4 Gb
of raw sequence data. Of these, 98.25% could be aligned back to the reference genomes by
BWA MEM. A total of 21,260,753 (51.55% of original and 52.46% of raw aligned reads)
read pairs were retained after filtering for both reads in the pair aligning at high quality
(MapQ >= 60) and in full (CIGAR = 160 M). Due to either self-ligation or imperfect
enrichment for ligation junctions, most of the reads present in the dataset represent local
genomic DNA fragments. Therefore we classify read pairs mapping within 1,000 nt as
fragment reads, while all other reads are considered to be Hi-C reads (3% of reads).
The abundance of each replicon was estimated using filtered alignments and unfiltered
alignments (Table 1), as well as by normalizing each unfiltered alignment count with
the restriction site counts for each replicon (Table S2). These figures can only be used as
approximate measures of abundance because these values are affected by the frequency of
restriction sites in each organism and a multitude of other confounding factors (Morgan,
Darling & Eisen, 2010). Insert distances derived from the alignment of Hi-C reads to the
Beitel et al. (2014), PeerJ, DOI 10.7717/peerj.415 8/19

Table 1 Species alignment fractions. The number of reads aligning to each replicon present in thesynthetic microbial community are shown before and after filtering, along with the percent of totalconstituted by each species. The GC content (“GC”) and restriction site counts (“#R.S.”) of each replicon,species, and strain are shown. Bur1: B. thailandensis chromosome 1. Bur2: B. thailandensis chromosome2. Lac0: L. brevis chromosome, Lac1: L. brevis plasmid 1, Lac2: L. brevis plasmid 2, Ped: P. pentosaceus,K12: E. coli K12 DH10B, BL21: E. coli BL21. An expanded version of this table can be found in Table S2.
Sequence Alignment % of Total Filtered % of aligned Length GC #R.S.
Lac0 10,603,204 26.17% 10,269,562 96.85% 2,291,220 0.462 629
Lac1 145,718 0.36% 145,478 99.84% 13,413 0.386 3
Lac2 691,723 1.71% 665,825 96.26% 35,595 0.385 16
Lac 11,440,645 28.23% 11,080,865 96.86% 2,340,228 0.46 648
Ped 2,084,595 5.14% 2,022,870 97.04% 1,832,387 0.373 863
BL21 12,882,177 31.79% 2,676,458 20.78% 4,558,953 0.508 508
K12 9,693,726 23.92% 1,218,281 12.57% 4,686,137 0.507 568
E. coli 22,575,903 55.71% 3,894,739 17.25% 9,245,090 0.51 1076
Bur1 1,886,054 4.65% 1,797,745 95.32% 2,914,771 0.68 144
Bur2 2,536,569 6.26% 2,464,534 97.16% 3,809,201 0.672 225
Bur 4,422,623 10.91% 4,262,279 96.37% 6,723,972 0.68 369
Figure 1 Hi-C insert distribution. The distribution of genomic distances between Hi-C read pairs isshown for read pairs mapping to each chromosome. For each read pair the minimum path length onthe circular chromosome was calculated and read pairs separated by less than 1000 bp were discarded.The 2.5 Mb range was divided into 100 bins of equal size and the number of read pairs in each binwas recorded for each chromosome. Bin values for each chromosome were normalized to sum to 1 andplotted.
E. coli K12 genome were distributed in a similar manner as previously reported (Fig. 1;
(Lieberman-Aiden et al., 2009)). We observed a minor depletion of alignments spanning
the linearization point of the E. coli K12 assembly (e.g., near coordinates 0 and 4686137)
due to edge effects induced by BWA treating the sequence as a linear chromosome rather
than circular.
Beitel et al. (2014), PeerJ, DOI 10.7717/peerj.415 9/19
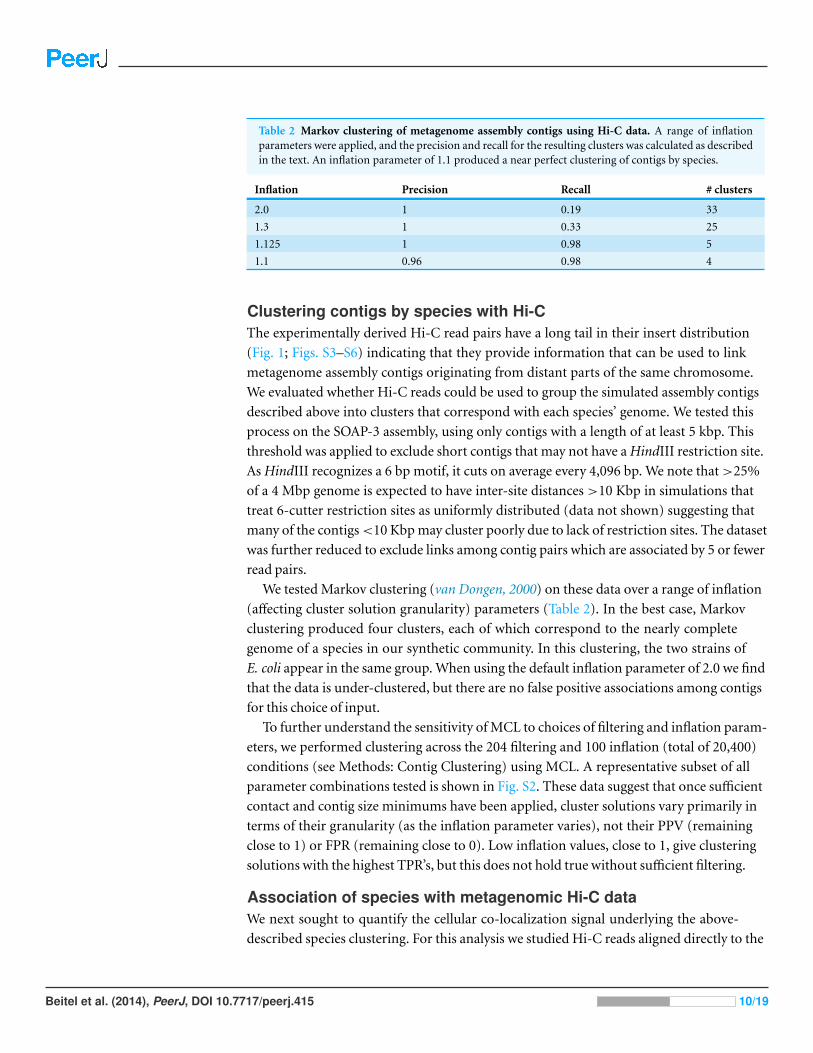
Table 2 Markov clustering of metagenome assembly contigs using Hi-C data. A range of inflationparameters were applied, and the precision and recall for the resulting clusters was calculated as describedin the text. An inflation parameter of 1.1 produced a near perfect clustering of contigs by species.
Inflation Precision Recall # clusters
2.0 1 0.19 33
1.3 1 0.33 25
1.125 1 0.98 5
1.1 0.96 0.98 4
Clustering contigs by species with Hi-CThe experimentally derived Hi-C read pairs have a long tail in their insert distribution
(Fig. 1; Figs. S3–S6) indicating that they provide information that can be used to link
metagenome assembly contigs originating from distant parts of the same chromosome.
We evaluated whether Hi-C reads could be used to group the simulated assembly contigs
described above into clusters that correspond with each species’ genome. We tested this
process on the SOAP-3 assembly, using only contigs with a length of at least 5 kbp. This
threshold was applied to exclude short contigs that may not have a HindIII restriction site.
As HindIII recognizes a 6 bp motif, it cuts on average every 4,096 bp. We note that >25%
of a 4 Mbp genome is expected to have inter-site distances >10 Kbp in simulations that
treat 6-cutter restriction sites as uniformly distributed (data not shown) suggesting that
many of the contigs <10 Kbp may cluster poorly due to lack of restriction sites. The dataset
was further reduced to exclude links among contig pairs which are associated by 5 or fewer
read pairs.
We tested Markov clustering (van Dongen, 2000) on these data over a range of inflation
(affecting cluster solution granularity) parameters (Table 2). In the best case, Markov
clustering produced four clusters, each of which correspond to the nearly complete
genome of a species in our synthetic community. In this clustering, the two strains of
E. coli appear in the same group. When using the default inflation parameter of 2.0 we find
that the data is under-clustered, but there are no false positive associations among contigs
for this choice of input.
To further understand the sensitivity of MCL to choices of filtering and inflation param-
eters, we performed clustering across the 204 filtering and 100 inflation (total of 20,400)
conditions (see Methods: Contig Clustering) using MCL. A representative subset of all
parameter combinations tested is shown in Fig. S2. These data suggest that once sufficient
contact and contig size minimums have been applied, cluster solutions vary primarily in
terms of their granularity (as the inflation parameter varies), not their PPV (remaining
close to 1) or FPR (remaining close to 0). Low inflation values, close to 1, give clustering
solutions with the highest TPR’s, but this does not hold true without sufficient filtering.
Association of species with metagenomic Hi-C dataWe next sought to quantify the cellular co-localization signal underlying the above-
described species clustering. For this analysis we studied Hi-C reads aligned directly to the
Beitel et al. (2014), PeerJ, DOI 10.7717/peerj.415 10/19
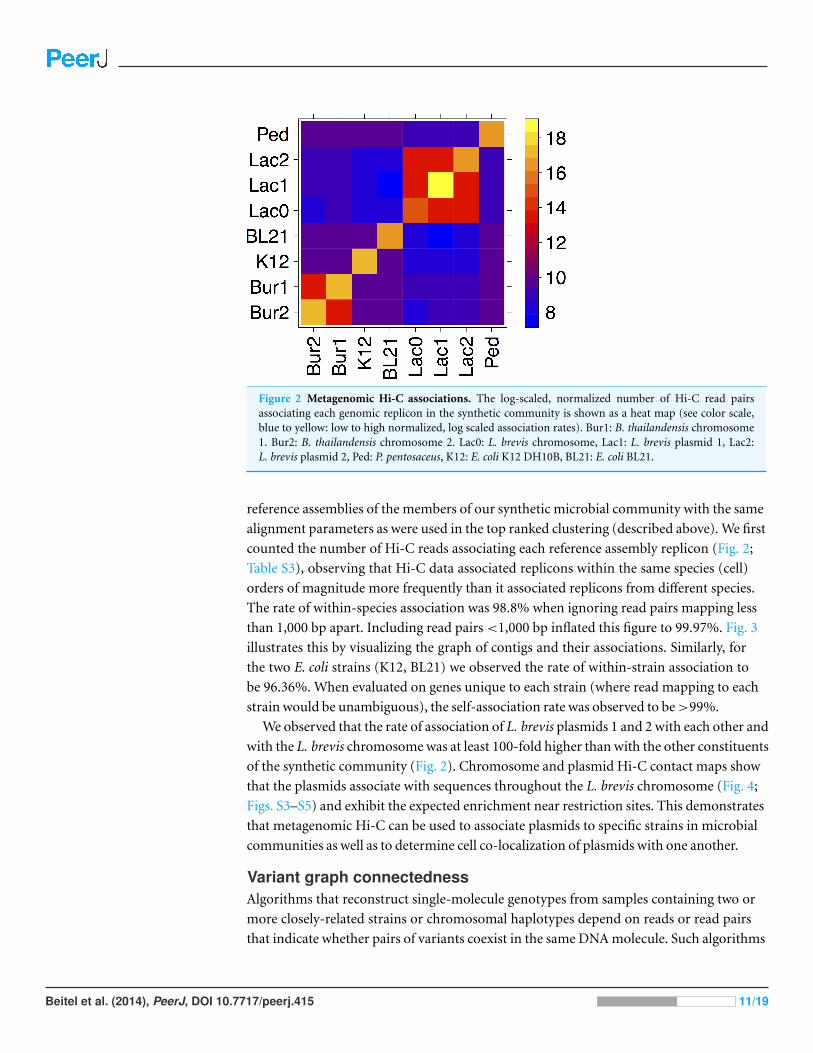
Figure 2 Metagenomic Hi-C associations. The log-scaled, normalized number of Hi-C read pairsassociating each genomic replicon in the synthetic community is shown as a heat map (see color scale,blue to yellow: low to high normalized, log scaled association rates). Bur1: B. thailandensis chromosome1. Bur2: B. thailandensis chromosome 2. Lac0: L. brevis chromosome, Lac1: L. brevis plasmid 1, Lac2:L. brevis plasmid 2, Ped: P. pentosaceus, K12: E. coli K12 DH10B, BL21: E. coli BL21.
reference assemblies of the members of our synthetic microbial community with the same
alignment parameters as were used in the top ranked clustering (described above). We first
counted the number of Hi-C reads associating each reference assembly replicon (Fig. 2;
Table S3), observing that Hi-C data associated replicons within the same species (cell)
orders of magnitude more frequently than it associated replicons from different species.
The rate of within-species association was 98.8% when ignoring read pairs mapping less
than 1,000 bp apart. Including read pairs <1,000 bp inflated this figure to 99.97%. Fig. 3
illustrates this by visualizing the graph of contigs and their associations. Similarly, for
the two E. coli strains (K12, BL21) we observed the rate of within-strain association to
be 96.36%. When evaluated on genes unique to each strain (where read mapping to each
strain would be unambiguous), the self-association rate was observed to be >99%.
We observed that the rate of association of L. brevis plasmids 1 and 2 with each other and
with the L. brevis chromosome was at least 100-fold higher than with the other constituents
of the synthetic community (Fig. 2). Chromosome and plasmid Hi-C contact maps show
that the plasmids associate with sequences throughout the L. brevis chromosome (Fig. 4;
Figs. S3–S5) and exhibit the expected enrichment near restriction sites. This demonstrates
that metagenomic Hi-C can be used to associate plasmids to specific strains in microbial
communities as well as to determine cell co-localization of plasmids with one another.
Variant graph connectednessAlgorithms that reconstruct single-molecule genotypes from samples containing two or
more closely-related strains or chromosomal haplotypes depend on reads or read pairs
that indicate whether pairs of variants coexist in the same DNA molecule. Such algorithms
Beitel et al. (2014), PeerJ, DOI 10.7717/peerj.415 11/19
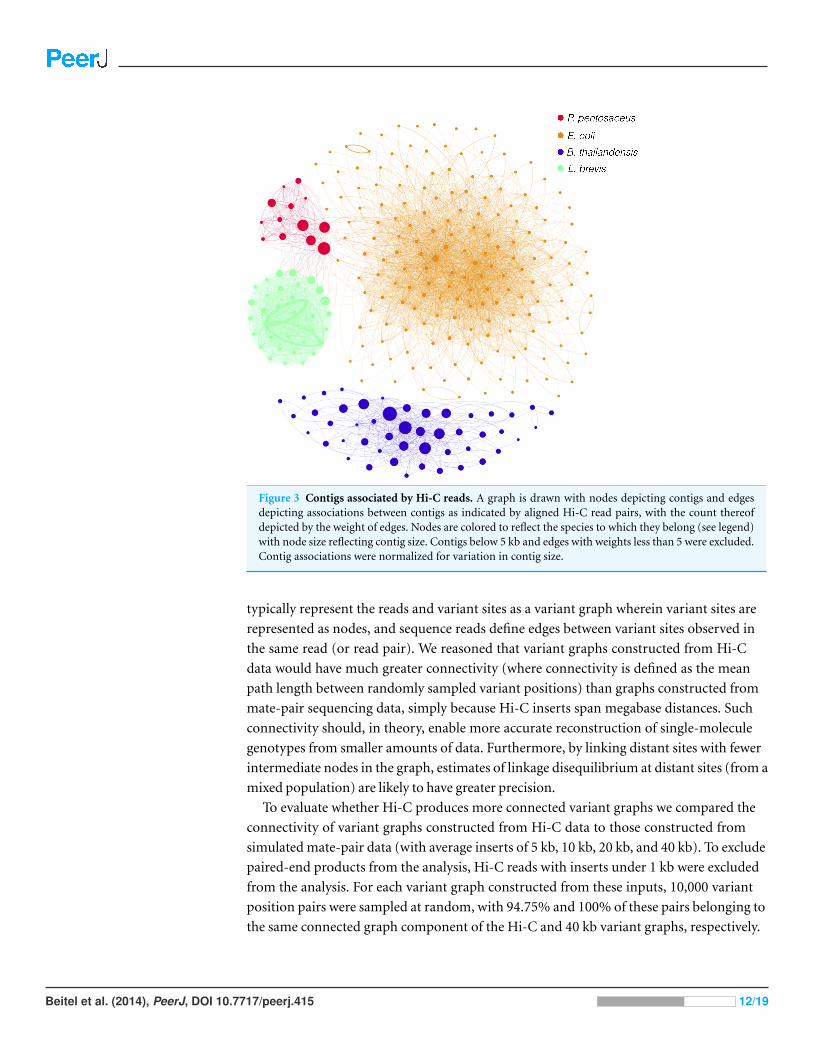
Figure 3 Contigs associated by Hi-C reads. A graph is drawn with nodes depicting contigs and edgesdepicting associations between contigs as indicated by aligned Hi-C read pairs, with the count thereofdepicted by the weight of edges. Nodes are colored to reflect the species to which they belong (see legend)with node size reflecting contig size. Contigs below 5 kb and edges with weights less than 5 were excluded.Contig associations were normalized for variation in contig size.
typically represent the reads and variant sites as a variant graph wherein variant sites are
represented as nodes, and sequence reads define edges between variant sites observed in
the same read (or read pair). We reasoned that variant graphs constructed from Hi-C
data would have much greater connectivity (where connectivity is defined as the mean
path length between randomly sampled variant positions) than graphs constructed from
mate-pair sequencing data, simply because Hi-C inserts span megabase distances. Such
connectivity should, in theory, enable more accurate reconstruction of single-molecule
genotypes from smaller amounts of data. Furthermore, by linking distant sites with fewer
intermediate nodes in the graph, estimates of linkage disequilibrium at distant sites (from a
mixed population) are likely to have greater precision.
To evaluate whether Hi-C produces more connected variant graphs we compared the
connectivity of variant graphs constructed from Hi-C data to those constructed from
simulated mate-pair data (with average inserts of 5 kb, 10 kb, 20 kb, and 40 kb). To exclude
paired-end products from the analysis, Hi-C reads with inserts under 1 kb were excluded
from the analysis. For each variant graph constructed from these inputs, 10,000 variant
position pairs were sampled at random, with 94.75% and 100% of these pairs belonging to
the same connected graph component of the Hi-C and 40 kb variant graphs, respectively.
Beitel et al. (2014), PeerJ, DOI 10.7717/peerj.415 12/19
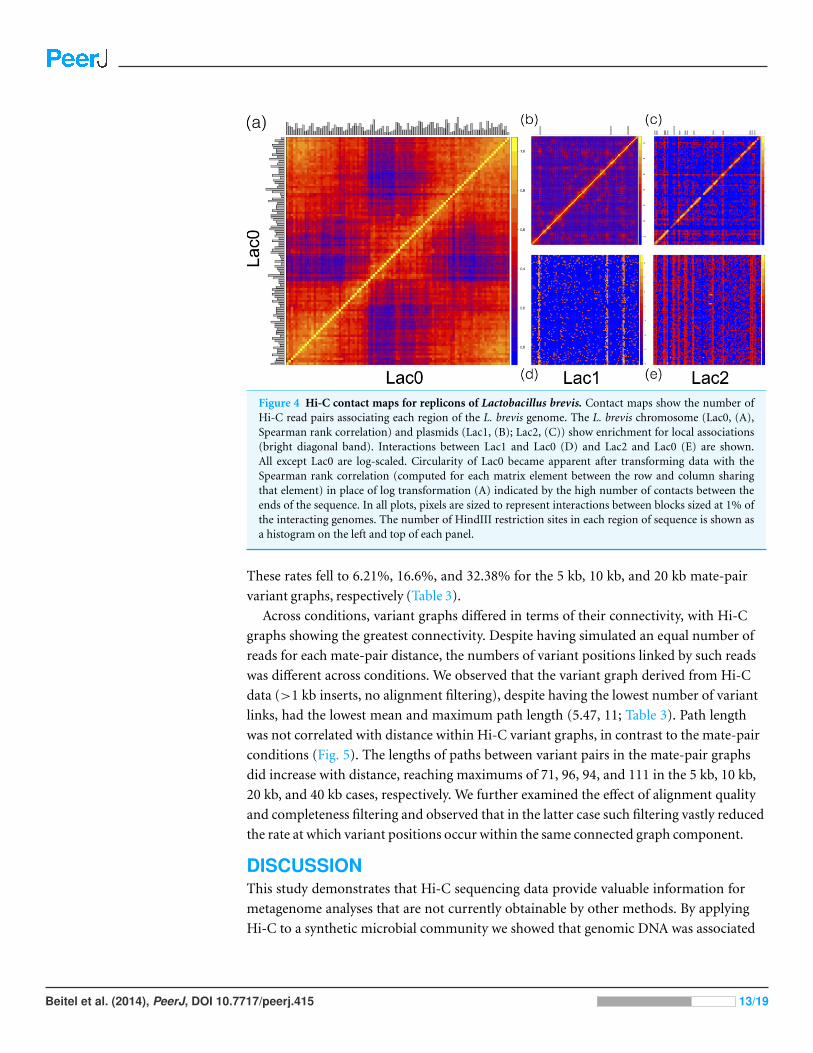
Figure 4 Hi-C contact maps for replicons of Lactobacillus brevis. Contact maps show the number ofHi-C read pairs associating each region of the L. brevis genome. The L. brevis chromosome (Lac0, (A),Spearman rank correlation) and plasmids (Lac1, (B); Lac2, (C)) show enrichment for local associations(bright diagonal band). Interactions between Lac1 and Lac0 (D) and Lac2 and Lac0 (E) are shown.All except Lac0 are log-scaled. Circularity of Lac0 became apparent after transforming data with theSpearman rank correlation (computed for each matrix element between the row and column sharingthat element) in place of log transformation (A) indicated by the high number of contacts between theends of the sequence. In all plots, pixels are sized to represent interactions between blocks sized at 1% ofthe interacting genomes. The number of HindIII restriction sites in each region of sequence is shown asa histogram on the left and top of each panel.
These rates fell to 6.21%, 16.6%, and 32.38% for the 5 kb, 10 kb, and 20 kb mate-pair
variant graphs, respectively (Table 3).
Across conditions, variant graphs differed in terms of their connectivity, with Hi-C
graphs showing the greatest connectivity. Despite having simulated an equal number of
reads for each mate-pair distance, the numbers of variant positions linked by such reads
was different across conditions. We observed that the variant graph derived from Hi-C
data (>1 kb inserts, no alignment filtering), despite having the lowest number of variant
links, had the lowest mean and maximum path length (5.47, 11; Table 3). Path length
was not correlated with distance within Hi-C variant graphs, in contrast to the mate-pair
conditions (Fig. 5). The lengths of paths between variant pairs in the mate-pair graphs
did increase with distance, reaching maximums of 71, 96, 94, and 111 in the 5 kb, 10 kb,
20 kb, and 40 kb cases, respectively. We further examined the effect of alignment quality
and completeness filtering and observed that in the latter case such filtering vastly reduced
the rate at which variant positions occur within the same connected graph component.
DISCUSSIONThis study demonstrates that Hi-C sequencing data provide valuable information for
metagenome analyses that are not currently obtainable by other methods. By applying
Hi-C to a synthetic microbial community we showed that genomic DNA was associated
Beitel et al. (2014), PeerJ, DOI 10.7717/peerj.415 13/19
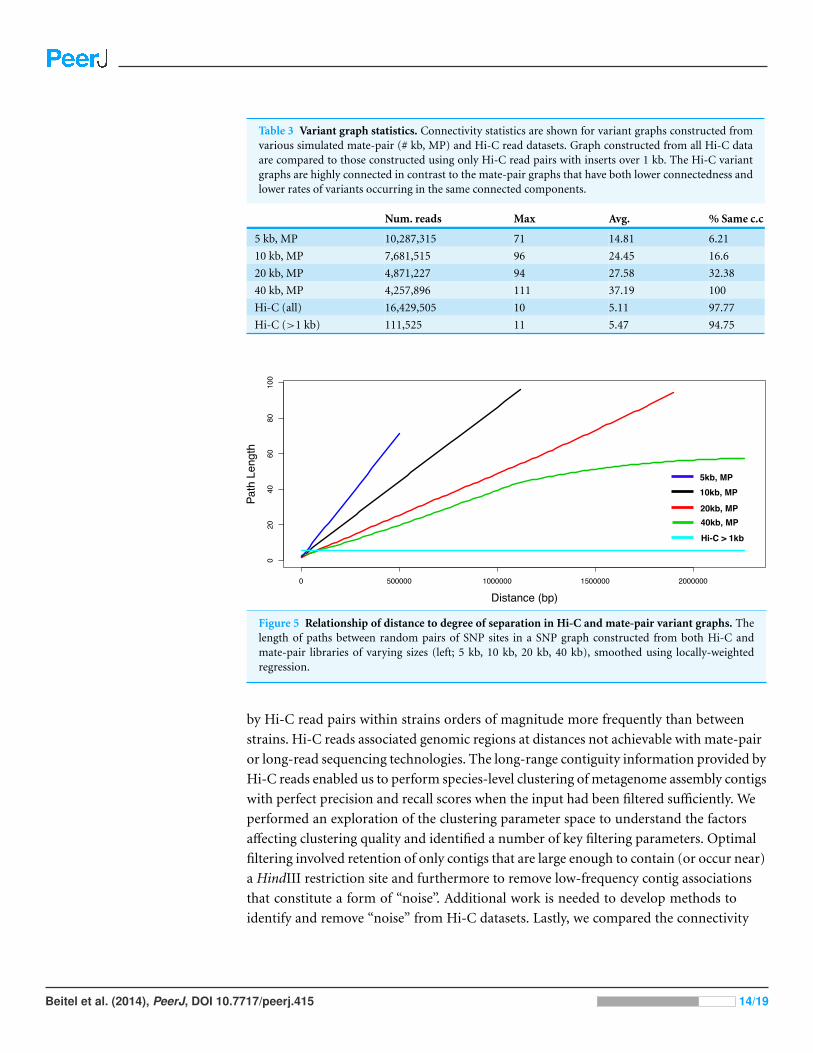
Table 3 Variant graph statistics. Connectivity statistics are shown for variant graphs constructed fromvarious simulated mate-pair (# kb, MP) and Hi-C read datasets. Graph constructed from all Hi-C dataare compared to those constructed using only Hi-C read pairs with inserts over 1 kb. The Hi-C variantgraphs are highly connected in contrast to the mate-pair graphs that have both lower connectedness andlower rates of variants occurring in the same connected components.
Num. reads Max Avg. % Same c.c
5 kb, MP 10,287,315 71 14.81 6.21
10 kb, MP 7,681,515 96 24.45 16.6
20 kb, MP 4,871,227 94 27.58 32.38
40 kb, MP 4,257,896 111 37.19 100
Hi-C (all) 16,429,505 10 5.11 97.77
Hi-C (>1 kb) 111,525 11 5.47 94.75
Figure 5 Relationship of distance to degree of separation in Hi-C and mate-pair variant graphs. Thelength of paths between random pairs of SNP sites in a SNP graph constructed from both Hi-C andmate-pair libraries of varying sizes (left; 5 kb, 10 kb, 20 kb, 40 kb), smoothed using locally-weightedregression.
by Hi-C read pairs within strains orders of magnitude more frequently than between
strains. Hi-C reads associated genomic regions at distances not achievable with mate-pair
or long-read sequencing technologies. The long-range contiguity information provided by
Hi-C reads enabled us to perform species-level clustering of metagenome assembly contigs
with perfect precision and recall scores when the input had been filtered sufficiently. We
performed an exploration of the clustering parameter space to understand the factors
affecting clustering quality and identified a number of key filtering parameters. Optimal
filtering involved retention of only contigs that are large enough to contain (or occur near)
a HindIII restriction site and furthermore to remove low-frequency contig associations
that constitute a form of “noise”. Additional work is needed to develop methods to
identify and remove “noise” from Hi-C datasets. Lastly, we compared the connectivity
Beitel et al. (2014), PeerJ, DOI 10.7717/peerj.415 14/19

of variant graphs constructed from mate-pair and Hi-C read datasets, observing much
greater connectivity in the latter case, illustrating the global nature of the Hi-C signal.
We also observed orders of magnitude greater rates of association between plasmids
and chromosomes of their hosts than between plasmids and the genomes of other species.
Based on this observation, we believe Hi-C has the potential to be used to study horizontal
gene transfer. Given a metagenome assembly, Hi-C provides a means to link plasmid
sequences to chromosomes of the host strain, and may provide the means to detect cases
where plasmids have been transferred among co-existing species of bacteria. We have thus
far demonstrated that Hi-C provides a signal of cell co-localization for the two plasmids
present within the L. brevis genome. Alternative methods do not allow identification of
which cells in a microbial community harbor such mobile DNA elements. Hi-C data
has the potential to help quantify the dynamics of horizontal gene transfer and help
characterize the spread of antibiotic resistance and virulence factors. It remains to be
determined whether this signal will be sufficient to localize small, low-copy, or highly
variable mobile elements within the species that contain them.
The resolving power of Hi-C and related methods such as ChIA-PET (Fullwood et al.,
2009) when applied to complex natural microbial communities is as of yet undetermined.
In principle, as the number of species and genotypes in a community grows the amount
of sequence data required to resolve species and strains also grows. This challenge is
common to all metagenomic approaches and is not specific to the Hi-C method described.
Improvements on metagenomic analysis of complex communities may require integration
of Hi-C data with other information sources such as sequence composition, phylogeny,
and measurements of abundance.
The problems of differentiating contigs originating from different species is similar
to that of differentiating contigs originating from different chromosomes of the same
species. Recently a study reported the use of Hi-C to perform genome scaffolding of several
individual eukaryotic genomes, first by inferring chromosomal groupings of contigs and
then ordering sequences along the chromosome (Burton et al., 2013). Markov Clustering of
Hi-C association data may be used to cluster contigs into chromosomal groups without
specifying the number of chromosomes a priori. This may be important for samples
where the number of chromosomes (e.g., tumor samples), species, or species abundances
(e.g., environmentally-isolated microbial communities) are not known.
Hi-C analysis can be applied to communities other than environmentally-isolated
microbial communities, such as pools of BAC clones. Heterogeneous tumor populations
are analogous in some ways to microbial communities and Hi-C may be applied to identify
sub-populations therein. The problem of resolving the membership of variants in closely
related strains (between different cells) shares some common features with the problem of
differentiating closely related haplotypes within polyploid eukaryotic genomes (within the
same cells). Recent work has demonstrated that Hi-C data can be used to phase haplotypes
in a diploid organism (Selvaraj et al., 2013). Our analysis indicates that the average degree
of separation between variants within a Hi-C variant graph is dramatically lower than
that in mate-pair variant graphs. This is significant because as the degree of separation
Beitel et al. (2014), PeerJ, DOI 10.7717/peerj.415 15/19
between distant graph regions grows, error is compounded and the reliability of inferences
regarding the phase of these regions declines. Our analysis thus indicates that Hi-C data
provide an informative signal for the analysis of haplotype and strain mixtures.
ACKNOWLEDGEMENTSWe wish to acknowledge the substantial efforts of Michael Lewis, administrator of the
UC Davis Genome Center Cluster Computing Resource, to provide and maintain the
computing resources on which these analyses were performed. We would also like to
acknowledge Matthew DeMaere (UTS) for his contribution to Fig. 3.
ADDITIONAL INFORMATION AND DECLARATIONS
FundingThis work was supported by a gift from MARS, Inc. and by Department of Homeland
Security contract #HSHQDC-11-C-00091. The funders had no role in study design, data
collection and analysis, decision to publish, or preparation of the manuscript.
Grant DisclosuresThe following grant information was disclosed by the authors:
MARS, Inc.
Department of Homeland Security contract: HSHQDC-11-C-00091.
Competing InterestsJonathan Eisen is an Academic Editor for PeerJ. The authors declare there are no competing
interests.
Author Contributions• Christopher W. Beitel conceived and designed the experiments, performed the
experiments, analyzed the data, wrote the paper, prepared figures and/or tables,
reviewed drafts of the paper, and conceived the method.
• Lutz Froenicke conceived and designed the experiments, performed the experiments,
reviewed drafts of the paper, and prepared Hi-C libraries.
• Jenna M. Lang conceived and designed the experiments, performed the experiments,
contributed reagents/materials/analysis tools, reviewed drafts of the paper, and prepared
the mixture.
• Ian F. Korf conceived and designed the experiments, analyzed the data, and reviewed
drafts of the paper.
• Richard W. Michelmore and Jonathan A. Eisen conceived and designed the experiments,
contributed reagents/materials/analysis tools, and reviewed drafts of the paper.
• Aaron E. Darling conceived and designed the experiments, analyzed the data, wrote the
paper, prepared figures and/or tables, reviewed drafts of the paper, and conceived the
method.
Beitel et al. (2014), PeerJ, DOI 10.7717/peerj.415 16/19
DNA DepositionThe following information was supplied regarding the deposition of DNA sequences:
Sequence Read Archives submission SRX377733.
Data DepositionAnalysis scripts can be found at https://github.com/cb01/proxmine. Simulated assemblies
are available at
http://dx.doi.org/10.6084/m9.figshare.1004473,
http://dx.doi.org/10.6084/m9.figshare.1004472, and
http://dx.doi.org/10.6084/m9.figshare.1004471
Supplemental InformationSupplemental information for this article can be found online at http://dx.doi.org/
10.7717/peerj.415.
REFERENCESAngly FE, Willner D, Rohwer F, Hugenholtz P, Tyson GW. 2012. Grinder: a versatile amplicon
and shotgun sequence simulator. Nucleic Acids Research 40(12):e94 DOI 10.1093/nar/gks251.
Bastian M, Heymann S, Jacomy M. 2009. Gephi: an open source software for exploring andmanipulating networks. In: Adar E, Hurst M, Finin T, Glance NS, Nicolov N, Tseng BL, eds.The international conference on weblogs and social media. The AAAI Press.
Blainey P. 2013. The future is now: single-cell genomics of bacteria and archaea. FEMSMicrobiology Reviews 37(3):1–29 DOI 10.1111/1574-6976.12015.
Burton JN, Adey A, Patwardhan RP, Qiu R, Kitzman JO, Shendure J. 2013. Chromosome-scalescaffolding of de novo genome assemblies based on chromatin interactions. NatureBiotechnology 31(12):1119–1125 DOI 10.1038/nbt.2727.
Darling AE, Mau B, Perna NT. 2010. ProgressiveMauve: multiple genome alignment with genegain, loss and rearrangement. PLoS ONE 5(6):e11147 DOI 10.1371/journal.pone.0011147.
Droge J, McHardy AC. 2012. Taxonomic binning of metagenome samples generated bynext-generation sequencing technologies. Briefings in Bioinformatics 13(6):646–655DOI 10.1093/bib/bbs031.
Eid J, Fehr A, Gray J, Luong K, Lyle J, Otto G, Peluso P, Rank D, Baybayan P, Bettman B,Bibillo A, Bjornson K, Chaudhuri B, Christians F, Cicero R, Clark S, Dalal R, Dixon J,Foquet M, Gaertner A, Hardenbol P, Heiner C, Hester K, Holden D, Kearns G, Kong X,Kuse R, Lacroix Y, Lin S, Lundquist P, Ma C, Marks P, Maxham M, Murphy D, Park I,Pham T, Phillips M, Roy J, Sebra R, Shen G, Sorenson J, Tomaney A, Travers K, Trulson M,Vieceli J, Wegener J, Wu D, Yang A, Zaccarin D, Zhao P, Zhong F, Korlach J, Turner S. 2009.Real-time DNA sequencing from single polymerase molecules. Science 323(January):133–138DOI 10.1126/science.1162986.
Fullwood MJ, Liu MH, Pan YF, Liu J, Xu H, Bin Mohamed Y, Orlov YL, Velkov S, Ho A,Mei PH, Chew EGY, Huang PYH, Welboren W-J, Han Y, Ooi HS, Ariyaratne PN, Vega VB,Luo Y, Tan PY, Choy PY, Wansa KDSA, Zhao B, Lim KS, Leow SC, Yow JS, Joseph R, Li H,Desai KV, Thomsen JS, Lee YK, Karuturi RKM, Herve T, Bourque G, Stunnenberg HG,Ruan X, Cacheux-Rataboul V, Sung W-K, Liu ET, Wei C-L, Cheung E, Ruan Y. 2009. An
Beitel et al. (2014), PeerJ, DOI 10.7717/peerj.415 17/19

oestrogen-receptor-alpha-bound human chromatin interactome. Nature 462(7269):58–64DOI 10.1038/nature08497.
Gilbert JA, Dupont CL. 2011. Microbial metagenomics: beyond the genome. Annual Review ofMarine Science 3(1):347–371 DOI 10.1146/annurev-marine-120709-142811.
Handelsman J. 2004. Metagenomics: application of genomics to uncultured microorganisms.Microbiology and Molecular Biology Reviews 68(4):669–685DOI 10.1128/MMBR.68.4.669-685.2004.
Howe AC, Jansson JK, Malfatti SA, Tringe SG, Tiedje JM, Brown CT. 2014. Tackling soil diversitywith the assembly of large, complex metagenomes. Proceedings of the National Academy ofSciences of the United States of America 111(13):4904–4909 DOI 10.1073/pnas.1402564111.
Hugenholtz P. 2002. Exploring prokaryotic diversity in the genomic era. Genome Biology 3(2):reviews0003–reviews0003.8 DOI 10.1186/gb-2002-3-2-reviews0003.
Konopka A. 2009. What is microbial community ecology? The ISME Journal 3(11):1223–1230DOI 10.1038/ismej.2009.88.
Li H. 2013. Aligning sequence reads, clone sequences and assembly contigs with BWA-MEM.Available at http://arxiv.org/abs/1303.3997.
Lieberman-Aiden E, van Berkum NL, Williams L, Imakaev M, Ragoczy T, Telling A, Amit I,Lajoie BR, Sabo PJ, Dorschner MO, Sandstrom R, Bernstein B, Bender MA, Groudine M,Gnirke A, Stamatoyannopoulos J, Mirny LA, Lander ES, Dekker J. 2009. Comprehensivemapping of long-range interactions reveals folding principles of the human genome. Science326(5950):289–293 DOI 10.1126/science.1181369.
Luo R, Liu B, Xie Y, Li Z, Huang W, Yuan J, He G, Chen Y, Pan Q, Liu Y, Tang J, Wu G,Zhang H, Shi Y, Liu Y, Yu C, Wang B, Lu Y, Han C, Cheung DW, Yiu S-M, Peng S,Xiaoqian Z, Liu G, Liao X, Li Y, Yang H, Wang J, Lam T-W, Wang J. 2012. SOAPdenovo2:an empirically improved memory-efficient short-read de novo assembler. GigaScience1(1):18 DOI 10.1186/2047-217X-1-18.
Maitra RD, Kim J, Dunbar WB. 2012. Recent advances in nanopore sequencing. Electrophoresis33(23):3418–3428 DOI 10.1002/elps.201200272.
Morgan JL, Darling AE, Eisen JA. 2010. Metagenomic sequencing of an in vitro-simulatedmicrobial community. PLoS ONE 5(4):e10209 DOI 10.1371/journal.pone.0010209.
Pruitt KD, Tatusova T, Brown GR, Maglott DR. 2012. NCBI reference sequences (RefSeq):current status, new features and genome annotation policy. Nucleic Acids Research 40(Databaseissue):D130–D135 DOI 10.1093/nar/gkr1079.
Selvaraj S, Dixon JR, Bansal V, Ren B. 2013. Whole-genome haplotype reconstruction usingproximity-ligation and shotgun sequencing. Nature Biotechnology 31(November):1111–1118DOI 10.1038/nbt.2728.
Staley JT. 1985. Measurement of in situ activities of nonphotosynthetic microorganismsin aquatic and terrestrial habitats. Annual Review of Microbiology 39:321–346DOI 10.1146/annurev.mi.39.100185.001541.
Treangen TJ, Koren S, Sommer DD, Liu B, Astrovskaya I, Ondov B, Darling AE, Phillippy AM,Pop M. 2013. MetAMOS: a modular and open source metagenomic assembly and analysispipeline. Genome Biology 14(1):R2 DOI 10.1186/gb-2013-14-1-r2.
Treangen TJ, Salzberg SL. 2012. Repetitive DNA and next-generation sequencing: computationalchallenges and solutions. Nature Reviews Genetics 13(1):36–46 DOI 10.1038/nrg3117.
Beitel et al. (2014), PeerJ, DOI 10.7717/peerj.415 18/19
The R Core Development Team. 2010. R: a language and environment for statistical computing.Vol. 1. Vienna: R Foundation for Statistical Computing. Available at http://www.r-project.org/.
Umbarger M, Toro E, Wright M, Porreca GJ, Bau D, Hong S-H, Fero MJ, Zhu LJ, Marti-Renom MA, McAdams HH, Shapiro L, Dekker J, Church GM. 2011. The three-dimensionalarchitecture of a bacterial genome and its alteration by genetic perturbation. Molecular Cell44(2):252–264 DOI 10.1016/j.molcel.2011.09.010.
van Dongen S. 2000. Graph clustering by flow simulation. PhD thesis, University of Utrecht. May.
Woyke T, Sczyrba A, Lee J, Rinke C, Tighe D, Clingenpeel S, Malmstrom R, Stepanauskas R,Cheng J. 2011. Decontamination of MDA reagents for single cell whole genome amplification.PLoS ONE 6(10):e26161 DOI 10.1371/journal.pone.0026161.
Yaffe E, Tanay A. 2011. Probabilistic modeling of Hi-C contact maps eliminates systematicbiases to characterize global chromosomal architecture. Nature Genetics 43(11):1059–1065DOI 10.1038/ng.947.
Beitel et al. (2014), PeerJ, DOI 10.7717/peerj.415 19/19