Embed Size (px)
Citation preview
1
STRAIN HARDENING AND DISLOCATION AVALANCHES IN MICROMETER-‐SIZED DIMENSIONS
Jorge Alcalá1, Jan Očenášek2, Kai Nowag3, Daniel Esqué-de los Ojos3, Rudy Ghisleni3, Johann Michler3
1Department of Materials Science and Metallurgical Engineering, GRICCA. EUETIB and ETSEIB. Universitat Politècnica de Catalunya, 08028 Barcelona, Spain. 2New Technologies Research Centre, University of West Bohemia in Pilsen, 30614 Plzeň, Czech Republic. 3Laboratory for Mechanics of Materials and Nanostructures, EMPA: Swiss Federal Laboratories for Materials Science and Technology, 3602 Thun, Switzerland.
Abstract
Present experiments and computational simulations furnish a fundamental background to the understanding of plastic flow across sample sizes. It is shown that self-organized criticality (SOC) governs the size distribution of dislocation avalanches in micrometer-sized sample dimensions. Onset of SOC denotes inception of a dislocation network so that dislocation avalanches occur at constant criticality level irrespectively of the applied stress. In these microcrystals, we find that the ratio between the characteristic sample dimension and the mean free path travelled by the mobile dislocations, 𝐷/𝐿!"", rules onset of strain hardening. This index simultaneously accounts for the role of loading orientation and dislocation density upon microscale plasticity. It is shown that strain-hardening emerges for 𝐷/𝐿!"" > 2, where surface dislocation annihilations are inconsequential to network development and the flow stress scales with dislocation density. This regime naturally evolves towards bulk plasticity at increasing sample sizes. Conversely, strain hardening is suppressed when confining sample dimensions dominate plastic flow for 𝐷/𝐿!!! < 1.5. Confining microscale plasticity is characterized by a significant increase in the size of dislocation avalanches under a stagnant dislocation network.
Keywords: Crystal plasticity, mechanical properties, dislocations, strain hardening.
Submitted to Acta Materialia August 2014
2
1. Introduction
Strain hardening is a distinctive feature in crystal plasticity, where the flow stress
increases during load application due to the development of an entangled dislocation
network [1—3]. The physical underpinning between plastic flow and the increase in
dislocation density is however absent in submicrometer-sized crystals where dislocation
annihilations at the free surface limits dislocation storage [4—6]. In such confining
sample sizes, sudden activation and deactivation of surface-truncated (single-ended)
dislocation sources under increasing applied stresses produces an intermittent supply of
mobile dislocation segments. As such source-exhaustion hardening mechanisms come
into play, the stress—strain curve is found to exhibit marked plastic bursts [7—9].
A central aspect in the understanding of crystal plasticity concerns assessment of the
transition between confining and bulk plastic flow [10—13]. This is a complex issue to
analyze because of the vast dislocation density arising in micrometer-sized samples [13]
and its sensitivity to loading orientation. Onset of bulk strain hardening would be
therefore facilitated in dislocation networks arising under such multiple-glide loading
orientations that exhibit strong dislocation interactions and storage. Surface dislocation
annihilations and the emergence of confining plasticity would then be enhanced in
multiple or single glide orientations where milder dislocation interactions occur.
The fundamental discreteness of crystal plasticity is due to the onset of dislocation
avalanches. Mean-field statistical analyses indicate that the probability density of
dislocation avalanche slips fulfills a universal power-law (scale-invariant) form similar
to that describing other physical instabilities such as earthquakes in fault systems [14—
17]. Knowledge is however unavailable on whether transition from bulk to confining
plasticity fundamentally affects avalanche development.
3
The following are the main purposes for this investigation. First, we seek to provide a
thorough analysis to the emergence of strain hardening in small sample dimensions.
Mean-field (continuum) crystal plasticity is central to this work, as the behavior of a
random dislocation population is averaged using uniform dislocation densities. Whereas
a preconceived idea appears to be that such analyses may not hold in microscopic
crystals [12, 18, 19], our experiments show that a deterministic understanding to
microscale plasticity and its evolution across sample dimensions becomes accessible
through this scheme. Secondly, it is our purpose to furnish experimental evidence on the
influence of strain hardening upon the size distribution of dislocation avalanches. This
investigation therefore provides a solid mean-field mechanical and statistical
comprehension to the evolution of plasticity across sample dimensions.
2. Uniaxial stress—strain curves and the counting of dislocation avalanches
Present investigation comprises 40 micropillar compression experiments performed in
copper single crystals with diameters D = 1.2, 2.0, 7.0 and 20 µm and aspect ratio
(diameter:length) of 1:3. The micropillars were manufactured by Focused Ion Beam
(FIB) milling from (i) a well-annealed copper single crystal with the <111> orientation
and (ii) single grains with the <012> and <001> orientations –as measured by Electron
Back-Scatter Diffraction (EBSD)– from a polycrystalline copper sample. This
polycrystalline sample had been previously heat-treated in vacuum to obtain substantial
grain growth to a final average size of 30 µm. During machining, FIB energy was set at
30 KeV while a low value of 180 pA was selected for the beam current in the final step.
The load—displacement curves were recorded using an in-house system operating in
true displacement (strain) control inside the chamber of a Scanning Electron
Microscope (SEM). This allows for unique assessments of dislocation avalanches. The
4
imposed displacement rate was set to 2 nm/s in all experiments. Representative uniaxial
stress—strain curves are shown in Figs. 1 (a) and (b).
Plastic intermittencies produced at an externally applied strain-rate of ≈ 4 × 10!! s-1
are illustrated in the highly magnified portions of the stress—strain curves in Fig. 2.
Uniaxial displacements Δ𝑢! containing a number of stress serrations (where each
serration is associated with an individual dislocation avalanche) are shown in Fig. 2(a).
One such plastic displacement Δ𝑢 is characterized in that the applied stress remains
below its initial level as marked by the arrows in Fig. 2(a). In the absence of strain-rate
effects, this is equivalent to a plastic intermittency produced in more conventional
experiments driven under load (stress) control. The associated slip is then given by
𝑠! = Δ𝑢SF , (1)
where SF is the Schmid factor in the active slip systems.
Fig. 2(b) shows slip 𝑠! produced by an individual dislocation avalanche. The avalanche
is characterized by stress serration Δ𝜎 = 𝜎!"# − 𝜎!"# and by plastic displacement Δ𝑢
accumulating along the pillar length 𝑙. Since 𝑠! × SF/𝑙 is the accumulated uniaxial
plastic strain Δ𝜀, which necessarily equals ∆𝜎/𝐸, it follows that
𝑠! = 𝑁𝑏 = 𝑙 Δσ /(𝐸 × SF) , (2)
where 𝑁 is the number of dislocations contained in the avalanche, b is the magnitude of
the Burgers vector and 𝐸 is the elastic stiffness of the compressed micropillar.
Experimental fluctuations during testing translate into an uncertainty of ∆𝜎 = 1 MPa.
Current statistical analyses of dislocation avalanches are performed with an uncertainty
stress threshold ∆𝜎 that is three times greater, so that the size of the minimum
discernable slip becomes 𝑠! = 1.86b, 1.43b and 1.84b for the <111>, <012> and <001>
pillar orientations, respectively (Eq. (2)).

5
3. Theoretical background and mean-field models
3.1. Bulk crystal plasticity and the mean free path travelled by dislocations
Continuum descriptions of crystal plasticity allow prediction of the stress—strain curves
in bulk single crystals. Advanced models are based on detailed knowledge of short-
range stresses that govern junction formation [20, 21]. Short-range interactions are
smoothened in space so that the critical shear stress 𝜏! for dislocation mobilization in
any arbitrary slip system 𝛼 scales with the forest dislocation density 𝜌! (length of
dislocation lines per unit volume) in all interacting slip systems 𝛽. This is expressed by
𝜏! = 𝜇𝑏 𝑎!"!
𝜌! , (3)
where 𝛼 and 𝛽 run from 1 to 12 to account for all slip systems in fcc crystals, 𝑎!" is a
matrix prescribing Cottrell-Lomer, collinear, coplanar, glissile and Hirth dislocation
interactions from discrete dislocation dynamics (DDD) simulations [20, 21] and µ is the
shear modulus. The slip system combinations that produce the above interactions are
given in [22]. The influence of dislocation density in matrix 𝑎!" is then written as [21]
𝑎!" = 𝑎!",!"#log 1/𝑏 𝑎 𝜌! log 1/𝑏 𝑎 𝜌!"#
(4)
where 𝑎 = 0.35 and coefficients 𝑎!",!"# are given in Table 1.
The essential strain hardening mechanism elucidated from DDD simulations in pure
crystals is that a dislocation lying in slip system 𝛼 becomes immobile because of
junction zipping processes with the interacting (forest) dislocations. The dislocation is
then mobilized with increasing stress through junction unzipping. Parameter 𝐿!""
measures the effective mean free path swept by the mobile segment during its free flight
6
in subsequent stages of mobilization and arrest. 𝐿!"" decreases with plastic straining in
accordance with the classical dislocation-storage law [3]
𝑑𝜌!
𝑑𝛾! =1𝑏
1𝐿!""
, (5)
where 𝑑𝛾! is the shear strain increment in system 𝛼 and 𝑑𝜌! is the increment of
dislocation density associated with the junction forming processes.
Coarse-graining of DDD simulations has recently provided a detailed model for the
evolution of the mean free path length 𝐿!"" during plastic straining [20, 21], where
1𝐿!""
=1𝐿!"#
+𝑎!𝜌!
𝐾!+
𝑎!𝜌!"!"
𝐾! , (6)
In Eq. (6) 𝐿!"# accounts for the different Lomer, glissile, Hirth and collinear dislocation
interactions with the forest β systems; subscripts o and c indicate self (𝛼 = 𝛽) and
coplanar interactions, respectively; superscript 𝛽𝑐 refers to specific slip systems
producing coplanar interactions with the primary 𝛼 system; and K and a are the
dislocation interaction coefficients. Parameter 𝐿!"# is given by
1𝐿!"#
=𝑝!𝑘!
𝑎!" 𝜌! + 𝜌!"#!!
𝜌!
𝜌! + 𝜌!"#!𝑎!"𝜌!
!1−
𝜌!"#!
𝜌! , (7)
where the evolution of the junction density stored in system 𝛼 becomes
𝑑𝜌!"#! = 𝜅!𝑝!𝑘!𝑏
𝜌! 𝑎!"𝑑𝛾!!
𝑎!"(𝜌! + 𝜌!"#! )!
1−𝜌!"#!
(𝑛 − 1)𝜌! , (8)
n is the number of active systems, and po, ko and ko are dimensionless constants ruling
junction properties (Table 1).
Notice that the above model exclusively relies on the fundamentals of junction zipping
and unzipping phenomena from DDD simulations. It is therefore explicitly assumed that
7
strain hardening is not affected by the onset of substructural dislocation arrangements or
patterning. This simplification is supported by Ref. [23], where Eq. (3) emerges from
experiments irrespectively of dislocation patterning.
Under the framework of continuum crystal plasticity [24], plastic deformations are in
accordance with
𝐅 ∙ 𝐅!! = d𝛾! 𝐬!⨂ 𝐦!
!
, (9)
where F is the rate of the deformation gradient tensor 𝐅, and 𝐬! and 𝐦! are the
normalized vectors prescribing the slip direction and the slip plane, respectively. The
Lagrangian finite-strain tensor 𝛆 is then constructed as
𝛆 = !!𝐅! ⋅ 𝐅− 𝐈 , (10)
where superscript T denotes the transposed of the tensor and I is the unit tensor.
3.2. Statistical analyses for the size distribution of dislocation avalanches
Mean-field analyses indicate that the probability density P of slips 𝑠 carried by
dislocation avalanches follows scale-invariant form 𝑃 ∼ 𝑠!!.! in crystals strained above
10-‐4 s-‐1 where slow relaxation process can be neglected [14—16, 25—29]. The
probability density then exhibits a cut-off at a maximum avalanche slip 𝑠!"# that
depends on crystal size. Both of these features are captured through
𝑃 𝑠 ∼ 𝑠!!.! exp 𝑠 (𝜏∗ − 𝜏)! , (11)
where 𝑠!"# ∼ 𝜏∗ − 𝜏 !! , 𝜏 is the applied stress and 𝜏∗ is the criticality stress level in
the crystal [16, 17, 27]. The concept of stress tuned criticality (STC) therefore arises as
𝑠!"# increases when 𝜏 approaches 𝜏∗ [17]. Continuum dislocation theory and DDD
simulations support Eq. (11) in the absence of dislocation storage, where 𝜏∗ thus
assimilates to the yield stress [27]. The simulations further show that 𝜏∗ decreases with
8
increasing crystal size. At constant applied stress 𝜏, such size effects result in a raise of
𝑠!"# because of the associated decrease in the magnitude of (𝜏∗ − 𝜏).
A corollary from Eq. (11) is that the complementary cumulative distribution function of
avalanche slips 𝐶(𝑠) –the fraction of avalanches with slip greater than 𝑠 plotted in terms
of 𝑠– is binned by stress [16, 27]. Hence, function 𝐶(𝑠) spreads out depending on the
applied stress 𝜏. The stress-integrated complementary cumulative distribution 𝐶(𝑠)!"# is
however independent of stress and fulfills 𝐶(𝑠)!"# ∼ 𝑠!! [16, 27]. Recent experimental
measurements in submicrometer-sized pillars [16] have confirmed the stress binning of
𝐶(𝑠) as well as the relationship 𝐶(𝑠)!"# ∼ 𝑠!!, thus supporting the fundamental
conception in that plastic intermittencies are tuned by stress (Eq. (11)).
In addition to the above analyses, the following relation has been used to model the
distribution of slips with characteristic maximum size 𝑠!"# (e.g., see [15, 28])
𝑃 𝑠 ∼ 𝑠!!.!exp − 𝑠 𝑠!"#!
. (12)
The conception in that 𝑠!"# is independent of stress arises when Eq. (12) is invoked in
the context of self-organized criticality (SOC), where the crystal spontaneously evolves
towards a critical state with characteristic slip 𝑠!"# [30, 31]. This theory fundamentally
contradicts STC. Finally, according to the SOC analyses in [15], 𝑠!"# would mildly
depend on the slope 𝜃 of the stress—strain curve in the general case when 𝜃 ≪ 𝐸.
4. Correlation between experiments and mean-field analyses
4.1. Experimental assertions of strain hardening
The experimentally measured stress—strain curves in Fig. 1 show development of an
incipient plasticity stage for 𝜏! < 𝜏 < 𝜏!. The stress level at the onset of plastic flow
9
follows 𝜏! ∝ 𝐷!! with 𝑚 ≈ 0.35. Exponent 𝑚 was found to increase towards ≈ 0.6
when the flow stress 𝜏! was measured at a uniaxial strain 𝜀 = 3% [13].
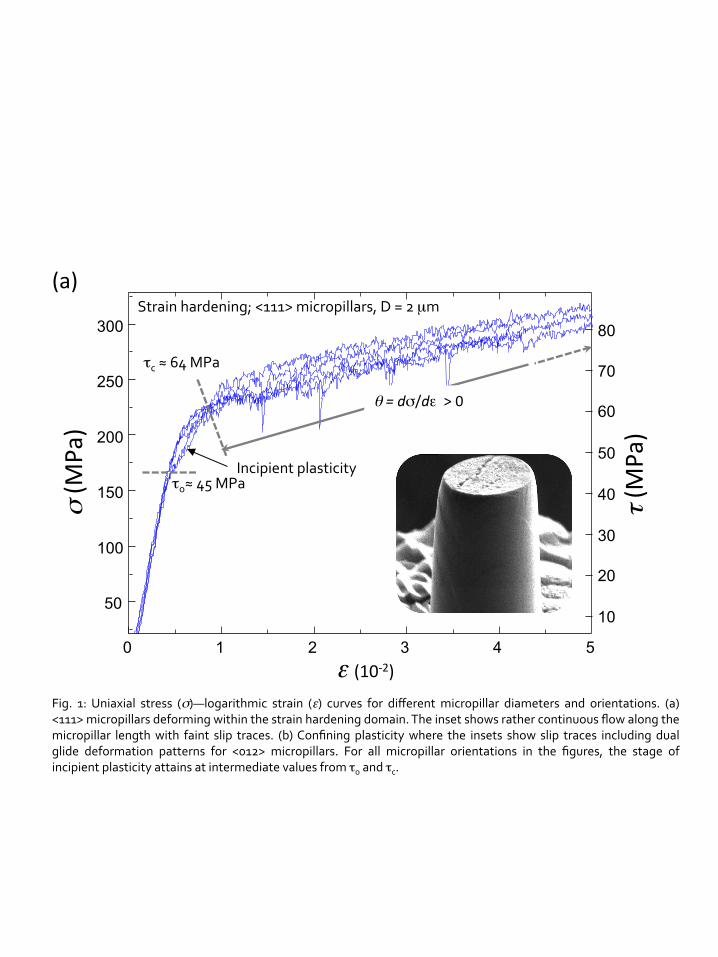
For <111> micropillars with 𝐷 ≥ 2 µm (Fig. 1(a)), the subsequent (generalized) plastic
flow attaining at 𝜏 > 𝜏! is indicative of net dislocation storage as the stress—strain
curves averaged over a number of stress serrations exhibit sustained hardening
(𝜃 = d𝜎/d𝜖 > 0). This interpretation is in accordance with the DDD simulations in
[32] for microcrystals with 𝐷 > 1 µm, as source-exhaustion hardening in the absence of
dislocation storage produces pronounced hardening saturation (𝜃 → 0).
From the above, it stems that dislocation storage during generalized plastic flow
necessarily requires onset of a dense dislocation network within the incipient plasticity
stage (𝜏! < 𝜏 < 𝜏!) through simultaneous activations of multiple truncated sources.
Insufficient dislocation storage consequently emanates from the shape of the stress—
strain curves in Fig. 1(b), where the flow stress fluctuates about a constant level.
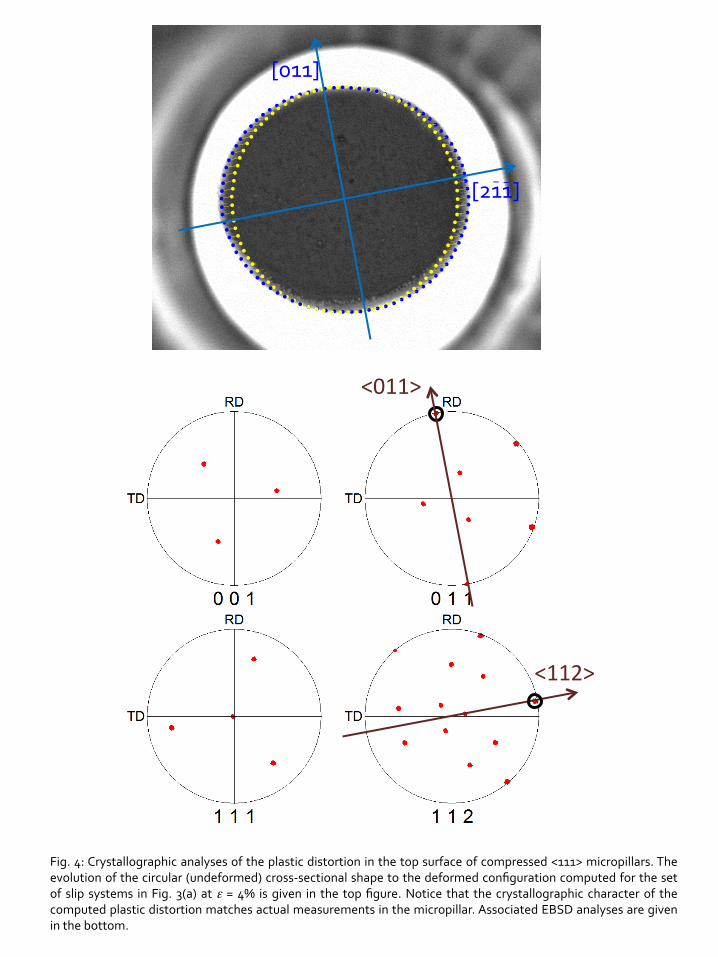
4.2 Assessing slip system activity
This section describes a method to assess slip system activity in micropillar
compression experiments. The method employs EBSD measurements of the plastic
distortion in the top surface of compressed micropillars (Figs. 3 and 4).
For a given micropillar orientation, we start by assuming a fixed d𝛾! < 1 × 10⁻⁴ in a
postulated set of active slip systems. Eq. (9) is then solved yielding deformation
gradient tensor 𝐅 for each given 𝛾! level. The individual components of this tensor
enable mapping of the material points in the cross-section into their final position at any
uniaxial strain level. Agreement between the computed and experimentally measured
cross-sectional shapes indicates that the assumed set of slip systems indeed activates.
Note that these computations are independent of the strain hardening behavior.
10
In uniaxial compression of <111> oriented micropillars, there are 6 slip systems with
identical Schmid factor (SF) and 6 slip systems with zero SF. From these 6 possibly
active systems with non-zero SF, 3 systems develop strong collinear interactions with
the forest dislocations in the other 3 systems. This prevents plastic flow from
developing in 3 slip systems [20, 21]. Under these conditions, there are two distinct
dispositions for the 3 active systems that produce stable uniaxial straining. One
disposition involves development of glissile, coplanar and Lomer-Cottrell dislocation
interactions [22], where the computed cross-section exhibits the quasi-elliptical
appearance in Fig. 3(a). The second disposition in Fig. 3(b) exhibits 3 glissile
interactions [22], where the cross-section retains its circular shape. Experimental
assessment of the cross-sectional shape from the top surface of compressed micropillars
along with EBSD measurements unambiguously show that all <111> oriented
microcrystals develop the aforementioned quasi-elliptical shape (Fig. 4). This is direct
evidence that plastic flow occurs under the activation of the 3 slip systems in Fig. 3(a).
Figs. 3(c)—(f) show the slip system dispositions for stable uniaxial straining along the
<001> direction, where 4 slip systems activate from the 8 possible ones with the same
SF [20, 33]. Again, this is because the strong collinear interaction prevents dislocation
gliding in 4 of the equivalent systems. In this case, different cross-sectional shapes are
found in the micropillar compression experiments, so that it is not possible to advocate
development of one configuration in detriment of the others.
4.3. Mean-field modeling of the stress—strain curves in strain-hardening micropillars
This section describes strategies for the computation of the stress—strain curves in
strain-hardening micropillars using the mean-field background in Section 3.1 in
conjunction with the determined set of active slip systems in Section 4.2. While these
11
strategies provide unique stress—strain curves in <111> oriented micropillars,
somewhat different curves are obtained for <001> micropillars depending on the sets of
slip systems that activate in the experiments (Section 4.2). The latter results are not
therefore given here for the sake of brevity.
Generalized plastic flow at 𝜏 > 𝜏! involves further entanglement of the dislocation
network that developed during the incipient plasticity stage. Two distinct scenarios for
dislocation multiplication within this stage are considered here. In the case of <111>
micropillars, dislocation configuration C1 emerges through truncated source activation
in the 3 active slip systems. All remaining inactive systems are dislocation free because
for the value of 𝜌! = 1 × 10¹⁰ m-2 in well annealed crystals, less than 1 dislocation per
slip system becomes statistically available for 𝐷 < 10 µm. The 6 inactive systems with
vanishing SF do not contribute to strain hardening while little dislocation accumulation
occurs in the 3 inactive systems with non-vanishing SF. For this dislocation
configuration, application of Eq. (3) in micropillars with 𝐷 = 2 µm renders the
dislocation densities in Table 2(A) for the experimentally measured value of 𝜏! ≈ 46
MPa [for a total of ≈ 470 dislocation segments]. Dislocation storage (Eq. (5)) then
yields the dislocation density 𝜌 and junction density 𝜌!"# emerging in all slip systems at
the experimentally measured value of 𝜏! = 64 MPa (Table 2(A)); for a total of ≈ 1160
dislocation segments within the pillar. Fig. 5 finally shows the computed stress—strain
curve at 𝜏 > 𝜏! (𝐷 = 2 µm) while Table 2(A) provides all dislocation densities at 𝜀 =
0.04. Similar analyses are repeated for different micropillar diameters.
The second dislocation configuration C2 under consideration accounts for experimental
measurements in prestrained micropillars containing much greater dislocation densities
than the bulk (parent) crystal prior to deformation [34, 35]. A prestrained micropillar
12
with 𝐷 = 2 µm can be taken to exhibit 𝜌! ≈ 1 × 10¹³ m-2 (e.g., [36]) so that a total of
≈ 380 dislocation segments would become available if the dislocations were
homogeneously distributed, rendering 𝜏! ≈ 45 MPa (Table 2(A)). Network
development through junction formation would then result in the dislocation densities
reported in Table 2(B) if 𝜏! was to occur at the same level of 64 MPa as in the above
fresh micropillars [for a total of ≈ 450 dislocation segments]. Fig. 5 finally shows the
computed stress—strain curve at 𝜏 > 𝜏! while Table 2(B) provides all dislocation
densities at 𝜀 = 0.04.
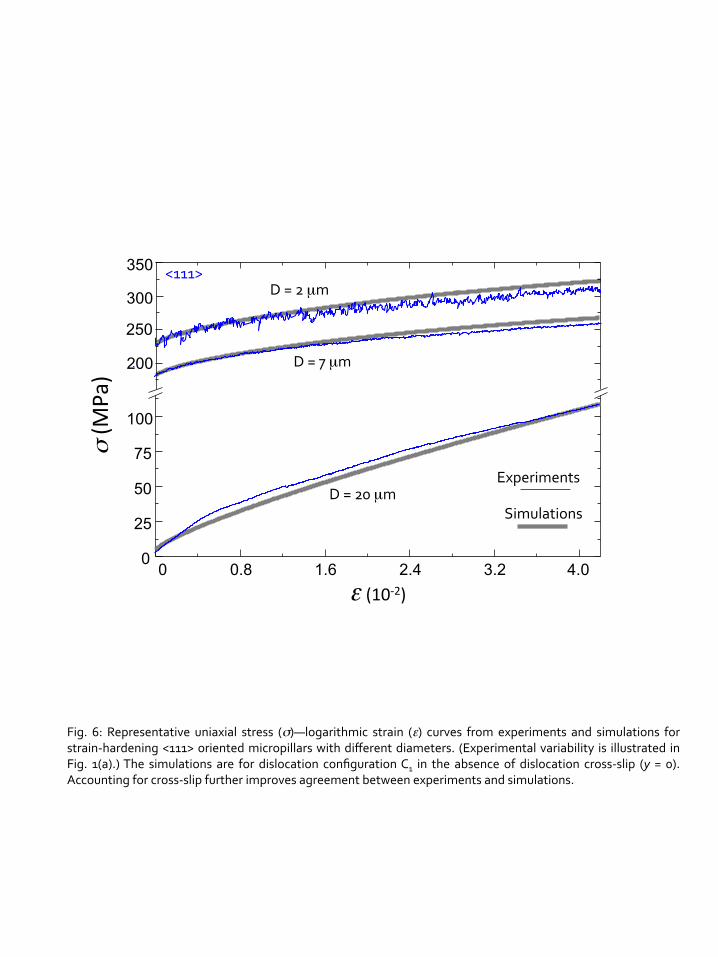
Given the present experimental variability (Fig. 1(a)), the good agreement between the
stress—strain curves from experiments and simulations at various micropillar diameters
is illustrated in Fig. 6 (configuration C1). As described in Appendix A1, this can be
further improved by accounting for dislocation cross-slip (see 𝑦 = 0.5 nm in Fig. 5). It
is also noted that configuration C2 yields more prominent hardening than C1.
The above results indicate that the concept of spatially uniform dislocation densities –
underlying present continuum mechanics framework– applies to strain-hardening
micropillars. Moreover, the finite element (FE) simulations (Appendix A2) performed
with the current description capture the rather continuous flow patterns and the
micropillar tilting behavior measured experimentally (Fig. 7). The FE simulations in
Appendix A2 shed further light into the stability of uniaxial straining during testing.
4.4. Comparison between dislocation densities from experiments and simulations
The following discusses experimental evidence of dislocation storage from the literature
in light of present strain hardening predictions. Transmission electron microscopy
(TEM) analyses of (269)-oriented nickel micropillars with 𝐷 ≳ 10 µm confirm
development of dislocation patterning and storage, where the braid dislocation structure
13
resembles that attaining in a bulk [36]. Activation of three slip systems with different
SF values is asserted in that work depending on the applied stress. The experimentally
measured preexisting total density, 𝜌!, = 𝜌!!"!!! = 6.5 × 10¹² m-‐2 suggests onset of
incipient plasticity at 𝜎 = 21 MPa (Eq. (3)), approximating to the stress level that
marks departure from linear elasticity for 𝐷 = 20 µm. Generalized plastic flow is then
experimentally detected at 𝜎 ≈ 35 MPa. The initial dislocation density is found to
increase during straining towards the maximum value of 𝜌! = 3.3 × 10¹³ m-‐2 when 𝐷 is
in the range of 10 to 20 µm, which approximates to the presently predicted 𝜌! = 3.5 ×
1013 m-‐2 under bulk dislocation storage at the applied stress of 𝜎 ≈ 50 MPa where the
experiment is terminated (𝐷 = 20 µm). Since the dislocation junction arrangement
provides milder strengthening than for the present (001), (011) and (111) orientations,
𝐿!"" ≈ 5 µm is predicted at the onset of generalized flow (𝜎 ≈ 35 MPa at 𝐷 = 20
µm). Consequently, 𝐷/𝐿!"" → 4 so that strain hardening dominates plastic flow
(Section 5.1) in consonance with the rather smooth appearance of the stress—strain
curve.
Further experimental evidence of dislocation storage during incipient plasticity is
provided in [18] and [36], where marked surface dislocation annihilations preclude
network development in micropillars that exhibit large plastic intermittencies (i.e.,
deforming within the confining plasticity regime described in Section 5.1). The
experiments in [36] show that for 𝐷 = 1 µm, generalized yielding occurs for 𝜎 = 310
MPa in 3 active slip systems with 𝜌! = 1.5 × 10¹⁴ m-‐2. While this value is significantly
greater than the total density prior to straining (𝜌! = 6.5 × 10¹² m-‐2), it is still well
below the presently predicted value of 𝜌! = 4 × 10¹⁵ m-‐2.
14
Dislocation density measurements in a (3-15)-oriented gold micropillar with 𝐷 = 0.8
µm indicate dislocation accumulation in a single slip system with a small SF while the
dislocations annihilate at the pillar surface in the two most favorably oriented systems
[18]. The stress—strain curve also exhibits marked plastic intermittencies characteristic
of the confining plasticity regime (Section 5.1). While for 𝜎 = 240 MPa measured 𝜌!
increased from the initial value of 1.7 × 10¹² m-‐2 to 6.2 × 10¹² m-‐2, our computations
show that it is not possible to accumulate a sufficient density so that the above applied
stress level is reached with a single active slip system. The micropillars with 𝐷 = 6.3
µm in [18] also display an increase in density during straining to 𝜌! = 2.5 × 10¹² m-‐2
(𝜎 = 48 MPa), which is again much smaller than the value of 𝜌! = 8.3 × 10¹³ m-‐2
anticipated within the present modeling scheme.
4.5. Dislocation avalanche statistics
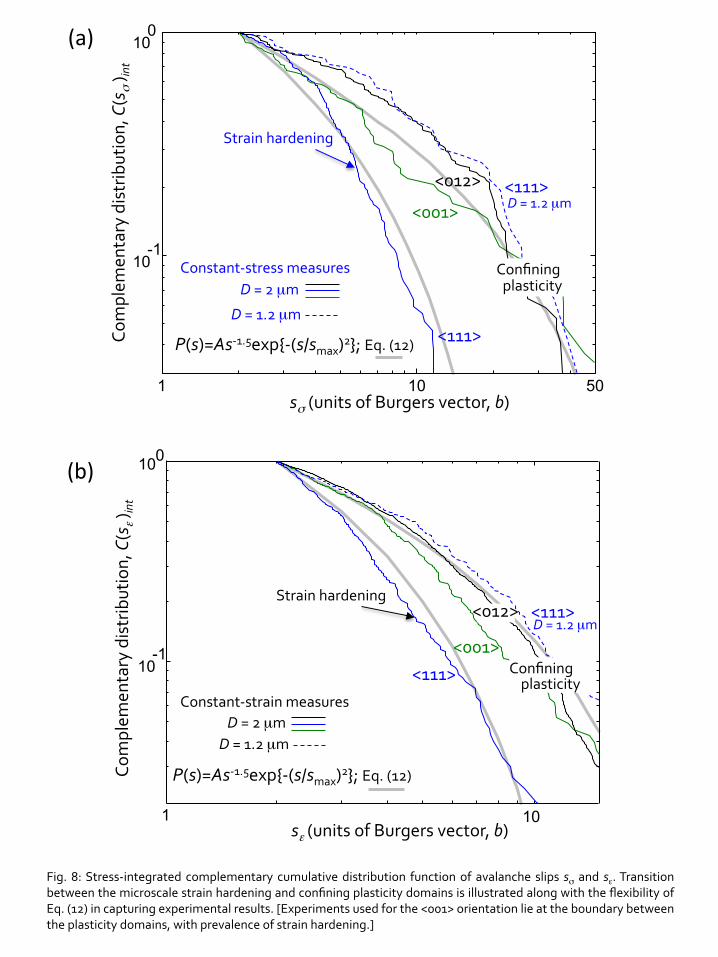
Stress-integrated complementary cumulative distributions 𝐶(𝑠)!"# are computed from
present measurements of avalanche slips. Constant-stress slip 𝑠! and avalanche slip 𝑠!
distributions and given in Figs. 8(a) and (b), respectively. Each distribution concerns 5
micropillar compression experiments (containing 200 slips 𝑠! and 400 slips 𝑠!) for the
selected combinations of micropillar diameters and orientations in Fig. 1. The
distributions are then fitted to Eq. (12) as described in Appendix A3.
5. Onset of the microscale plasticity regimes and associated dislocation avalanche
statistics
5.1 Transition between strain hardening and confining plasticity
Directing attention to Fig. 6, microcrystals with 𝐷 = 20 µm compressed along the
<111> orientation exhibit the same stress—strain curve as that predicted through the
15
present strain hardening model in well-annealed bulk single-crystals (which deform
from an initial low value of 𝜌! ≈ 1 × 10¹¹ m-2 in all slip systems). For 𝐷 ≲ 10 µm,
junction formation in extremely dense dislocation networks dominates plastic flow as
described in Section 4.3. This leads to the onset of a microscale strain-hardening
regime, where plastic deformations satisfy the same laws dictating dislocation storage in
a bulk (Eq. (5)). It therefore becomes apparent that it is the vast dislocation density
present in the active systems that ensures effective coarse graining of intermittency
under the hypothesis of continuous flow for 𝐷 > 1 µm. Hence, the small-scale behavior
at large dislocation densities follows the same principles as bulk plasticity, where
dislocation annihilations at the surfaces are largely inconsequential. It also stems from
our results that the hypothesis of an unlimited supply of mobile dislocations from the
bulk underlying Eq. (5) is fulfilled within the microscale strain hardening regime.
With further decreasing pillar size (𝐷 → 1 µm), an increasing number of <111>
microcrystals exhibit irregular or vanishing hardening (𝜃 → 0), see Fig. 1(b) for 𝜏 > 𝜏!.
This behavior denotes onset of a confining plasticity regime, where surface dislocation
annihilations induce a stagnant dislocation network. The pillars are then found to exhibit
marked slip traces at the surface (inset to Fig. 1(b)) that challenge the hypothesis of
continuous flow. Whereas the shape of the stress—strain curves from these micropillars
could be consistent with the attainment of source exhaustion hardening in the absence of
dislocation storage, the results analyzed in Section 4.4 indicate that net storage indeed
occurs within the incipient plasticity stage.
Section 4.4 further illustrates that the plastic intermittencies developing within the
confining plasticity regime are triggered at greater shear stress levels than those
associated with the onset of yielding under bulk strain hardening. The current mean-
16
field strain-hardening model cannot be therefore used to predict plastic flow within the
confining plasticity regime, where limited dislocation storage always occurs. The
effective shear stress resulting in truncated source operation thus equals the flow stress
within the confining plasticity regime, which essentially varies depending of the
availability of dislocation sources pivoting at a given distance from the sample surface.
In the transition between microscale strain-hardening and confining (exhaustion
hardening) plasticity regimes, it is recognized that the pinning action of dislocation
junctions is reduced with decreasing 𝐷 [37]. The strengthening capacity of any given
junction configuration could then be assessed by ratio 𝐷/𝐿!"", which measures the
number of locations where a dislocation sweeping across the pillar becomes immobile
as it interacts with the dislocation forest. Transition from strain hardening to confining
plasticity is thus taken to occur as this ratio decreases below a critical level.
Our results for <001> and <111> micropillars show that 𝐷/𝐿!"" ≳ 2 characterizes onset
of the strain-hardening domain, whereas confining plasticity attains for 𝐷/𝐿!"" ≲ 1.5. It
is noted that some <001> micropillars with 𝐷 = 2 µm deforming within the strain-
hardening regime exhibit sudden stress valleys passed some plastic strain level. This is
attributed to statistical fluctuations in junction density, occurring in the proximity of
𝐷/𝐿!"" = 2. Confining plasticity always prevails in micropillars with the <012>
orientation (𝐷 < 10 µm), where 𝐷/𝐿!"" remains below 1.5 because of mild dislocation
storage in the two active slip systems. Along these lines, it is also noted that since the
dislocation forest arising for the (269)-oriented micropillars in [36] (Section 4.4) is
milder (𝐿!"" ≈ 5 µm) than that for the present (111)-‐oriented micropillars (𝐿!"" ≈ 1
µm), the microscale strain hardening domain is triggered at substantially greater
values of 𝐷 in the former where 𝐷/𝐿!"" > 2 always prevails.
17
Ratio 𝐷/𝐿!"" therefore becomes a fundamental dimensionless index describing
transition in microscale plasticity regimes. Since 𝐿!"" is a function of loading
orientation and dislocation density, index 𝐷/𝐿!"" would be pertinent in investigating
plastic flow in micropillars manufactured from prestrained crystals that contain an
entangled preexisting dislocation network. Since 𝐿!"" is reduced for these micropillars,
onset of strain-hardening at 𝐷/𝐿!"" > 2 is favored for smaller diameters.
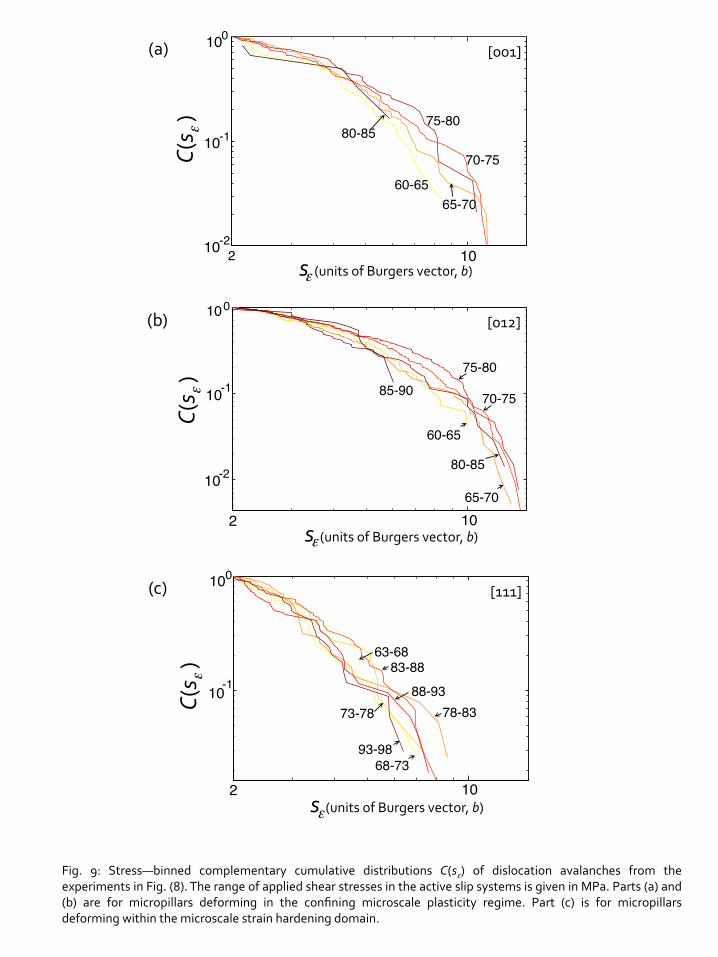
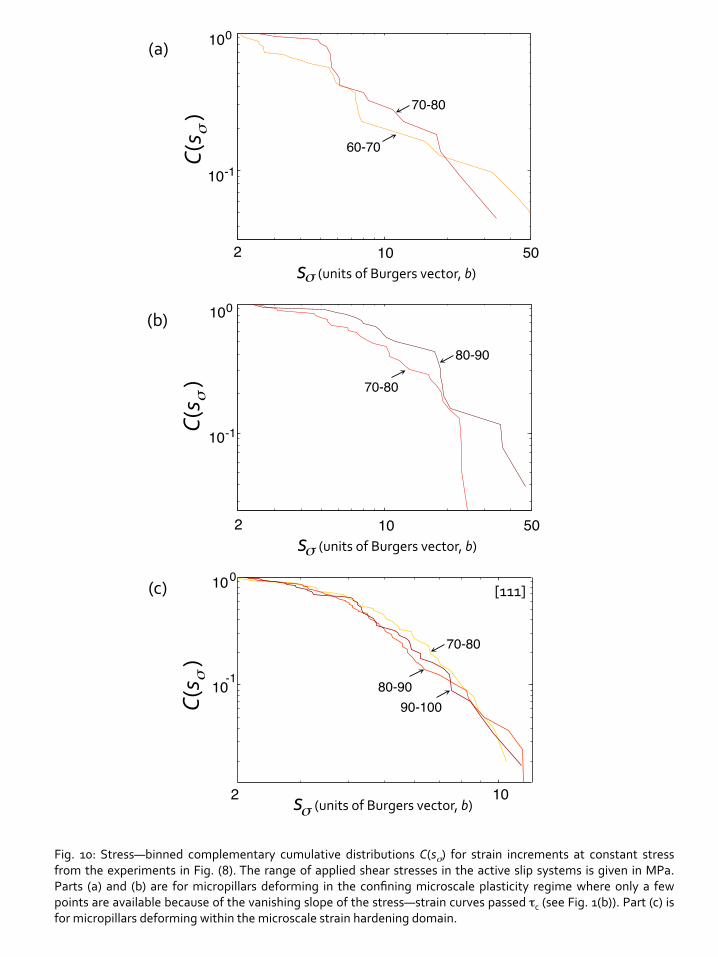
5.2. Emergence of self-organized criticality
The present experiments provide access to plastic intermittencies occurring in the active
slip systems of crystals loaded in stress and strain control. As shown in Figs. 9 and 10,
cumulative distribution functions 𝐶(𝑠!) and 𝐶(𝑠!) are not binned by stress while, in a
similar vein, the mean avalanche slips from the raw data in Appendix A3 are stress-
independent. These are key results furnishing experimental evidence in that the
criticality level of the crystal remains constant during plastic straining irrespectively of
the applied shear stress level. In the context of Eq. (11), difference (𝜏∗ − 𝜏) can then be
taken to remain constant, so that any increase in applied stress 𝜏 due to strain hardening
is counterbalanced by a raise in criticality stress 𝜏∗. This is the first convincing
experimental evidence in that self-organized criticality (SOC) rather than stress-tuned
criticality (STC) rules dislocation avalanching processes in micrometer-sized crystals.
Moreover, since the slip distributions of micropillars deforming within the confining
and strain-hardening plasticity regimes are not stress binned (Figs. 9 and 10), SOC
becomes a general paradigm in micrometer-sized samples.
Following Fig. 8, measured avalanche size distributions are accurately fitted through
Eq. (11). In the transition from confining to strain-hardening plasticity, the values of
𝑠!"# obtained from the above fit decrease from ≈ 17𝑏 to 7𝑏 for 𝑠! counts (𝛾!"# ≈ 1.2 ×
18
10-3 and 3.0 × 10⁻⁴, respectively) and from 𝑠!"# ≈ 55𝑏 to 13𝑏 for 𝑠! counts (𝛾!"# ≈ 3.9
× 10-3 and 5.5 × 10⁻⁴, respectively). It is further noticed that present 𝐶(𝑠!)!"# and
𝐶(𝑠!)!"# functions defy the STC scaling of ∼ 𝑠!! (Section 3.2). These functions thus
exhibit a gradual cut-off for 𝑠 → 𝑠!"# that is more in accordance with Eq. (11).
5.3. Dislocation storage and the transition from self-organized to stress-tuned criticality
The above results represent convincing evidence in that it is the entanglement of the
dislocation network occurring at the incipient plasticity stage that governs the slip
distribution of dislocation avalanches. The development of heavily entangled
dislocation networks thus reduces the size of dislocation avalanches through junction
zipping and unzipping processes, so that the slip distributions become a fingerprint of
the active plasticity regime (Fig. 8). This contradicts the mild influence of strain
hardening upon the value of 𝑠!"# predicted in [15] (Section 3.2).
The above fundamental interpretation holds irrespectively of the effect of pillar size
upon the magnitude Δ𝜎 of a stress serration (Eq. (2)). It is noticed that since Δ𝜎 =
𝑠!× 𝐸 × 𝑆𝐹/𝑙, the stress serrations would exhibit a two-fold increase with a two-fold
decrease in pillar length 𝑙. Nevertheless, as confining plasticity sets-in, our experiments
show that a four-fold increase in Δ𝜎 attains with such a two-fold decrease in 𝑙.
Secondly, whereas an increase in 𝑠!"# would be theoretically predicted to arise with
increasing pillar size (Section 3.2), a reduction in 𝑠!"# marks the current transition
towards strain hardening plasticity with increasing pillar sizes (Fig. (8)).
Measured slip distributions indicate that while the number of dislocations 𝑁 contained
in an avalanche increases for large values of the mean free path 𝐿!"", this is only so
when there is a shift from the confining to the microscale strain hardenings domains.
19
The crystal therefore emits a larger number of dislocations when the arresting locations
along the active slip plane decrease below a critical number. This is rationalized in that
𝑠!"# ∼ 𝑓!,!(𝐷/𝐿!"") , (14)
where functions 𝑓!,! exhibit sudden variations in the transition from strain hardening to
confining plasticity. Function 𝑓! for 𝑠! counts varies from 1.0 to ≈ 2.5 while function 𝑓!
for 𝑠! counts varies from 1.0 to ≈ 4.2. Within the present range of micropillar sizes, our
results also indicate that 𝑓!,! remain roughly constant up to 𝐷/𝐿!"" = 6.
The present findings unravel the statistical features of dislocation avalanches in crystal
plasticity. In this sense, recent experimental results have demonstrated that plasticity in
submicrometer-sized crystals adheres to the principle of STC, where the crystal
responds with greater avalanches when the applied stress approaches 𝜏∗ [16]. By
contrast, in the present crystals with characteristic dimension 𝐷 ≳ 1 µm, SOC rules
dislocation avalanches in both strain hardening and confining plasticity regimes. This is
an outcome of dislocation storage processes arising within the incipient plasticity stage
of micrometer-sized crystals, which are suppressed in submicrometer sizes. Since SOC
unfolds even for the less entangled networks developing along the <012> orientation,
this paradigm would prevail in bulk samples with smaller dislocation densities.
6. Concluding remarks
1. The development of a dense dislocation network during an incipient plasticity stage
characterizes plastic flow in micrometer-sized samples. We show that the combined
role of sample size, loading orientation and dislocation density upon the onset of
strain hardening can be assessed through a mean-field dimensionless index.
Microscale strain hardening plasticity thus emerges when the ratio between the
characteristic sample size and the mean free path travelled by the mobile
20
dislocations, 𝐷/𝐿!"", > 2. Under this condition, the strengthening capacity of the
dislocation network is sufficient as to ensure that plastic flow involves dislocation
storage irrespectively of dislocation annihilation processes at the sample surface. The
domain of confining plasticity distinguished by insufficient network development
then attains for 𝐷/𝐿!"" < 1.5. Plastic straining in this regime is characterized by
vanishing hardening under a stagnant dislocation network. As opposed to plasticity
in submicrometer dimensions where surface dislocation annihilations may result in
dislocation-starved samples, dislocation storage is thus the distinctive feature
underlying plasticity in micrometer-sized samples.
2. The statistical description of dislocation avalanches in micrometer-sized crystals is in
accordance with the paradigm of self-organized criticality (SOC), where the size of
such plastic intermittencies is a function of the strain hardening behavior
irrespectively of the applied stress level. There is therefore a fundamental distinction
between the dislocation avalanche statistics that apply to samples with micrometer
and submicrometer sizes, as criticality is tuned by stress in the latter. Our results are
all consistent in that the inception of a dislocation network under multiple-glide is
the essential feature leading to SOC.
3. The size of the dislocation avalanches is reduced under the highly entangled
dislocation networks characterizing microscale strain-hardening plasticity. This is a
direct consequence of junction zipping processes between the mobile dislocations in
the avalanche and the forest dislocations in the interacting slip systems at 𝐷/𝐿!"" >
2. Conversely, it is found that the strengthening provided by such junction forming
processes is strongly diminished within the domain of confining plasticity. Severe
plastic intermittencies consequently develop for 𝐷/𝐿!"" < 1.5.
21
4. Continuum crystal plasticity is instrumental in the modeling of strain hardening at
the microscale. The key parameters governing plastic flow are the forest dislocation
density 𝜌! in Eq. (3) and the mean free path traveled by the mobile dislocations 𝐿!""
from the dislocation storage law in Eq. (5). The dislocation density thus becomes the
scaling parameter that enables computation of the stress—strain curves at the vast
dislocation densities developing in microcrystalline samples. With decreasing
dislocation density, present microscale strain-hardening domain naturally converges
into bulk plasticity where smaller flow stresses prevail. The excellent agreement
between the stress—strain curves from experiments and mean-field simulations
further indicates that while dislocation annihilations inevitably occur at the surface,
this phenomenon can be largely ignored under microscale strain hardening.
5. The framework of continuum crystal plasticity has been used to evaluate slip system
activity in micropillar compression experiments. The devised analytical procedure
employs Eq. (9) from the text in conjunction with EBSD measurements of the plastic
distortion in the top surface of compressed micropillars. It is demonstrated that the
comparison between computed and experimentally measured plastic distortions
provides direct evidence on the activity of specific sets of slip systems. These
analyses are particularly useful in micropillars deforming under the microscale
strain-hardening domain, where the assertion of slip system activity becomes
difficult from the fainting slip traces at the sample surface.
Acknowledgements: The authors acknowledge insightful discussions with L. Kubin.
Financial support was provided by Ministerio de Economía y Competitividad Grant
MAT2011-23375 (Spain) and CENTEM projects CZ.1.05/2.1.00/03.0088 and PLUS
LO1402 (Czech Republic).
22
References
1. J. Friedel, Dislocations, Pergamon, Oxford, 1964.
2. D. Kuhlmann-Wilsdorf, Metall. Trans. A 16A, 2091 (1985).
3. U. F. Kocks, H. Mecking, Prog. Mater. Sci. 48, 171 (2003).
4. H. Tang, K.W. Schwarz and H. D. Espinosa, Phys. Rev. Lett. 100, 185503 (2008).
5. S. H. Oh, M. Legros, D. Kiener and G. Dehm, Nature Mat. 8, 95 (2009).
6. J. R. Greer and W. D. Nix, Phys. Rev. B. 73, 245410 (2006).
7. T.A. Parthasarathy, S.I. Rao, D-M. Dimiduk, M.D. Uchic, D.R. Trinle, Scripta Mater.
56, 313 (2007).
8. J. A. El-Awady, S. I. Rao, C. Woodward, D. M. Dimiduk, M. D. Uchic, Int. J.
Plasticity 27, 372 (2011).
9. C. Zhou, I.J. Beyerlein, R. LeSar, Acta Mater. 59, 7673 (2011)
10. A.A. Benzerga, Int. J. Plasticity 24, 1128 (2008).
11. S.I. Rao, D.M. Dimiduk, T.A. Parthasarathy, M.D. Uchic, M. Tang, C. Woodward,
Acta Mater. 56, 3245 (2008).
12. C. Motz, D. Weygand, J. Senger. P. Gumbsch, Acta Mater. 57 1744 (2009).
13. M.D. Uchic, P.A. Shade, D.M. Dimiduk, Annu. Rev. Mater. Res. 39 361 (2009).
14. D.M. Dimiduk, C. Woodward, R. LeSar, M.D. Uchic, Science 312, 1188 (2006).
15. F.F. Csikor, C. Motz, D. Weygand, M. Zaiser, S. Zapperi, Science 318, 251 (2007).
16. N. Friedman, A. T. Jennings, G. Tsekenis, J-Y. Kim, M. Tao, J. T. Uhl, J. R. Greer
and K. A. Dahmen, Phys. Rev. Lett., 109, 095507 (2012).
17. K.A. Dahmen, Y. Ben-Zion, J.T. Uhl, Phys. Rev. Lett., 102, 175501 (2009).
18. K.S. Ng and A.H.W. Ngan, Acta Mater. 56, 1712 (2008).
19. D. Kiener, P.J. Guruprasad, S.M. Keralavarma, G. Dehm, A.A. Benzerga, Acta
Mater. 59, 3825 (2011).
23
20. B. Devincre, T. Hoc, L. Kubin. Science 320, 1745 (2008).
21. L. Kubin, B. Devincre, T. Hoc, Acta Mater. 56, 6040 (2008).
22. P. Franciosi, A. Zaoui, Acta Metall. 30, 1627 (1982).
23. Basinski SJ, Basinski ZS. In: Nabarro FRN, editor. Dislocations in solids, Vol. 4.
Amsterdam: North-Holland; 1979. p. 261.
24. R.J. Asaro, Adv. Appl. Mech. 23, 1 (1983).
25. M.-C. Miguel, A. Vespignani, S. Zapperi, J. Weiss, J.-R. Grasso, Mater. Sci. Engng.
A, 309–310, 324 (2001).
26. P. Moretti, M.-C. Miguel, M. Zaiser, S. Zapperi, Phys. Rev. B 69, 214103 (2004).
27. M. Zaiser, Adv. Phys. 55, 185 (2006).
28. M. Zaiser and P. Moretti, J. Stat. Mech. P08004 (2005).
29. S. Papanikolaou, D.M. Dimiduk, W. Choi, J.P Sethna, M.D. Uchic, C.F. Woodward,
S. Zapperi, Nature 490, 517 (2012).
30. D. Markovic, C. Gros, Physics Reports 536, 41 (2014).
31. M.C. Miguel, A. Vespignani, S. Zapperi, J. Weiss, J.R. Grasso, Nature 410, 667
(2001).
32. S. Akarapu, H.M. Zhib, D.F. Bahr, Int. J. Plasticity 26, 239 (2010).
33. R. Madec, B. Devincre, L. Kubin, T. Hoc, D. Rodney, Science 301, 1879 (2003).
34. S-W. Lee, S. M. Han, W.D. Nix, Acta Mater 57, 4404 (2009).
35. J. A. El-Awady, M. D. Uchic, P. A. Shade, S.-L. Kim, S. I. Rai, D. M. Dimiduk, C.
Woodward, Scr. Mater. 68, 207 (2013).
36. D.M. Norfleet, D.M. Dimiduk, S.J. Polasika, M.D. Uchic, M.J. Mills, Acta Mater.
56, 2988 (2008).
37. J. G. Sevillano, I.O. Arizcorreta, L.P. Kubin, Mater Sci. Eng. A 309, 393 (2001).
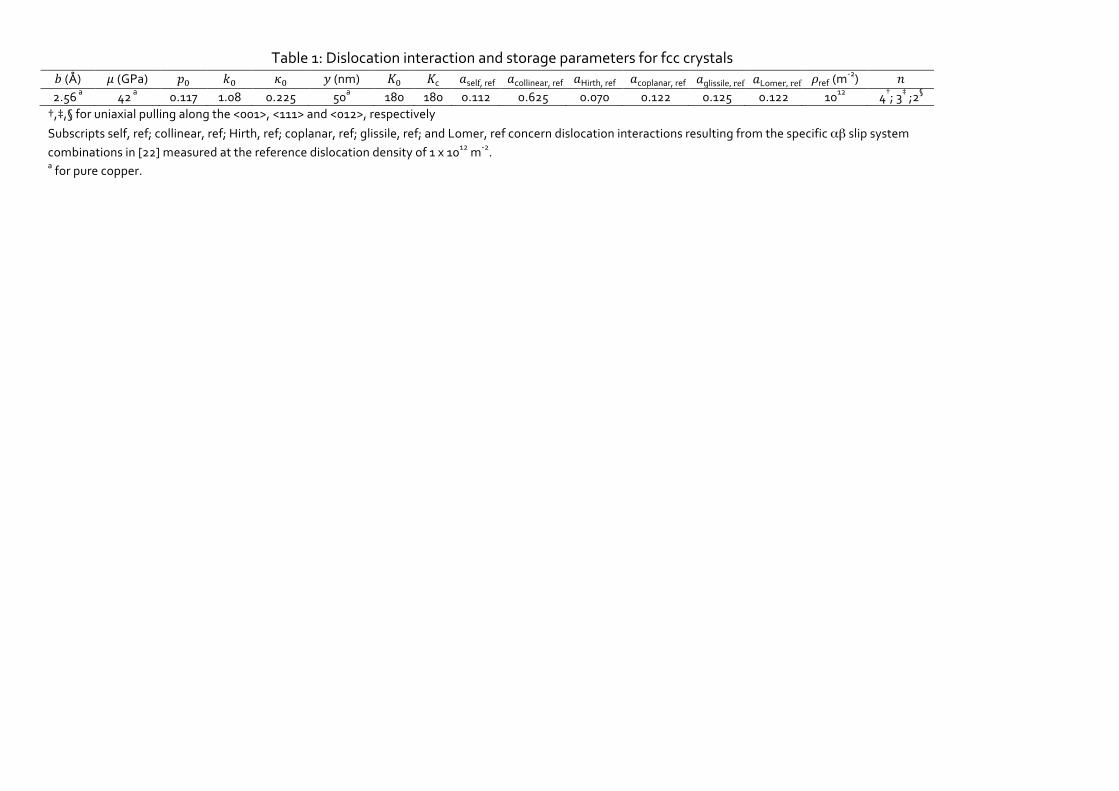
Table 1: Dislocation interaction and storage parameters for fcc crystals 𝑏 (Å) 𝜇 (GPa) 𝑝! 𝑘! 𝜅! 𝑦 (nm) 𝐾! 𝐾c 𝑎self, ref 𝑎collinear, ref 𝑎Hirth, ref 𝑎coplanar, ref 𝑎glissile, ref 𝑎Lomer, ref 𝜌ref (m
-‐2) 𝑛 2.56 a 42 a 0.117 1.08 0.225 50a 180 180 0.112 0.625 0.070 0.122 0.125 0.122 1012 4†; 3‡ ;2§ †,‡,§ for uniaxial pulling along the <001>, <111> and <012>, respectively Subscripts self, ref; collinear, ref; Hirth, ref; coplanar, ref; glissile, ref; and Lomer, ref concern dislocation interactions resulting from the specific αβ slip system combinations in [22] measured at the reference dislocation density of 1 x 10¹² m-‐2. a for pure copper.
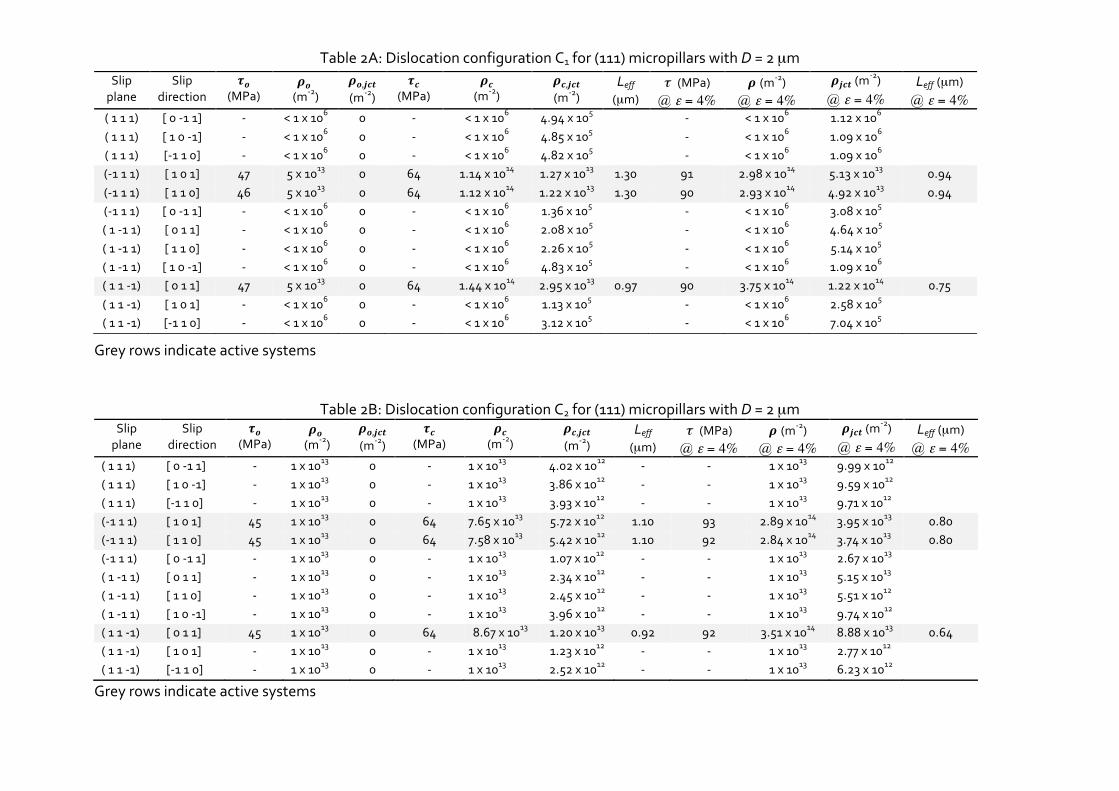
Table 2A: Dislocation configuration C1 for (111) micropillars with D = 2 µm
Grey rows indicate active systems
Table 2B: Dislocation configuration C2 for (111) micropillars with D = 2 µm
Slip plane
Slip direction
𝝉𝒐 (MPa)
𝝆𝒐 (m-‐2)
𝝆𝒐,𝒋𝒄𝒕 (m-‐2)
𝝉𝒄 (MPa)
𝝆𝒄 (m-‐2)
𝝆𝒄,𝒋𝒄𝒕 (m-‐2)
Leff
(µm) τ (MPa) @ ε = 4%
𝝆 (m-‐2) @ ε = 4%
𝝆𝒋𝒄𝒕 (m-‐2)
@ ε = 4% Leff (µm) @ ε = 4%
( 1 1 1) [ 0 -‐1 1] -‐ 1 x 10¹³ 0 -‐ 1 x 10¹³ 4.02 x 10¹² -‐ -‐ 1 x 10¹³ 9.99 x 10¹² ( 1 1 1) [ 1 0 -‐1] -‐ 1 x 10¹³ 0 -‐ 1 x 10¹³ 3.86 x 10¹² -‐ -‐ 1 x 10¹³ 9.59 x 10¹² ( 1 1 1) [-‐1 1 0] -‐ 1 x 10¹³ 0 -‐ 1 x 10¹³ 3.93 x 10¹² -‐ -‐ 1 x 10¹³ 9.71 x 10¹² (-‐1 1 1) [ 1 0 1] 45 1 x 10¹³ 0 64 7.65 x 10¹³ 5.72 x 10¹² 1.10 93 2.89 x 10¹⁴ 3.95 x 10¹³ 0.80 (-‐1 1 1) [ 1 1 0] 45 1 x 10¹³ 0 64 7.58 x 10¹³ 5.42 x 10¹² 1.10 92 2.84 x 10¹⁴ 3.74 x 10¹³ 0.80 (-‐1 1 1) [ 0 -‐1 1] -‐ 1 x 10¹³ 0 -‐ 1 x 10¹³ 1.07 x 10¹² -‐ -‐ 1 x 10¹³ 2.67 x 10¹³ ( 1 -‐1 1) [ 0 1 1] -‐ 1 x 10¹³ 0 -‐ 1 x 10¹³ 2.34 x 10¹² -‐ -‐ 1 x 10¹³ 5.15 x 10¹³ ( 1 -‐1 1) [ 1 1 0] -‐ 1 x 10¹³ 0 -‐ 1 x 10¹³ 2.45 x 10¹² -‐ -‐ 1 x 10¹³ 5.51 x 10¹² ( 1 -‐1 1) [ 1 0 -‐1] -‐ 1 x 10¹³ 0 -‐ 1 x 10¹³ 3.96 x 10¹² -‐ -‐ 1 x 10¹³ 9.74 x 10¹² ( 1 1 -‐1) [ 0 1 1] 45 1 x 10¹³ 0 64 8.67 x 10¹³ 1.20 x 10¹³ 0.92 92 3.51 x 10¹⁴ 8.88 x 10¹³ 0.64 ( 1 1 -‐1) [ 1 0 1] -‐ 1 x 10¹³ 0 -‐ 1 x 10¹³ 1.23 x 10¹² -‐ -‐ 1 x 10¹³ 2.77 x 10¹² ( 1 1 -‐1) [-‐1 1 0] -‐ 1 x 10¹³ 0 -‐ 1 x 10¹³ 2.52 x 10¹² -‐ -‐ 1 x 10¹³ 6.23 x 10¹²
Grey rows indicate active systems
Slip plane
Slip direction
𝝉𝒐 (MPa)
𝝆𝒐 (m-‐2)
𝝆𝒐,𝒋𝒄𝒕 (m-‐2)
𝝉𝒄 (MPa)
𝝆𝒄 (m-‐2)
𝝆𝒄,𝒋𝒄𝒕 (m-‐2)
Leff
(µm) τ (MPa) @ ε = 4%
𝝆 (m-‐2) @ ε = 4%
𝝆𝒋𝒄𝒕 (m-‐2)
@ ε = 4% Leff (µm) @ ε = 4%
( 1 1 1) [ 0 -‐1 1] -‐ < 1 x 10⁶ 0 -‐ < 1 x 10⁶ 4.94 x 10⁵ -‐ < 1 x 10⁶ 1.12 x 10⁶ ( 1 1 1) [ 1 0 -‐1] -‐ < 1 x 10⁶ 0 -‐ < 1 x 10⁶ 4.85 x 10⁵ -‐ < 1 x 10⁶ 1.09 x 10⁶ ( 1 1 1) [-‐1 1 0] -‐ < 1 x 10⁶ 0 -‐ < 1 x 10⁶ 4.82 x 10⁵ -‐ < 1 x 10⁶ 1.09 x 10⁶ (-‐1 1 1) [ 1 0 1] 47 5 x 10¹³ 0 64 1.14 x 10¹⁴ 1.27 x 10¹³ 1.30 91 2.98 x 10¹⁴ 5.13 x 10¹³ 0.94 (-‐1 1 1) [ 1 1 0] 46 5 x 10¹³ 0 64 1.12 x 10¹⁴ 1.22 x 10¹³ 1.30 90 2.93 x 10¹⁴ 4.92 x 10¹³ 0.94 (-‐1 1 1) [ 0 -‐1 1] -‐ < 1 x 10⁶ 0 -‐ < 1 x 10⁶ 1.36 x 10⁵ -‐ < 1 x 10⁶ 3.08 x 10⁵ ( 1 -‐1 1) [ 0 1 1] -‐ < 1 x 10⁶ 0 -‐ < 1 x 10⁶ 2.08 x 10⁵ -‐ < 1 x 10⁶ 4.64 x 10⁵ ( 1 -‐1 1) [ 1 1 0] -‐ < 1 x 10⁶ 0 -‐ < 1 x 10⁶ 2.26 x 10⁵ -‐ < 1 x 10⁶ 5.14 x 10⁵ ( 1 -‐1 1) [ 1 0 -‐1] -‐ < 1 x 10⁶ 0 -‐ < 1 x 10⁶ 4.83 x 10⁵ -‐ < 1 x 10⁶ 1.09 x 10⁶ ( 1 1 -‐1) [ 0 1 1] 47 5 x 10¹³ 0 64 1.44 x 10¹⁴ 2.95 x 10¹³ 0.97 90 3.75 x 10¹⁴ 1.22 x 10¹⁴ 0.75 ( 1 1 -‐1) [ 1 0 1] -‐ < 1 x 10⁶ 0 -‐ < 1 x 10⁶ 1.13 x 10⁵ -‐ < 1 x 10⁶ 2.58 x 10⁵ ( 1 1 -‐1) [-‐1 1 0] -‐ < 1 x 10⁶ 0 -‐ < 1 x 10⁶ 3.12 x 10⁵ -‐ < 1 x 10⁶ 7.04 x 10⁵
(a)
Fig. 1: Uniaxial stress (σ)—logarithmic strain (ε) curves for different micropillar diameters and orientations. (a) <111> micropillars deforming within the strain hardening domain. The inset shows rather continuous flow along the micropillar length with faint slip traces. (b) Confining plasticity where the insets show slip traces including dual glide deformation patterns for <012> micropillars. For all micropillar orientations in the figures, the stage of incipient plasticity attains at intermediate values from τo and τc.
σ (M
Pa)
0 1 2 3 4 5
τc ≈ 64 MPa
Incipient plasticity
ε (10-‐2)
Strain hardening; <111> micropillars, D = 2 µm
τo≈ 45 MPa
50
100
150
200
250
300
θ = dσ/dε > 0
10
20
30
40
50
60
70
80
τ (M
Pa)
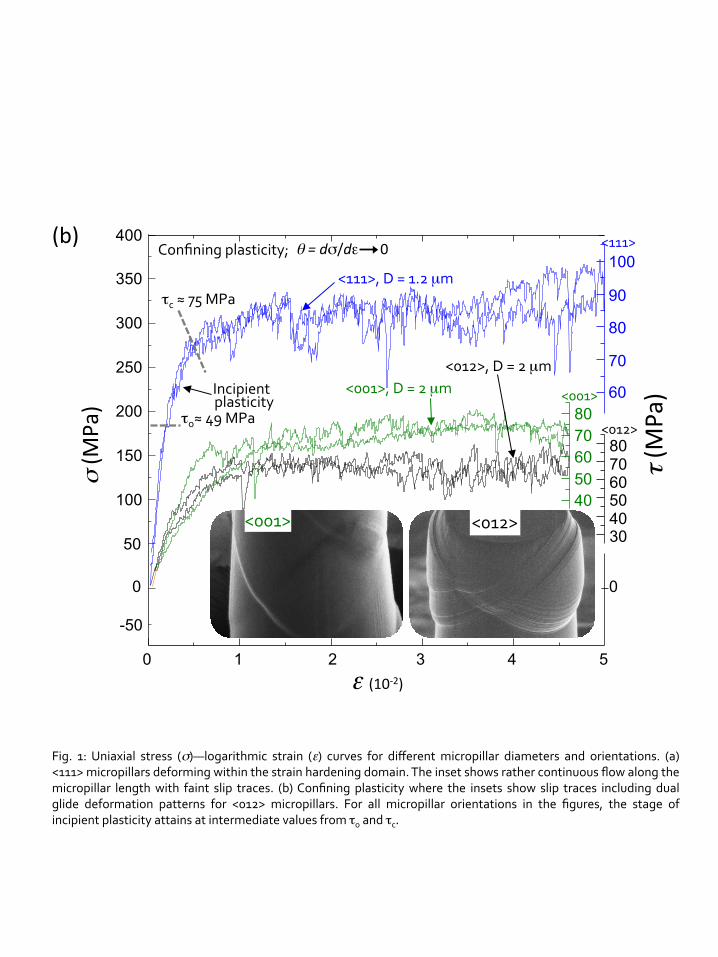
Fig. 1: Uniaxial stress (σ)—logarithmic strain (ε) curves for different micropillar diameters and orientations. (a) <111> micropillars deforming within the strain hardening domain. The inset shows rather continuous flow along the micropillar length with faint slip traces. (b) Confining plasticity where the insets show slip traces including dual glide deformation patterns for <012> micropillars. For all micropillar orientations in the figures, the stage of incipient plasticity attains at intermediate values from τo and τc.
Confining plasticity;
<001>, D = 2 µm
0 1 2 4 5
50
100
150
200
250
300
350
400
-50
τc ≈ 75 MPa
σ (M
Pa)
ε (10-‐2)
<012>, D = 2 µm
<111>, D = 1.2 µm
(b)
<001> <012>
τo≈ 49 MPa
Incipient plasticity
θ = dσ/dε 0
0
3
0
60
70
80
90
100
τ (M
Pa)
30 40
60 70 80
50
<001>
<012>
<111>
40 50
70 80
60
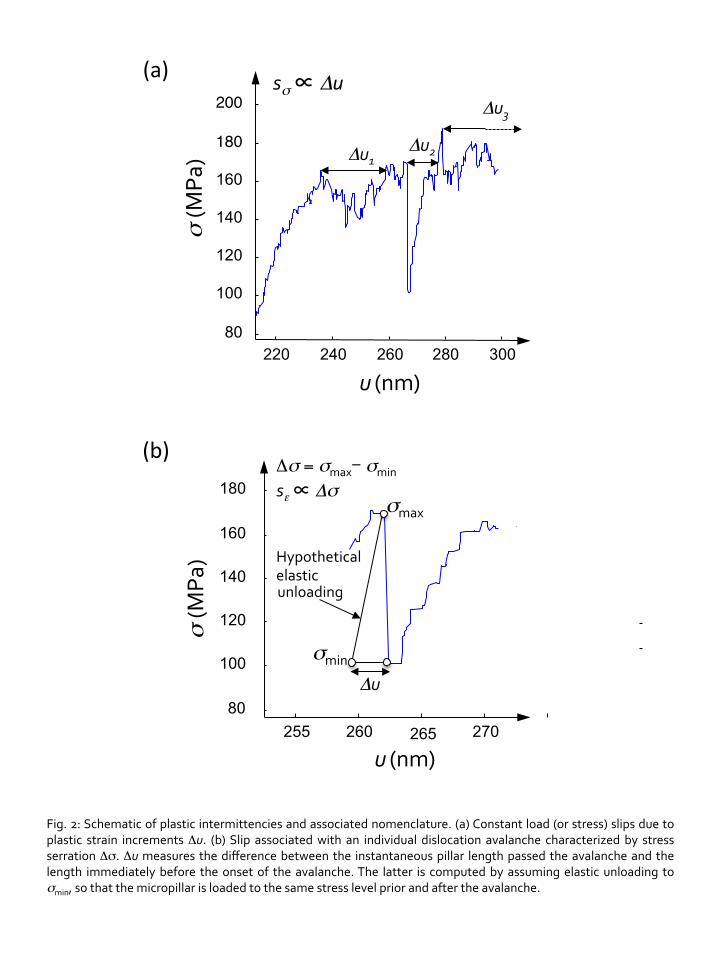
Fig. 2: Schematic of plastic intermittencies and associated nomenclature. (a) Constant load (or stress) slips due to plastic strain increments Δu. (b) Slip associated with an individual dislocation avalanche characterized by stress serration Δσ. Δu measures the difference between the instantaneous pillar length passed the avalanche and the length immediately before the onset of the avalanche. The latter is computed by assuming elastic unloading to σmin, so that the micropillar is loaded to the same stress level prior and after the avalanche.
u (nm)
80
100
120
140
160
180
200
σ (M
Pa)
220 240 260 280 300
Δu1 Δu2
Δu3
sσ ∝ Δu
255 260 265 270 80
100
120
140
160
180
Hypothetical elastic
u (nm)
σ (M
Pa)
σmax
σmin
Δu
Δσ = σmax- σmin
unloading
sε ∝ Δσ
(a)
(b)
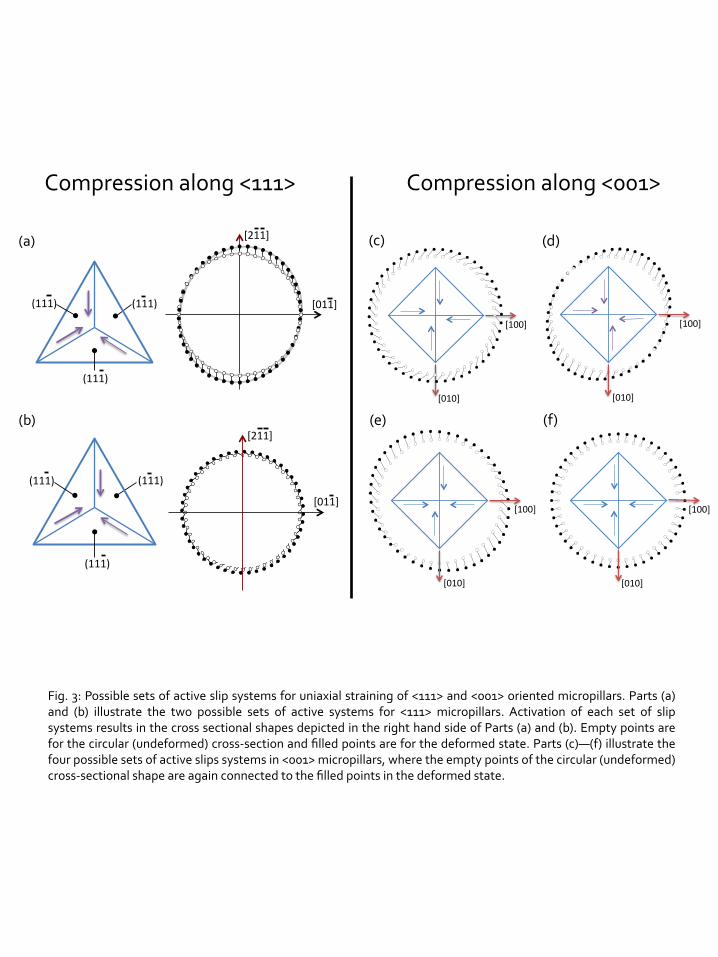
Fig. 3: Possible sets of active slip systems for uniaxial straining of <111> and <001> oriented micropillars. Parts (a) and (b) illustrate the two possible sets of active systems for <111> micropillars. Activation of each set of slip systems results in the cross sectional shapes depicted in the right hand side of Parts (a) and (b). Empty points are for the circular (undeformed) cross-‐section and filled points are for the deformed state. Parts (c)—(f) illustrate the four possible sets of active slips systems in <001> micropillars, where the empty points of the circular (undeformed) cross-‐sectional shape are again connected to the filled points in the deformed state.
(111)$
(111)$(111)$
[211]$
[011]$
(111)$
(111)$(111)$
[211]$
[011]$
(a)$
(b)$
!![100]!
[010]!
[100]!
[010]!
[100]!
[010]!
[100]!
[010]!
(c)
(e)
Compression along <111> Compression along <001>
(d)
(f)
[011]
− [211] −
Fig. 4: Crystallographic analyses of the plastic distortion in the top surface of compressed <111> micropillars. The evolution of the circular (undeformed) cross-‐sectional shape to the deformed configuration computed for the set of slip systems in Fig. 3(a) at ε = 4% is given in the top figure. Notice that the crystallographic character of the computed plastic distortion matches actual measurements in the micropillar. Associated EBSD analyses are given in the bottom.
<011>
<112>
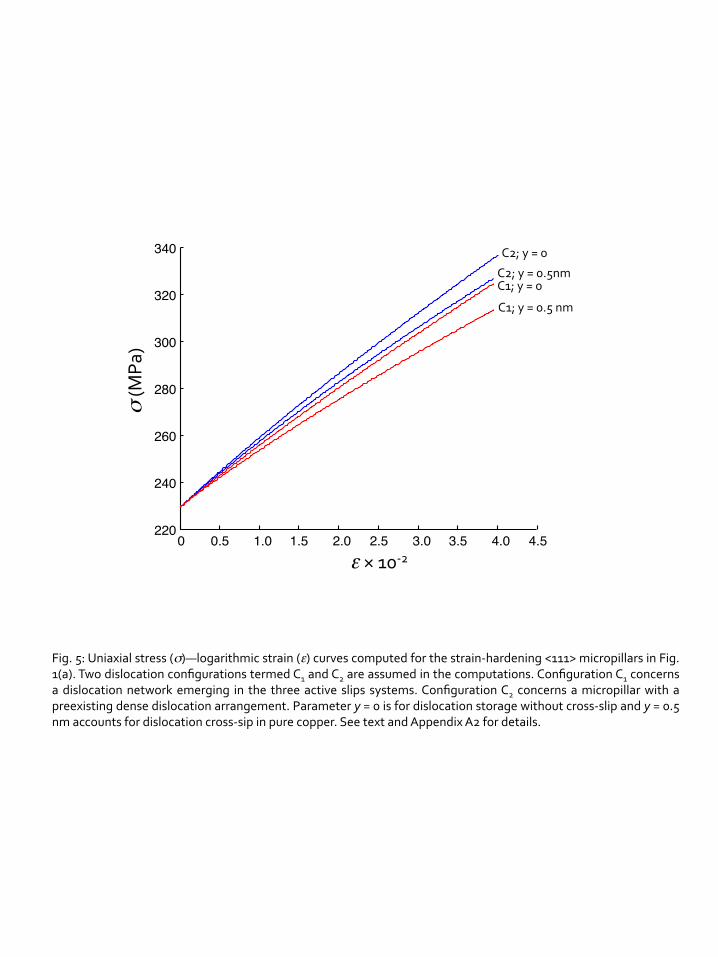
Fig. 5: Uniaxial stress (σ)—logarithmic strain (ε) curves computed for the strain-‐hardening <111> micropillars in Fig. 1(a). Two dislocation configurations termed C1 and C2 are assumed in the computations. Configuration C1 concerns a dislocation network emerging in the three active slips systems. Configuration C2 concerns a micropillar with a preexisting dense dislocation arrangement. Parameter y = 0 is for dislocation storage without cross-‐slip and y = 0.5 nm accounts for dislocation cross-‐sip in pure copper. See text and Appendix A2 for details.
0 0.5 1.0 1.5 2.0 2.5 3.0 3.5 4.0 4.5 220
240
260
280
300
320
340 C2;$y$=$0$
C2;$y$=$0.5nm$C1;$y$=$0$
C1;$y$=$0.5$nm$
σ$(M
Pa) $
ε$×$1032$
Experiments
Simulations
0 0.8 1.6 2.4 3.2 4.0 0
25
50
75
100
300
350
ε (10-‐2)
D = 2 µm
<111>
D = 7 µm
D = 20 µm
σ (M
Pa) 200
250
Fig. 6: Representative uniaxial stress (σ)—logarithmic strain (ε) curves from experiments and simulations for strain-‐hardening <111> oriented micropillars with different diameters. (Experimental variability is illustrated in Fig. 1(a).) The simulations are for dislocation configuration C1 in the absence of dislocation cross-‐slip (y = 0). Accounting for cross-‐slip further improves agreement between experiments and simulations.
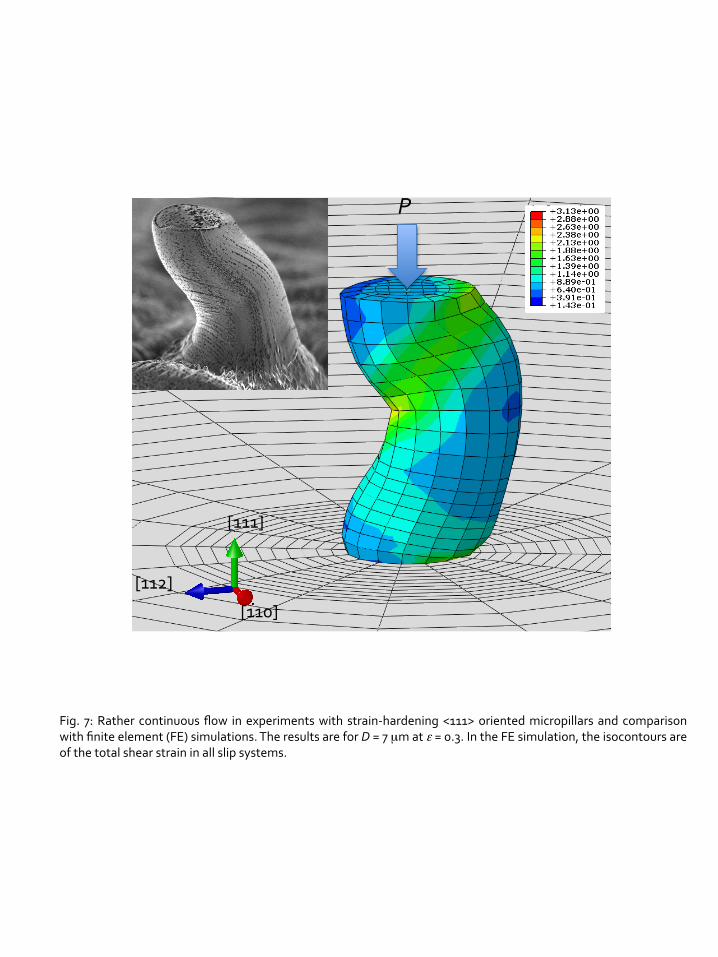
Fig. 7: Rather continuous flow in experiments with strain-‐hardening <111> oriented micropillars and comparison with finite element (FE) simulations. The results are for D = 7 µm at ε = 0.3. In the FE simulation, the isocontours are of the total shear strain in all slip systems.
[110]
[111]
[112]
P
10
10 0
-1
Complem
entary distribution, C(sε ) in
t
sε (units of Burgers vector, b)
<001> <111>
(a)
(b)
Constant-‐strain measures
1 10
<111>
Constant-‐stress measures
1 10 50
<001>
<111>
<012>
D = 1.2 µm
<111>
10 -1
10 0
Complem
entary distribution, C(sσ
) int
sσ (units of Burgers vector, b)
<012>
D = 2 µm
D = 2 µm
D = 1.2 µm
Confining plasticity
Strain hardening
plasticity Confining
Strain hardening
D = 1.2 µm
D = 1.2 µm
Fig. 8: Stress-‐integrated complementary cumulative distribution function of avalanche slips sσ and sε. Transition between the microscale strain hardening and confining plasticity domains is illustrated along with the flexibility of Eq. (12) in capturing experimental results. [Experiments used for the <001> orientation lie at the boundary between the plasticity domains, with prevalence of strain hardening.]
P(s)=As-‐1.5exp{-‐(s/smax)2}; Eq. (12)
P(s)=As-‐1.5exp{-‐(s/smax)2}; Eq. (12)
(a)
(b)
(c)
10 -1
68-73
73-78 78-83
83-88 88-93
93-98
63-68
10 0 [111]
s (units of Burgers vector, b) ε
10 2
C(s ε
)
10 0 [012]
10 2 s (units of Burgers vector, b) ε
10 -2
10 -1
60-65
65-70
70-75 75-80
80-85
85-90
10
10 -1
[001]
60-65 65-70
75-80 80-85
70-75
10 -2
10 0
2 s (units of Burgers vector, b) ε
Fig. 9: Stress—binned complementary cumulative distributions C(sε) of dislocation avalanches from the experiments in Fig. (8). The range of applied shear stresses in the active slip systems is given in MPa. Parts (a) and (b) are for micropillars deforming in the confining microscale plasticity regime. Part (c) is for micropillars deforming within the microscale strain hardening domain.
C(s ε
) C(s ε
)
10
10 -1
s (units of Burgers vector, b) σ2
[111] 10 0
70-80
80-90 90-100
(a)
(b)
(c)
Fig. 10: Stress—binned complementary cumulative distributions C(sσ) for strain increments at constant stress from the experiments in Fig. (8). The range of applied shear stresses in the active slip systems is given in MPa. Parts (a) and (b) are for micropillars deforming in the confining microscale plasticity regime where only a few points are available because of the vanishing slope of the stress—strain curves passed τc (see Fig. 1(b)). Part (c) is for micropillars deforming within the microscale strain hardening domain.
C(s σ
) C(s σ
) C(s σ
)
60-70
70-80
s (units of Burgers vector, b) 2 10 50
10 -1
10 0
70-80 80-90
s (units of Burgers vector, b) 2 10 50
10 -1
10 0
σ
σ
Appendix A: Supplementary Online Material
1. Accounting for dislocation cross-‐slip in microscale strain hardening The good agreement between experimental stress—strain curves and those predicted from mean-‐field analysis with configuration C1 can be further improved by accounting for dislocation cross-‐slip. Within the framework of Eq. (5) from the main text, cross-‐slip reduces dislocation storage through subtracting term 𝑦𝜌!, so that 𝑑𝜌!
𝑑𝛾!=1𝑏
1𝐿!""
− 𝑦𝜌! . Eq. (A1)
The agreement between experiments and simulations becomes optimum by assuming a critical annihilation distance 𝑦 = 0.5 nm, which is coincidental with that used in the modeling of dislocation cross-‐slip in bulk Cu crystals (e.g., [1]). While this is an effective modeling approach, it is recognized that the complexities of double cross-‐slip [2] and its influence in the development of a three-‐dimensional dislocation network are beyond the present analysis. It is nevertheless important to note that cross-‐slip does not affect upon the fundamentals of dislocation interactions as measured through matrix 𝑎!" in the main text [3]. 2. Stability of loading orientation and artifacts from micropillar compression Present strain-‐hardening model is implemented in a continuum crystal plasticity finite-‐element (FE) computational scheme [4], where anisotropic elasticity is accounted for in the analyses and rate-‐dependent plastic strains are assumed following [5]. This enables assessment of whether the plastic tilting of the micropillar along with the frictional constrains from its top surface would affect inferred stress—strain curves.
Micropillars with the <111> orientation show that for an apparent logarithmic uniaxial strain 𝜀 = ln (li/lo) = 5.0 x 10-‐2 –where li is the instantaneous pillar length (height) at a given stress level and lo is the initial pillar length– plastic flow accumulates exclusively along the pillar without any significant strain concentrations occurring at the bottom attachment with the bulk crystal. The bulk remains elastic because in the absence of surface truncated dislocation sources, plastic flow is prevented from occurring. The elastic strains at this attachment are thus vanishingly small and do not contribute to the inferred stress—strain curve. Pillar tilting followed by rotation further occurs for 𝜀 > 3.0 x 10-‐2 (Fig. A1(a)). This deformation mode arises because of the inducement of asymmetric flow at the bottom attachment with the bulk. By accounting for a small Coulomb’s friction coefficient 𝜇 = 0.05 between the <111> pillar and the compressing punch, onset of pillar tilting and rotation is however postponed to 𝜀 > 6 x 10-‐2 (Fig. A1(b)). Tilting and rotation are fully prevented even for 𝜀 > 0.2 when 𝜇 = 0.30 is imposed (Fig. A1(c)). Complementary simulations finally show that pillar tilting in less significant in the present multiple glide <111> oriented micropillars than in those oriented for single glide.
An important outcome from the above simulations is that whereas the apparent stress—strain curves obtained through micropillar compression experiments in <111> oriented copper crystals may not strictly describe the uniaxial strain hardening response at large uniaxial strain levels, these curves remain accurate to the maximum value of 𝜀 = 5.0 x 10-‐2 from Fig. 1 in the main text. This is so irrespectively of the assumed of 𝜇.
Finally, one may note that tapering along the pillar length occurs during FIB machining. In the present investigation, the diameter at the top surface of the micropillar was found to be ∼ 15% smaller than that at the bottom. In this sense, it is noted that the stress—strain curves in Fig. 1 from the main text where obtained under the assumption of an effective cross-‐sectional area located at the top 2/3 of the pillar length. Simulations of pillar tapering with the present mean-‐field strain hardening model showed that this approach is indeed sensible as the apparent uniaxial stress departs in less that 4% from the true value.
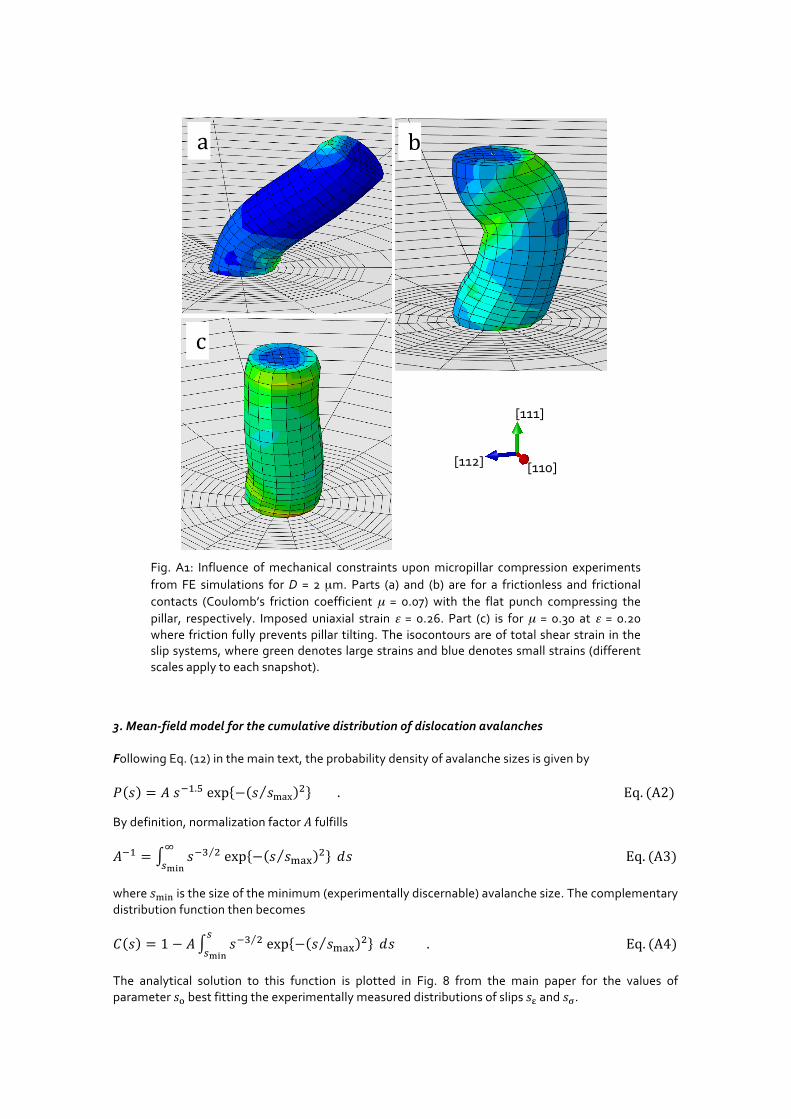
Fig. A1: Influence of mechanical constraints upon micropillar compression experiments from FE simulations for D = 2 µm. Parts (a) and (b) are for a frictionless and frictional contacts (Coulomb’s friction coefficient µ = 0.07) with the flat punch compressing the pillar, respectively. Imposed uniaxial strain ε = 0.26. Part (c) is for µ = 0.30 at ε = 0.20 where friction fully prevents pillar tilting. The isocontours are of total shear strain in the slip systems, where green denotes large strains and blue denotes small strains (different scales apply to each snapshot).
3. Mean-‐field model for the cumulative distribution of dislocation avalanches Following Eq. (12) in the main text, the probability density of avalanche sizes is given by 𝑃 𝑠 = 𝐴 𝑠!!.! exp − 𝑠 𝑠max ! . Eq. (A2)
By definition, normalization factor 𝐴 fulfills
𝐴!! = 𝑠!! ! exp − 𝑠 𝑠!"# ! 𝑑𝑠!
!!"# Eq. (A3)
where 𝑠!"# is the size of the minimum (experimentally discernable) avalanche size. The complementary distribution function then becomes
𝐶 𝑠 = 1 − 𝐴 𝑠!! ! exp − 𝑠 𝑠!"# ! 𝑑𝑠!
!!"# . Eq. (A4)
The analytical solution to this function is plotted in Fig. 8 from the main paper for the values of parameter 𝑠! best fitting the experimentally measured distributions of slips 𝑠! and 𝑠!.
[110]%%
[111]%%
[112]%%
[110]%%
[111]%%
[112]%%
[110]%%
[111]%%
[112]%%
[110]%%
[111]%%
[112]%%
a b
c
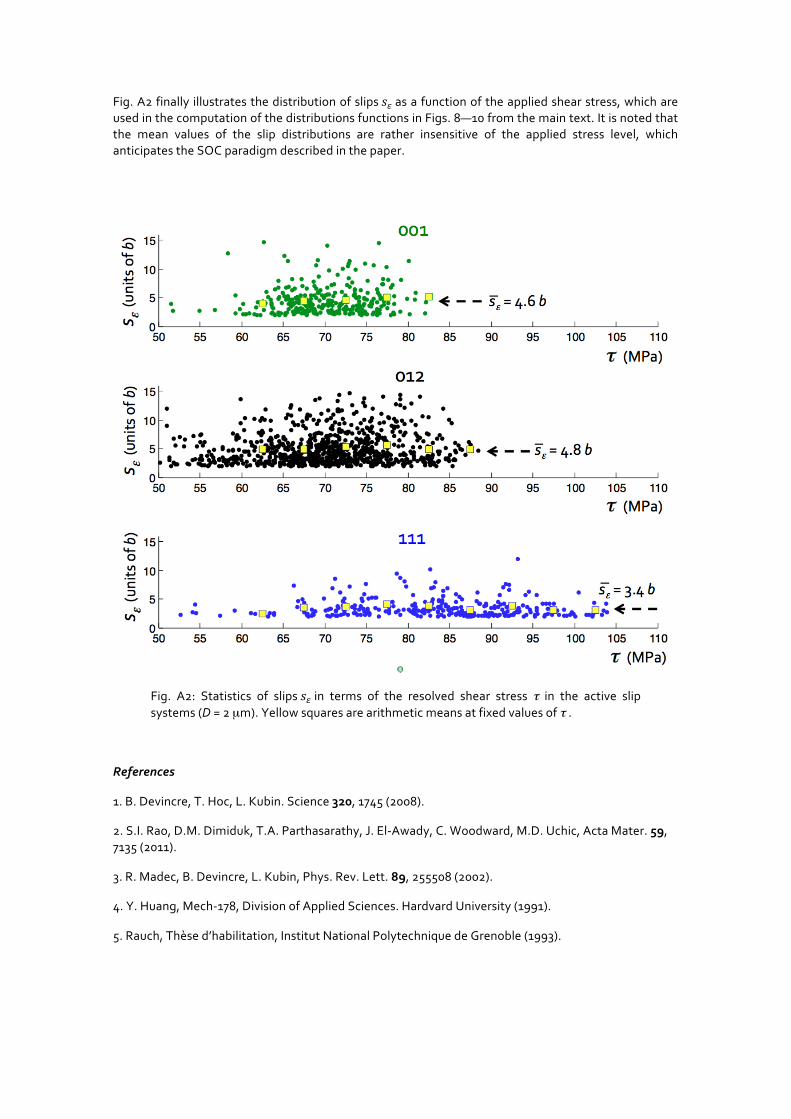
Fig. A2 finally illustrates the distribution of slips 𝑠! as a function of the applied shear stress, which are used in the computation of the distributions functions in Figs. 8—10 from the main text. It is noted that the mean values of the slip distributions are rather insensitive of the applied stress level, which anticipates the SOC paradigm described in the paper.
Fig. A2: Statistics of slips 𝑠! in terms of the resolved shear stress τ in the active slip systems (D = 2 µm). Yellow squares are arithmetic means at fixed values of τ .
References
1. B. Devincre, T. Hoc, L. Kubin. Science 320, 1745 (2008).
2. S.I. Rao, D.M. Dimiduk, T.A. Parthasarathy, J. El-‐Awady, C. Woodward, M.D. Uchic, Acta Mater. 59, 7135 (2011).
3. R. Madec, B. Devincre, L. Kubin, Phys. Rev. Lett. 89, 255508 (2002).
4. Y. Huang, Mech-‐178, Division of Applied Sciences. Hardvard University (1991).
5. Rauch, Thèse d’habilitation, Institut National Polytechnique de Grenoble (1993).