Embed Size (px)
Citation preview
STRAIN RATE SENSITIVITY OF ULTRA-HIGH
PERFORMACNE FIBER REINFORCED CONCRETE
by
ARIA AGHAJANI-NAMIN
B.Eng., M.Sc., EMU, Northern Cyprus, 2012
A report
presented to Ryerson University
in partial fulfillment of the
requirements for the degree of
Master of Engineering
in the Program of
Civil Engineering
Toronto, Ontario, Canada, 2014
©ARIA AGHAJANI-NAMIN 2014

i
Author’s Declaration
I hereby declare that I am the sole author of this project. This is a true copy of the project, including
any required final revisions as accepted by examiner.
I thereby authorize Ryerson University to reproduce or lend this project by photocopying or by other
means, in total or in part, at the request of other institutions or individuals for the purpose of
scholarly research.
I understand that my project may be made electronically available to the public.
ii
Abstract
STRAIN RATE SENSITIVITY OF ULTRA-HIGH PERFORMACNE
FIBER REINFORCED CONCRETE
by
ARIA AGHAJANI-NAMIN
Masters of Engineering
Civil Engineering
Ryerson University, Toronto, Canada 2014
Ultra High Performance Fiber Reinforced Concrete (UHP-FRC) is relatively new cementitious
material, which has been developed to enhance material performance such as, durability,
workability and strength. UHP-FRC has an outstanding dynamic performance with high capacity
to absorb damage. Because of its superior performance under dynamic loading, UHP-FRC has
been induced in structures where dynamic resistance is required. It is proven that like other
concrete materials, UHP-FRC strength increases significantly when subjected to high strain
rates. The objective of this study is to develop understanding of strain rate sensitivity of UHP-
FRC with 2% steel fiber by volume fraction and plain High Strength Concrete (HSC).
Compressive and flexural tensile strength of each concrete composite were investigated to
evaluate and compare their strain rate sensitivity through dynamic increase factor (DIF). The
specimens were tested under six different strain rates; three in quasi-static and three in dynamic
domain. Strain rates in quasi-static domain conducted by MTS test machine and strain rates in
dynamic domain conducted using the drop hammer technique. The test results revealed that
UHP-FRC exhibits less strain rate sensitivity while HSC show much higher rate sensitivity in
comparison to other materials.
Keywords: UHP-FRC, HSC, DIF, Strain Rates, Quasi-static, Dynamic, Rate Sensitivity

iii
Acknowledgement
I am heartily thankful to my supervisor, Dr. Hesham Marzouk whose encouragement, guidance
and support from the initial to the final level enabled me to develop an understanding of the
subject.
Lastly, I would like to add my heartfelt appreciation for all of those who supported me in any
respect during the completion of this thesis; especially Mr. Hesham Othman who helped me at
every step of this project. I would also like to thank Ryerson Civil Engineering Lab technicians,
who provided me technical assistance throughout this project.

iv
This project is dedicated to my beloved family and lovely wife for their understanding,
encouragement and undying support throughout the project.
v
Table of Content
Author’s Declaration ........................................................................................................................ i
Abstract ........................................................................................................................................... ii
Acknowledgement ......................................................................................................................... iii
List of Tables ................................................................................................................................. ix
List of Figures ................................................................................................................................. x
Chapter 1 ......................................................................................................................................... 1
INTRODUCTION .......................................................................................................................... 1
1.1 Overview ............................................................................................................................... 1
1.1 Project Scope ........................................................................................................................ 2
1.2 Project Objective ................................................................................................................... 2
1.3 Research Methodology ......................................................................................................... 3
1.4 Project Outline ...................................................................................................................... 3
Chapter 2 ......................................................................................................................................... 4
LITERATURE REVIEW ............................................................................................................... 4
2.1 Ultra High Performance Fiber Reinforced Concrete ............................................................ 4
2.1.1 Advantages of UHP-FRC .............................................................................................. 4
2.1.2 Application of UHP-FRC .............................................................................................. 5
2.2 UHP-FRC Material Constituent ............................................................................................ 6
2.2.1 Mixing and Casting ........................................................................................................ 7
2.2.2 Curing ............................................................................................................................ 8
2.3 Influence of Mix Parameters on Compressive Strength (f’c) ............................................... 8
2.3.1 Water-Cement Ratio (w/c) ............................................................................................. 8
2.3.2 Cement Type (C)............................................................................................................ 9
vi
2.3.3 Silica Fume Type (SF) ................................................................................................... 9
2.3.4 Amount and Type of HRWR ....................................................................................... 10
2.3.5 Fiber Content ............................................................................................................... 10
2.4 Static Properties of UHP-FRC ............................................................................................ 11
2.4.1 Compressive Strength .................................................................................................. 12
2.4.1.1 Compressive Strength Testing .............................................................................. 13
2.4.2 Tensile Strength (Direct Tension Test) ........................................................................ 14
2.4.2.1 Modulus of Rupture Test, fr .................................................................................. 15
2.4.3 Modulus of Elasticity, Ec ............................................................................................. 16
2.5 Dynamic Properties of UHP-FRC ...................................................................................... 17
2.5.1 Strain Rate Response of Concrete................................................................................ 17
2.5.2 Strain Rate Effect on the Strength of Concrete ............................................................ 18
2.5.2.1 Dynamic Increase Factor, DIF .............................................................................. 18
2.5.2.2 Strain Rate Properties of Concrete in Compression ............................................. 19
2.5.2.3 Strain Rate Properties of Concrete in Tension ...................................................... 21
2.5.3 Strain Rate Response of UHP-FRC ............................................................................. 22
2.6 Testing Methods for Concrete under High Strain Rates ..................................................... 24
2.6.1 Drop Hammer Technique ............................................................................................ 24
2.6.1.1 University of Toronto Drop Hammer Strain Rate Test ........................................ 24
2.6.1.2 RMIT University Drop Hammer Strain Rate Test ................................................ 25
2.6.1.3 University of Liverpool Drop Hammer Strain Rate Test...................................... 26
2.6.1.4 UBC Drop Hammer Strain Rate Test ................................................................... 27
2.6.2 Split Hopkinson Pressure Bar (SHPB) ........................................................................ 28
vii
Chapter 3 ....................................................................................................................................... 29
EXPERIMENTAL PROGRAM ................................................................................................... 29
3.1 Mixture Proportions ............................................................................................................ 29
3.1.1 UHP-FRC and EHP-FRC ............................................................................................ 29
3.1.2 EHS-FRC and HSC ..................................................................................................... 30
3.2 Mixing Procedure................................................................................................................ 30
3.3 Casting and Curing ............................................................................................................. 32
3.4 Compressive Strength Test ................................................................................................. 34
3.4.1 Modulus of Elasticity ................................................................................................... 35
3.4.2 Compressive Strength under Quasi-static and Dynamic Loading ............................... 36
3.5 Flexural Strength Test ......................................................................................................... 38
3.5.1 Flexural Strength under Quasi-static Loading ............................................................. 38
3.5.2 Flexural Strength under Dynamic (Impact) Loading ................................................... 40
3.6 Development of Drop Hammer Facility ............................................................................. 42
3.6.1. Drop Hammer Weight and Magnetic Release ............................................................ 43
3.6.2 Concrete Platform ........................................................................................................ 44
3.6.3 Ryerson University Drop Hammer Test Setup Instrumentation .................................. 45
3.6.3.1 Dynamic Load Cells ............................................................................................. 45
3.6.3.2 Accelerometers ..................................................................................................... 47
3.6.3.3. Data Acquisition System...................................................................................... 48
Chapter 4 ....................................................................................................................................... 49
RESULTS ANALYSIS AND DISCUSSION .............................................................................. 49
4.1 Introduction ......................................................................................................................... 49
4.2 Compression Tests .............................................................................................................. 49
4.2.1 Compressive Strength .................................................................................................. 49
viii
4.2.2 Stress – Strain Behaviour ............................................................................................. 50
4.2.3 Quasi-static Tests ......................................................................................................... 52
4.2.3 Dynamic Tests ............................................................................................................. 54
4.2.4 Dynamic Increase Factor, DIF ..................................................................................... 56
4.3 Flexural Tests ...................................................................................................................... 57
4.3.1 Flexural Tensile Strength ............................................................................................. 57
4.3.2 Quasi-static Tests ......................................................................................................... 59
4.3.3 Impact Tests ................................................................................................................. 60
4.3.4 Dynamic Increase Factor, DIF ..................................................................................... 66
4.4 Discussion of the Results .................................................................................................... 67
Chapter 5 ....................................................................................................................................... 70
CONCLUSION ............................................................................................................................. 70
5.1 Research Findings ............................................................................................................... 70
5.2 Recommendation for Future Studies .................................................................................. 71
REFERENCES ............................................................................................................................. 73
APPENDIX ................................................................................................................................... 77
ix
List of Tables
Table 2.1: UHP-FRC Application in Canada [10] ......................................................................... 5
Table 2.2: UHP-FRC Composition of Ductal [10] ........................................................................ 6
Table 2.3: Mechanical Properties Range of UHP-FRC [10] ....................................................... 11
Table 3.1: Mixture proportions for UHP-FRC and EHP-FRC ..................................................... 29
Table 3.2: Mixture proportions for EHS-FRC ............................................................................ 30
Table 3.3: Compressive Strength of each Composite at Different Age ........................................ 35
Table 3.4: Displacement and Strain Rates for Compressive Strength .......................................... 37
Table 3.5: Quasi-static Strain Rates for Flexural Strength .......................................................... 40
Table 3.6: Flexural Strength Strain rates .................................................................................... 41
Table 4.1: Compressive Strength of each Composite at Different Age ....................................... 49
Table 4.2: Stress-Strain Response of Concrete Composites ....................................................... 50
Table 4.3: Quasi-static Compressive Strength Test Results for all Composites .......................... 52
Table 4.4: Dynamic Compressive Strength Test Results for all Composites .............................. 54
Table 4.5: Dynamic Compressive Strength of Concrete .............................................................. 56
Table 4.6: Flexural strength of UHP-FRC, EHP-FRC, EHS-FRC and HSC ............................. 58
Table 4.7: Quasi-static Flexural Strength Test Results for EHP-FRC and EHS-FRC ................ 59
Table 4.8: Loading rates and strain rates for UHP-FRC ............................................................... 61
Table 4.9: Loading rates and strain rates for EHP-FRC ............................................................. 61
Table 4.10: Loading rates and strain rates for EHS-FRC ............................................................ 62
Table 4.11: Loading rates and strain rates for HSC .................................................................... 62
Table 4.12: Dynamic Flexural Strength Test Results for all Composites .................................... 64
Table 4.13: Dynamic Flexural Strength of Concrete Composites ............................................... 66
x
List of Figures
Figure 2.1: Effect of Water-Cement Ratio on Compressive Strength [1] ....................................... 9
Figure 2.2: Stress-Strain Curve for UHPC without Fibers [16].................................................... 12
Figure 2.3: Stress-Strain Curve for UHP-FRC (1% - 2.5%) [16] ................................................. 13
Figure 2.4: Tensile Stress-Strain of UHP-FRC by Graybeal et al [19] ........................................ 14
Figure 2.5: Idealized Uniaxial Tensile Response of UHP-FRC [20] ............................................ 15
Figure 2.6: Various Load Cases with Corresponding Strain Rates [24] ....................................... 17
Figure 2.7: Strain rate effect on compressive strength of different concrete types [24] .............. 20
Figure 2.8: Strain rate effect on tensile strength of different concrete types [24] ....................... 21
Figure 2.9: Proposed DIF Model for Peak Stress by Ngo et al [28] ............................................. 23
Figure 2.10: Drop-hammer test setup developed at RMIT [3] ..................................................... 25
Figure 2.11: Liverpool University Drop-hammer test facility [3] ................................................ 26
Figure 2.12: UBC Drop-hammer test facility [29] ........................................................................ 27
Figure 2.13: Typical Setup for a SHPB Device [24] .................................................................... 28
Figure 3.1: Slump Flow Test for EHP-FRC ................................................................................ 31
Figure 3.2: Prepared Moulds for Casting ..................................................................................... 32
Figure 3.3: Covered Samples with Damp Burlap during First Three Days ................................. 33
Figure 3.4: Specimens in the Curing Room: a) Prisms, b) Cylinders .......................................... 34
Figure 3.5: Cylinders in the Grinder ............................................................................................ 34
Figure 3.6: Cylinder Specimens before and after Grinding .......................................................... 34
Figure 3.7: MTS Test Machine for Compression Tests ............................................................... 36
Figure 3.8: Flexural Test in the MTS Machine .......................................................................... 39
Figure 3.9: Test Direction and Span of Prisms ........................................................................... 39
xi
Figure 3.10: Drop Hammer Facility Built at Ryerson University .............................................. 40
Figure 3.11: Drop Hammer Facility and Accessories .................................................................. 42
Figure 3.12: Drop Hammer Weight and Electrical Magnet ....................................................... 43
Figure 3.13: Steel Rebars and Hanger for Concrete platform ..................................................... 44
Figure 3.14: Placement of Sand and Concrete Platform ........................................................... 44
Figure 3.15: Preparation of Concrete Platform ........................................................................... 45
Figure 3.16: Location of the Dynamic Load Cell on Steel Cover ............................................... 46
Figure 3.17: Position of the Dynamic Load Cells, Steel Rollers and Steel Covers ..................... 46
Figure 3.18: Settled Dynamic Load Cell between Steel Covers ................................................. 46
Figure 3.19: Position of the Mounted Accelerometers on Drop Weight ..................................... 47
Figure 3.20: Applying Rubber on Drop Weight before Mounting Accelerometer ...................... 47
Figure 3.21: Data Acquisition System and P.C ........................................................................... 48
Figure 4.1: Stress – Strain Curve for all Composites .................................................................. 50
Figure 4.2: EHP-FRC Cylinders after Compressive Test ............................................................ 51
Figure 4.3: EHS-FRC Cylinders after Compressive Test .......................................................... 51
Figure 4.4: HSC Cylinders after Compressive Test .................................................................... 51
Figure 4.5: DIF in Quasi-Static Region ....................................................................................... 53
Figure 4.6: DIF in Dynamic Region ........................................................................................... 55
Figure 4.7: DIF for Compressive Strength ................................................................................ 57
Figure 4.8: Flexural Performance of EHP-FRC, EHS-FRC and HSC ....................................... 58
Figure 4.9: Typical Force – Time curve extracted from Load Cells .......................................... 60
Figure 4.10: UHP-FRC Prisms after Impact Test; i) 600 mm and ii) 800 mm ........................... 63
Figure 4.11: EHP-FRC Prisms after Impact Test; i) 400 mm, ii) 600 mm and iii) 800 mm ...... 63
xii
Figure 4.12: EHS-FRC Prisms after Impact Test; i) 400 mm, ii) 600 mm and iii) 800 mm ....... 63
Figure 4.13: HSC Prisms after Impact Test; i) 200 mm, ii) 400 mm and iii) 600 mm ............... 63
Figure 4.14: DIF versus Strain Rate for Flexural Tensile Strength ............................................ 67

1
Chapter 1
INTRODUCTION
1.1 Overview
Ultra-High Performance Concrete also known as UHPC was initially known as reactive powder
concrete (RPC) with a compressive strength over 150 MPa produced in bulk quantities, which
have been in interest around the world since early 1990s [1]. Despite of high compressive
strength and durability, UHPC shows poor tensile and flexural strength which make it prone to
cracking, and gradual increase of brittleness. Therefore many researches developed to reveal that
the mechanical characteristics of UHPC including high tensile strength and large ductility
continues to develop even after cracking in cooperation with fibers [2]. From these studies, Ultra
High Performance Fibre Reinforced Concrete (UHP-FRC) has merged. The composition of
UHP-FRC contains, high cement content, silica sand, silica fume, superplasticiser, metallic or
non-metallic fibres and very low water/cement ratio (as low as 0.2). The addition of high dosage
of steel fibres results in high flexural tensile strength, typically between 25 to 50 MP [3]. UHP-
FRC has several advantages because of their high compressive strength including, high
durability, flexibility, impact resistance, corrosion resistance, improved freezing and thawing
resistance, increasing resistance against various chemical and higher penetration resistance [1].
Researches indicate that UHP-FRC has an outstanding dynamic performance and very high
toughness, which makes it potentially suitable for structures that require to-resist impact, shock
and explosive loading. These structures include bridges, gas tanks, offshore structures, nuclear
reactor containment shields, heavy-duty runways, defense shelter, crash barriers, seismic
resistance structures, and structures of military and strategic importance designed to withstand
explosive blast [4]. However, despite the recent efforts for evaluation of the static behavior of
UHP-FRC, much lower investigation carried out for understanding of its behaviour under
dynamic loading.
2
The need of the civilian and military structures protection from terrorist or enemy attacks has
never been greater. To minimize damage and prevent total collapse, such structures must possess
greater resistance to impact loading [4]. Researches show that concrete have the ability to
response at very high strain rate when subjected to dynamic loading, and its strength increases
significantly within these rates [5]. Dynamic Increase Factor (DIF) is the most popular method
for taking account of strain rate effects on both deformation and failure.
Therefore, this study will investigate and compare the high strain rate response and provides
dynamic increase factor (DIF) in compression and tension for UHP-FRC, and High Strength
Concrete (HSC).
1.1 Project Scope
The scope of the study is:
To evaluate the strain rate sensitivity of different UHP-FRC mix designs and compare
them with HSC.
1.2 Project Objective
The objectives of this study are as follows:
To develop a fully understanding of UHP-FRC and HSC behaviour at high strain rate
response,
To develop an understanding of the mechanical properties of mentioned concrete
composites under impact loading,
To develop and approach to evaluate mechanical properties of mentioned material under
impact loading using drop weight hammer setup,
To evaluate and compare the dynamic increase factor for each material in compression
and tension.
3
1.3 Research Methodology
In order to fulfill the objectives of this study, the experimental program was designed form to
investigate the strain rate effect on the concrete properties. The experimental program aims to
develop a fundamental understanding of strain rate dependency of different concrete types. To do
so, four different types of concrete mix designs were tested. Compressive and flexural strengths
of each concrete type were investigated at different strain range from quasi-static to dynamic.
Finally, obtained results were evaluated and discussed, and major findings of the study were
presented in point form. In the following sections, concrete types used in this study and tests
procedures are described.
1.4 Project Outline
This project comprises of five chapters including the introductory chapter. The appendices are
also included to provide supporting data for drop weight hammer setup.
Chapter 2 is comprised of literature review on Ultra High Performance Concrete. This section is
devoted to review of material composition, mechanical properties, influence of cooperation of
steel fibers, strain rate effect and dynamic properties of UHP-FRC.
Chapter 3 identifies the experimental program that was undertaken to achieve the desired
objective and experimental basis on which this program is formulated. The details and
construction of drop weight hammer setup is discussed as well as the quasi-static and dynamic
testing procedure of each set of the specimens.
Chapter 4 discusses the observed result from compressive and flexural strength test procedure,
and evaluation of dynamic increase factor. The test results are illustrated in terms of graph and
tables for better comparison and understanding of dynamic enhancement of UHP-FRC with 2%
steel fibers.
Chapter 5 includes the summary and the conclusion of the project. In this chapter major findings
in project is discussed and finally at the end introduces recommendations for future work and
studies.
4
Chapter 2
LITERATURE REVIEW
2.1 Ultra High Performance Fiber Reinforced Concrete
In the last two decades a remarkable development had been discovered in concrete technology.
One of the most important discoveries in this field was the development of Ultra-High
Performance Fiber Concrete (UHP-FRC). UHP-FRC is in the category of High Performance
Fiber Reinforced Cement Composites (HPFRCC), which defines as a type of Fiber Reinforced
Concretes (FRC) that exhibit strain-hardening under tensional force [6]. Furthermore, UHP-FRC
is characterized by a dense matrix and very low permeability in comparison to HPFRCC, High
Strength Concrete (HSC) and Normal Strength Concretes (NSC) [4, 6].
In general, UHP-FRC is integration of Ultra High Performance Concrete (UHPC) and Fibre
Reinforced Concrete which exhibits a unique combination of significant technical characteristics,
such as, ductility, durability, and high strengths (compressive strength over 150 MPa and tensile
strength over 10 MPa) [2, 7]. Regarding the tensile characteristics, Rossi et al. [8] reported that
the fiber of UHP-FRC plays and important role in the ductile behaviour of a structure until
flexural failure and found the increase in ultimate tensile strain capacity up to 5 × 10⁻³
.
2.1.1 Advantages of UHP-FRC
The main advantage of UHP-FRC is the low permeability obtained through dense particle
packing in combination with strain hardening behaviour which can improve the durability of
UHP-FRC structural member in compare to normal concrete member [8, 1]. Furthermore, Katrin
& Paul [9] reported that in comparison to normal strength concrete UHP-FRC materials show
improved structural behaviour, high energy absorption, high resistance to spalling and scabbing
under impact loading. Therefore, such characteristic make it potentially suitable for structures
that require impact, shock and explosive loading [4].

5
2.1.2 Application of UHP-FRC
In general, UHP-FRC is suitable for use in the following structures [4, 6]:
Bridge Rehabilitation
Offshore structures
Blast or impact proactive structures
Seismic resistance structures
Gas tank and crash barriers
Archi-structural features
The fabrication of precast element
Durable components exposed to marine
In recent years many UHP-FRC structures have been constructed in different countries such as,
Canada, France, Germany, Japan, South Korea and USA. The first application of UHP-FRC was
the UHP-FRC in-filled steel tube composite used in the construction of a footbridge in 1997 at
Sherbrook, Canada [6]. Table 2.1 provides a list of the recent UHP-FRC applications in bridge
construction in Canada.
Table 2.1: UHP-FRC Applications in Canada [10]
Name Location Year Application
Middle Lake Bridge on
Highway 17A, Ontario, Canada 2012
Joint fill between precast
curbs and precast
approach slabs
McCauley Creek
Bridge on Highway 11, Ontario, Canada 2013
Joint fill between
adjacent box beams
Little Pic River Bridge
on Highway 17, Ontario, Canada 2013
Shear connector pockets
and panel joints
Jackfish River Bridge
on Highway 17, Ontario, Canada 2013
Shear connector pockets
and panel joints
Westminster Drive Ontario, Canada 2014 Longitudinal joints to connect
superstructure modules.
6
2.2 UHP-FRC Material Constituent
The development of UHP-FRC mixtures without heat or pressure treatment has been a challenge
because of its large array of influencing parameter [1]. These include properties and particle size
of the material component, mixture proportions, the mixing procedure and test method. Many
researches have done to evaluate the correlation between flow ability and packing density of the
paste. The idea is to optimize the mixtures developed to decrease the effort needed to achieve
high compressive strength (exceeding 150 MPa) without need for special heat or pressure
treatment [1, 8].
Different combinations of UHP-FRC materials may be used, depending on the application and
supplier. In general, formulations often consist of a combination of Portland cement, fine sand,
silica fume, high-range water-reducing admixture (HRWR) or superplasticizer, fibers (usually
steel), and water. Small aggregates are sometimes used, as well as a variety of chemical
admixtures. In the following section (2.3) influence of each component on compressive strength
of the UHP-FRC is discussed. Note that coarse aggregates are eliminated from UHP-FRC in
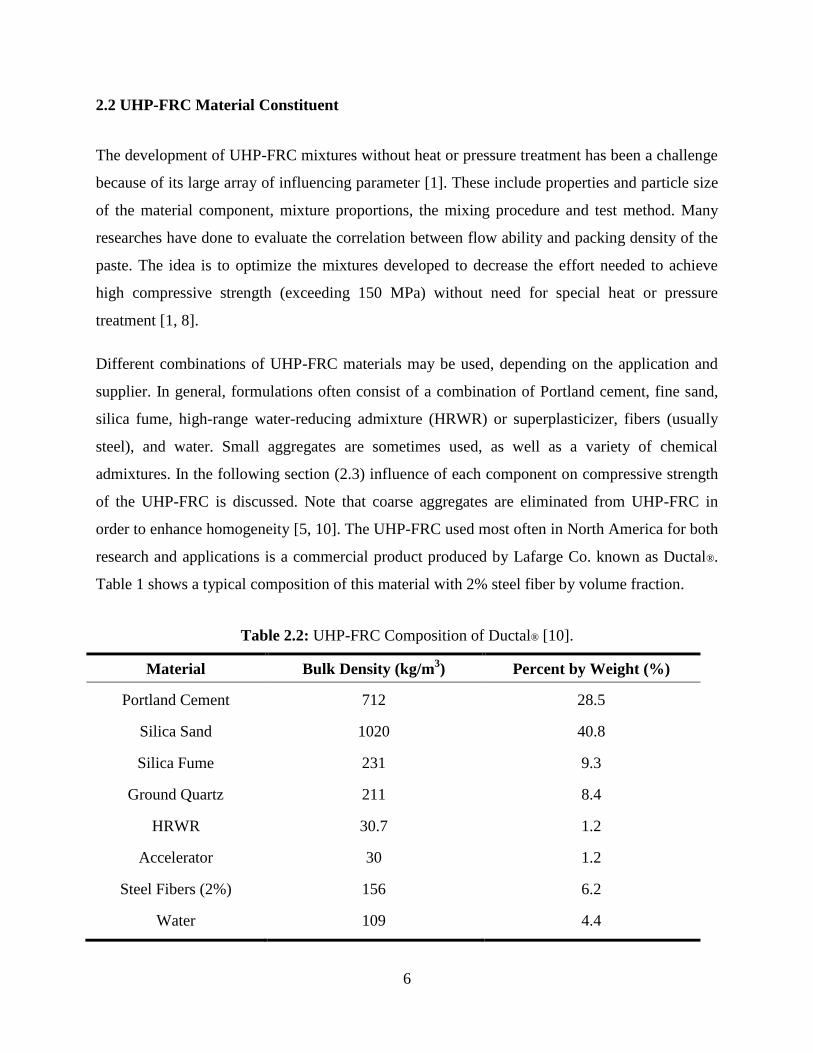
order to enhance homogeneity [5, 10]. The UHP-FRC used most often in North America for both
research and applications is a commercial product produced by Lafarge Co. known as Ductal®.
Table 1 shows a typical composition of this material with 2% steel fiber by volume fraction.
Table 2.2: UHP-FRC Composition of Ductal® [10].
Material Bulk Density (kg/m3) Percent by Weight (%)
Portland Cement 712 28.5
Silica Sand 1020 40.8
Silica Fume 231 9.3
Ground Quartz 211 8.4
HRWR 30.7 1.2
Accelerator 30 1.2
Steel Fibers (2%) 156 6.2
Water 109 4.4
7
Wille et al. [11] obtained compressive strength exceeding 200 MPa at 28 days on 50 mm cubes
with no heat or pressure curing by optimizing the cementitious matrix, packing density, and
flowability; using very high strength, fine-diameter steel fibers; and tailoring the mechanical
bond between the steel fiber and cement matrix. In addition, a tensile strength of 34.6 MPa at a
strain of 0.46 percent was achieved.
2.2.1 Mixing and Casting
Most of conventional concrete mixers are able to mix UHP-FRC. However, mixing time is
increased in compare to normal concrete because UHP-FRC requires more increased energy
input. Therefore mixing time should be increased. The use of modified procedure is suggested to
ensure that UHP-FRC does not overheat during mixing. In this case, high-energy mixers could
be used or by lowering the temperature of constituents or partially replacing the mix water with
ice could help the mixing [10].
In mixing UHP-FRC, the number of ingredient is higher and the fineness of particles is more
than NSC. Therefore, it is important that all particles are uniformly distributed [1]. The reason is
that very fine particle tend to form chunks and minimal shear force for breaking these chunks can
be reduced by keeping the particles dry.
Therefore, it is recommended that all dry compositions such as, silica fume, sand and cement
should be mixed first for 10 minutes. Afterwards mix of water and HRWR to be added gradually
for improvement of flowability [1, 9]. After 5 minutes of addition of water and HRWR, UHP-
FRC becomes fluid. Finally, the last step is to add the fibers and let the batch to mix for
additional 5 minutes.
UHP-FRC casting requires special considerations in terms of placement operations. This material
tend to exhibit rheological behaviors similar therefore, it requires additional form preparation.
Internal vibration of UHP-FRCC is not recommended due to fiber reinforcement, but limited
external form vibration can be done to facilitate the release of entrapped air [10].
8
2.2.2 Curing
The two critical components of UHP-FRC curing are temperature and moisture. Like any other
cementitious material, maintaining an appropriate temperature is vital to achieving the desired
rate of the cementitious reactions. Additionally, because of the low water content of UHP-FRC,
the loss of internal water must be prevented by maintaining a high humidity environment [10].
The curing of UHP-FRC occurs in two phases. The initial curing phase consists of maintaining
an appropriate temperature while preventing moisture loss until setting has occurred and rapid
mechanical property growth is occurring. The second curing phase may include elevated
temperature conditions and a high moisture environment [10, 12].
Graybeal et al. [12] conducted a study to determine material properties of UHP-FRC using four
different post-set curing procedures. In this steam curing was involved at 90 °C and 60 °C for 48
hours, starting about 24 hours after casting; steam curing at 90 °C, starting after 15 days of
standard curing; and curing at standard laboratory temperatures until test age. These three steam
curing methods increased the measured compressive strengths and modulus of elastic. The
researcher observed that enhancements achieved by the lower steam temperature and delayed
steam curing (after 15 days) were slightly less than achieved by steam curing at the higher
temperature.
2.3 Influence of Mix Parameters on Compressive Strength (f’c)
2.3.1 Water-Cement Ratio (w/c)
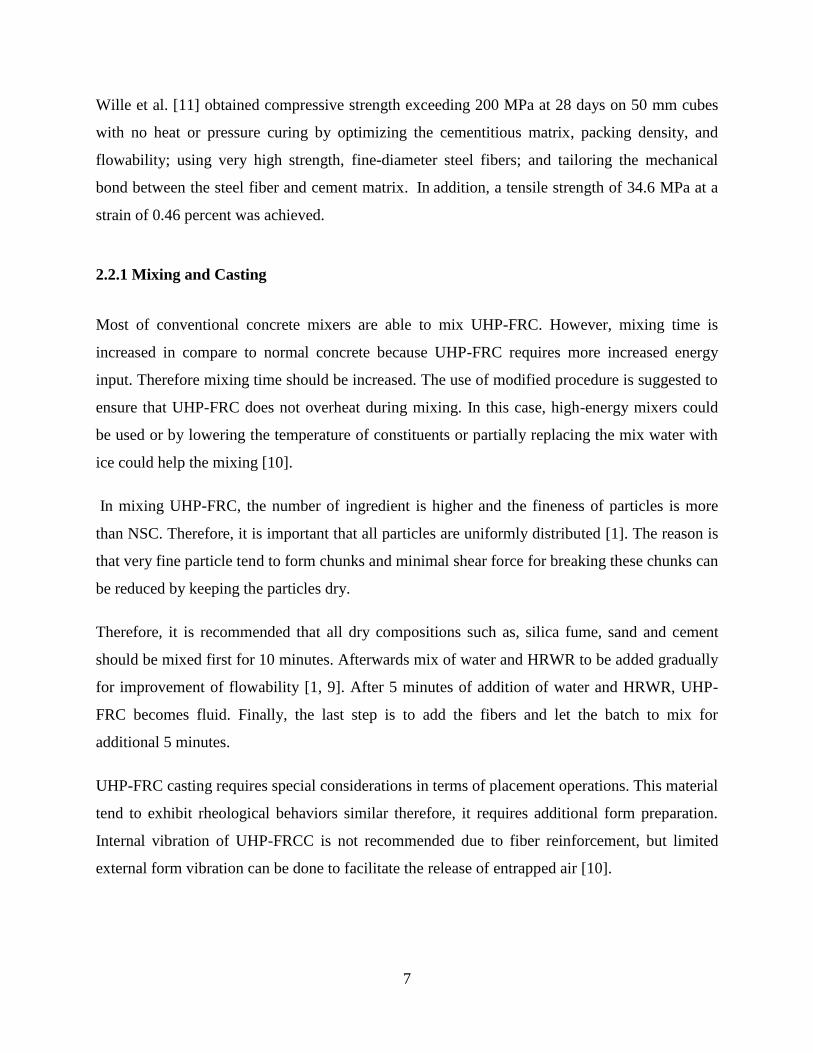
In Figure 2.1 (next page) influence of water-cement ratio on the compressive strength of UHPC
with 2.5% fiber by volume fraction is illustrated by Wille et al. [1]. It can be seen that the
compressive strength decreases significantly with an increase in w/c. This can be confirmed as
least-square fitting line is decreasing. The researchers reported a compressive strength as low as
115 MPa for a w/c of 0.265, and as high as 206 MPa for w/c of 0.22. On the other hand variation
of compressive strength for w/c of 0.22 (150 MPa to 206 MPa) indicates that w/c is not the only
dominant parameter influencing compressive strength. This is due to different Silica-Fume-
Cement ratio (SF/C) ranging between 18 and 25% used in the mixture for their investigation.
9
Figure 2.1: Effect of Water-Cement Ratio on Compressive Strength by Wille et al. [1]
2.3.2 Cement Type (C)
Type I ASTM Standard or Type 10 CSA standard Portland cement with a low content of C3A
and low-to-moderate fineness of approximately 4000 cm2/g is suggested by Wille et al. [1]
because of fast hydration process of C3A. Additionally, the associated increase in the surface
area of the particles and the demand for water to surround the particles reported to lead to a
higher viscosity during the mixing process. The researcher also reported that between fifteen
different mixture with different cement type the best results were achieved with Type I Portland
cement which had a high amount of C3S + C2S, and amount of C3A of 5%.
2.3.3 Silica Fume Type (SF)
Silica Fume (SF) can improve the packing density of the matrix both physically and chemically
[1]. With a median particle size of approximately 0.5 μm, SF is approximately 20 times smaller
than cement particles. The specific area of SF particles varies between 12 and 25 m2/g in
comparison to specific area of 0.4 m2/g for typical type 10 cement. In this investigation Wille et
al. [1] found that effect of the type of SF on compressive strength is negligible.
10
2.3.4 Amount and Type of HRWR
According to Wille et al. [1] fresh properties of the paste are highly influenced by the type of
high-range water-reducing admixture (HRWR) and it’s interaction with the cement particles. The
most commonly used type of the HRWR for mixing UHP-FRC is based on polycarboxylate ether
such as, superplasticizer (SP) with different side chain lengths. In their experimental program
Wille et al. [1] carried out three test series with same mixture but different amounts of HRWR
with 8%, 4% and 3.4% respectively. From these tests they observed that reducing the amount of
HRWR increases both the flowability and the compressive strength. It has been reported that the
optimum range of 1.4 to 2.4% of cement by weight or a solid content of HRWR between 0.5 and
0.9% if cement by weight.
2.3.5 Fiber Content
To-date many researches have done on the influence of the fiber content on mechanical
properties of UHP-FRC such as, compressive strength, flexural tensile strength and tensile
fracture properties. In their research study on tensile fracture properties of UHP-FRC with
different steel fibers, Su-Tae et al. [2] observed that flexural tensile strength of UHP-FRC
linearly increases as the fiber volume ratio increase from 0 to 5%.
A content of 2 % by volume of 13-15 mm length steel fibres with diameters around 0.2 mm
found to be the best optimum out of thousands of tests with high bending and direct tensile
strength [13]. On the other hand, the 5% fiber content was found as the most effective percentage
to resist spalling and defragment [9].
Improvement of the mechanical properties of UHP-FRC observed by addition of straight (13 mm
long, 0.2 mm diameter), high strength steel fibers of 2.5 % by volume in replacement of the
equivalent volume of sand [1]. Maximum direct tensile strength of 14 MPa and an equivalent
bending strength of 30 MPa also achieved. More influence of fiber content on UHP-FRC
mechanical properties are discussed in section 2.4.
11
2.4 Static Properties of UHP-FRC
UHP-FRC is known by its outstanding mechanical properties, such as, high compressive
strength, strain hardening behaviour under uniaxial tension, stiffness, high modulus of elasticity,
and toughness [14, 15].
The type of curing has a significant effect on mechanical properties of UHP-FRC. The
application of heat and pressure curing will increase the mechanical properties such as,
compressive strength, tensile strength and modulus of elasticity [10]. However, due to practical
and economic reasons, heat or pressure curing cannot be used in the field applications [15]. It
should be mentioned that, the orientations of the fiber reinforcement are critical parameters
which could influence the mechanical behavior of UHP-FRC. Mixing and placing methods also
could affect its mechanical response; therefore it must be appropriately coordinated to ensure
acceptable mechanical performance [10].
In this section (2.4.1 – 2.4.3) mechanical property of UHP-FRC related to this study in quasi-
static region is discussed. The typical mechanical properties range for UHP-FRC is listed in
Table below (Table 2.3).
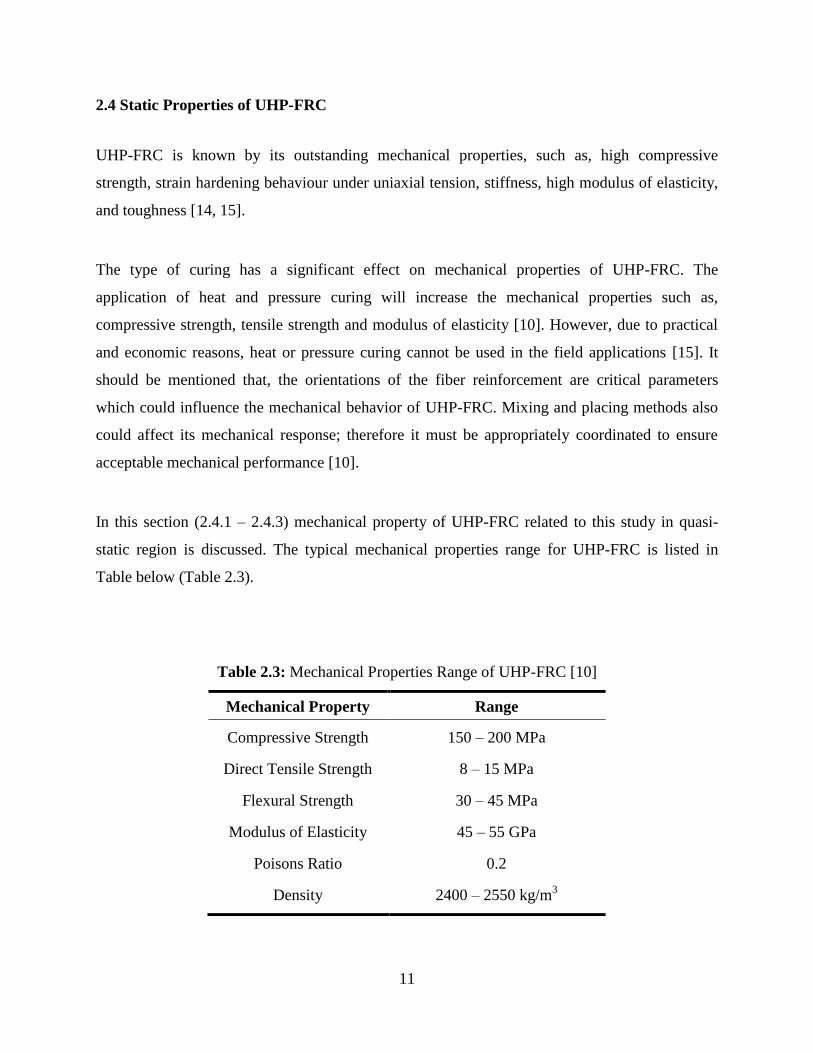
Table 2.3: Mechanical Properties Range of UHP-FRC [10]
Mechanical Property Range
Compressive Strength 150 – 200 MPa
Direct Tensile Strength 8 – 15 MPa
Flexural Strength 30 – 45 MPa
Modulus of Elasticity 45 – 55 GPa
Poisons Ratio
Density
0.2
2400 – 2550 kg/m3
12
2.4.1 Compressive Strength
Compressive strength is an important property in the design of any concrete structure. It is also
the property that is most frequently measured. As mentioned earlier a typical compressive
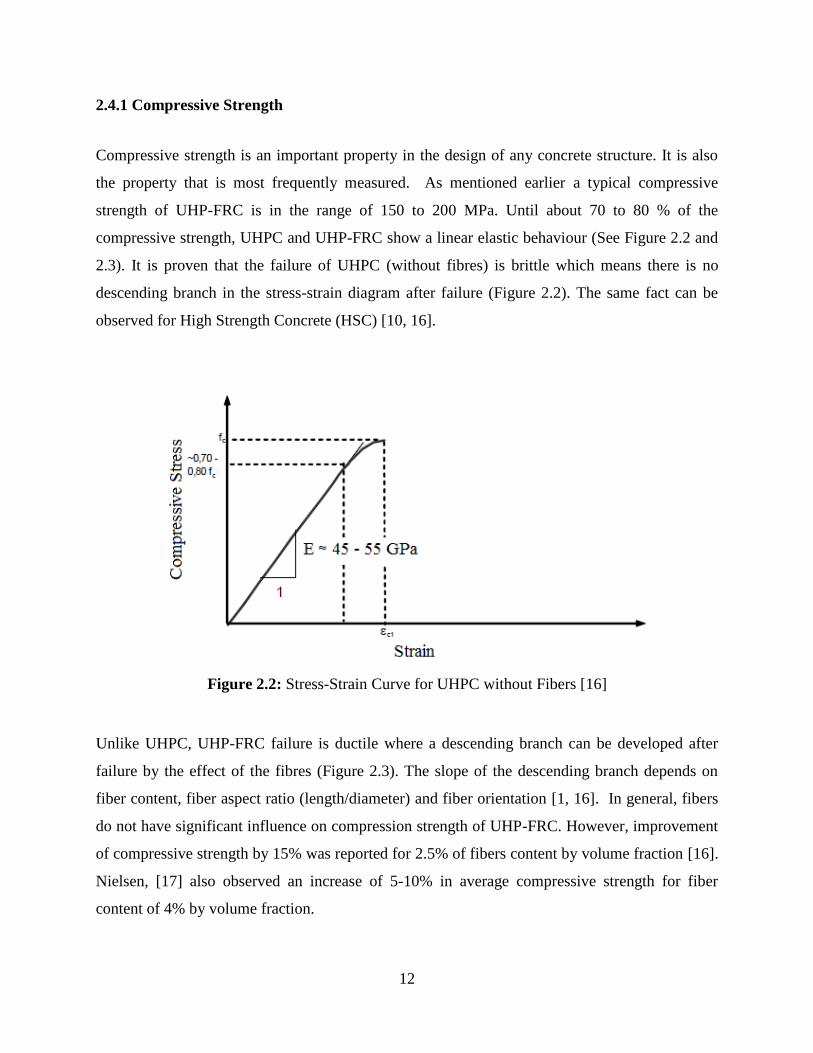
strength of UHP-FRC is in the range of 150 to 200 MPa. Until about 70 to 80 % of the
compressive strength, UHPC and UHP-FRC show a linear elastic behaviour (See Figure 2.2 and
2.3). It is proven that the failure of UHPC (without fibres) is brittle which means there is no
descending branch in the stress-strain diagram after failure (Figure 2.2). The same fact can be
observed for High Strength Concrete (HSC) [10, 16].
Figure 2.2: Stress-Strain Curve for UHPC without Fibers [16]
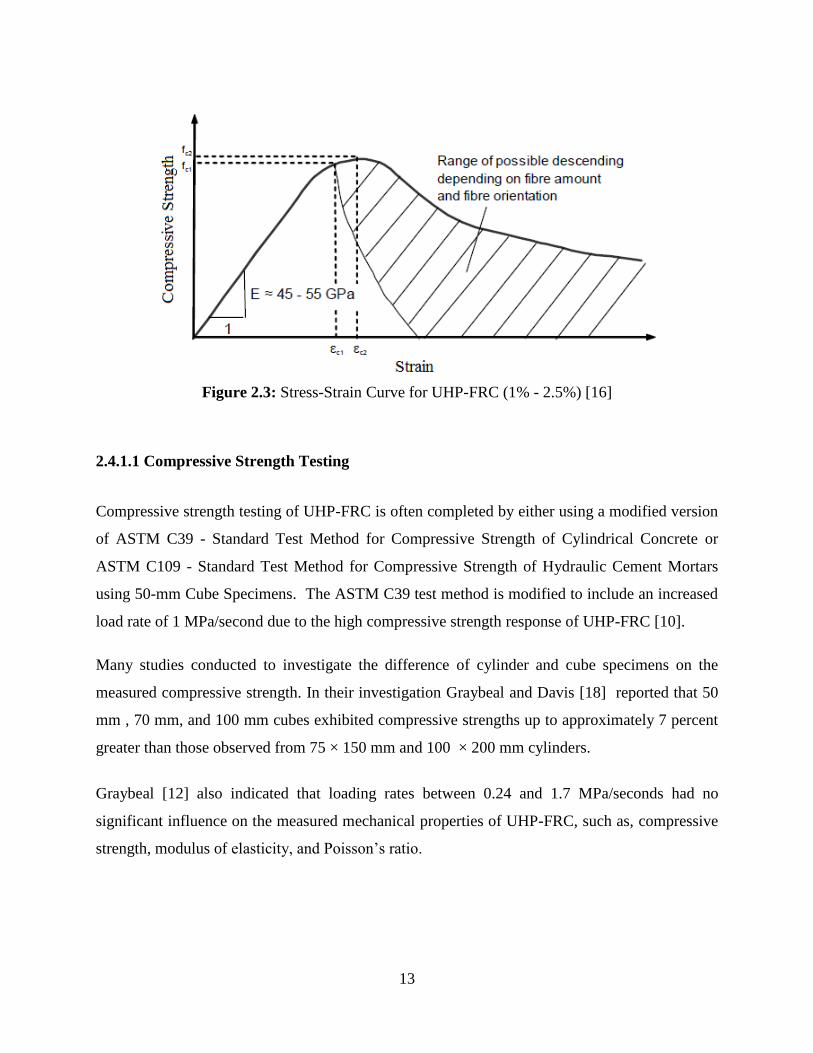
Unlike UHPC, UHP-FRC failure is ductile where a descending branch can be developed after
failure by the effect of the fibres (Figure 2.3). The slope of the descending branch depends on
fiber content, fiber aspect ratio (length/diameter) and fiber orientation [1, 16]. In general, fibers
do not have significant influence on compression strength of UHP-FRC. However, improvement
of compressive strength by 15% was reported for 2.5% of fibers content by volume fraction [16].
Nielsen, [17] also observed an increase of 5-10% in average compressive strength for fiber
content of 4% by volume fraction.
13
Figure 2.3: Stress-Strain Curve for UHP-FRC (1% - 2.5%) [16]
2.4.1.1 Compressive Strength Testing
Compressive strength testing of UHP-FRC is often completed by either using a modified version
of ASTM C39 - Standard Test Method for Compressive Strength of Cylindrical Concrete or
ASTM C109 - Standard Test Method for Compressive Strength of Hydraulic Cement Mortars
using 50-mm Cube Specimens. The ASTM C39 test method is modified to include an increased
load rate of 1 MPa/second due to the high compressive strength response of UHP-FRC [10].
Many studies conducted to investigate the difference of cylinder and cube specimens on the
measured compressive strength. In their investigation Graybeal and Davis [18] reported that 50
mm , 70 mm, and 100 mm cubes exhibited compressive strengths up to approximately 7 percent
greater than those observed from 75 × 150 mm and 100 × 200 mm cylinders.
Graybeal [12] also indicated that loading rates between 0.24 and 1.7 MPa/seconds had no
significant influence on the measured mechanical properties of UHP-FRC, such as, compressive
strength, modulus of elasticity, and Poisson’s ratio.
14
2.4.2 Tensile Strength (Direct Tension Test)
The tensile strength of UHPC (without fibres) is between 7 and 10 MPa while, the tensile
strength of UHP-FRC is in the range between 7 and 15 MPa [16]. Because of the fibers
influence, the behaviour of UHP-FRC becomes ductile and tensile strength is sustained after first
cracking. Therefore, the result of UHP-FRC tensile strength usually reports the first cracking
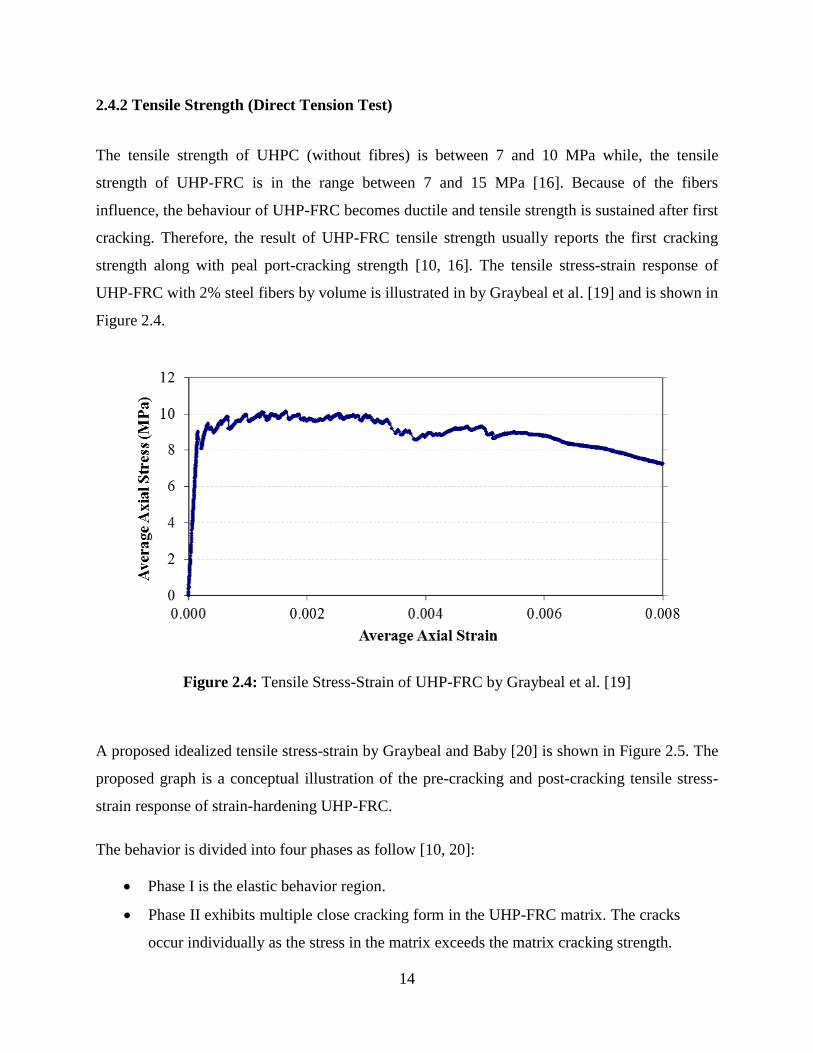
strength along with peal port-cracking strength [10, 16]. The tensile stress-strain response of
UHP-FRC with 2% steel fibers by volume is illustrated in by Graybeal et al. [19] and is shown in
Figure 2.4.
Figure 2.4: Tensile Stress-Strain of UHP-FRC by Graybeal et al. [19]
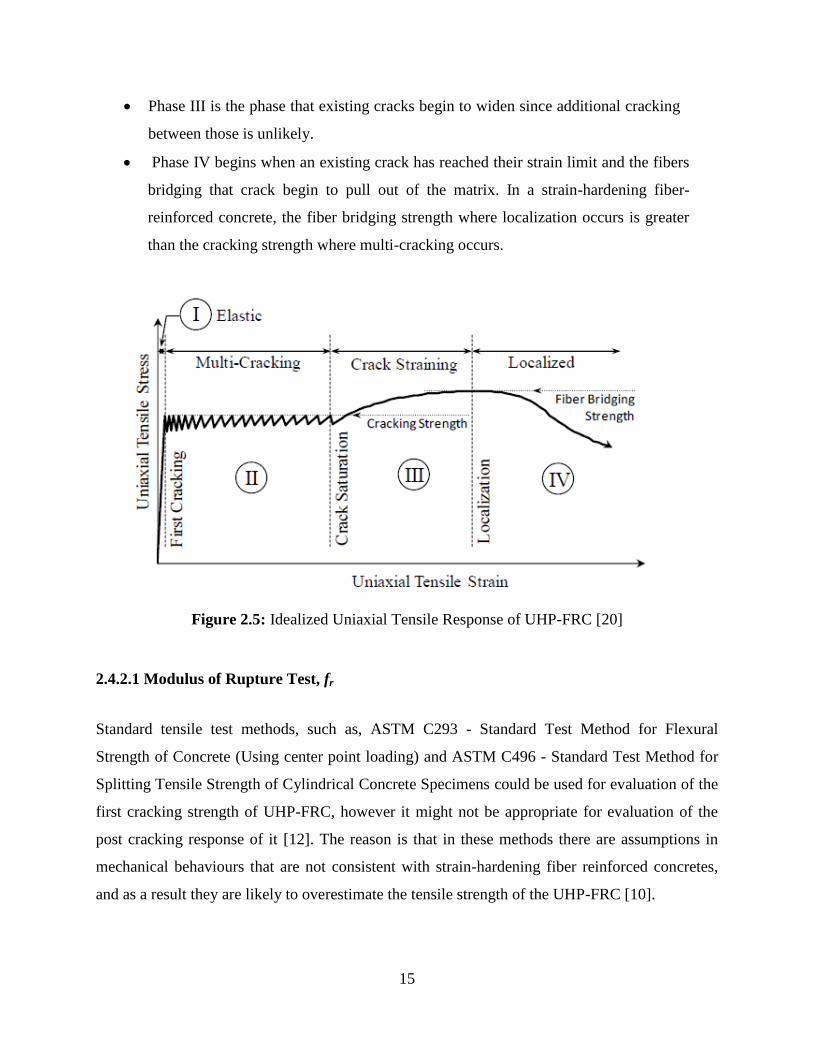
A proposed idealized tensile stress-strain by Graybeal and Baby [20] is shown in Figure 2.5. The
proposed graph is a conceptual illustration of the pre-cracking and post-cracking tensile stress-
strain response of strain-hardening UHP-FRC.
The behavior is divided into four phases as follow [10, 20]:
Phase I is the elastic behavior region.
Phase II exhibits multiple close cracking form in the UHP-FRC matrix. The cracks
occur individually as the stress in the matrix exceeds the matrix cracking strength.
15
Phase III is the phase that existing cracks begin to widen since additional cracking
between those is unlikely.
Phase IV begins when an existing crack has reached their strain limit and the fibers
bridging that crack begin to pull out of the matrix. In a strain-hardening fiber-
reinforced concrete, the fiber bridging strength where localization occurs is greater
than the cracking strength where multi-cracking occurs.
Figure 2.5: Idealized Uniaxial Tensile Response of UHP-FRC [20]
2.4.2.1 Modulus of Rupture Test, fr
Standard tensile test methods, such as, ASTM C293 - Standard Test Method for Flexural
Strength of Concrete (Using center point loading) and ASTM C496 - Standard Test Method for
Splitting Tensile Strength of Cylindrical Concrete Specimens could be used for evaluation of the
first cracking strength of UHP-FRC, however it might not be appropriate for evaluation of the
post cracking response of it [12]. The reason is that in these methods there are assumptions in
mechanical behaviours that are not consistent with strain-hardening fiber reinforced concretes,
and as a result they are likely to overestimate the tensile strength of the UHP-FRC [10].
16
Graybeal [21] has proposed a modified version of ASTM C496 which requires monitoring the
firs cracking of the UHP-FRC during the test and calculating the splitting tensile strength based
on the observed cracking load (first crack).
There are different ways of measuring tensile strength of UHP-FRC such as, split tensile test,
direct tension test and etc. In his research, Graybeal [12] measured the tensile strength of UHPC
using flexural prisms, split cylinders, mortar briquettes, and direct tension tests of cylinders.
Form these tests he indicated a first tensile cracking strength of approximately 9.0 MPa for
steam-cured specimens and approximately 6.2 MPa without any heat treatment. The modulus of
rapture values for first cracking was between ranges of 9.0 to 10.3 MPa, depending on the
method of steam curing.
In this study, Graybeal [18] realized that the tensile strength (fr) of UHPC is related to the
measured compressive strength (f ’c) and introduced the following equation.
fr = 0.65 √ or 0.69 √ in MPa unit For steam curing (1)
fr = 0.56 √ in MPa unit For untreated specimens
(2)
2.4.3 Modulus of Elasticity, Ec
Because of its dense structure, UHP-FRC has a higher modulus of elasticity than normal and
high strength concrete [16]. UHP-FRC does not require any specific modifications to the
standard ASTM C469 test method for static modulus of elasticity [10].
The UHPC modulus of elasticity (Ec) equation for the value of compressive strength (f 'c)
ranging “between” 38 to 193 MPa is given as follows by Graybeal [18]:
Ec = 3840 √ in MPa unit (3)
17
2.5 Dynamic Properties of UHP-FRC
This section introduces strain rate effect on concrete under both compression and tension. The
discussion in this section is focused on the influence of strain rate effect on mechanical properties of
UHP-FRC taking into account of the experimental technique related to this study.
2.5.1 Strain Rate Response of Concrete
It’s a well-known and accepted fact that the dynamic behavior of concrete materials is strain-rate
dependent [22]. In compare to statically behaviour, concrete exhibits increase in strength, higher
strain capacity and fracture energy when subjected to higher loading rate [23]. Many concrete
structures which are required to resist extreme dynamic and impact loading such as, nuclear
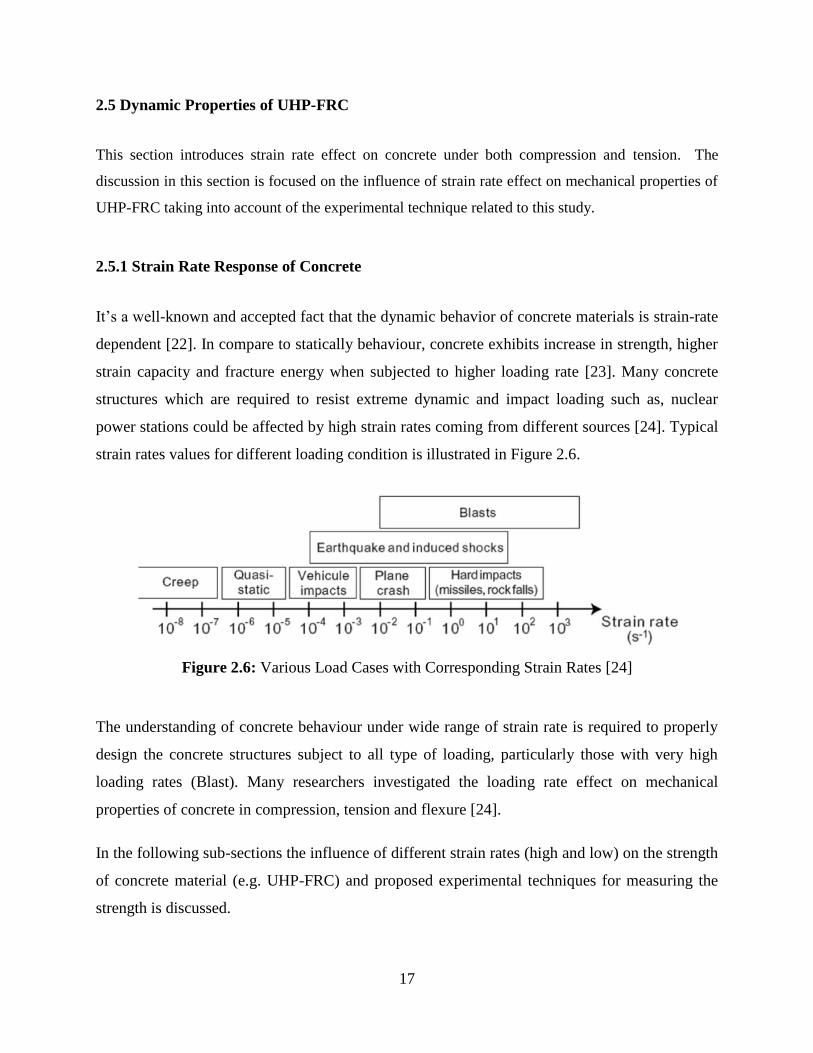
power stations could be affected by high strain rates coming from different sources [24]. Typical
strain rates values for different loading condition is illustrated in Figure 2.6.
Figure 2.6: Various Load Cases with Corresponding Strain Rates [24]
The understanding of concrete behaviour under wide range of strain rate is required to properly
design the concrete structures subject to all type of loading, particularly those with very high
loading rates (Blast). Many researchers investigated the loading rate effect on mechanical
properties of concrete in compression, tension and flexure [24].
In the following sub-sections the influence of different strain rates (high and low) on the strength
of concrete material (e.g. UHP-FRC) and proposed experimental techniques for measuring the
strength is discussed.
18
2.5.2 Strain Rate Effect on the Strength of Concrete
2.5.2.1 Dynamic Increase Factor, DIF
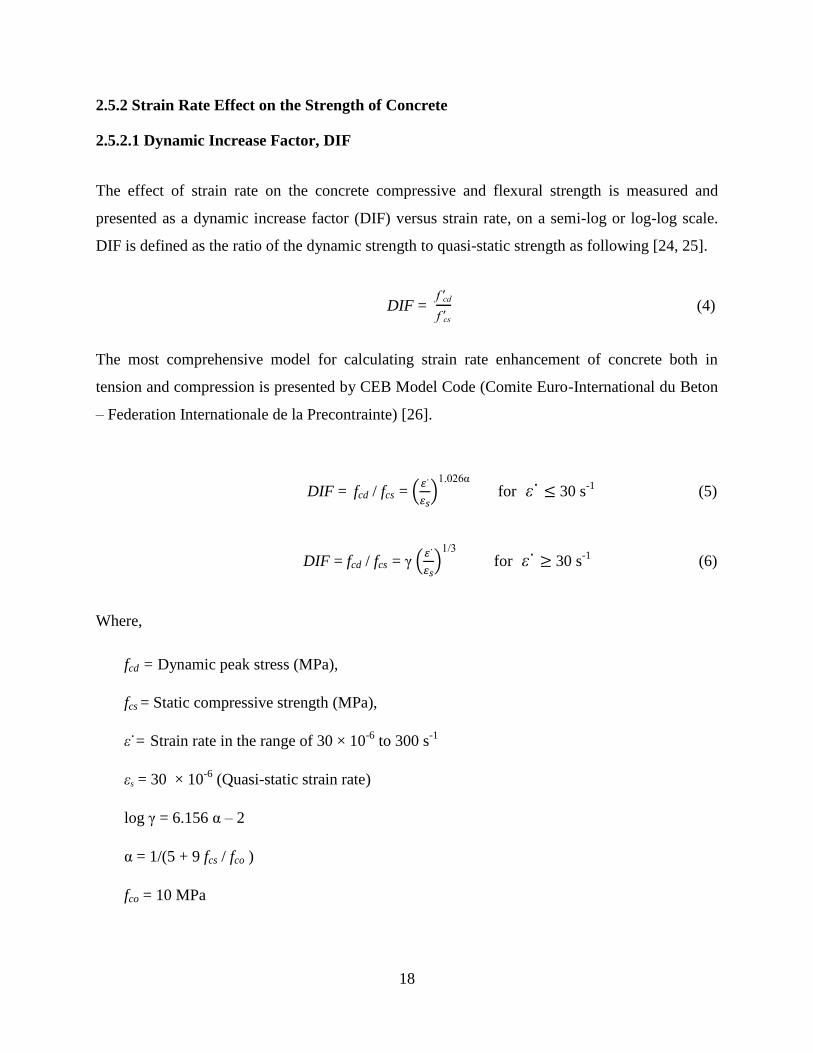
The effect of strain rate on the concrete compressive and flexural strength is measured and
presented as a dynamic increase factor (DIF) versus strain rate, on a semi-log or log-log scale.
DIF is defined as the ratio of the dynamic strength to quasi-static strength as following [24, 25].
DIF = f c
f c (4)
The most comprehensive model for calculating strain rate enhancement of concrete both in
tension and compression is presented by CEB Model Code (Comite Euro-International du Beton
– Federation Internationale de la Precontrainte) [26].
DIF = fcd / fcs = (
) .
for ε 30 s-1
(5)
DIF = fcd / fcs = γ (
)
for ε 30 s-1
(6)
Where,
fcd = Dynamic peak stress (MPa),
fcs = Static compressive strength (MPa),
ε = Strain rate in the range of 30 × 10-6
to 300 s-1
εs = 30 × 10-6
(Quasi-static strain rate)
log γ = 6.156 – 2
= 1/(5 + 9 fcs / fco )
fco = 10 MPa
19
2.5.2.2 Strain Rate Properties of Concrete in Compression
Many researches have conducted experimental studies focusing on the dynamic compressive
behavior of concrete. Most of these studies have shown that the measured dynamic compressive
strength is a function of strain rate and strength increase in compression is primarily a material
property [5, 8, 25].
Among these researches, Bishoff and Perry [27] conducted a research on compressive behavior
of normal to high strength plain concrete at high strain rates based on the results of many test
programmes. In this research they reviewed the most commonly used experimental techniques
for compressive strength of plain concrete at high strain rates, and the dynamic compressive
strength of the plain concrete under uniaxial loading.
It is usually suggested that, hydraulic testing machines to be used for static loading of concrete in
compression at a strain rate near 10-5
s-1
. Since hydraulic machine test has the ability to increase
the oil flow rate with aid of fast pumps and valves they also might be used to load at strain rate
as high as 10-1
s-1
. It is noted that, when using hydraulic testing machine at high strain rates
(dynamic), displacement control is preferred in order to achieve a stable failure [27].
The researchers also noted that, careful attention must be taken to the limitations that exist during
the dynamic loading, such as, consideration of testing machine characteristics, stress-wave
propagation effect, and uniformity of stress and strain along the specimen length, specimen
geometry and strain-rate variation and frequency response of the measurement system [27].
In this research, Bishoff and Perry [27] observed an increase of about 25 to 30% in design
compressive strength, f’c, during dynamic loading of concrete structures. While dynamic
compressive strength found to be 85 to 100% higher than static strength. It was also observed
that, not all researches agree at which strain rate the increase in strength becomes significant.
The researchers mentioned this due to different test techniques, type of measurement, differences
in mix design, specimens shape and size, and finally aspect ratio of the specimen’s. Therefore, it
has been suggested that care must be taken when comparing the results from different researches,
and comparison of material properties may be carried out within a particular test program.
20
It was also reported that poorer concrete, such as normal strength concrete, exhibits a larger
increase in compressive strength under high strain-rate loading. On the other hand, failure in high
strength concrete, occur though out a greater number of aggregate particle in compare to normal
strength concrete. This results in greater proportionate increase strength for weaker concrete at
higher strain rates, when the strength increases is gained partly by the propagation of cracks
through the stronger aggregate particles [27].
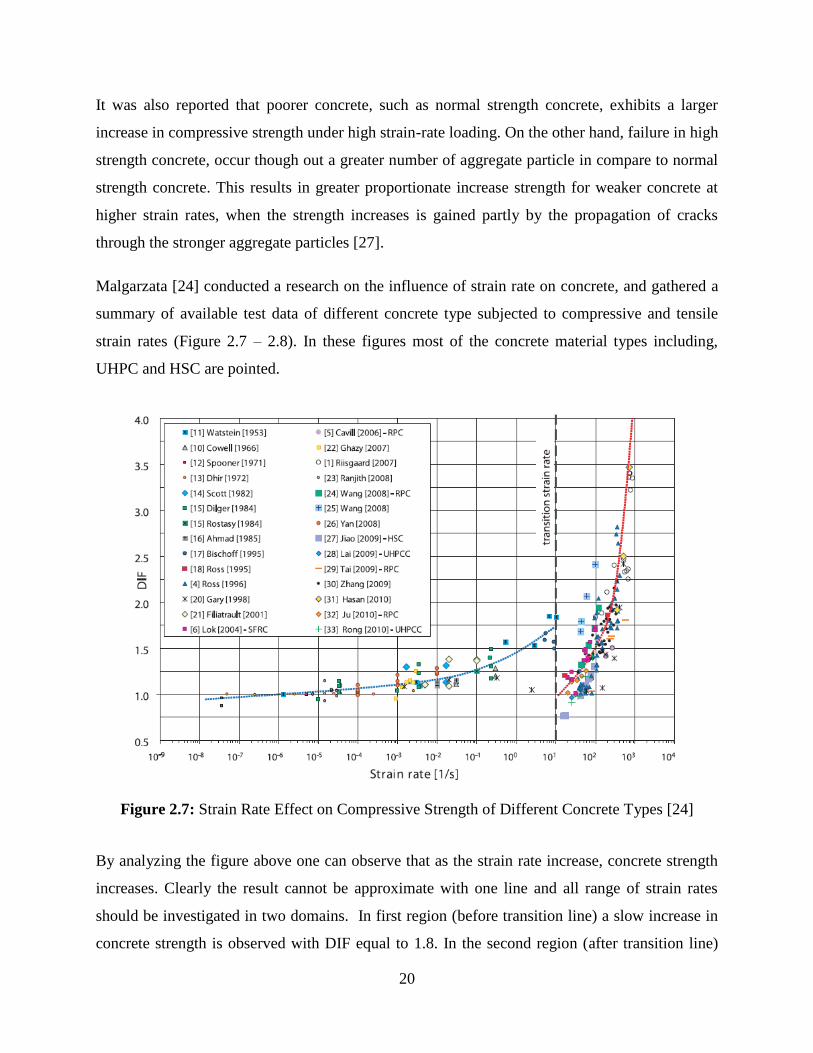
Malgarzata [24] conducted a research on the influence of strain rate on concrete, and gathered a
summary of available test data of different concrete type subjected to compressive and tensile
strain rates (Figure 2.7 – 2.8). In these figures most of the concrete material types including,
UHPC and HSC are pointed.
Figure 2.7: Strain Rate Effect on Compressive Strength of Different Concrete Types [24]
By analyzing the figure above one can observe that as the strain rate increase, concrete strength
increases. Clearly the result cannot be approximate with one line and all range of strain rates
should be investigated in two domains. In first region (before transition line) a slow increase in
concrete strength is observed with DIF equal to 1.8. In the second region (after transition line)
21
DIF increases significantly, with value of 3.5. The value of strain rate which causes this increase
is called transition strain rate [24]. Different strain rate values for transition strain rate have been
introduced by different researches (e.g. 10 s-1
, 60-80 s-1
).
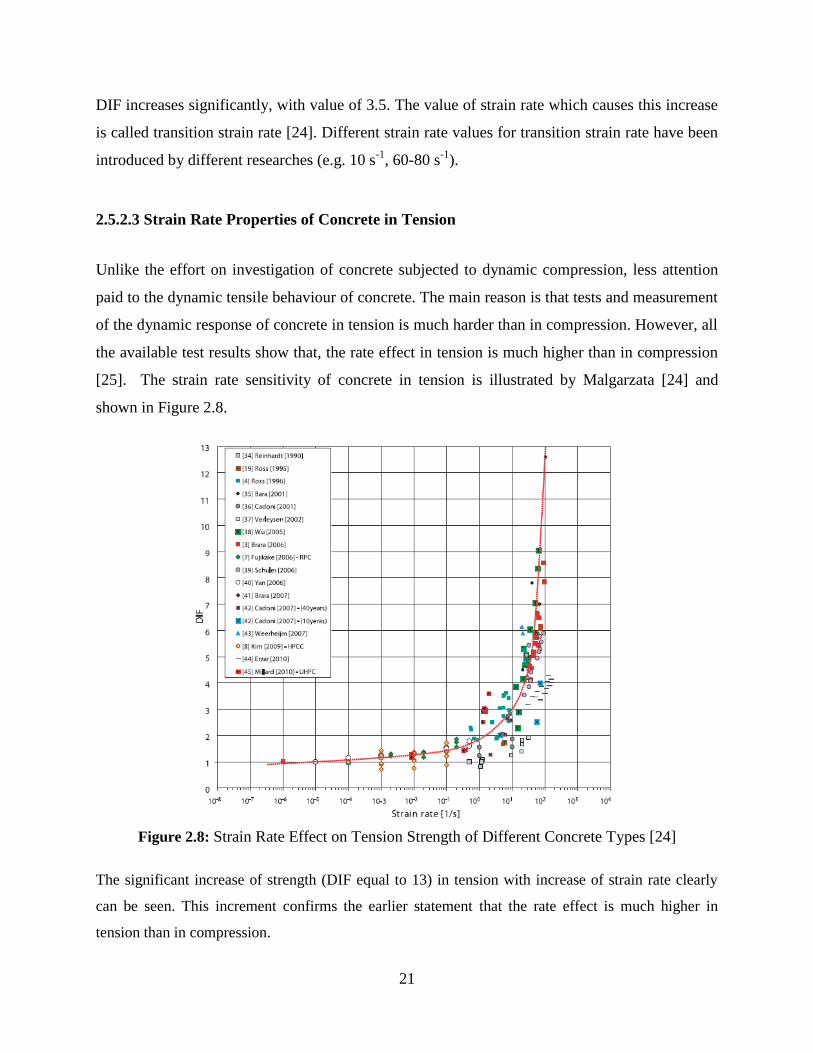
2.5.2.3 Strain Rate Properties of Concrete in Tension
Unlike the effort on investigation of concrete subjected to dynamic compression, less attention
paid to the dynamic tensile behaviour of concrete. The main reason is that tests and measurement
of the dynamic response of concrete in tension is much harder than in compression. However, all
the available test results show that, the rate effect in tension is much higher than in compression
[25]. The strain rate sensitivity of concrete in tension is illustrated by Malgarzata [24] and
shown in Figure 2.8.
Figure 2.8: Strain Rate Effect on Tension Strength of Different Concrete Types [24]
The significant increase of strength (DIF equal to 13) in tension with increase of strain rate clearly
can be seen. This increment confirms the earlier statement that the rate effect is much higher in
tension than in compression.
22
2.5.3 Strain Rate Response of UHP-FRC
Wille et al. [28] has reported that on the strain rate dependent tensile behavior of UHP-FRC with
different fiber volume fractions at strain rates ranging from 10-4
to 10-1
s-1
. In this study the
researchers observed that strength and energy absorption capacity of UHP-FRC both increased
with an increase in fiber volume fraction for a given strain rate. Gao et al. [5] investigated the
strain rate dependency of fibre reinforced and plain UHPC for compressive and flexural strength.
In this study the researchers used cylinder and prisms for compressive and flexural strength test
respectively. Their investigation revealed that the flexural strength of UHPC shows higher DIF
up to 3.5 at strain rate of 2 s-1
, while UHP-FRC exhibits lower enhancement (DIF) at same rate
with peak factor of 2.4. In this study the compressive strength enhancement value for UHPC and
UHP-FRC reported as 1.2 at strain rate of 2 × 10⁻³
and 1.3 at strain rate of 1 × 10⁻³
respectively.
To date the experimental studies on the high strain rate behavior of UHP-FRC is very limited.
Among the few examples are Millard et al. [3] who conducted flexural and shear high-speed
loading tests of UHP-FRC using a drop-hammer testing apparatus for investigation of DIF. It has
been found that the DIF of the flexural tensile strength rises from 1.0 at the strain rate of 1 s-1
. on
a slope of 1/3 on a log (strain rate) versus log (DIF) plot. This study also revealed that there is no
significant increase in shear strength at high strain rates.
Habel and Gauvereau [9] conducted series of drop weight tests at the University of Toronto to
apply dynamic three-point-bending loading to UHP-FRC plates. In this study the researchers
observed that strength and fracture energy of the dynamically loaded UHP-FRC plate’s increases
significantly when compared to quasi-static loading. Their analysis showed that the UHP-FRC
strength increases with increasing of strain rate.
Bindiganavile et al. [4] investigated the impact response of UHP-FRC with fiber volume fraction
of 0.75% and 6%. The results of the study indicated that under quasi-static loading, UHP-FRC
with 6% by volume of steel fibers was two to three times stronger in flexure and absorbed three
times greater energy than those with 0.75% by volume of steel or polypropylene fiber. The
researchers also reported that UHP-FRC with 6% by volume fraction is less stress-rate sensitive
than conventional UHP-FRC with 0.75% by volume fraction.
23
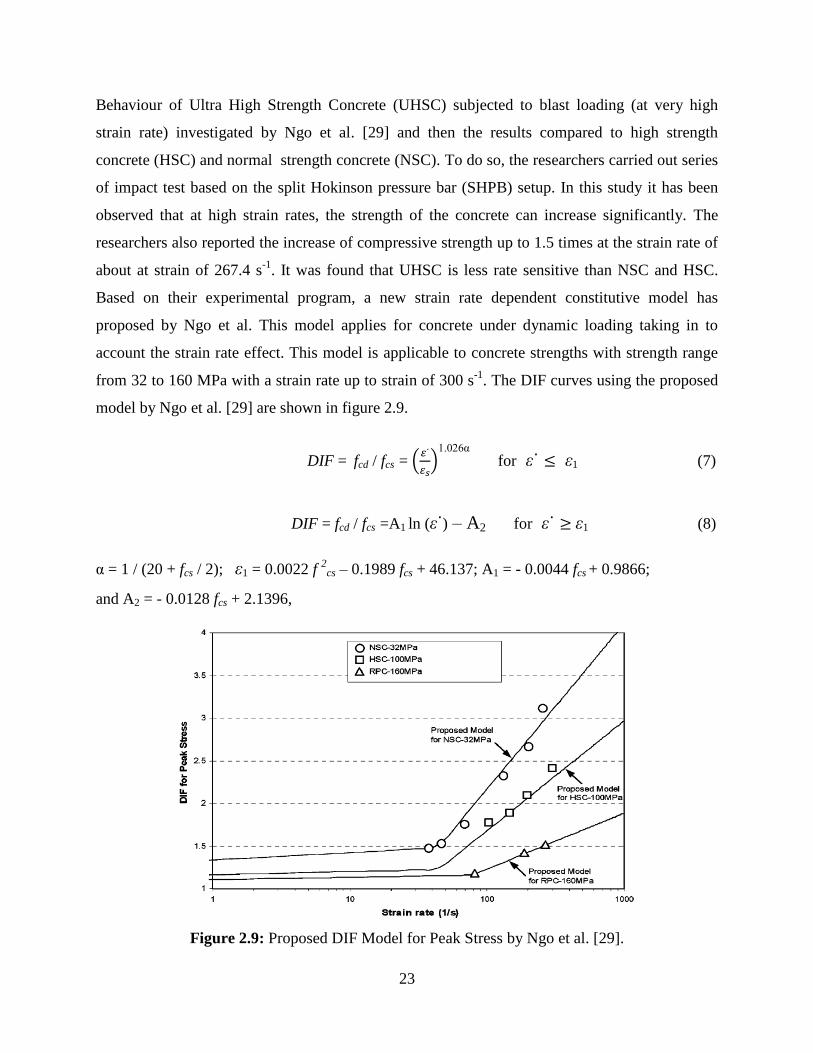
Behaviour of Ultra High Strength Concrete (UHSC) subjected to blast loading (at very high
strain rate) investigated by Ngo et al. [29] and then the results compared to high strength
concrete (HSC) and normal strength concrete (NSC). To do so, the researchers carried out series
of impact test based on the split Hokinson pressure bar (SHPB) setup. In this study it has been
observed that at high strain rates, the strength of the concrete can increase significantly. The
researchers also reported the increase of compressive strength up to 1.5 times at the strain rate of
about at strain of 267.4 s-1
. It was found that UHSC is less rate sensitive than NSC and HSC.
Based on their experimental program, a new strain rate dependent constitutive model has
proposed by Ngo et al. This model applies for concrete under dynamic loading taking in to
account the strain rate effect. This model is applicable to concrete strengths with strength range
from 32 to 160 MPa with a strain rate up to strain of 300 s-1
. The DIF curves using the proposed
model by Ngo et al. [29] are shown in figure 2.9.
DIF = fcd / fcs = (
) .
for ε ε1
(7)
DIF = fcd / fcs =A1 ln (ε ) – A2 for ε ε1
(8)
= 1 / (20 + fcs / 2); ε1 = 0.0022 f 2
cs – 0.1989 fcs + 46.137; A1 = - 0.0044 fcs + 0.9866;
and A2 = - 0.0128 fcs + 2.1396,
Figure 2.9: Proposed DIF Model for Peak Stress by Ngo et al. [29].
24
2.6 Testing Methods for Concrete under High Strain Rates
As previously mentioned, different setups for testing of concrete under high strain rate loading have
been used in the past. Following is a survey of the most commonly used techniques which are related
to this study.
2.6.1 Drop Hammer Technique
There is no standard approach or test to investigate the dynamic increase factor of UHP-FRC
under flexural loading. Perhaps one of the most commonly used techniques for testing concrete
under high strain rate is drop hammer technique which has been used by different researchers [3,
4, 9, 29 ]. In the following sub-sections different drop hammer setups used at different
Universities is discussed in details.
2.6.1.1 University of Toronto Drop Hammer Strain Rate Test
Habel and Gauvereau [9] used the drop hammer facility at U of T for a study on impact response
of UHP-FRC. This facility consists of two drop weight of 10.2 and 20.6 kg, and constant height
drop of 1050 mm considered for the test. Plywood with length of 20 mm and thickness of 19 mm
is used as load attenuator between drop weight and beam. In this test multiple drops were
performed on all specimens to obtain complete fracture.
High speed camera operating at 1000 frames per second was used to calculate the speed of the
drop weight at the instant of impact. The speed at impact was evaluated to 4.2 m/s for the 10.3 kg
and 4.3 m/s for the 20.6 kg weight. Two accelerometers affixed to the drop weight for
determination of the impact force. Also two load cells located underneath the steel rollers for
measurement of the support reactions. The deflection is assessed with potentiometers.
The researchers performed total of thirteen tests to determine the dynamic behavior of UHP-
FRC. The maximum strain rates observed in this test was 2 s-1
, that was confirmed by the strain
gauge measurement. Maximum deflection for the plates impacted with 10.3 kg weight was
between 4.1 to 5.7 mm and for 20.6 kg weight was always greater than 6.5 mm [9].
25
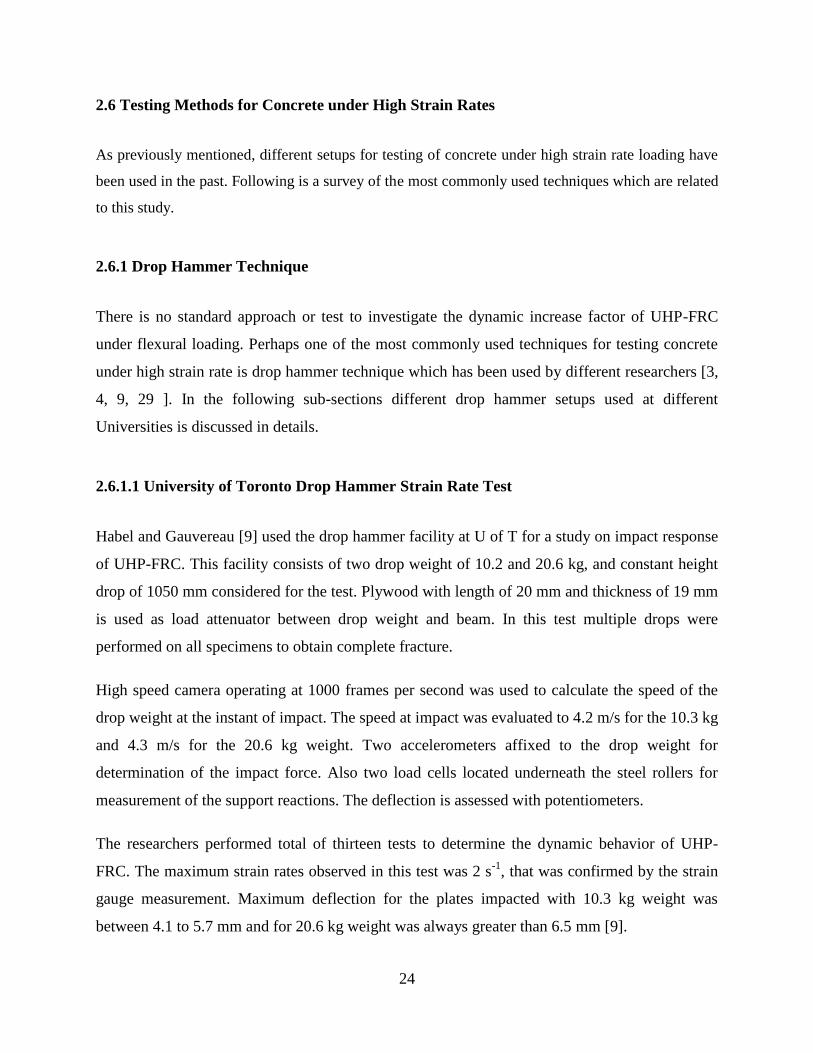
2.6.1.2 RMIT University Drop Hammer Strain Rate Test
The schematic drawing of the drop hammer facility at RMIT is shown in the Figure 2.10. This
facility where used by Millard et al. [3] for investigation of dynamic enhancement of UHP-FRC,
comprised a 30 kg cylindrical steel with a length of 2.0 m and diameter of 50 mm. The lower end
of the bar is hemispherical and the top end incorporates a steel ring that is used to raise the bar.
The hammer is guided by four bolts which they placed within the tracks. The transmission bar
positioned centrally on top of the beam specimens to transfer the impact force from hammer. The
length of the transmission bar was 500 mm and same diameter as drop hammer was used (50
mm). A 15 mm fiberboard used on top of the transmission bar to attenuate the force provided by
the drop hammer.
Figure 2.10: Drop-Hammer Test Setup Developed by RMIT [3]
A pair of strain gauges was attached parallel to the bar’s longitudinal axis on opposite sides to
get strain rates. Steel rollers with diameter of 25 mm were used to act as support for beams. Load
cells placed under each supports to get one set of data from impact experiment. A concrete slab
(200 mm thick) located on a 30 mm sand bed to reduce noise in the support load and
transmission bars. An accelerometer attached to the concrete slab to record an insight into the
operation of the rig.
26
Drop weight facility was used for the investigating of the flexural strength of UHP-FRC under
impact loading. 280 × 70 × 70 mm beams were used for flexural test with span of 210 mm. Three
different drop heights of 400, 600 and 1600 mm were used. The maximum strain rates observed
in this test was at 4.01 s-1
for a drop height 0f 1600 mm with DIF of 2.53 [3].
The main advantages of the RMIT drop hammer facility are elimination of the high speed
camera and simple setup. Because of its relatively simple setup this approach not only reduces
the experiment cost tremendously, but open opportunities for more research in this area. The
drop hammer facility developed for this study was inspired by RMIT drop hammer facility.
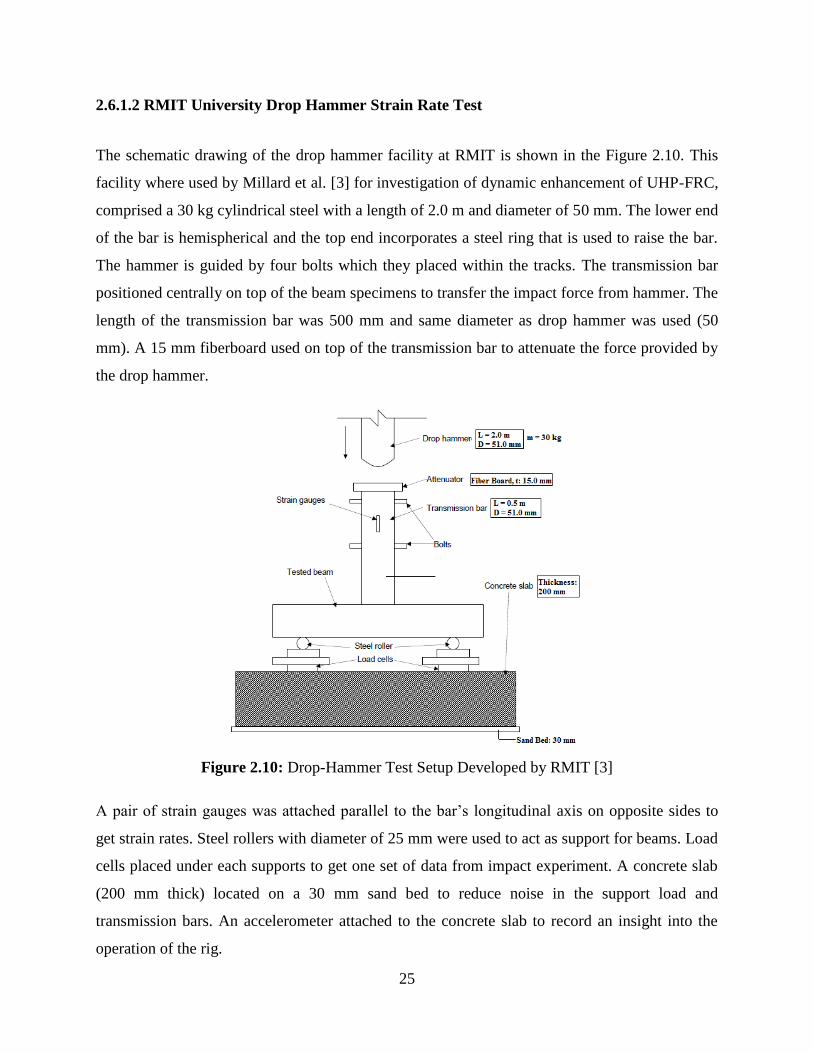
2.6.1.3 University of Liverpool Drop Hammer Strain Rate Test
The set up for the Liverpool University is similar to RMIT setup with few changes. A lighter
hammer (23.3) kg was used, which required the maximum release height of 2.0 m to ensure
failure of each specimen. In this test the impact force was calculated using Laser Doppler
Anemometer (LDA) instead of transmission bar. LDA used to measure the velocity of the drop
hammer as well. In addition a high speed camera was used to evaluate the beam displacement
against time.
Figure 2.11: Liverpool University Drop-Hammer Test Facility [3]
27
In this study strain rates could be calculated either from an applied load or from measured
deflection. The load used for calculating the strain rate was load obtains from the support cells. A
maximum flexural tensile strength of 54-68 MPa observed for 6% steel fiber by concrete
volume. The Maximum strain rate achieved was 1.66 s-1
achieved [3].
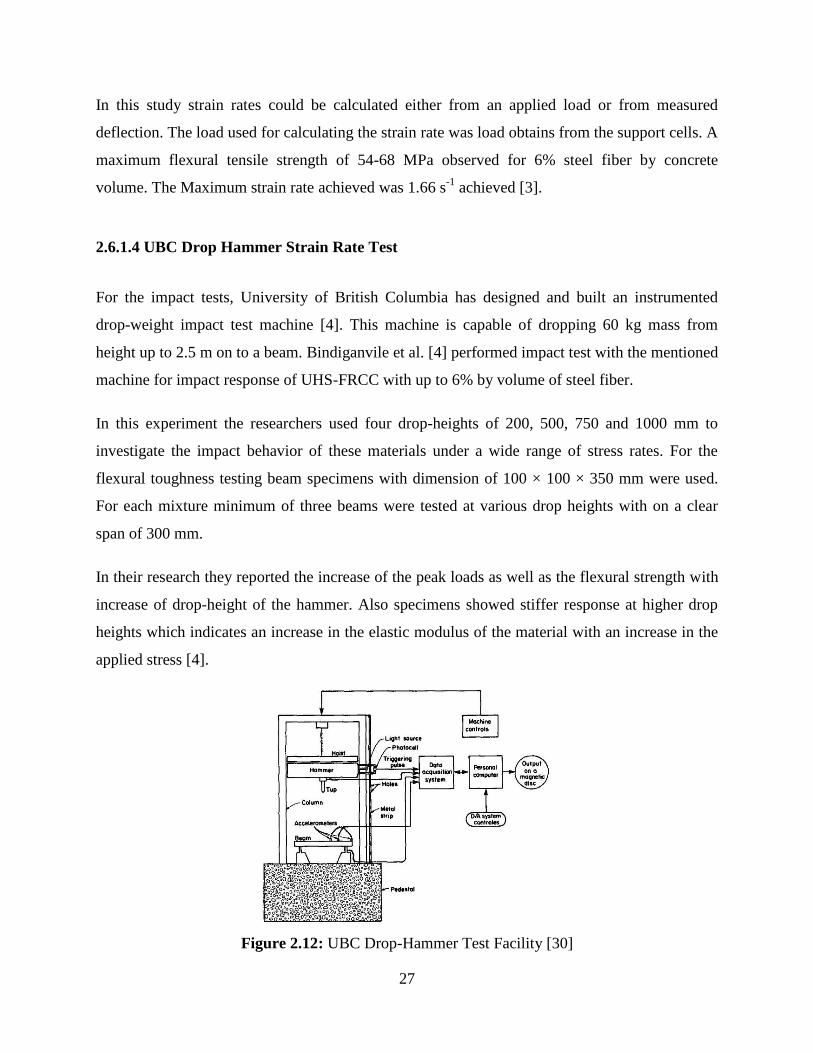
2.6.1.4 UBC Drop Hammer Strain Rate Test
For the impact tests, University of British Columbia has designed and built an instrumented
drop-weight impact test machine [4]. This machine is capable of dropping 60 kg mass from
height up to 2.5 m on to a beam. Bindiganvile et al. [4] performed impact test with the mentioned
machine for impact response of UHS-FRCC with up to 6% by volume of steel fiber.
In this experiment the researchers used four drop-heights of 200, 500, 750 and 1000 mm to
investigate the impact behavior of these materials under a wide range of stress rates. For the
flexural toughness testing beam specimens with dimension of 100 × 100 × 350 mm were used.
For each mixture minimum of three beams were tested at various drop heights with on a clear
span of 300 mm.
In their research they reported the increase of the peak loads as well as the flexural strength with
increase of drop-height of the hammer. Also specimens showed stiffer response at higher drop
heights which indicates an increase in the elastic modulus of the material with an increase in the
applied stress [4].
Figure 2.12: UBC Drop-Hammer Test Facility [30]
28
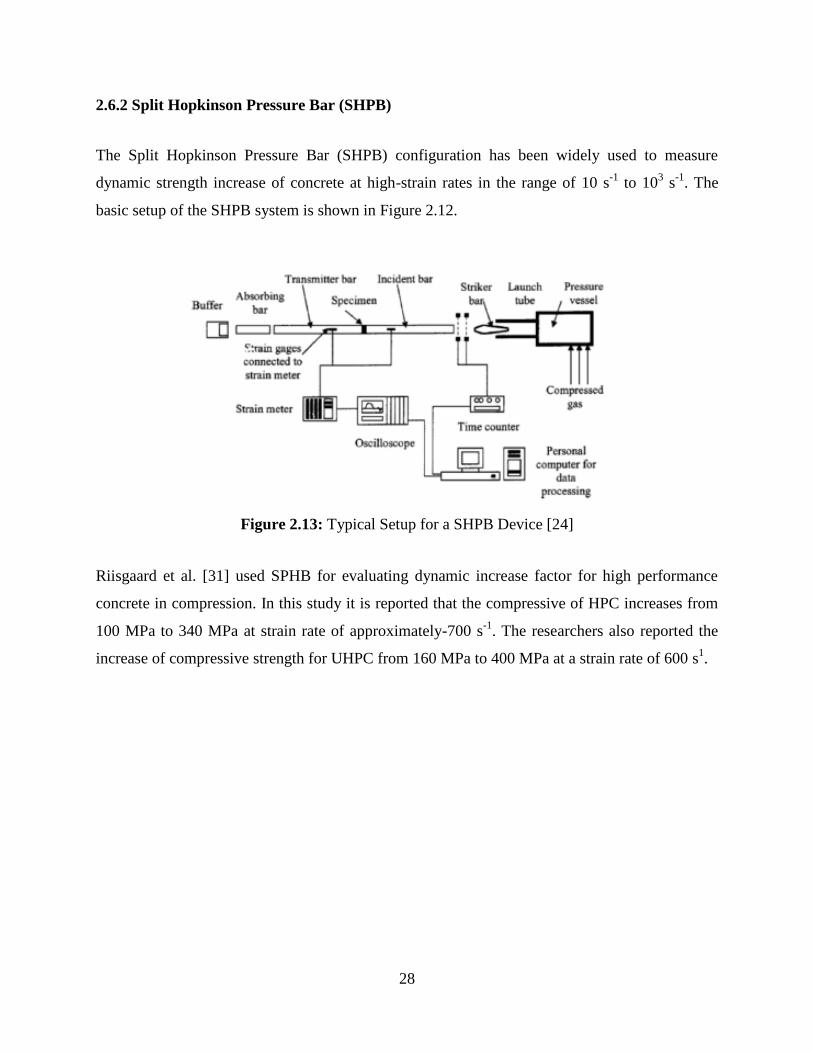
2.6.2 Split Hopkinson Pressure Bar (SHPB)
The Split Hopkinson Pressure Bar (SHPB) configuration has been widely used to measure
dynamic strength increase of concrete at high-strain rates in the range of 10 s-1
to 103 s
-1. The
basic setup of the SHPB system is shown in Figure 2.12.
Figure 2.13: Typical Setup for a SHPB Device [24]
Riisgaard et al. [31] used SPHB for evaluating dynamic increase factor for high performance
concrete in compression. In this study it is reported that the compressive of HPC increases from
100 MPa to 340 MPa at strain rate of approximately-700 s-1
. The researchers also reported the
increase of compressive strength for UHPC from 160 MPa to 400 MPa at a strain rate of 600 s1.
29
Chapter 3
EXPERIMENTAL PROGRAM
The designed experimental investigation program is aimed to develop understanding of different
concrete materials response to low and high strain rates. This chapter presents details about the
mixture compositions, mixing procedure, test specimens and testing procedure for each series of
composites. In the final section development and construction of drop hammer frame setup for
impact test is discussed in details.
3.1 Mixture Proportions
Four different types of concrete are considered for the present study. In this section mixture
proportions for each concrete type is discussed.
3.1.1 UHP-FRC and EHP-FRC
Ultra High Performance Fiber Reinforced Concrete (UHP-FRC) for the present study was
provided by Lafarge Company, while Extra High Performance Fiber Reinforced Concrete (EHP-
FRC) was provided by Holcim Ltd. In the following table the material composition of UHP-FRC
and EHP-FRC with 2% steel fiber is given according to Lafarge and Holcim Company mix
design respectively.
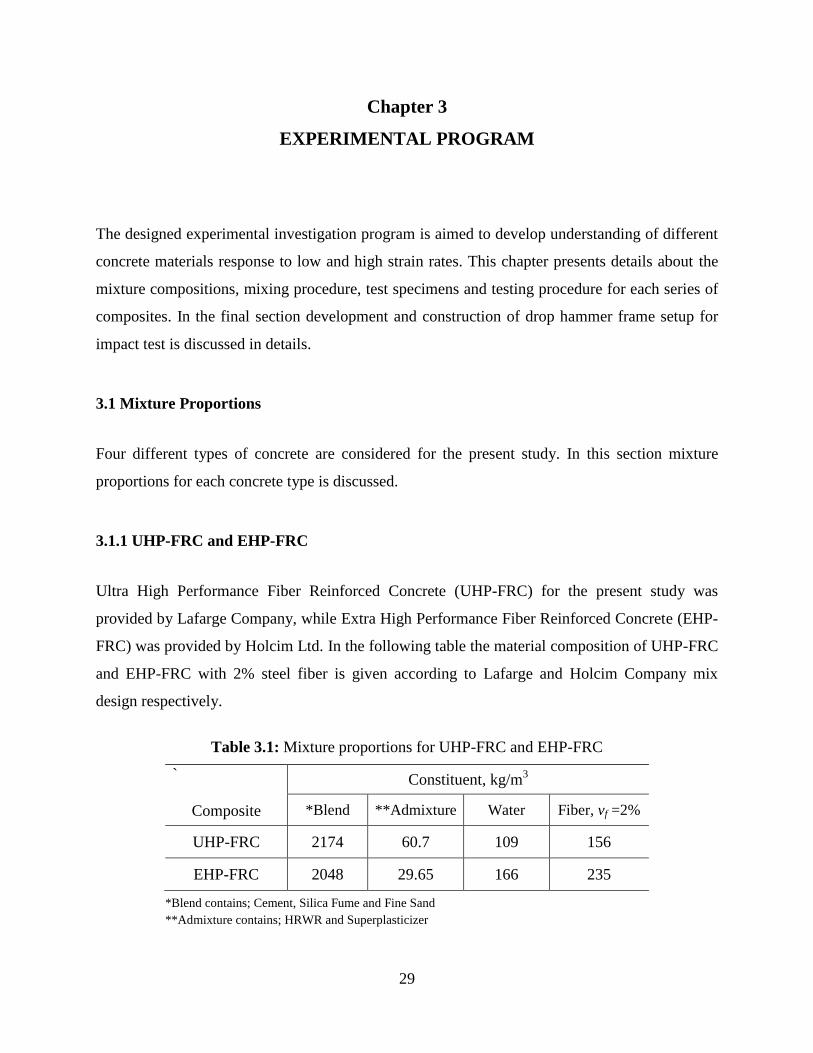
Table 3.1: Mixture proportions for UHP-FRC and EHP-FRC
`
Composite
Constituent, kg/m3
*Blend **Admixture Water Fiber, vf =2%
UHP-FRC 2174 60.7 109 156
EHP-FRC 2048 29.65 166 235
*Blend contains; Cement, Silica Fume and Fine Sand
**Admixture contains; HRWR and Superplasticizer
30
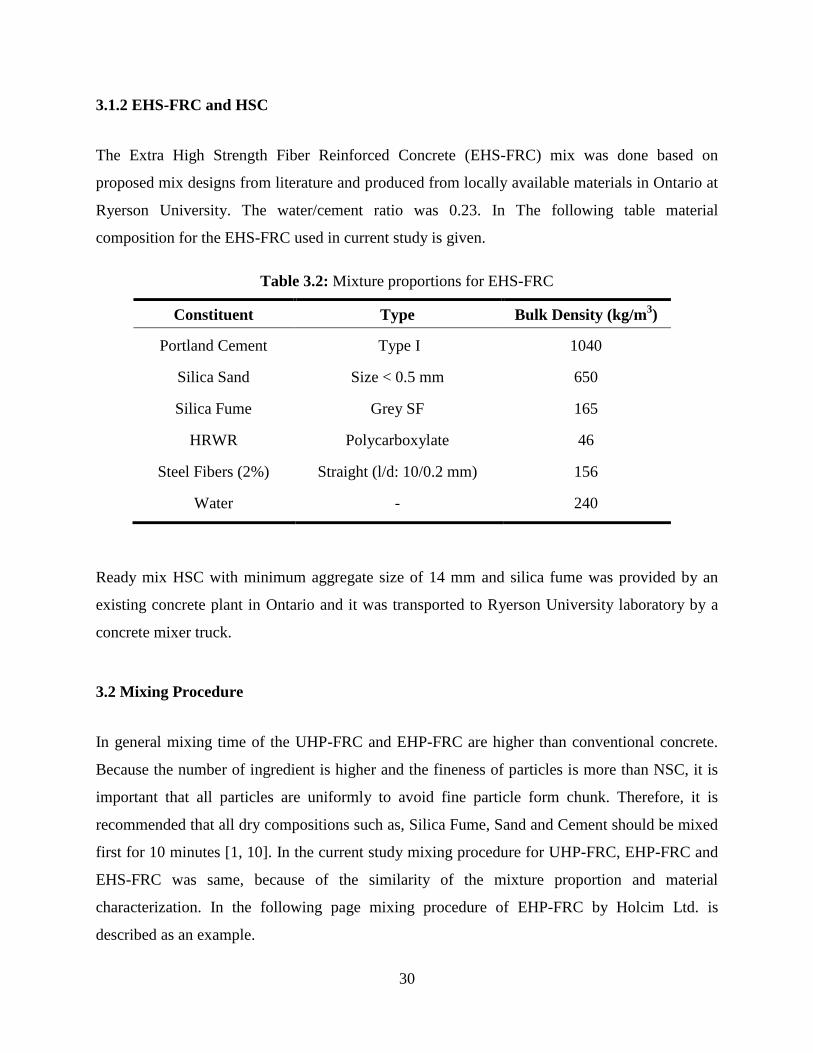
3.1.2 EHS-FRC and HSC
The Extra High Strength Fiber Reinforced Concrete (EHS-FRC) mix was done based on
proposed mix designs from literature and produced from locally available materials in Ontario at
Ryerson University. The water/cement ratio was 0.23. In The following table material
composition for the EHS-FRC used in current study is given.
Table 3.2: Mixture proportions for EHS-FRC
Constituent Type Bulk Density (kg/m3)
Portland Cement Type I 1040
Silica Sand Size < 0.5 mm 650
Silica Fume Grey SF 165
HRWR Polycarboxylate 46
Steel Fibers (2%) Straight (l/d: 10/0.2 mm) 156
Water - 240
Ready mix HSC with minimum aggregate size of 14 mm and silica fume was provided by an
existing concrete plant in Ontario and it was transported to Ryerson University laboratory by a
concrete mixer truck.
3.2 Mixing Procedure
In general mixing time of the UHP-FRC and EHP-FRC are higher than conventional concrete.
Because the number of ingredient is higher and the fineness of particles is more than NSC, it is
important that all particles are uniformly to avoid fine particle form chunk. Therefore, it is
recommended that all dry compositions such as, Silica Fume, Sand and Cement should be mixed
first for 10 minutes [1, 10]. In the current study mixing procedure for UHP-FRC, EHP-FRC and
EHS-FRC was same, because of the similarity of the mixture proportion and material
characterization. In the following page mixing procedure of EHP-FRC by Holcim Ltd. is
described as an example.
31
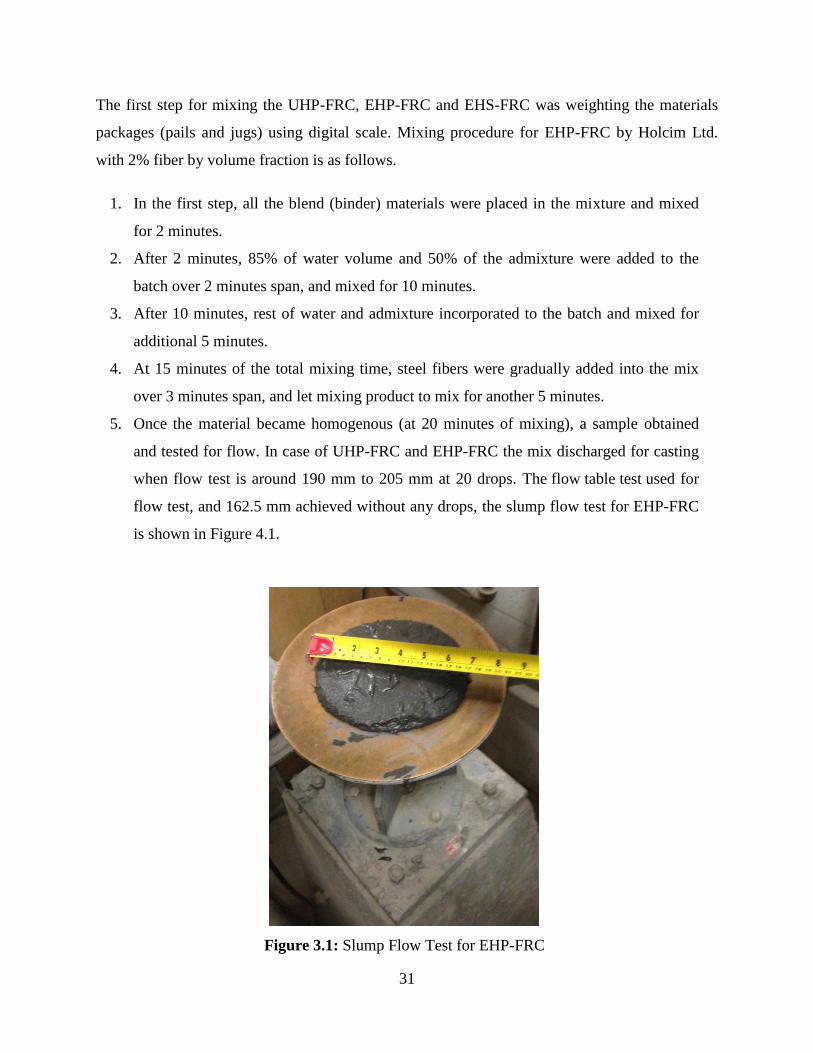
The first step for mixing the UHP-FRC, EHP-FRC and EHS-FRC was weighting the materials
packages (pails and jugs) using digital scale. Mixing procedure for EHP-FRC by Holcim Ltd.
with 2% fiber by volume fraction is as follows.
1. In the first step, all the blend (binder) materials were placed in the mixture and mixed
for 2 minutes.
2. After 2 minutes, 85% of water volume and 50% of the admixture were added to the
batch over 2 minutes span, and mixed for 10 minutes.
3. After 10 minutes, rest of water and admixture incorporated to the batch and mixed for
additional 5 minutes.
4. At 15 minutes of the total mixing time, steel fibers were gradually added into the mix
over 3 minutes span, and let mixing product to mix for another 5 minutes.
5. Once the material became homogenous (at 20 minutes of mixing), a sample obtained
and tested for flow. In case of UHP-FRC and EHP-FRC the mix discharged for casting
when flow test is around 190 mm to 205 mm at 20 drops. The flow table test used for
flow test, and 162.5 mm achieved without any drops, the slump flow test for EHP-FRC
is shown in Figure 4.1.
Figure 3.1: Slump Flow Test for EHP-FRC
32
3.3 Casting and Curing
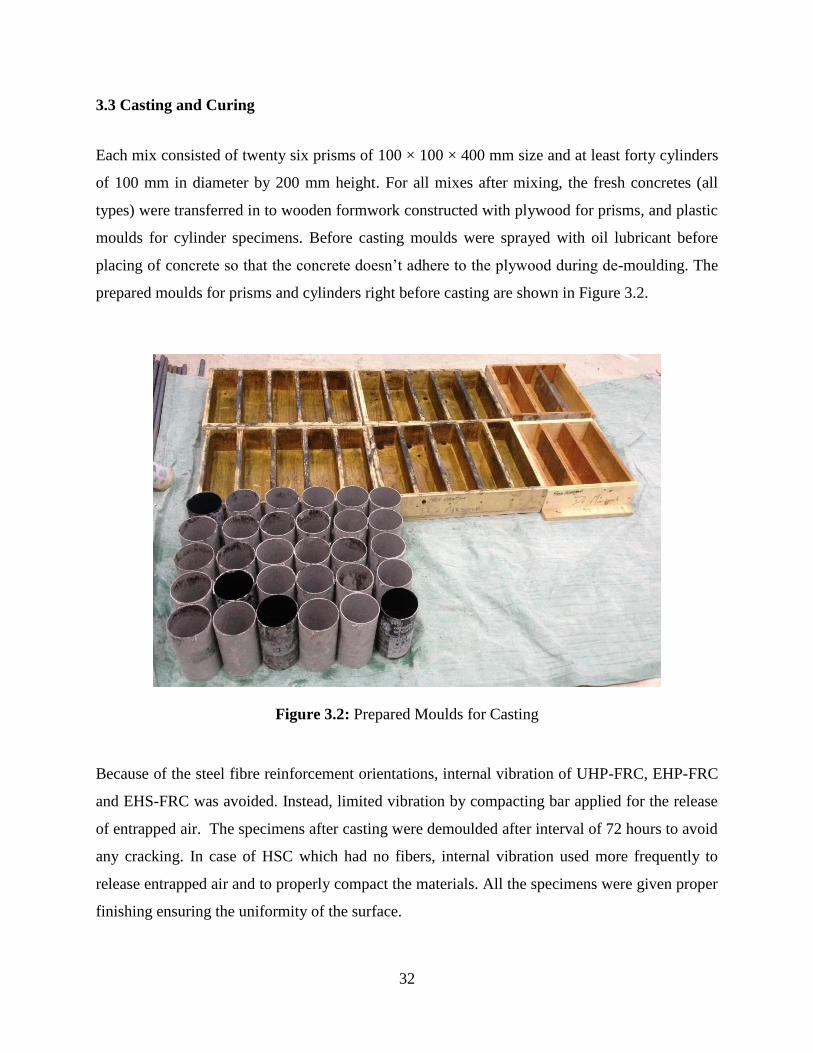
Each mix consisted of twenty six prisms of 100 × 100 × 400 mm size and at least forty cylinders
of 100 mm in diameter by 200 mm height. For all mixes after mixing, the fresh concretes (all
types) were transferred in to wooden formwork constructed with plywood for prisms, and plastic
moulds for cylinder specimens. Before casting moulds were sprayed with oil lubricant before
placing of concrete so that the concrete doesn’t adhere to the plywood during de-moulding. The
prepared moulds for prisms and cylinders right before casting are shown in Figure 3.2.
Figure 3.2: Prepared Moulds for Casting
Because of the steel fibre reinforcement orientations, internal vibration of UHP-FRC, EHP-FRC
and EHS-FRC was avoided. Instead, limited vibration by compacting bar applied for the release
of entrapped air. The specimens after casting were demoulded after interval of 72 hours to avoid
any cracking. In case of HSC which had no fibers, internal vibration used more frequently to
release entrapped air and to properly compact the materials. All the specimens were given proper
finishing ensuring the uniformity of the surface.
33
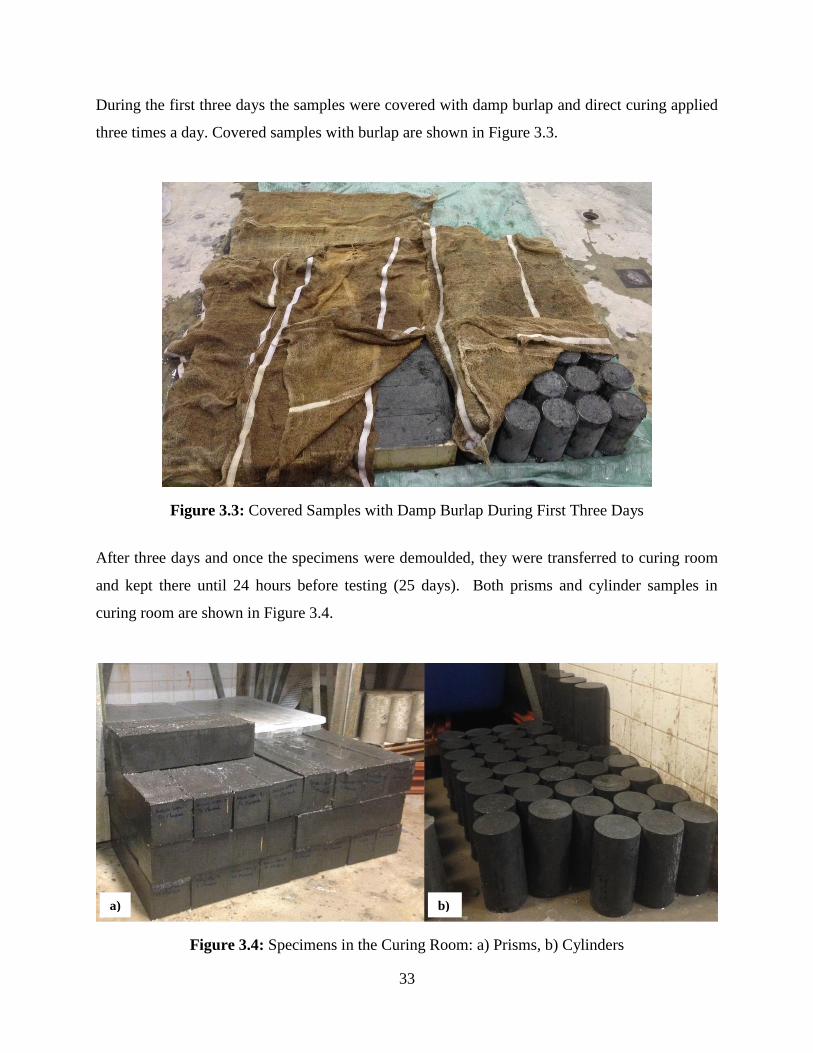
During the first three days the samples were covered with damp burlap and direct curing applied
three times a day. Covered samples with burlap are shown in Figure 3.3.
Figure 3.3: Covered Samples with Damp Burlap During First Three Days
After three days and once the specimens were demoulded, they were transferred to curing room
and kept there until 24 hours before testing (25 days). Both prisms and cylinder samples in
curing room are shown in Figure 3.4.
Figure 3.4: Specimens in the Curing Room: a) Prisms, b) Cylinders
a) b)
34
3.4 Compressive Strength Test
The compressive tests for each of UHP-FRC, EHP-FRC, EHS-FRC and HSC discussed in this
section were all completed in accordance to the ASTM C39 standard test method for cylinders.
Throughout the entire study on DIF for compressive strength and material characterization, more
than 100 compression specimens were tested.
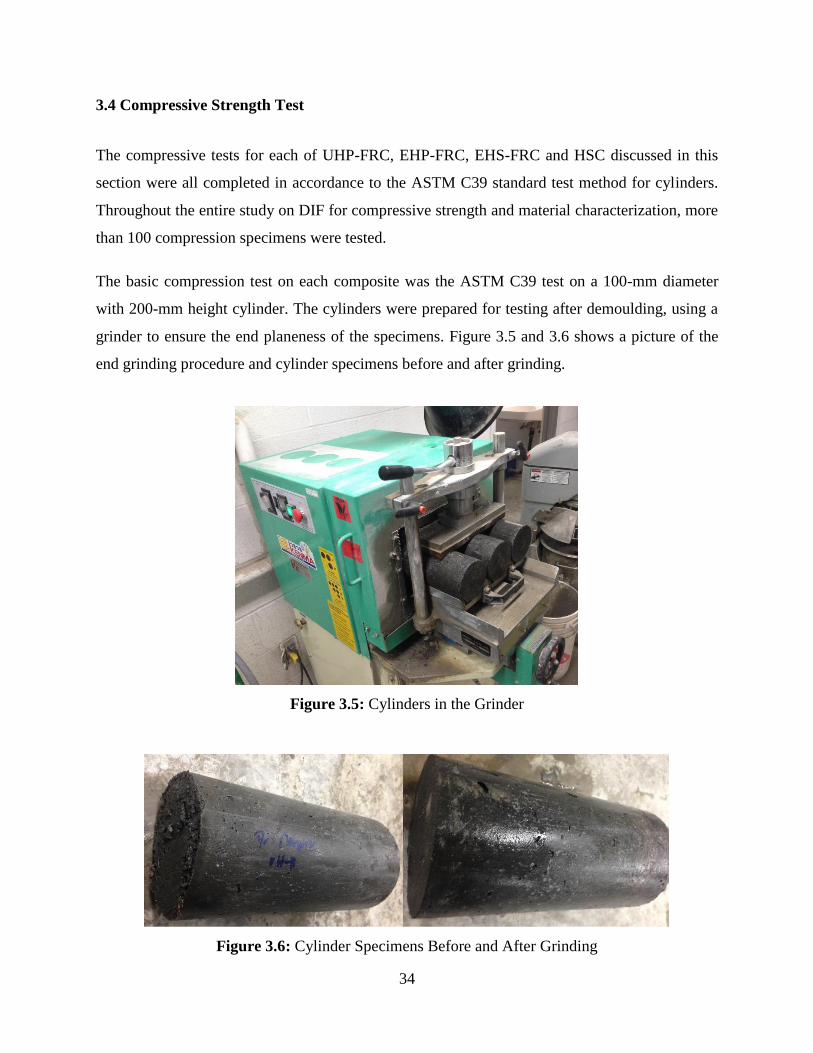
The basic compression test on each composite was the ASTM C39 test on a 100-mm diameter
with 200-mm height cylinder. The cylinders were prepared for testing after demoulding, using a
grinder to ensure the end planeness of the specimens. Figure 3.5 and 3.6 shows a picture of the
end grinding procedure and cylinder specimens before and after grinding.
Figure 3.5: Cylinders in the Grinder
Figure 3.6: Cylinder Specimens Before and After Grinding
35
The compressive strength of each composite was recorded at 7, 14, 21 and 28 day. The average
reading of tested three cylinders was recorded as the compressive strength at respective age. The
compression test is carried out in compression testing machine of 1500 kN capacity. The peak
strength is recorded after the specimens fail to resist any more loads. The values are recorded and
compressive strength is calculated using the equation 7. The compressive strength of each series
at different ages is given in Table 3.3.
f’c = oad (P)
ross Sectional Area (A) (7)
Table 3.3: Compressive Strength of each Composite at Different Age
Composite
Compressive Strength (N/mm2)
7 Days 14 Days 21 Days 28 Days
UHP-FRC - - - > 150
EHP-FRC 91.25 110.42 110.87 112.31
EHS-FRC 87.02 109.53 110.3 111.01
HSC 41.19 48.68 50.32 53.48
3.4.1 Modulus of Elasticity
There are different approaches for calculating the elastic modulus of high performance concrete
materials. However, because the contribution of constituent in each matrix is unique, all the
parameter that influences the value of Ec is not directly related to f’c.
In this study for the accuracy of the results, modulus of elasticity is calculated from stress-strain
curve of each composite. Graphically we can define modulus of elasticity as a slope of the linear
portion of the stress-strain diagram. From hooks low Ec is defined as;
E =
(8)
Where, E = Modulus of elasticity (MPa), = 40% of peak stress (MPa), = strain
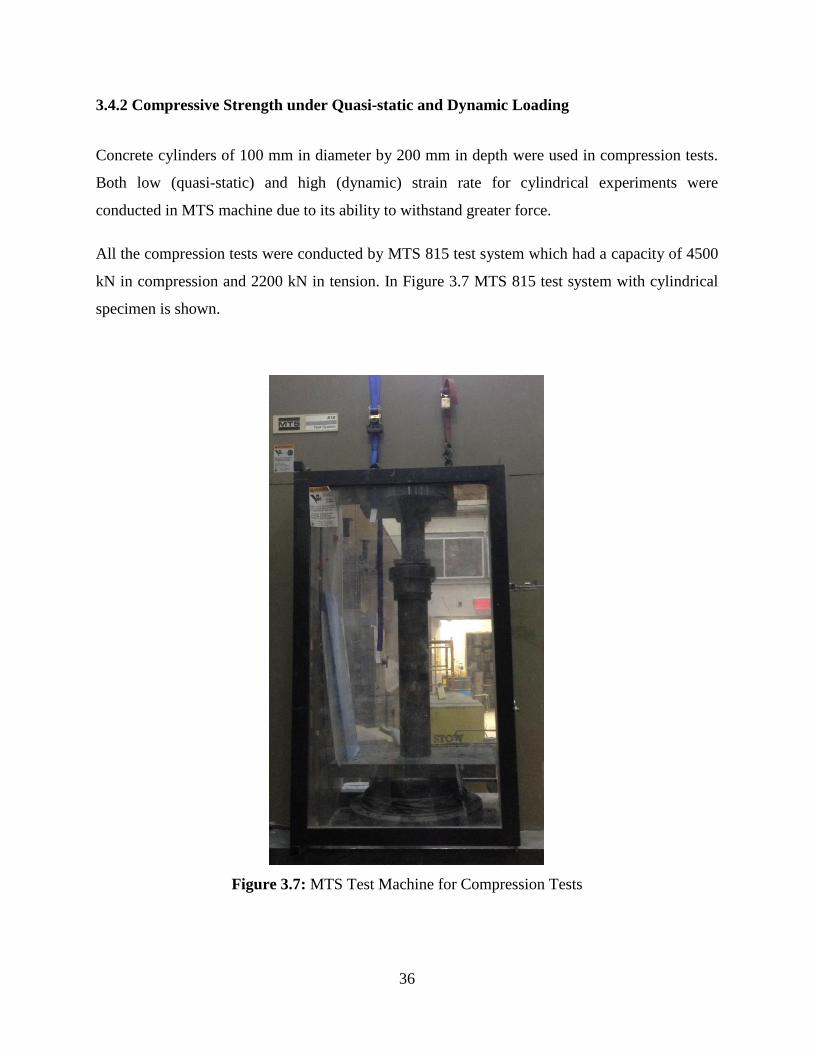
36
3.4.2 Compressive Strength under Quasi-static and Dynamic Loading
Concrete cylinders of 100 mm in diameter by 200 mm in depth were used in compression tests.
Both low (quasi-static) and high (dynamic) strain rate for cylindrical experiments were
conducted in MTS machine due to its ability to withstand greater force.
All the compression tests were conducted by MTS 815 test system which had a capacity of 4500
kN in compression and 2200 kN in tension. In Figure 3.7 MTS 815 test system with cylindrical
specimen is shown.
Figure 3.7: MTS Test Machine for Compression Tests
37
From the literature, the quasi-static loading rate varied from 10-8
to 10-5
[24]. The required strain
rates were converted to displacement rate form equation (9). Then the nominal displacement
rates were set through the software on the controlling PC. The displacement rates range from
0.36 mm/min (quasi-static) to 72 mm/min (dynamic). These rates are given in Table 3.4.
Δ = ε × L (9)
Where,
Δ = Displacement rate (mm/sec)
= Strain rate (s-1
)
L = Length of the specimens (mm)
Table 3.4: Displacement and Strain Rates for Compressive Strength
Quasi-Static Range Dynamic Range
No
Specimens
Displacement
Rate (mm/min)
Strain Rate
(s-1)
No
Specimens
Displacement
Rate (mm/min)
Strain Rate
(s-1)
3 0.36 30 × 10-6
2 16.2 1.35 × 10⁻³
2 1.62 135 × 10-6
2 36 3 × 10⁻³
2 3.60 300 × 10-6
2 72 6 × 10⁻³
Once all the tests were done with the corresponding strain rates, Dynamic Increase Factor was
calculated for each composite series from equation (10). Static compressive strength (f’cs) is
calculated from the average of three tested specimens under quasi-static strain rate (30 × 10-6
s-1
).
On the other hand, dynamic peak stress (f'cd) is calculated from the average of two tested
specimens under other given ranges (135 × 10-6
to 6 × 10⁻³
).
DIF = f c
f c (10)
Where, f'cd = Dynamic peak stress (MPa),
f’cs = Static compressive strength (MPa),
38
3.5 Flexural Strength Test
The Flexural strength test for each composite discussed in this section was completed in
accordance to the ASTM C1609-12 standard test method for flexural performance of fiber-
reinforced concrete (using beam with third-point loading). Throughout the entire study on DIF
for flexural strength over 85 prisms were tested.
For the flexural strength test, prisms of 100 × 100 × 400 mm were tested under three-bending-
loading for all composite series. From the three-point bending flexural test, flexural stress
(modulus of rupture) was calculated from equation (11).
f = P
bd (11)
Where,
P = Load at the fracture point (N),
L = Clear span (mm),
b = Width of the tested beam,
d = depth of the tested beam
3.5.1 Flexural Strength under Quasi-static Loading
Concrete prism (100 × 100 × 400 mm) specimens used in flexural strength test of UHP-FRC,
EHP-FRC, EHS-FRC and HSC composites. The flexural strength test for prism specimens under
quasi-static loading were conducted by MTS test machine.
MTS 793 test system used in this experiment with capacity of 100 kN in flexure. The MTS 793
test machine for quasi-static tests is shown in Figure 3.8.
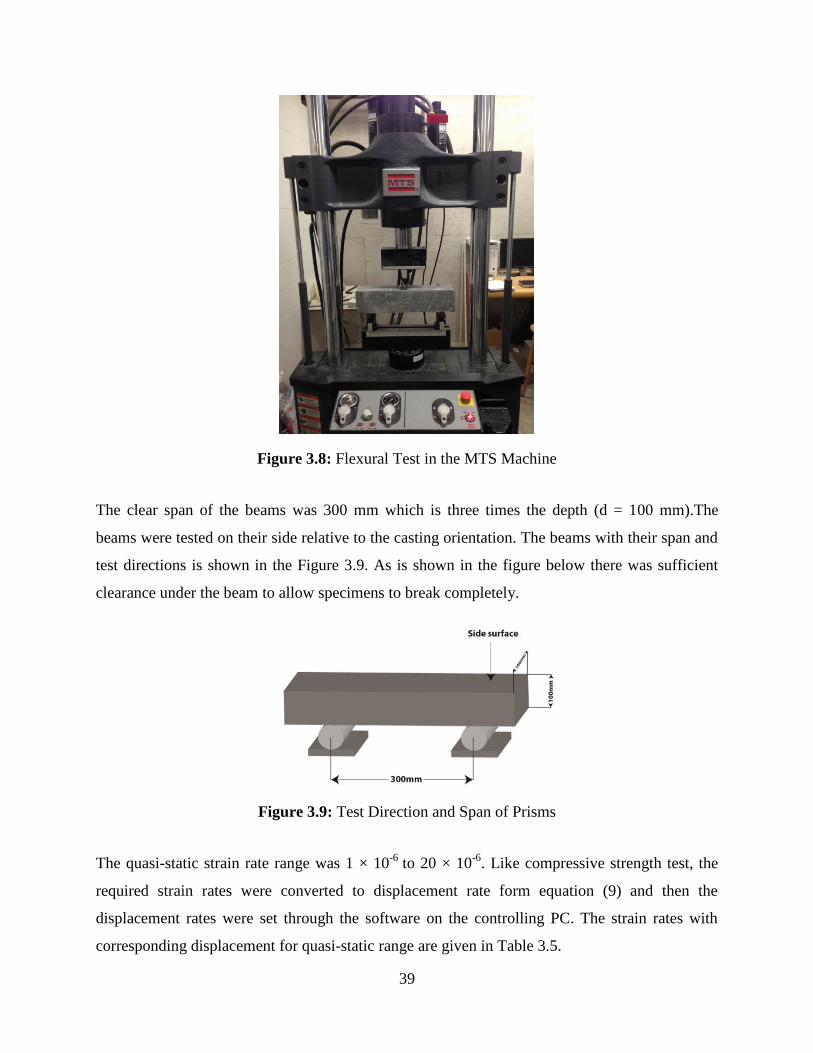
39
Figure 3.8: Flexural Test in the MTS Machine
The clear span of the beams was 300 mm which is three times the depth (d = 100 mm).The
beams were tested on their side relative to the casting orientation. The beams with their span and
test directions is shown in the Figure 3.9. As is shown in the figure below there was sufficient
clearance under the beam to allow specimens to break completely.
Figure 3.9: Test Direction and Span of Prisms
The quasi-static strain rate range was 1 × 10⁻⁶
to 20 × 10-6
. Like compressive strength test, the
required strain rates were converted to displacement rate form equation (9) and then the
displacement rates were set through the software on the controlling PC. The strain rates with
corresponding displacement for quasi-static range are given in Table 3.5.
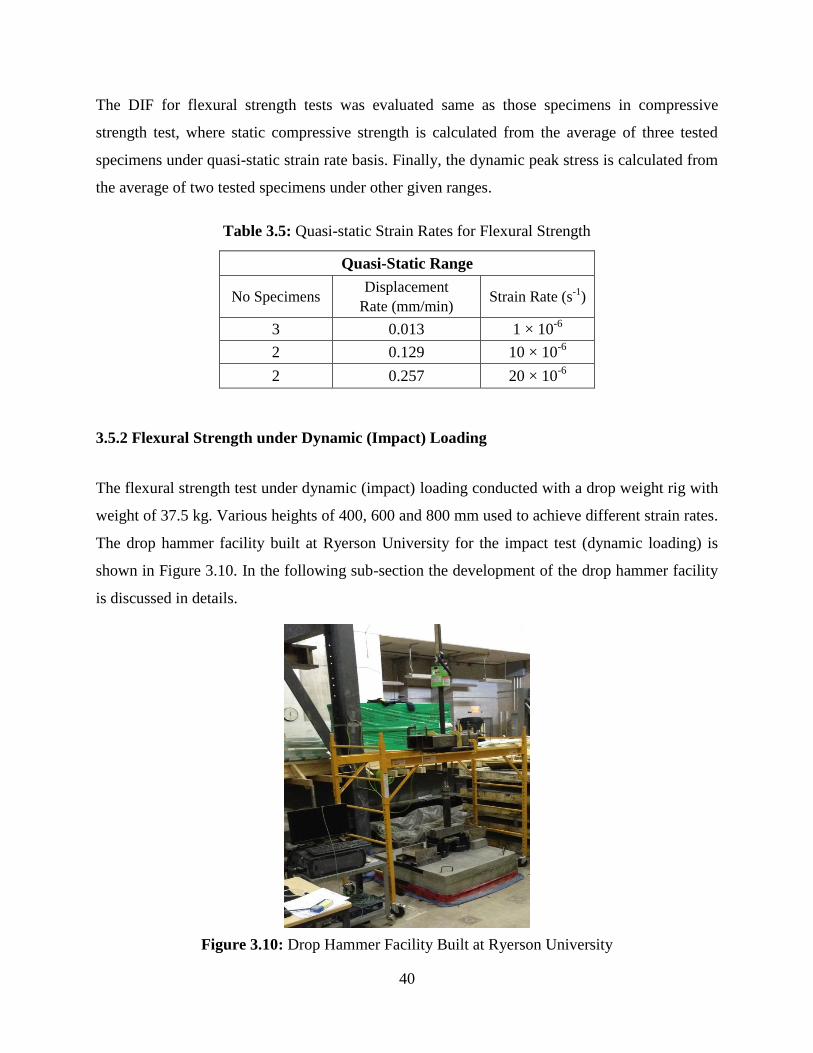
40
The DIF for flexural strength tests was evaluated same as those specimens in compressive
strength test, where static compressive strength is calculated from the average of three tested
specimens under quasi-static strain rate basis. Finally, the dynamic peak stress is calculated from
the average of two tested specimens under other given ranges.
Table 3.5: Quasi-static Strain Rates for Flexural Strength
Quasi-Static Range
No Specimens Displacement
Rate (mm/min) Strain Rate (s-1)
3 0.013 1 × 10⁻⁶
2 0.129 10 × 10-6
2 0.257 20 × 10-6
3.5.2 Flexural Strength under Dynamic (Impact) Loading
The flexural strength test under dynamic (impact) loading conducted with a drop weight rig with
weight of 37.5 kg. Various heights of 400, 600 and 800 mm used to achieve different strain rates.
The drop hammer facility built at Ryerson University for the impact test (dynamic loading) is
shown in Figure 3.10. In the following sub-section the development of the drop hammer facility
is discussed in details.
Figure 3.10: Drop Hammer Facility Built at Ryerson University
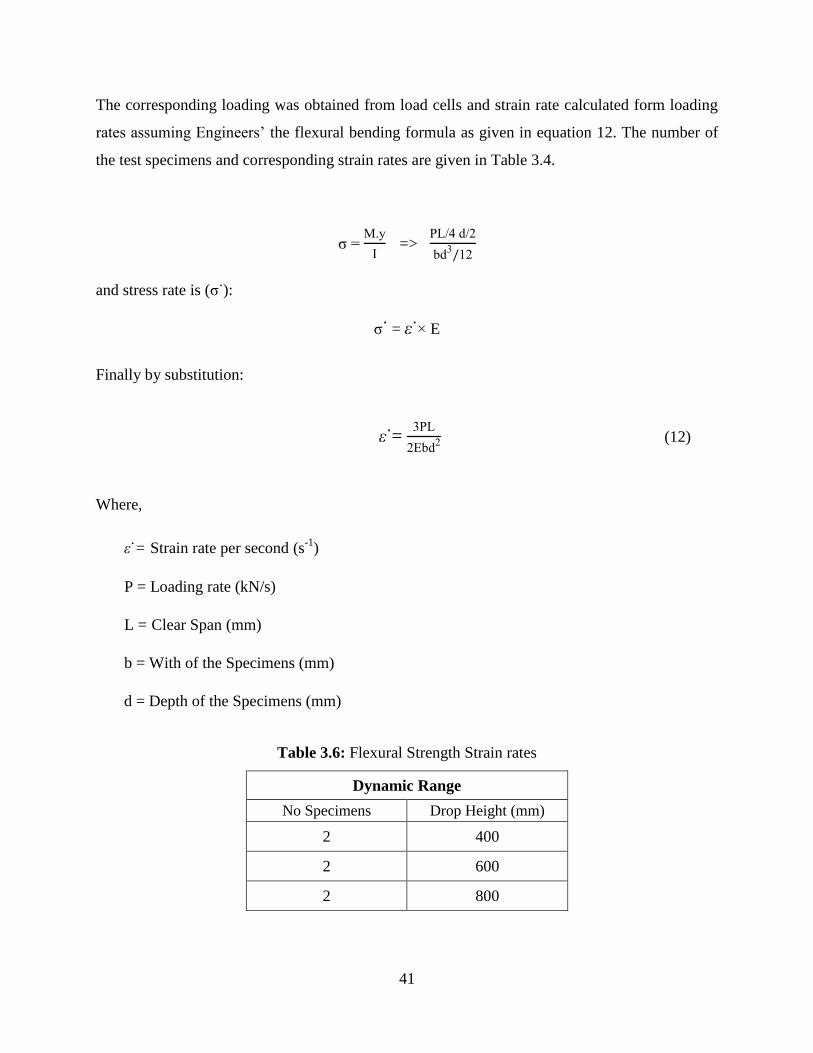
41
The corresponding loading was obtained from load cells and strain rate calculated form loading
rates assuming Engineers’ the flexural bending formula as given in equation 12. The number of
the test specimens and corresponding strain rates are given in Table 3.4.
= .y
I =>
P d
bd
and stress rate is ( ):
= ε E
Finally by substitution:
ε = P
Ebd (12)
Where,
ε = Strain rate per second (s-1
)
P = Loading rate (kN/s)
L = Clear Span (mm)
b = With of the Specimens (mm)
d = Depth of the Specimens (mm)
Table 3.6: Flexural Strength Strain rates
Dynamic Range
No Specimens Drop Height (mm)
2 400
2 600
2 800
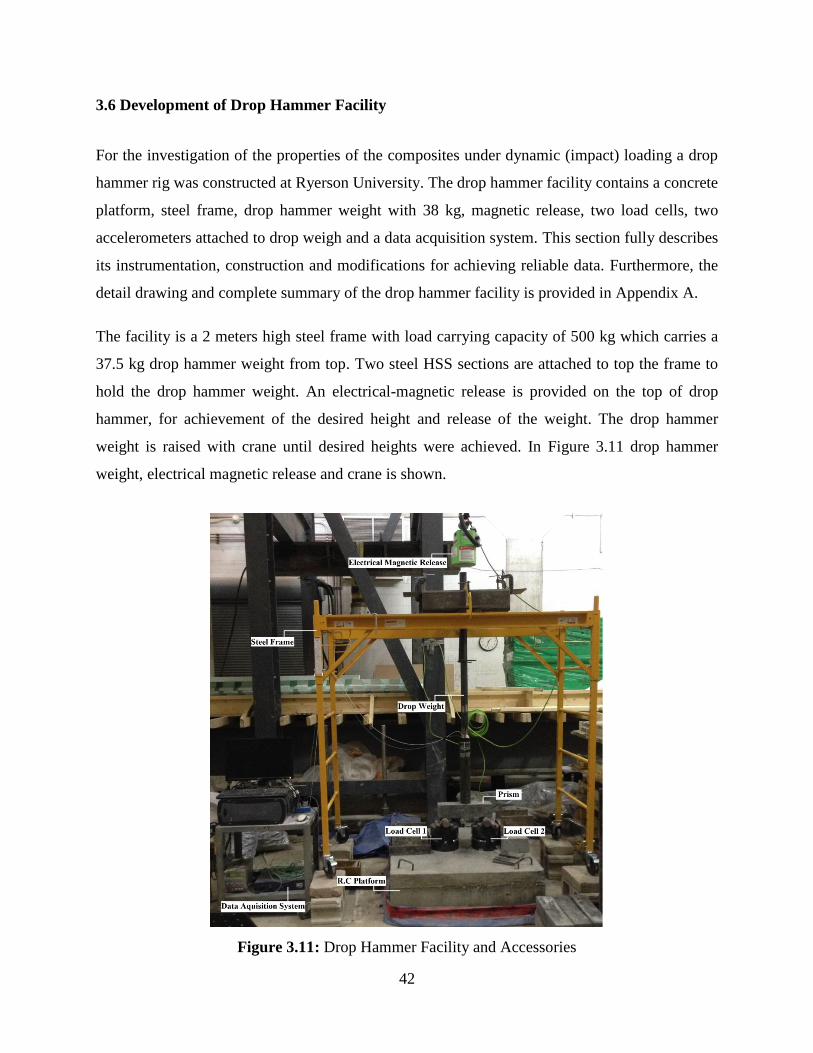
42
3.6 Development of Drop Hammer Facility
For the investigation of the properties of the composites under dynamic (impact) loading a drop
hammer rig was constructed at Ryerson University. The drop hammer facility contains a concrete
platform, steel frame, drop hammer weight with 38 kg, magnetic release, two load cells, two
accelerometers attached to drop weigh and a data acquisition system. This section fully describes
its instrumentation, construction and modifications for achieving reliable data. Furthermore, the
detail drawing and complete summary of the drop hammer facility is provided in Appendix A.
The facility is a 2 meters high steel frame with load carrying capacity of 500 kg which carries a
37.5 kg drop hammer weight from top. Two steel HSS sections are attached to top the frame to
hold the drop hammer weight. An electrical-magnetic release is provided on the top of drop
hammer, for achievement of the desired height and release of the weight. The drop hammer
weight is raised with crane until desired heights were achieved. In Figure 3.11 drop hammer
weight, electrical magnetic release and crane is shown.
Figure 3.11: Drop Hammer Facility and Accessories
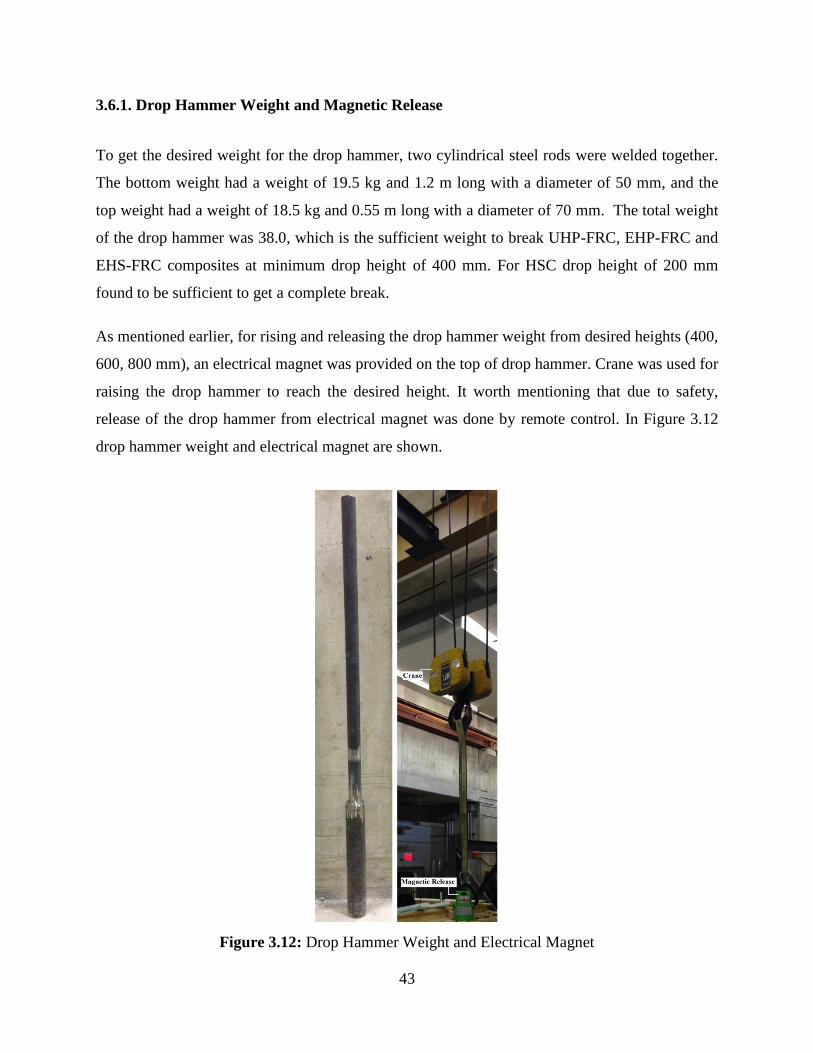
43
3.6.1. Drop Hammer Weight and Magnetic Release
To get the desired weight for the drop hammer, two cylindrical steel rods were welded together.
The bottom weight had a weight of 19.5 kg and 1.2 m long with a diameter of 50 mm, and the
top weight had a weight of 18.5 kg and 0.55 m long with a diameter of 70 mm. The total weight
of the drop hammer was 38.0, which is the sufficient weight to break UHP-FRC, EHP-FRC and
EHS-FRC composites at minimum drop height of 400 mm. For HSC drop height of 200 mm
found to be sufficient to get a complete break.
As mentioned earlier, for rising and releasing the drop hammer weight from desired heights (400,
600, 800 mm), an electrical magnet was provided on the top of drop hammer. Crane was used for
raising the drop hammer to reach the desired height. It worth mentioning that due to safety,
release of the drop hammer from electrical magnet was done by remote control. In Figure 3.12
drop hammer weight and electrical magnet are shown.
Figure 3.12: Drop Hammer Weight and Electrical Magnet
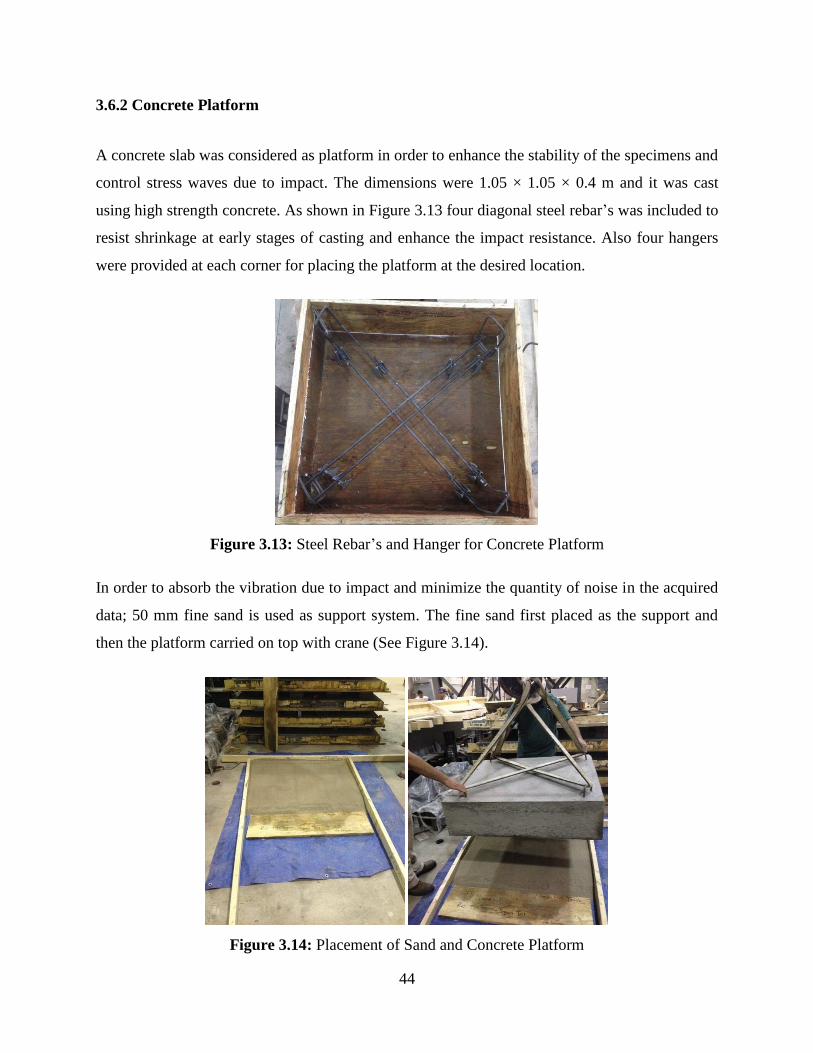
44
3.6.2 Concrete Platform
A concrete slab was considered as platform in order to enhance the stability of the specimens and
control stress waves due to impact. The dimensions were 1.05 × 1.05 × 0.4 m and it was cast
using high strength concrete. As shown in Figure 3.13 four diagonal steel rebar’s was included to
resist shrinkage at early stages of casting and enhance the impact resistance. Also four hangers
were provided at each corner for placing the platform at the desired location.
Figure 3.13: Steel Rebar’s and Hanger for Concrete Platform
In order to absorb the vibration due to impact and minimize the quantity of noise in the acquired
data; 50 mm fine sand is used as support system. The fine sand first placed as the support and
then the platform carried on top with crane (See Figure 3.14).
Figure 3.14: Placement of Sand and Concrete Platform
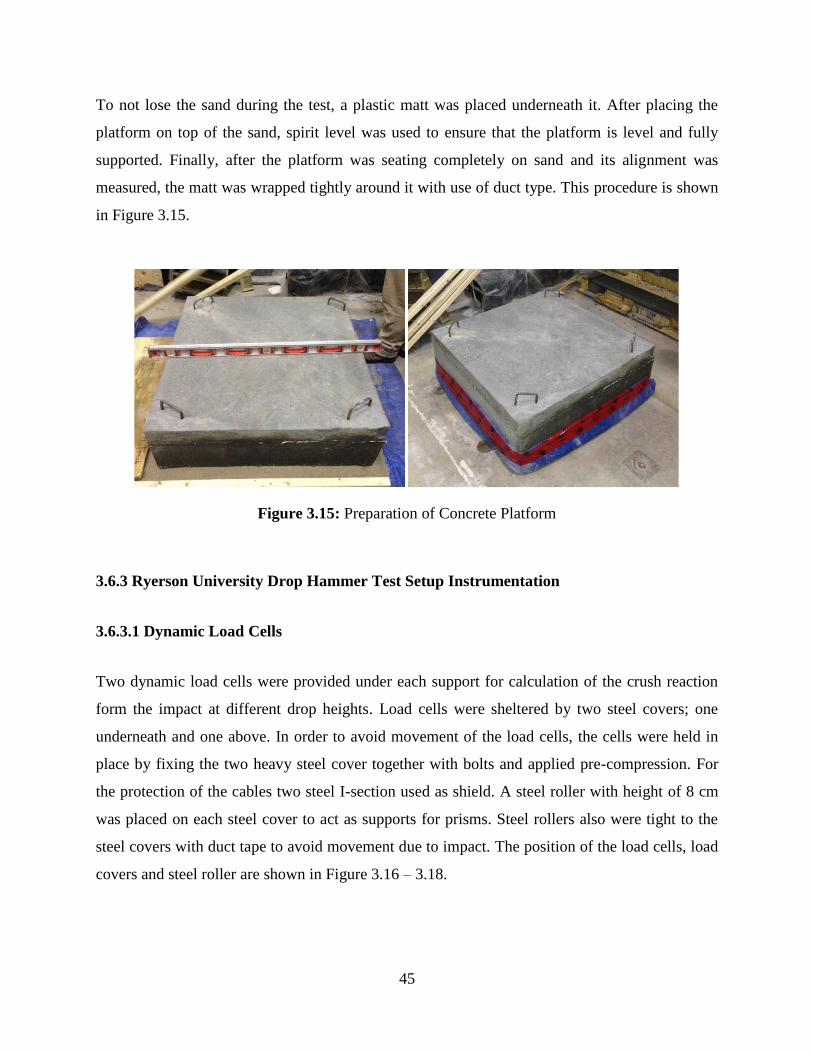
45
To not lose the sand during the test, a plastic matt was placed underneath it. After placing the
platform on top of the sand, spirit level was used to ensure that the platform is level and fully
supported. Finally, after the platform was seating completely on sand and its alignment was
measured, the matt was wrapped tightly around it with use of duct type. This procedure is shown
in Figure 3.15.
Figure 3.15: Preparation of Concrete Platform
3.6.3 Ryerson University Drop Hammer Test Setup Instrumentation
3.6.3.1 Dynamic Load Cells
Two dynamic load cells were provided under each support for calculation of the crush reaction
form the impact at different drop heights. Load cells were sheltered by two steel covers; one
underneath and one above. In order to avoid movement of the load cells, the cells were held in
place by fixing the two heavy steel cover together with bolts and applied pre-compression. For
the protection of the cables two steel I-section used as shield. A steel roller with height of 8 cm
was placed on each steel cover to act as supports for prisms. Steel rollers also were tight to the
steel covers with duct tape to avoid movement due to impact. The position of the load cells, load
covers and steel roller are shown in Figure 3.16 – 3.18.
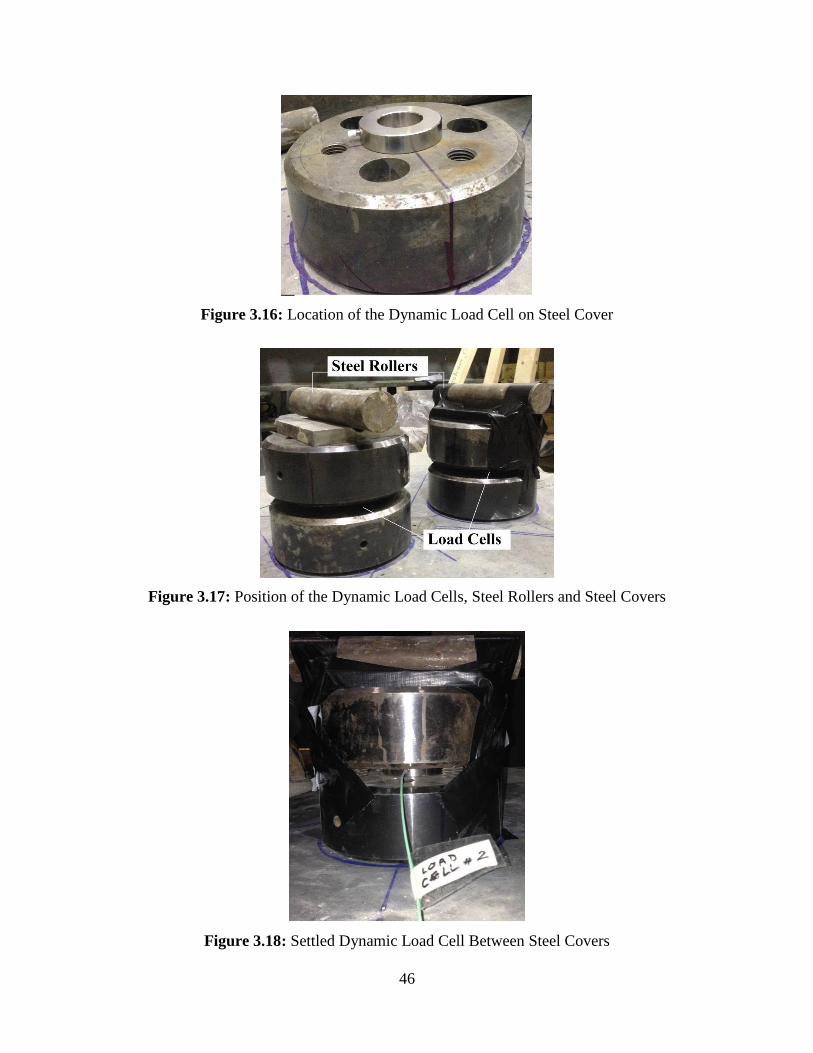
46
Figure 3.16: Location of the Dynamic Load Cell on Steel Cover
Figure 3.17: Position of the Dynamic Load Cells, Steel Rollers and Steel Covers
Figure 3.18: Settled Dynamic Load Cell Between Steel Covers

47
3.6.3.2 Accelerometers
For the validation of the test results two accelerometer were attached to the drop weight. The
accelerometers were capable of measuring acceleration along the single axis of motion. The
accelerometers were capable of measuring acceleration of ± 5,000 g and ± 500 g. Both
accelerometers were plugged to data acquisition system. Position of the accelerometers on drop
weight is shown in Figure 3.19.
Figure 3.19: Position of the Accelerometers on Drop Weight
In order to reduce the noise, rubber were used and wrapped with duct tape underneath of the
accelerometers. Figure 3.20 shows the rubber on drop weight before mounting the accelerometer.
Figure 3.20: Applied Rubber on Drop WeightBefore Mounting Accelerometer
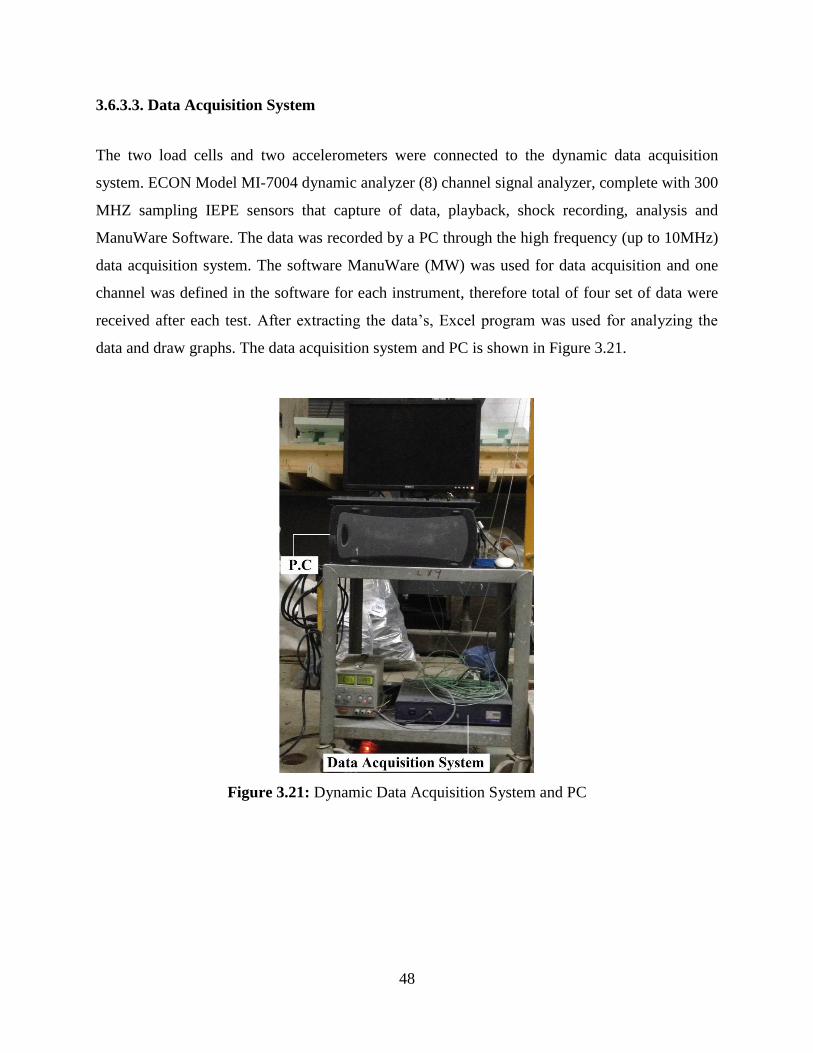
48
3.6.3.3. Data Acquisition System
The two load cells and two accelerometers were connected to the dynamic data acquisition
system. ECON Model MI-7004 dynamic analyzer (8) channel signal analyzer, complete with 300
MHZ sampling IEPE sensors that capture of data, playback, shock recording, analysis and
ManuWare Software. The data was recorded by a PC through the high frequency (up to 10MHz)
data acquisition system. The software ManuWare (MW) was used for data acquisition and one
channel was defined in the software for each instrument, therefore total of four set of data were
received after each test. After extracting the data’s, Excel program was used for analyzing the
data and draw graphs. The data acquisition system and PC is shown in Figure 3.21.
Figure 3.21: Dynamic Data Acquisition System and PC
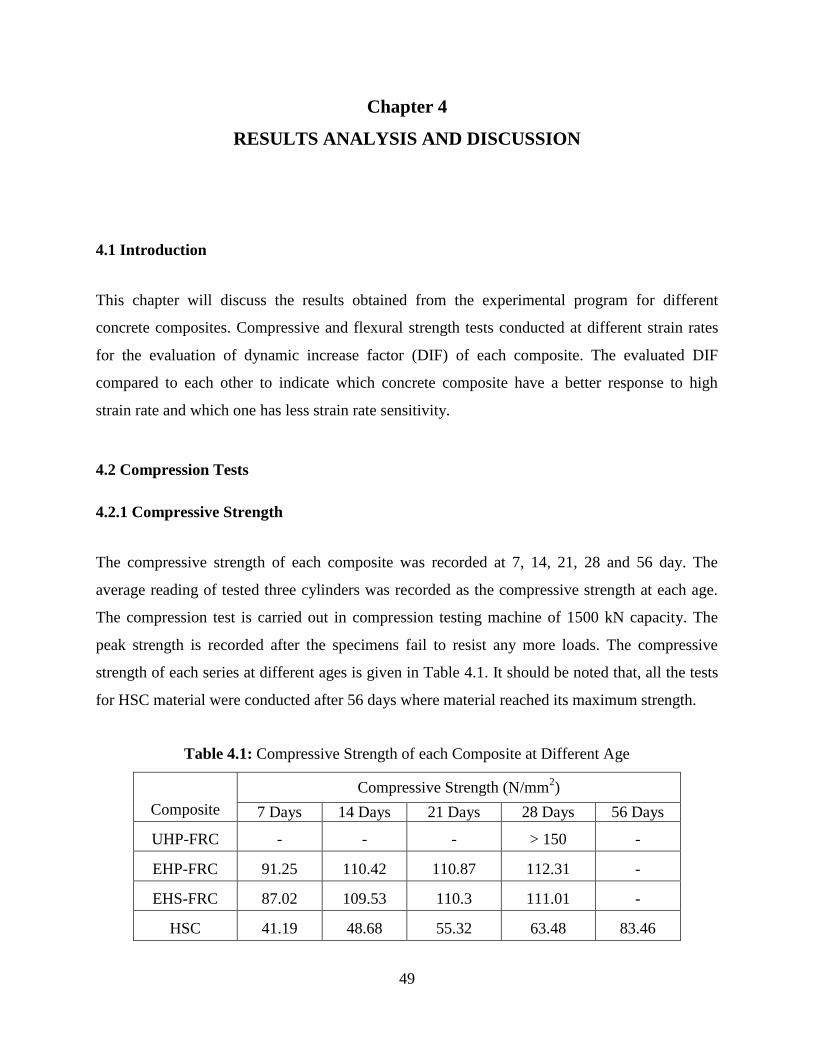
49
Chapter 4
RESULTS ANALYSIS AND DISCUSSION
4.1 Introduction
This chapter will discuss the results obtained from the experimental program for different
concrete composites. Compressive and flexural strength tests conducted at different strain rates
for the evaluation of dynamic increase factor (DIF) of each composite. The evaluated DIF
compared to each other to indicate which concrete composite have a better response to high
strain rate and which one has less strain rate sensitivity.
4.2 Compression Tests
4.2.1 Compressive Strength
The compressive strength of each composite was recorded at 7, 14, 21, 28 and 56 day. The
average reading of tested three cylinders was recorded as the compressive strength at each age.
The compression test is carried out in compression testing machine of 1500 kN capacity. The
peak strength is recorded after the specimens fail to resist any more loads. The compressive
strength of each series at different ages is given in Table 4.1. It should be noted that, all the tests
for HSC material were conducted after 56 days where material reached its maximum strength.
Table 4.1: Compressive Strength of each Composite at Different Age
Composite
Compressive Strength (N/mm2)
7 Days 14 Days 21 Days 28 Days 56 Days
UHP-FRC - - - > 150 -
EHP-FRC 91.25 110.42 110.87 112.31 -
EHS-FRC 87.02 109.53 110.3 111.01 -
HSC 41.19 48.68 55.32 63.48 83.46
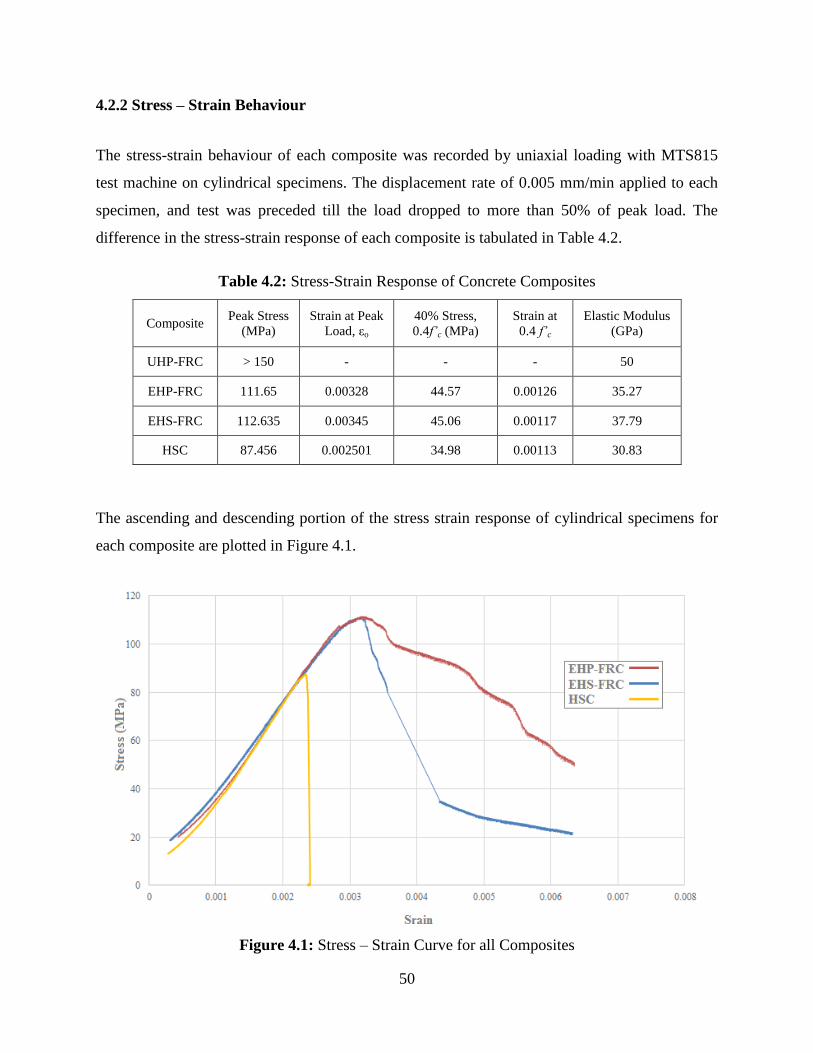
50
4.2.2 Stress – Strain Behaviour
The stress-strain behaviour of each composite was recorded by uniaxial loading with MTS815
test machine on cylindrical specimens. The displacement rate of 0.005 mm/min applied to each
specimen, and test was preceded till the load dropped to more than 50% of peak load. The
difference in the stress-strain response of each composite is tabulated in Table 4.2.
Table 4.2: Stress-Strain Response of Concrete Composites
Composite Peak Stress
(MPa)
Strain at Peak
Load, o
40% Stress,
0.4f’c (MPa)
Strain at
0.4 f’c
Elastic Modulus
(GPa)
UHP-FRC > 150 - - - 50
EHP-FRC 111.65 0.00328 44.57 0.00126 35.27
EHS-FRC 112.635 0.00345 45.06 0.00117 37.79
HSC 87.456 0.002501 34.98 0.00113 30.83
The ascending and descending portion of the stress strain response of cylindrical specimens for
each composite are plotted in Figure 4.1.
Figure 4.1: Stress – Strain Curve for all Composites
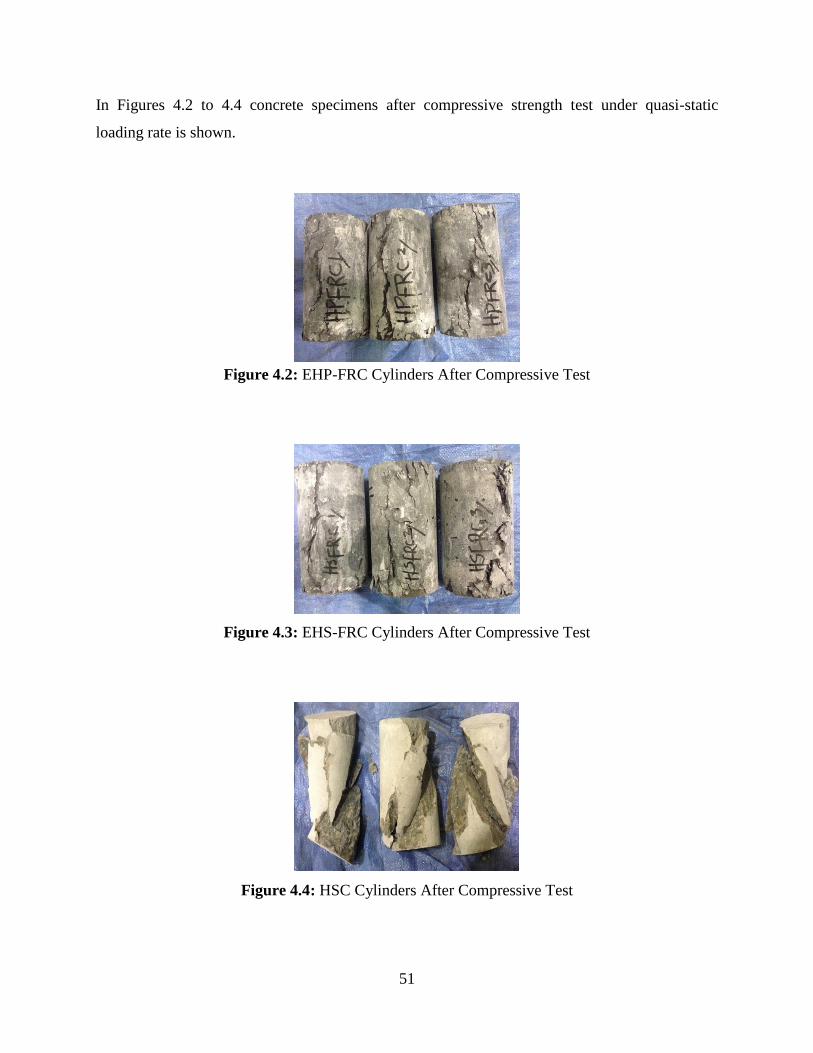
51
In Figures 4.2 to 4.4 concrete specimens after compressive strength test under quasi-static
loading rate is shown.
Figure 4.2: EHP-FRC Cylinders After Compressive Test
Figure 4.3: EHS-FRC Cylinders After Compressive Test
Figure 4.4: HSC Cylinders After Compressive Test
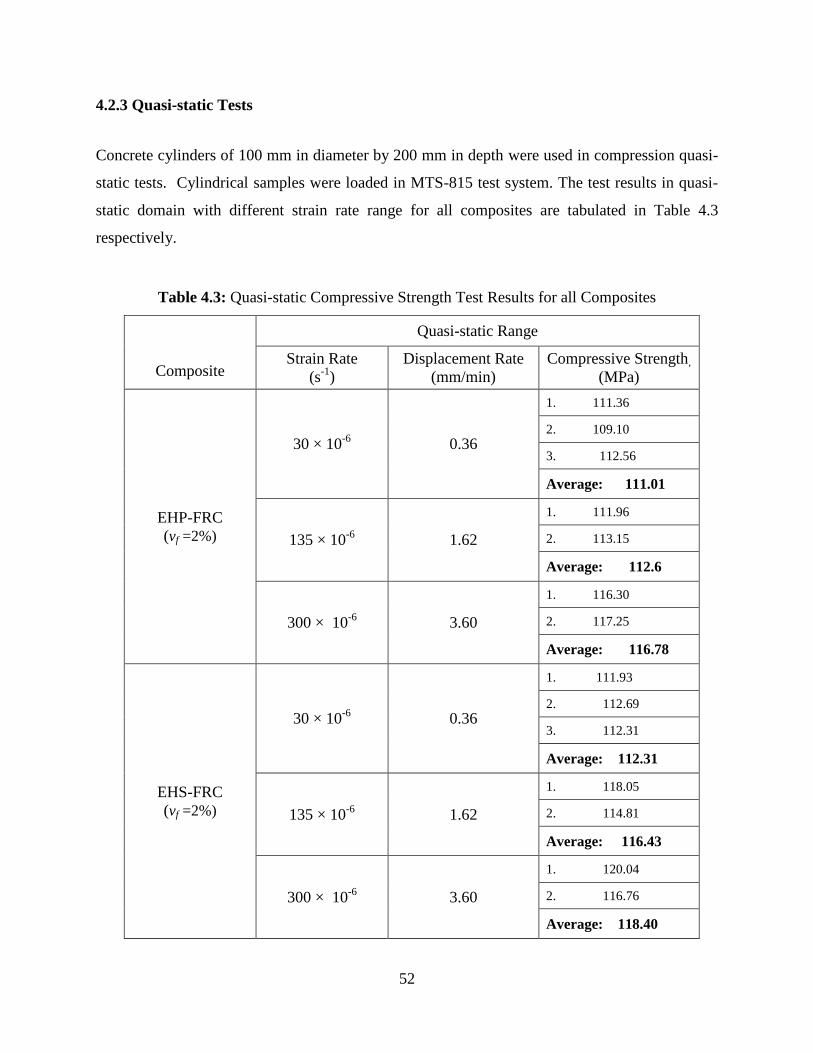
52
4.2.3 Quasi-static Tests
Concrete cylinders of 100 mm in diameter by 200 mm in depth were used in compression quasi-
static tests. Cylindrical samples were loaded in MTS-815 test system. The test results in quasi-
static domain with different strain rate range for all composites are tabulated in Table 4.3
respectively.
Table 4.3: Quasi-static Compressive Strength Test Results for all Composites
Composite
Quasi-static Range
Strain Rate
(s-1
)
Displacement Rate
(mm/min)
Compressive Strength,
(MPa)
EHP-FRC
(vf =2%)
30 × 10-6
0.36
1. 111.36
2. 109.10
3. 112.56
Average: 111.01
135 × 10-6
1.62
1. 111.96
2. 113.15
Average: 112.6
300 × 10-6
3.60
1. 116.30
2. 117.25
Average: 116.78
EHS-FRC
(vf =2%)
30 × 10-6
0.36
1. 111.93
2. 112.69
3. 112.31
Average: 112.31
135 × 10-6
1.62
1. 118.05
2. 114.81
Average: 116.43
300 × 10-6
3.60
1. 120.04
2. 116.76
Average: 118.40
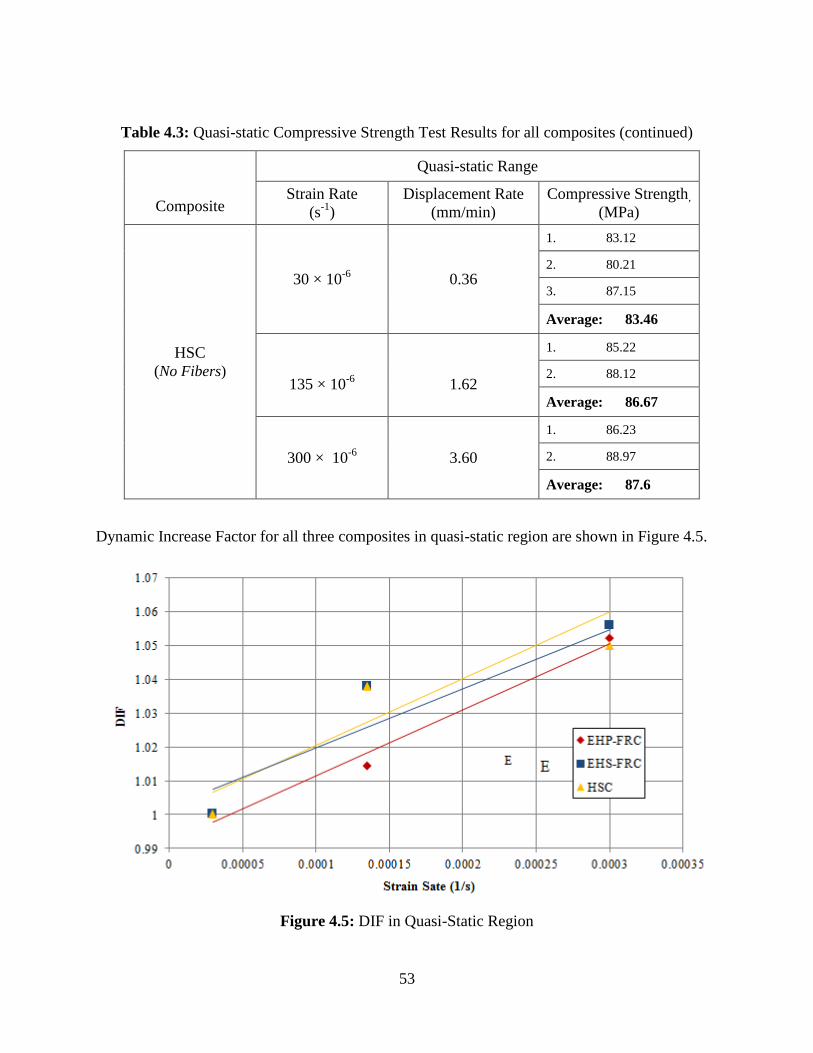
53
Table 4.3: Quasi-static Compressive Strength Test Results for all composites (continued)
Composite
Quasi-static Range
Strain Rate
(s-1
)
Displacement Rate
(mm/min)
Compressive Strength,
(MPa)
HSC
(No Fibers)
30 × 10-6
0.36
1. 83.12
2. 80.21
3. 87.15
Average: 83.46
135 × 10-6
1.62
1. 85.22
2. 88.12
Average: 86.67
300 × 10-6
3.60
1. 86.23
2. 88.97
Average: 87.6
Dynamic Increase Factor for all three composites in quasi-static region are shown in Figure 4.5.
Figure 4.5: DIF in Quasi-Static Region
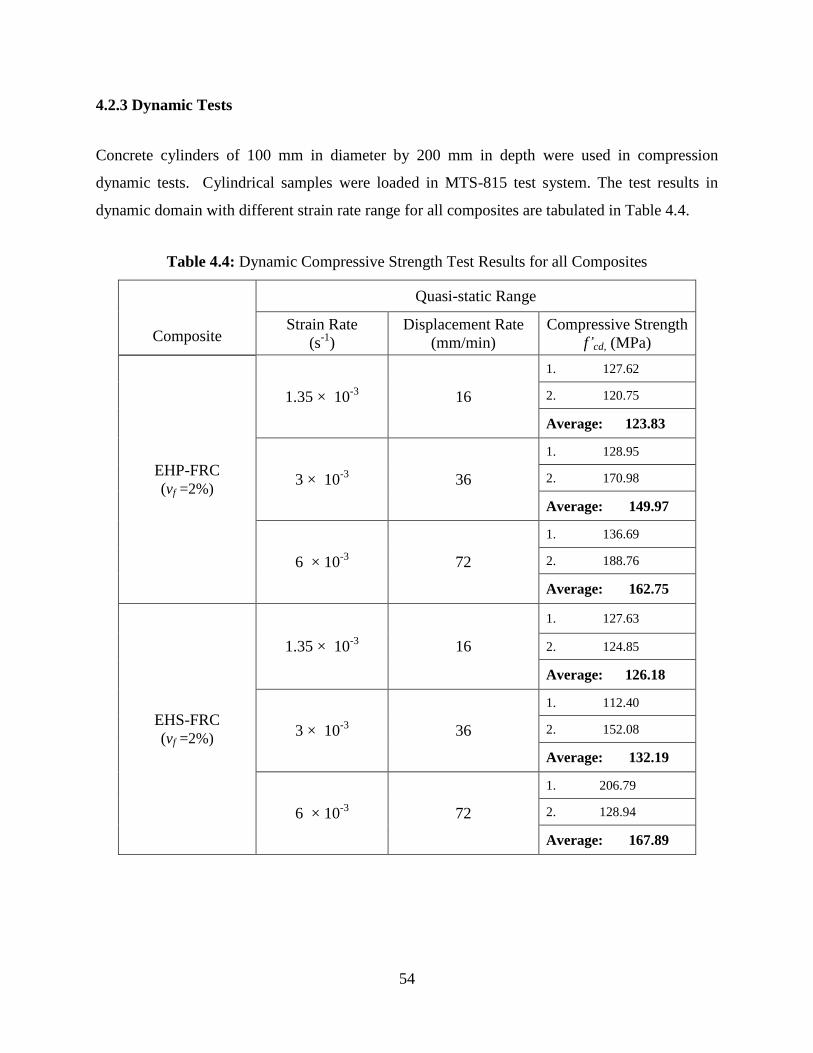
54
4.2.3 Dynamic Tests
Concrete cylinders of 100 mm in diameter by 200 mm in depth were used in compression
dynamic tests. Cylindrical samples were loaded in MTS-815 test system. The test results in
dynamic domain with different strain rate range for all composites are tabulated in Table 4.4.
Table 4.4: Dynamic Compressive Strength Test Results for all Composites
Composite
Quasi-static Range
Strain Rate
(s-1
)
Displacement Rate
(mm/min)
Compressive Strength
f’cd, (MPa)
EHP-FRC
(vf =2%)
1.35 × 10⁻³
16
1. 127.62
2. 120.75
Average: 123.83
3 × 10⁻³
36
1. 128.95
2. 170.98
Average: 149.97
6 × 10⁻³
72
1. 136.69
2. 188.76
Average: 162.75
EHS-FRC
(vf =2%)
1.35 × 10⁻³
16
1. 127.63
2. 124.85
Average: 126.18
3 × 10⁻³
36
1. 112.40
2. 152.08
Average: 132.19
6 × 10⁻³
72
1. 206.79
2. 128.94
Average: 167.89
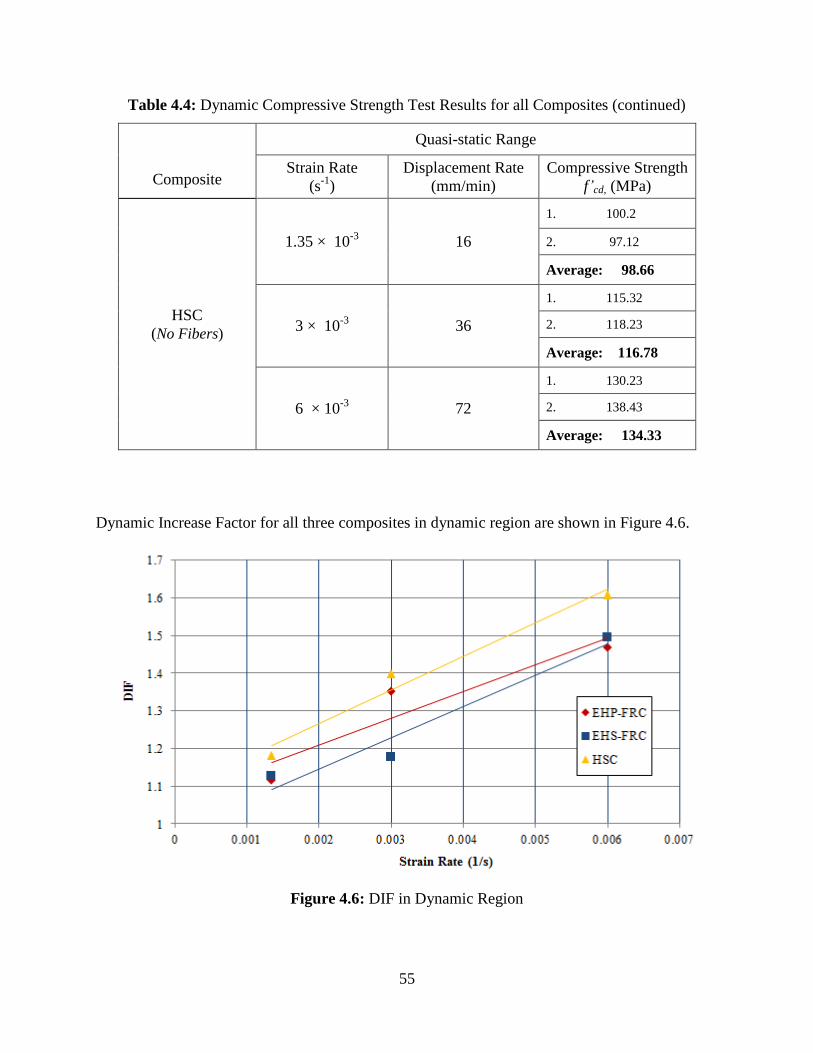
55
Table 4.4: Dynamic Compressive Strength Test Results for all Composites (continued)
Composite
Quasi-static Range
Strain Rate
(s-1
)
Displacement Rate
(mm/min)
Compressive Strength
f’cd, (MPa)
HSC
(No Fibers)
1.35 × 10⁻³
16
1. 100.2
2. 97.12
Average: 98.66
3 × 10⁻³
36
1. 115.32
2. 118.23
Average: 116.78
6 × 10⁻³
72
1. 130.23
2. 138.43
Average: 134.33
Dynamic Increase Factor for all three composites in dynamic region are shown in Figure 4.6.
Figure 4.6: DIF in Dynamic Region
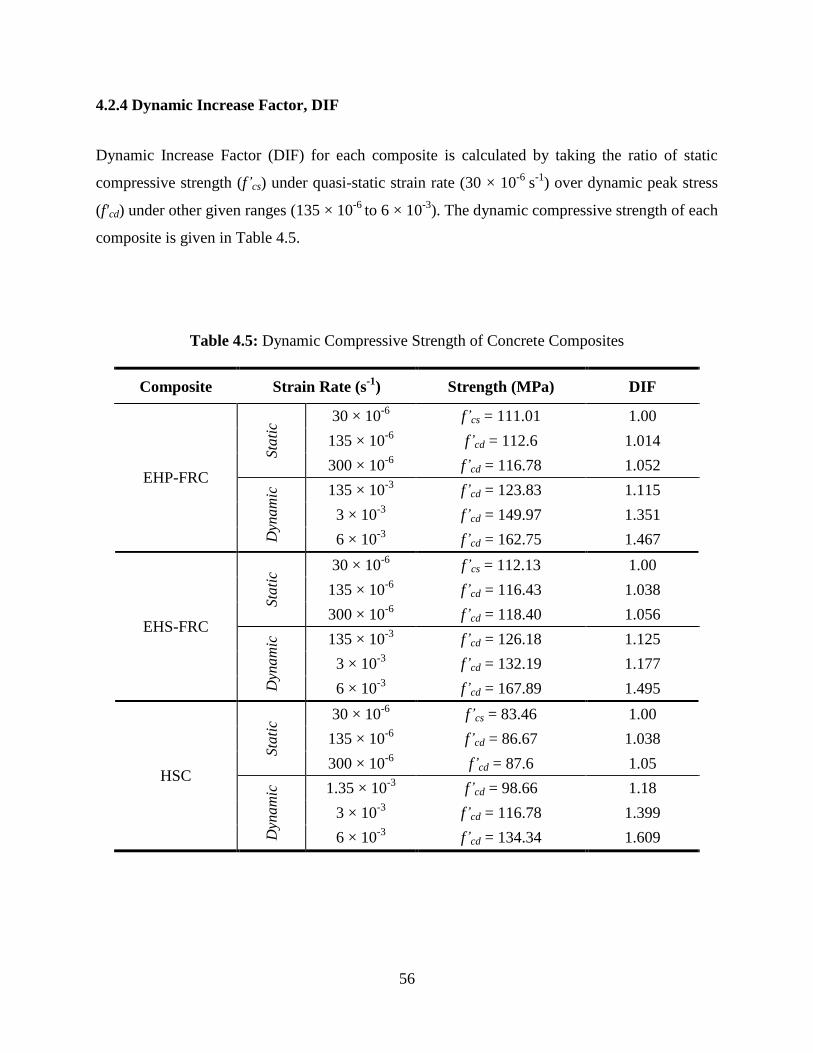
56
4.2.4 Dynamic Increase Factor, DIF
Dynamic Increase Factor (DIF) for each composite is calculated by taking the ratio of static
compressive strength (f’cs) under quasi-static strain rate (30 × 10-6
s-1
) over dynamic peak stress
(f'cd) under other given ranges (135 × 10-6
to 6 × 10⁻³
). The dynamic compressive strength of each
composite is given in Table 4.5.
Table 4.5: Dynamic Compressive Strength of Concrete Composites
Composite Strain Rate (s-1
) Strength (MPa) DIF
EHP-FRC
Sta
tic
30 × 10-6
f’cs = 111.01 1.00
135 × 10-6
f’cd = 112.6 1.014
300 × 10-6
f’cd = 116.78 1.052
Dyn
am
ic
135 × 10-3
f’cd = 123.83 1.115
3 × 10⁻³
f’cd = 149.97 1.351
6 × 10⁻³
f’cd = 162.75 1.467
EHS-FRC
Sta
tic
30 × 10-6
f’cs = 112.13 1.00
135 × 10-6
f’cd = 116.43 1.038
300 × 10-6
f’cd = 118.40 1.056
Dyn
am
ic
135 × 10-3
f’cd = 126.18 1.125
3 × 10⁻³
f’cd = 132.19 1.177
6 × 10⁻³
f’cd = 167.89 1.495
HSC
Sta
tic
30 × 10-6
f’cs = 83.46 1.00
135 × 10-6
f’cd = 86.67 1.038
300 × 10-6
f’cd = 87.6 1.05
Dyn
am
ic
1.35 × 10⁻³
f’cd = 98.66 1.18
3 × 10⁻³
f’cd = 116.78 1.399
6 × 10⁻³
f’cd = 134.34 1.609
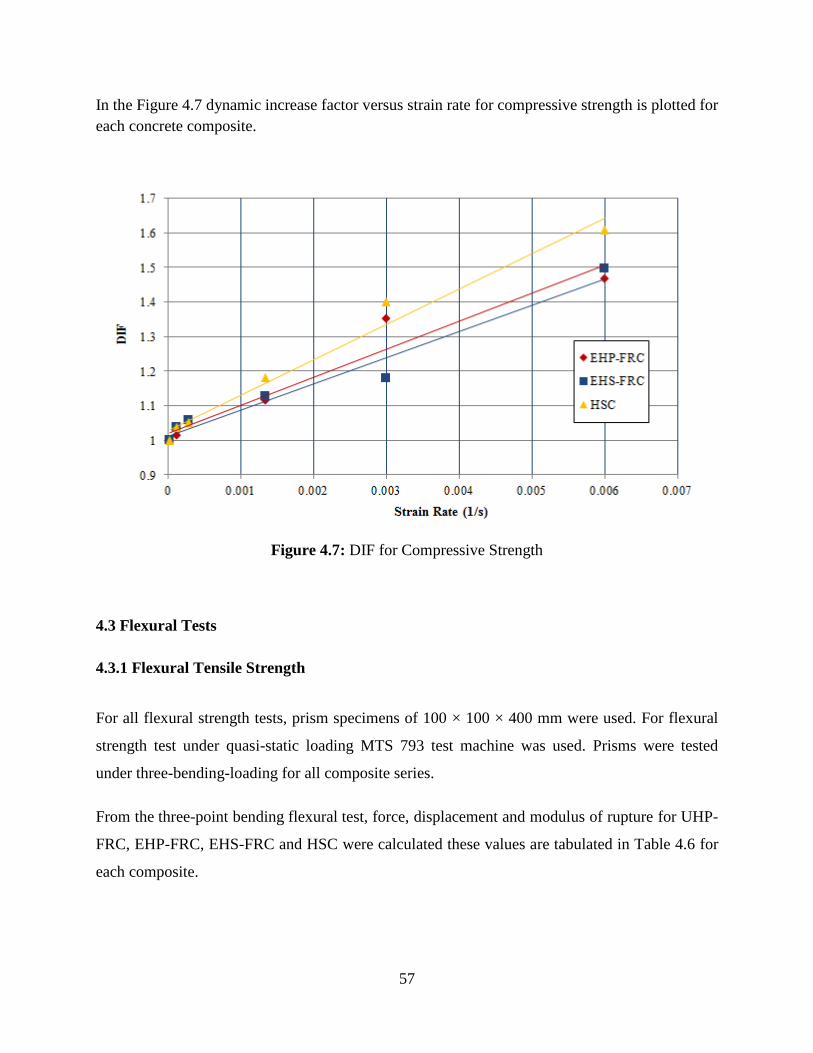
57
In the Figure 4.7 dynamic increase factor versus strain rate for compressive strength is plotted for
each concrete composite.
Figure 4.7: DIF for Compressive Strength
4.3 Flexural Tests
4.3.1 Flexural Tensile Strength
For all flexural strength tests, prism specimens of 100 × 100 × 400 mm were used. For flexural
strength test under quasi-static loading MTS 793 test machine was used. Prisms were tested
under three-bending-loading for all composite series.
From the three-point bending flexural test, force, displacement and modulus of rupture for UHP-
FRC, EHP-FRC, EHS-FRC and HSC were calculated these values are tabulated in Table 4.6 for
each composite.
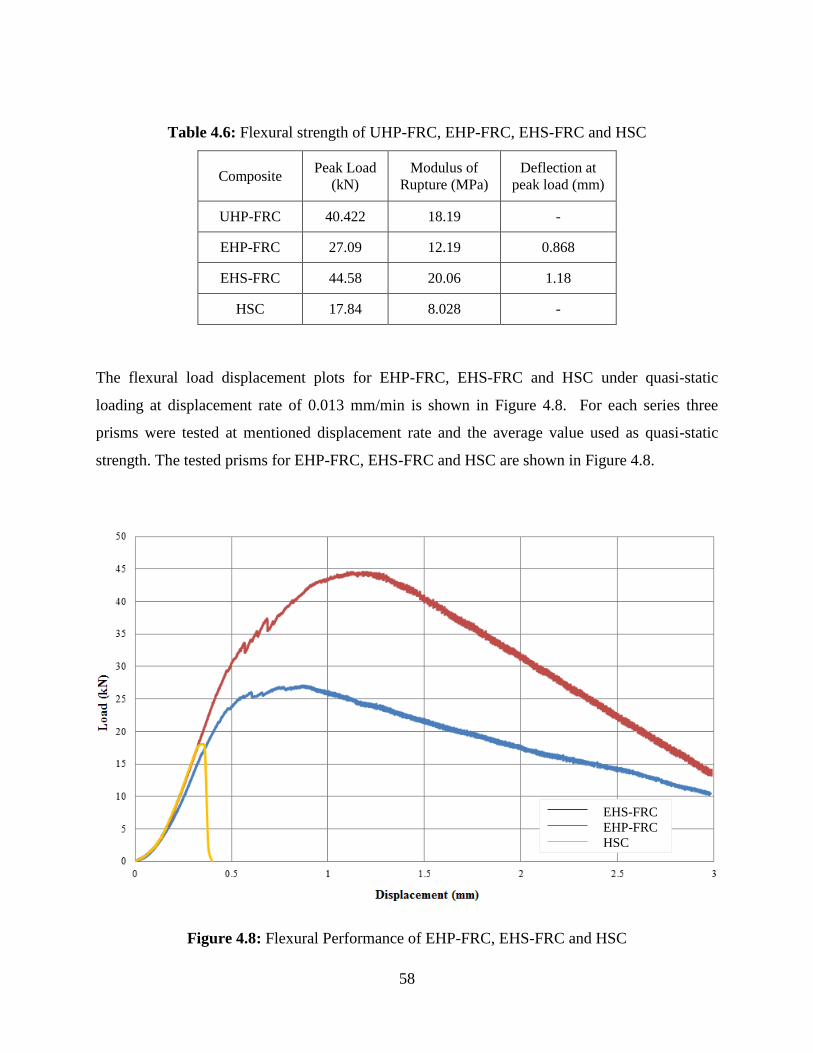
58
Table 4.6: Flexural strength of UHP-FRC, EHP-FRC, EHS-FRC and HSC
Composite Peak Load
(kN)
Modulus of
Rupture (MPa)
Deflection at
peak load (mm)
UHP-FRC 40.422 18.19 -
EHP-FRC 27.09 12.19 0.868
EHS-FRC 44.58 20.06 1.18
HSC 17.84 8.028 -
The flexural load displacement plots for EHP-FRC, EHS-FRC and HSC under quasi-static
loading at displacement rate of 0.013 mm/min is shown in Figure 4.8. For each series three
prisms were tested at mentioned displacement rate and the average value used as quasi-static
strength. The tested prisms for EHP-FRC, EHS-FRC and HSC are shown in Figure 4.8.
Figure 4.8: Flexural Performance of EHP-FRC, EHS-FRC and HSC
EHS-FRC
EHP-FRC
HSC
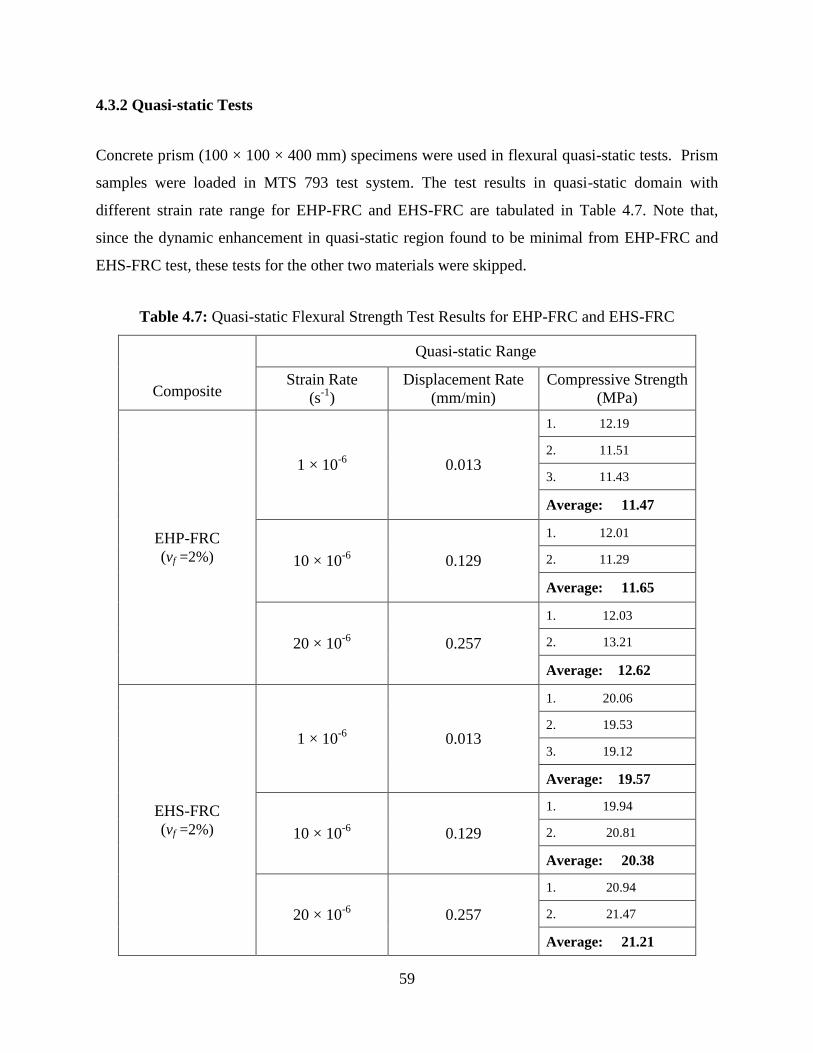
59
4.3.2 Quasi-static Tests
Concrete prism (100 × 100 × 400 mm) specimens were used in flexural quasi-static tests. Prism
samples were loaded in MTS 793 test system. The test results in quasi-static domain with
different strain rate range for EHP-FRC and EHS-FRC are tabulated in Table 4.7. Note that,
since the dynamic enhancement in quasi-static region found to be minimal from EHP-FRC and
EHS-FRC test, these tests for the other two materials were skipped.
Table 4.7: Quasi-static Flexural Strength Test Results for EHP-FRC and EHS-FRC
Composite
Quasi-static Range
Strain Rate
(s-1
)
Displacement Rate
(mm/min)
Compressive Strength
(MPa)
EHP-FRC
(vf =2%)
1 × 10⁻⁶
0.013
1. 12.19
2. 11.51
3. 11.43
Average: 11.47
10 × 10-6
0.129
1. 12.01
2. 11.29
Average: 11.65
20 × 10-6
0.257
1. 12.03
2. 13.21
Average: 12.62
EHS-FRC
(vf =2%)
1 × 10⁻⁶
0.013
1. 20.06
2. 19.53
3. 19.12
Average: 19.57
10 × 10-6
0.129
1. 19.94
2. 20.81
Average: 20.38
20 × 10-6
0.257
1. 20.94
2. 21.47
Average: 21.21
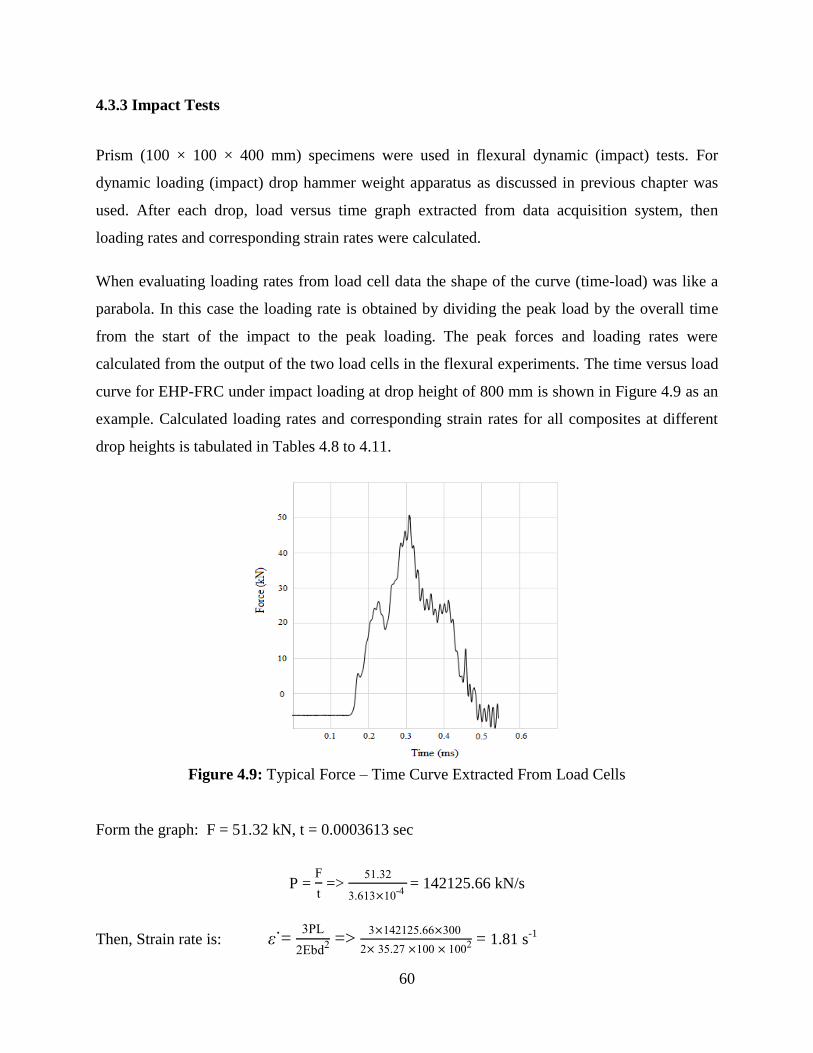
60
4.3.3 Impact Tests
Prism (100 × 100 × 400 mm) specimens were used in flexural dynamic (impact) tests. For
dynamic loading (impact) drop hammer weight apparatus as discussed in previous chapter was
used. After each drop, load versus time graph extracted from data acquisition system, then
loading rates and corresponding strain rates were calculated.
When evaluating loading rates from load cell data the shape of the curve (time-load) was like a
parabola. In this case the loading rate is obtained by dividing the peak load by the overall time
from the start of the impact to the peak loading. The peak forces and loading rates were
calculated from the output of the two load cells in the flexural experiments. The time versus load
curve for EHP-FRC under impact loading at drop height of 800 mm is shown in Figure 4.9 as an
example. Calculated loading rates and corresponding strain rates for all composites at different
drop heights is tabulated in Tables 4.8 to 4.11.
Figure 4.9: Typical Force – Time Curve Extracted From Load Cells
Form the graph: F = 51.32 kN, t = 0.0003613 sec
P = F
t =>
.
. -
= 142125.66 kN/s
Then, Strain rate is: ε = P
Ebd =>
.
. = 1.81 s
-1
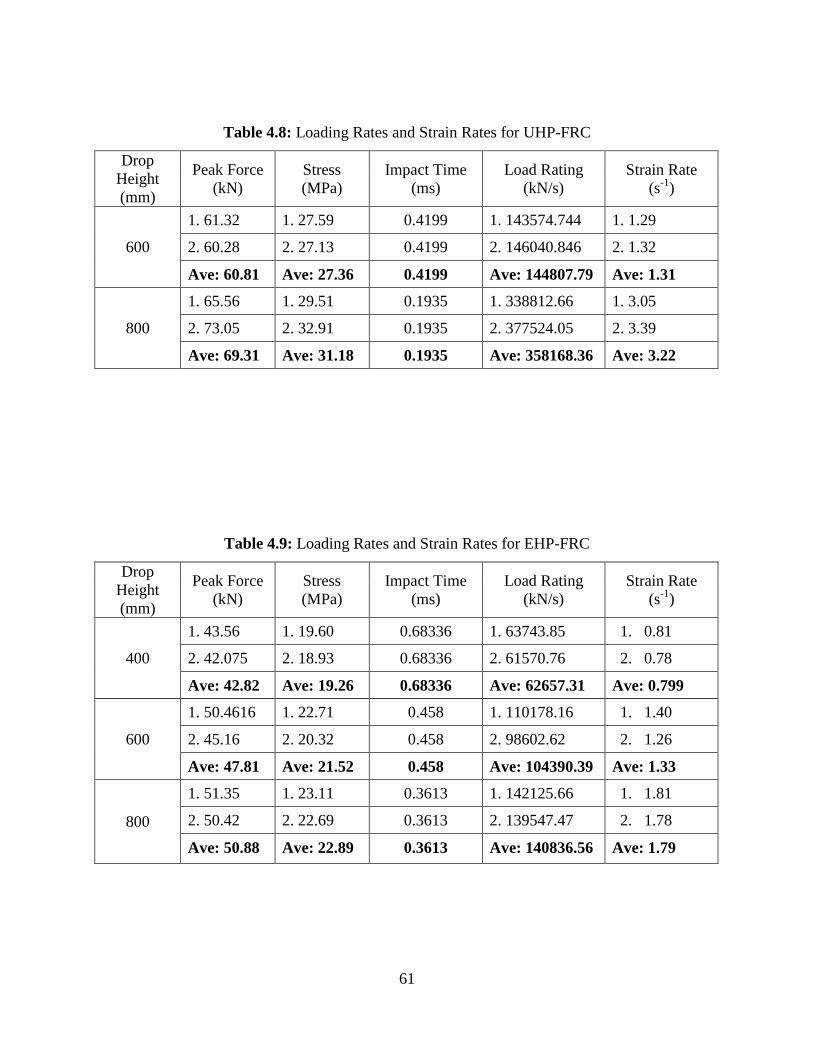
61
Table 4.8: Loading Rates and Strain Rates for UHP-FRC
Drop
Height
(mm)
Peak Force
(kN)
Stress
(MPa)
Impact Time
(ms)
Load Rating
(kN/s)
Strain Rate
(s-1
)
600
1. 61.32 1. 27.59 0.4199 1. 143574.744 1. 1.29
2. 60.28 2. 27.13 0.4199 2. 146040.846 2. 1.32
Ave: 60.81 Ave: 27.36 0.4199 Ave: 144807.79 Ave: 1.31
800
1. 65.56 1. 29.51 0.1935 1. 338812.66 1. 3.05
2. 73.05 2. 32.91 0.1935 2. 377524.05 2. 3.39
Ave: 69.31 Ave: 31.18 0.1935 Ave: 358168.36 Ave: 3.22
Table 4.9: Loading Rates and Strain Rates for EHP-FRC
Drop
Height
(mm)
Peak Force
(kN)
Stress
(MPa)
Impact Time
(ms)
Load Rating
(kN/s)
Strain Rate
(s-1
)
400
1. 43.56 1. 19.60 0.68336 1. 63743.85 1. 0.81
2. 42.075 2. 18.93 0.68336 2. 61570.76 2. 0.78
Ave: 42.82 Ave: 19.26 0.68336 Ave: 62657.31 Ave: 0.799
600
1. 50.4616 1. 22.71 0.458 1. 110178.16 1. 1.40
2. 45.16 2. 20.32 0.458 2. 98602.62 2. 1.26
Ave: 47.81 Ave: 21.52 0.458 Ave: 104390.39 Ave: 1.33
800
1. 51.35 1. 23.11 0.3613 1. 142125.66 1. 1.81
2. 50.42 2. 22.69 0.3613 2. 139547.47 2. 1.78
Ave: 50.88 Ave: 22.89 0.3613 Ave: 140836.56 Ave: 1.79
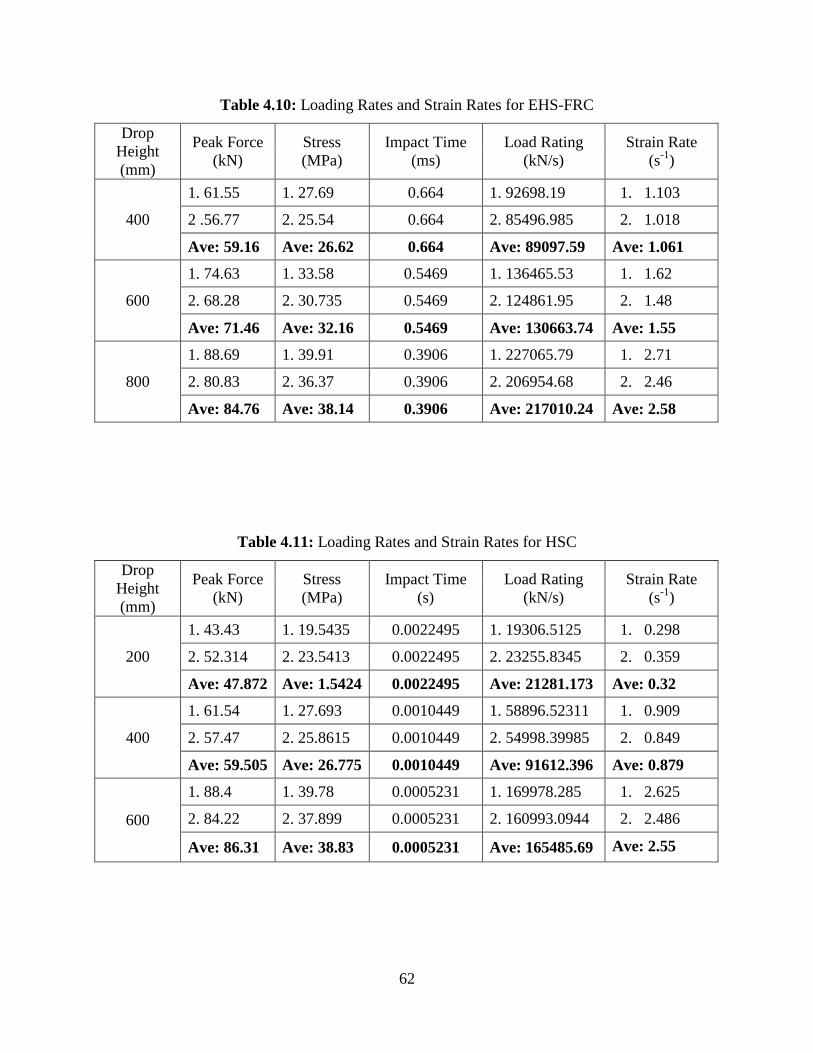
62
Table 4.10: Loading Rates and Strain Rates for EHS-FRC
Drop
Height
(mm)
Peak Force
(kN)
Stress
(MPa)
Impact Time
(ms)
Load Rating
(kN/s)
Strain Rate
(s-1
)
400
1. 61.55 1. 27.69 0.664 1. 92698.19 1. 1.103
2 .56.77 2. 25.54 0.664 2. 85496.985 2. 1.018
Ave: 59.16 Ave: 26.62 0.664 Ave: 89097.59 Ave: 1.061
600
1. 74.63 1. 33.58 0.5469 1. 136465.53 1. 1.62
2. 68.28 2. 30.735 0.5469 2. 124861.95 2. 1.48
Ave: 71.46 Ave: 32.16 0.5469 Ave: 130663.74 Ave: 1.55
800
1. 88.69 1. 39.91 0.3906 1. 227065.79 1. 2.71
2. 80.83 2. 36.37 0.3906 2. 206954.68 2. 2.46
Ave: 84.76 Ave: 38.14 0.3906 Ave: 217010.24 Ave: 2.58
Table 4.11: Loading Rates and Strain Rates for HSC
Drop
Height
(mm)
Peak Force
(kN)
Stress
(MPa)
Impact Time
(s)
Load Rating
(kN/s)
Strain Rate
(s-1
)
200
1. 43.43 1. 19.5435 0.0022495 1. 19306.5125 1. 0.298
2. 52.314 2. 23.5413 0.0022495 2. 23255.8345 2. 0.359
Ave: 47.872 Ave: 1.5424 0.0022495 Ave: 21281.173 Ave: 0.32
400
1. 61.54 1. 27.693 0.0010449 1. 58896.52311 1. 0.909
2. 57.47 2. 25.8615 0.0010449 2. 54998.39985 2. 0.849
Ave: 59.505 Ave: 26.775 0.0010449 Ave: 91612.396 Ave: 0.879
600
1. 88.4 1. 39.78 0.0005231 1. 169978.285 1. 2.625
2. 84.22 2. 37.899 0.0005231 2. 160993.0944 2. 2.486
Ave: 86.31 Ave: 38.83 0.0005231 Ave: 165485.69 Ave: 2.55
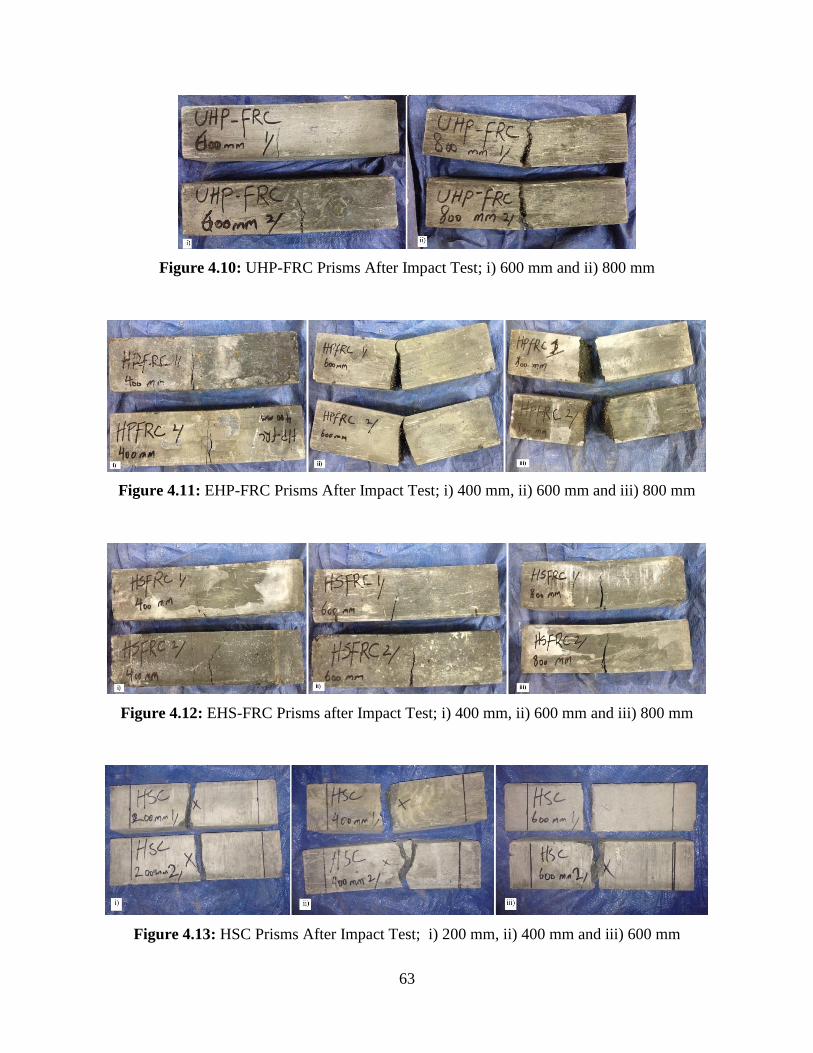
63
Figure 4.10: UHP-FRC Prisms After Impact Test; i) 600 mm and ii) 800 mm
Figure 4.11: EHP-FRC Prisms After Impact Test; i) 400 mm, ii) 600 mm and iii) 800 mm
Figure 4.12: EHS-FRC Prisms after Impact Test; i) 400 mm, ii) 600 mm and iii) 800 mm
Figure 4.13: HSC Prisms After Impact Test; i) 200 mm, ii) 400 mm and iii) 600 mm
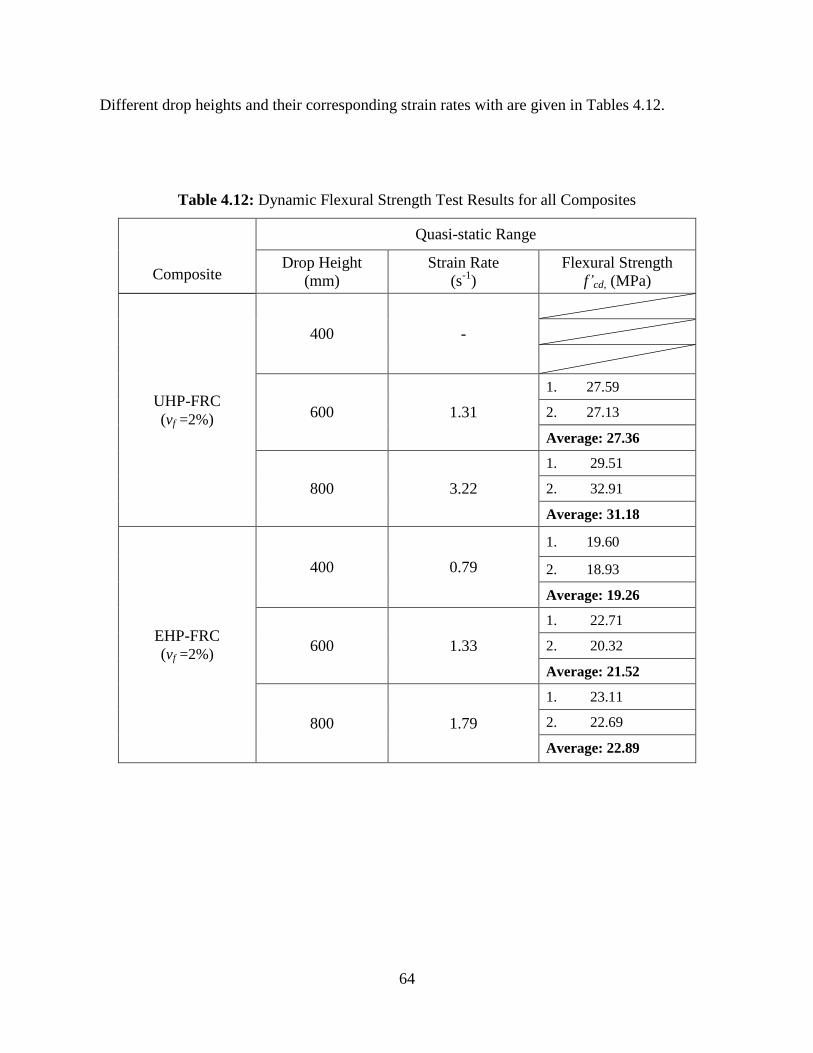
64
Different drop heights and their corresponding strain rates with are given in Tables 4.12.
Table 4.12: Dynamic Flexural Strength Test Results for all Composites
Composite
Quasi-static Range
Drop Height
(mm)
Strain Rate
(s-1
)
Flexural Strength
f’cd, (MPa)
UHP-FRC
(vf =2%)
400 -
600 1.31
1. 27.59
2. 27.13
Average: 27.36
800 3.22
1. 29.51
2. 32.91
Average: 31.18
EHP-FRC
(vf =2%)
400 0.79
1. 19.60
2. 18.93
Average: 19.26
600 1.33
1. 22.71
2. 20.32
Average: 21.52
800 1.79
1. 23.11
2. 22.69
Average: 22.89
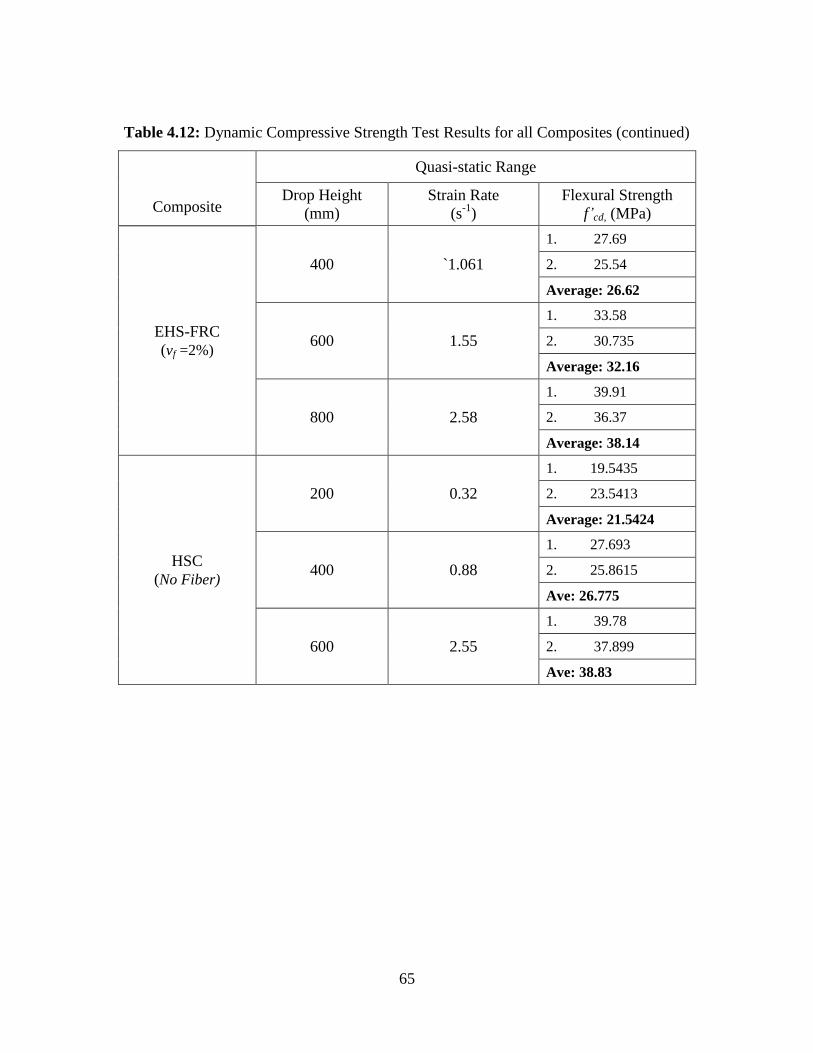
65
Table 4.12: Dynamic Compressive Strength Test Results for all Composites (continued)
Composite
Quasi-static Range
Drop Height
(mm)
Strain Rate
(s-1
)
Flexural Strength
f’cd, (MPa)
EHS-FRC
(vf =2%)
400 `1.061
1. 27.69
2. 25.54
Average: 26.62
600 1.55
1. 33.58
2. 30.735
Average: 32.16
800 2.58
1. 39.91
2. 36.37
Average: 38.14
HSC
(No Fiber)
200 0.32
1. 19.5435
2. 23.5413
Average: 21.5424
400 0.88
1. 27.693
2. 25.8615
Ave: 26.775
600 2.55
1. 39.78
2. 37.899
Ave: 38.83
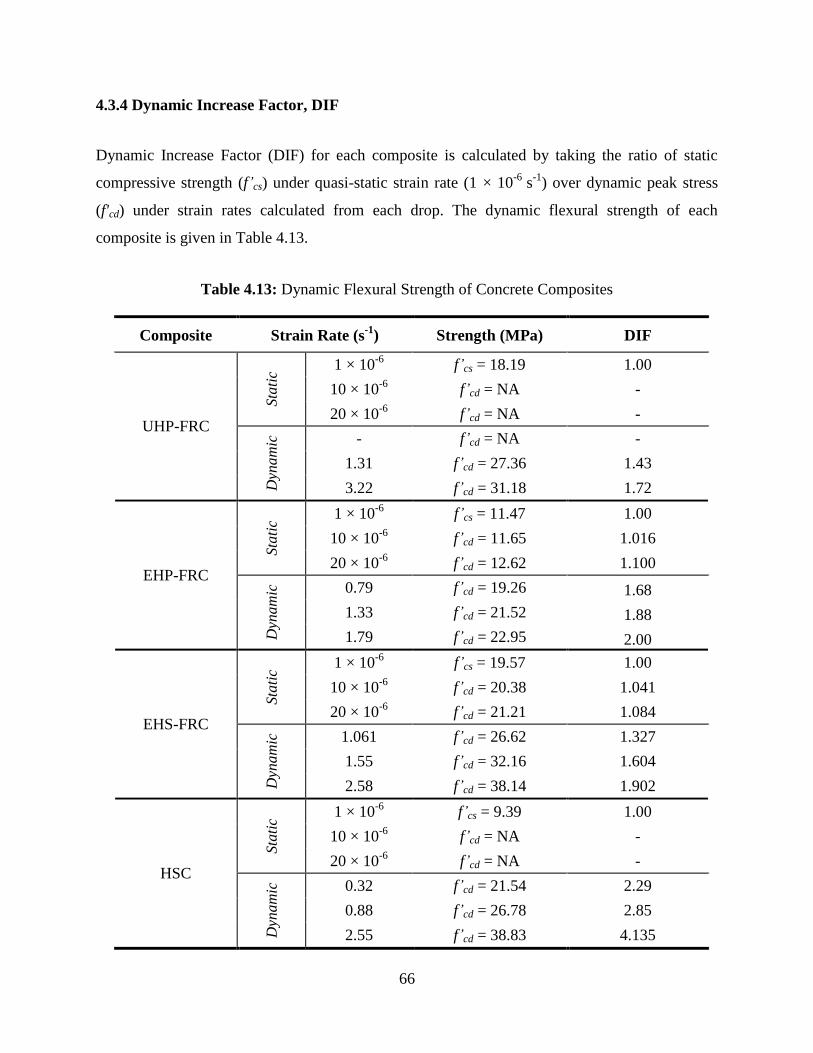
66
4.3.4 Dynamic Increase Factor, DIF
Dynamic Increase Factor (DIF) for each composite is calculated by taking the ratio of static
compressive strength (f’cs) under quasi-static strain rate (1 × 10⁻⁶
s-1
) over dynamic peak stress
(f'cd) under strain rates calculated from each drop. The dynamic flexural strength of each
composite is given in Table 4.13.
Table 4.13: Dynamic Flexural Strength of Concrete Composites
Composite Strain Rate (s-1
) Strength (MPa) DIF
UHP-FRC
Sta
tic
1 × 10⁻⁶
f’cs = 18.19 1.00
10 × 10-6
f’cd = NA -
20 × 10-6
f’cd = NA -
Dyn
am
ic
- f’cd = NA -
1.31 f’cd = 27.36 1.43
3.22 f’cd = 31.18 1.72
EHP-FRC
Sta
tic
1 × 10⁻⁶
f’cs = 11.47 1.00
10 × 10-6
f’cd = 11.65 1.016
20 × 10-6
f’cd = 12.62 1.100
Dyn
am
ic
0.79 f’cd = 19.26 1.68
1.33 f’cd = 21.52 1.88
1.79 f’cd = 22.95 2.00
EHS-FRC
Sta
tic
1 × 10⁻⁶
f’cs = 19.57 1.00
10 × 10-6
f’cd = 20.38 1.041
20 × 10-6
f’cd = 21.21 1.084
Dyn
am
ic
1.061 f’cd = 26.62 1.327
1.55 f’cd = 32.16 1.604
2.58 f’cd = 38.14 1.902
HSC
Sta
tic
1 × 10⁻⁶
f’cs = 9.39 1.00
10 × 10-6
f’cd = NA -
20 × 10-6
f’cd = NA -
Dyn
am
ic
0.32 f’cd = 21.54 2.29
0.88 f’cd = 26.78 2.85
2.55 f’cd = 38.83 4.135
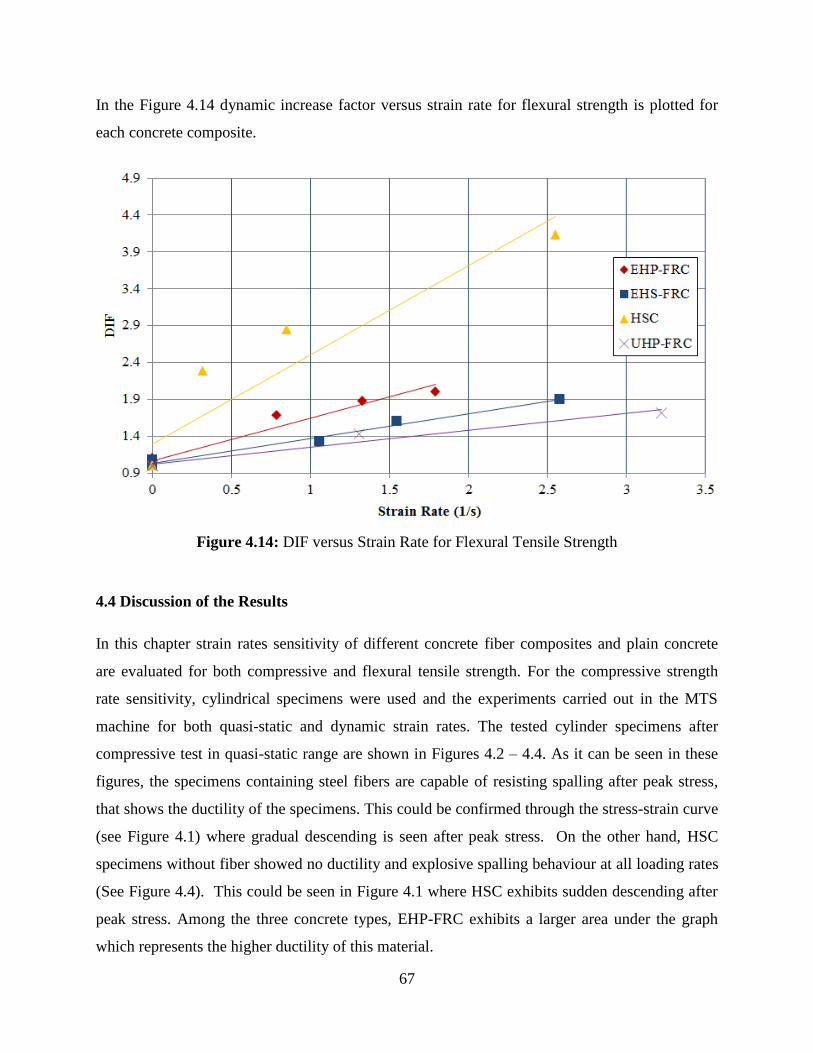
67
In the Figure 4.14 dynamic increase factor versus strain rate for flexural strength is plotted for
each concrete composite.
Figure 4.14: DIF versus Strain Rate for Flexural Tensile Strength
4.4 Discussion of the Results
In this chapter strain rates sensitivity of different concrete fiber composites and plain concrete
are evaluated for both compressive and flexural tensile strength. For the compressive strength
rate sensitivity, cylindrical specimens were used and the experiments carried out in the MTS
machine for both quasi-static and dynamic strain rates. The tested cylinder specimens after
compressive test in quasi-static range are shown in Figures 4.2 – 4.4. As it can be seen in these
figures, the specimens containing steel fibers are capable of resisting spalling after peak stress,
that shows the ductility of the specimens. This could be confirmed through the stress-strain curve
(see Figure 4.1) where gradual descending is seen after peak stress. On the other hand, HSC
specimens without fiber showed no ductility and explosive spalling behaviour at all loading rates
(See Figure 4.4). This could be seen in Figure 4.1 where HSC exhibits sudden descending after
peak stress. Among the three concrete types, EHP-FRC exhibits a larger area under the graph
which represents the higher ductility of this material.
68
Test results of the quasi-static and dynamic compressive strength is given in Table 4.4 and 4.5
respectively. As it was expected, with greater strain rates, a larger increment in compressive
strength is achieved. Overall, compressive strengths under dynamic loading are greater than
under quasi-static loading. Figure 4.8 presents the relationship between strain rates and DIF. The
results show that in both regions HSC without fiber exhibits higher sensitivity than the other two
composites with steel fiber content. The DIF for HSC found to be 1.609 under a strain rate of 6 ×
10-3
s-1
, while DIF under same strain rate for EHP-FRC and EHS-FRC are 1.467 and 1.495
respectively.
For the flexural tensile strength rate sensitivity, prism specimens were tested. For the quasi-static
region, prisms tested in MTS machine under three-point bending loading. In this region
maximum strain rate of 20 × 10-6
was achieved with DIF of 1.1. In flexural strength the
increment of strength is minimal in quasi-static region using MTS testing machine.
In order to achieve high strain rates in dynamic region, prism specimens tested under impact
loading using drop weight hammer facility. Different heights of 400, 600 and 800 mm used for
composites containing fibers while drop heights of 200, 400, 600 mm were used for HSC
without fiber. The tested prisms at different drop heights are shown in Figures 4.10 to 4.13.
As it can be seen in Figure 4.10, UHP-FRC exhibits an outstanding performance under impact
loading. The prism specimens were partly connected under drop height of 800 mm, and complete
fracture did not occur. The UHP-FRC prisms experienced fiber pullout mode of failure.
In the case of EHP-FRC, drop weight had to rise to 800 mm to get the complete fracture. The
failure mode of the EHP-FRC prisms was seen to be due to fiber pull out rather than fiber
fracture. For EHS-FRC even 800 mm was not sufficient to completely break the specimens (See
Figure 4.12). This confirms that EHS-FRC has higher toughness in comparison to EHP-FRC.
This also can be seen in Figure 4.8 as the area under the graph of load – deflection curve for
EHS-FRC is much greater than EHP-FRC. On the other hand, for HSC drop height of 200 mm
was sufficient to get a complete fracture. The plain HSC exhibits a brittle failure under all drop
heights and loading rates.
69
Test results of the impact tests are given in Table 4.9 where high strain rates were achieved using
drop weight facility. Notice that, for all composites the flexural strength increased as the height
of drop hammer was increased. In Figure 4.14 the relationship between strain rate and DIF for
UHP-FRC, EHP-FRC, EHS-FRC and HSC is shown. It is clear from this figure that, plain HSC
exhibit much higher sensitivity than fiber reinforced composites. For HSC strain rate of 2.55 s-1
with the corresponding DIF of 4.155 was recorded. It should be noted that, while HSC is
increasingly brittle under impact loading, fiber reinforced composites improve the impact
loading and only in some cases become brittle where drop height increased at 800 mm (in case of
EHP-FRC).
As it was expected UHP-FRC prisms exhibit much lower DIF under corresponding strain rates in
comparison to other concrete composites, especially plain HSC. This can be seen in Figure 4.14,
where UHP-FRC has much lower slope in DIF versus Strain rate graph rather than all other three
materials. Maximum strain rate achieved is 3.22 s-1
at corresponding DIF of 1.72. This result
confirms the low strain rate sensitivity of the UHP-FRC material.
The dynamic increase factor for EHP-FRC and EHS-FRC is relatively close to each other.
However EHP-FRC has DIF of 2.00 at lower strain rate of 1.79 s-1
in comparison to the EHS-
FRC where exhibits DIF of 1.902 under strain rate of 2.58 s-1
. In other words EHP-FRC is more
sensitive to the strain rate than UHP-FRC and HS-FRC.
DIF in concrete can also be explained by the time taken for micro crack propagation in the
matrix. In fibre reinforced composites, the fibers are capable of resisting the spread of the cracks
by bridging and as a result exhibit much better performance in comparison to plain concrete.
In the present study, among all four concrete types UHP-FRC exhibit a much better performance
under impact loading. UHP-FRC also exhibit less strain rate sensitivity than other concrete types.
Therefore, UHP-FRC is the recommended material for structures subjected to impact or blast
loading.
70
Chapter 5
CONCLUSION
This investigation was intended to determine the strain rate sensitivity of fiber reinforced ultra-
high performance concrete and plain high strength concrete. The experimental program is
designed for both compressive and flexural strength test under quasi-static and dynamic loading.
For the quasi-static tests MTS machine is used to achieve low strain rates, while for reaching
higher strain rates a dynamic drop hammer weight facility was designed and constructed at
Ryerson University. The results are used to evaluate dynamic increase factor to determine the
strain rate sensitivity of each mix. The study of strain rate sensitivity is required to determine the
performance of the concrete under dynamic loading such as, impact and blast loading.
5.1 Research Findings
For the compressive strength tests MTS machine is used for both quasi-static and dynamic
region. Following are the major findings of compressive strength tests in quasi-static and
dynamic region:
1. In the compressive strength tests as the strain rate is increased from quasi-static to dynamic
range, the compressive strength is increased significantly.
2. The compressive strength exhibits higher strain rate sensitivity in HSC compared to EHP-
FRC and EHS-FRC, especially in the dynamic range.
3. Both EHP-FRC and EHS-FRC exhibit much better performance under higher loading rates
rather than HSC.
4. No spalling is observed EHP-FRC and EHS-FRC even under strain rate of 0.006 s-1
. On the
other hand, HSC specimens show explosive spalling under all loading rates.
5. Although fibers bring ductility concrete material, but there are no positive effects on
compressive strength under quasi-static and higher rate loading.
71
In the flexural tensile strength tests MTS machine is used for quasi-static range while higher
strain rates in dynamic region is achieved with use of drop weight hammer facility. Major
findings in flexural tensile strength test for quasi-static and dynamic region are as follow:
1. The flexural strength DIF of plain HSC specimens is significantly greater than fiber
reinforced concrete specimens.
2. The flexural tensile strength dynamic strength enhancement for fiber reinforced concrete
found to be minimal in quasi-static region.
3. Strain hardening behavior subsists under high strain rates in both loading cases
compression and tension for EHS-FRC.
4. Quasi-static and drop hammer tests had identical failure modes for all studied concrete
classes.
5. Use of steel fiber in the concrete mix enhanced the flexural strength and impact behaviour
of concrete significantly and don not exhibit brittleness even at high drop heights.
6. UHP-FRC exhibited much lower DIF under corresponding strain rate of 3.22 s-1
, while
EHP-FRC and EHS-FRC exhibited higher DIF of 2.00 and 1.9; respectively.
The test results of this investigation show that UHP-FRC material has much lower strain rate
sensitivity. As result of its great performance under high loading rate and less sensitivity, UHP-
FRC is suggested for structures with application of impact or blast loading.
5.2 Recommendation for Future Studies
This study is expected to introduce new opportunities for graduate students at Ryerson
University to investigate further into strain rate sensitivity and impact loading of concrete
structures. Following recommendation can be made for future studies:
For more accurate result and better validation of the results, drop hammer facility can be
improved in the sense of instrumentation.
72
In order to get better statistical relationship more specimens with various fiber volume
fractions should be tested.
Strain rate sensitivity of Ultra High Performance Concrete with different fiber fraction
can be evaluated to correlate the fiber content to strain rate sensitivity.
Large-scale experiment on dynamic loading of UHPC such as, thin shells can be carried
out to find the optimum percentage of fiber content.
73
REFERENCES
[1] K. Wille, A. E. Naaman and G. J. Parra Montensinos, "Ultra-High Performance Concrete
with Compressive Strength Exceeding 150 MPa: A Simpler Way," ACI Materials Journal,
vol. 108, no. 1,, pp. 46-54, 2011.
[2] S.T. Kang, Y. Lee, Y.D. Park and J.K. Kim, "Tensile fracture properties of an Ultra High
Performance Fibre Reinforced Concrete (UHPFRC) with Steel Fibre,"Composite Structures,
vol. 92, no. 1 pp. 61-71, 2010.
[3] S. Millard, T. Molyneaux, S. Barnett and X. Gao, "Dynamic enhancemnet of blast-resistanct
ultra high performance fibre-reinforced concrete under flexural and shea loading,"
International Journal of Imapact Engineering, vol. 37, no. 4 pp. 405-413, 2010.
[4] V. Bindiganavile, N. Banthia and B. Aarup, "Impact Response of Ultra-High-Strength
Fibre-Reinforced Cement Composite," ACI Materials Journal, vol. 99, no. 6 pp. 543-548,
2002.
[5] X. Gao, T. Molyneaux, I. Patnaikunu and S. Rahman, "Dynamic Properties of fibre
reinforced and plain ultra high performance concrete," Melbourne, 2010.
[6] Y. Lei Voo, B. Nematollahi and A. B. Bin Mohamed Siad, "Application of Ultra High
Perfommance Fiber Reinforced Concrete - The Malaysia Perspective," Internation Journal
of Sustainable Construction Engineering & Technology, vol. 3, no. 1, pp. 26-44, 2012.
[7] H. Nowodworski and K. Rosiak, "Ultra-High Perfromacne Concrete with Ductility," in 2nd
Material Specialty Conference, Montreal, 2002.
[8] P. Rossi, A. Arca, E, Parant and P. Fakhri, "Bending and Compressive Behavior of a New
Cement Composite," Cement and Concrete Research, vol. 35, no. 1, pp. 27-33, 2005.
74
[9] K. Habel and P. Gavreau, "Response of ultra-high performance fiber reinforced concrete
(UHPFRC) to impact and static loading," Cement and Composite Strucutres, vol. 30, no. 10
pp. 938-946, 2008.
[10] Graybeal, H. G. Russel and B. A, "Ultra-High Performance Concrete: A State-of-the-Art
Report for the Bridge Community," Federal Highway Administration FHWA-HRT-13-060,
U.S, 2013.
[11] K. Wille. A.E. Naaman. S. El-Tawil, "Optimizing Ultra-High-Performance Fiber-
Reinforced Concrete," Concrete International, vol. 33, p. 35–41, 2011.
[12] G.B, "Material Property Characterization of Ultra-High Performance Concrete,," FHWA,
U.S. Department of Transportation, Report No. FHWA-HRT-06-103, McLean, Va, 2006.
[13] P. Acker and M. Behloul, "DUCTAL® Technology: A Large Spectrum Of Properties, A
Wide Range Of Applications," International Symposium on Ultra High Performacne
Concrete, vol. 3, pp. 11-24, 2004.
[14] A. E. Naaman, "High Performance Fiber Reinforced Cement Composites: Classification and
Application," in CBM-CI International Workshop, Pakistan, karachi, 2007.
[15] K. Habell, M. Viviani, E. Denarie and E. Bruhwiler, "Development of the Mechanical
Properties of an Ultra-High Performance Fiber Reinforced Concrete (UHPFRC)," Cement
and Cocnrete Research, vol. 36, pp. 1362-1368, 2006.
[16] E. Fehling and T. Leutbecher, "Design relevant properties of hardened Ultra High
Performance Concrete," International Symposium on Ultra High Performance
Concrete.,vol. 3, pp. 327 - 338, 2004.
[17] N. C, "Ultra Hiigh Strenght Steel Fibre Reinforced Concrete. Part 1: Basic strength
properties of compresit matrix. Part II: Structural application of Compresit.," in University
of Denmark, Denmark, 1995.
75
[18] B. Graybealm. M. Davis, "Cylinder or Cube: Strength Testing of 80 to 200 MPa," ACI
Materials Journal, vol. 105, no. 6, pp. 603-609, 2008.
[19] B. Graybeal, V. Perry, M. Royce, "Federal Highway Administration," 18 November 2010.
[Online]. Available: https://connectdot.connectsolutions.com/n134083201011. [Accessed 8
July 2014].
[20] B. Graybeal, F. Baby, "Development of a Direct Tension Test ethod for UHPFR ,”," ACI
Materials Journal, vol. 110, no. 2, 2013.
[21] B. Graybeal, "Practical Means for Determination of the Tensile Behavior of Ultra-High
Performance Concrete," Journal of ASTM International, vol. 3, no. 8, 2006.
[22] D. L. Grote, S. W. Park, M. Zhou, "Dynamic behavior of concrete at high strain rates and
pressures: I. experimental haracterization.," International Journal of Impact Engineeing,
vol. 25, no. 9, pp. 869-886, 2001.
[23] Lok.T, Zhao. P, "Impact response of steel fiber reinforced concrete using a split Hopkinson
pressure bar," Journal of Materials in Civil Engineering, vol. 16, pp. 54-59, 2004.
[24] R. Malogorzata, "The Influence of Strain Rate on the Strength of Concrete Taking into
Account Experimental Techniques," Architecture Civil Engineering Enviriomernt, vol. 3,
pp. 77-86, 2011.
[25] L. Crawford, Malvar, Javier, E. John, "Dynamic Increase Factors For Concrete," in Twenty-
Eight DDESB Seminar, Orlando, 1998.
[26] C. E.-I. d. Beton, CEB-FIP Model Code 1990, Wiltshire: Redwood Books, 1993.
[27] P. Bischoff and S. Perry, "Compressive Behaviour of Concrete at High Strain Rates,"
Materials and Structures,vol. 24, no. 6, pp. 425-450, 1991.
J. G, K. Wille and Parra-Montesinos, "Effect of beam size, casting method, and support J.
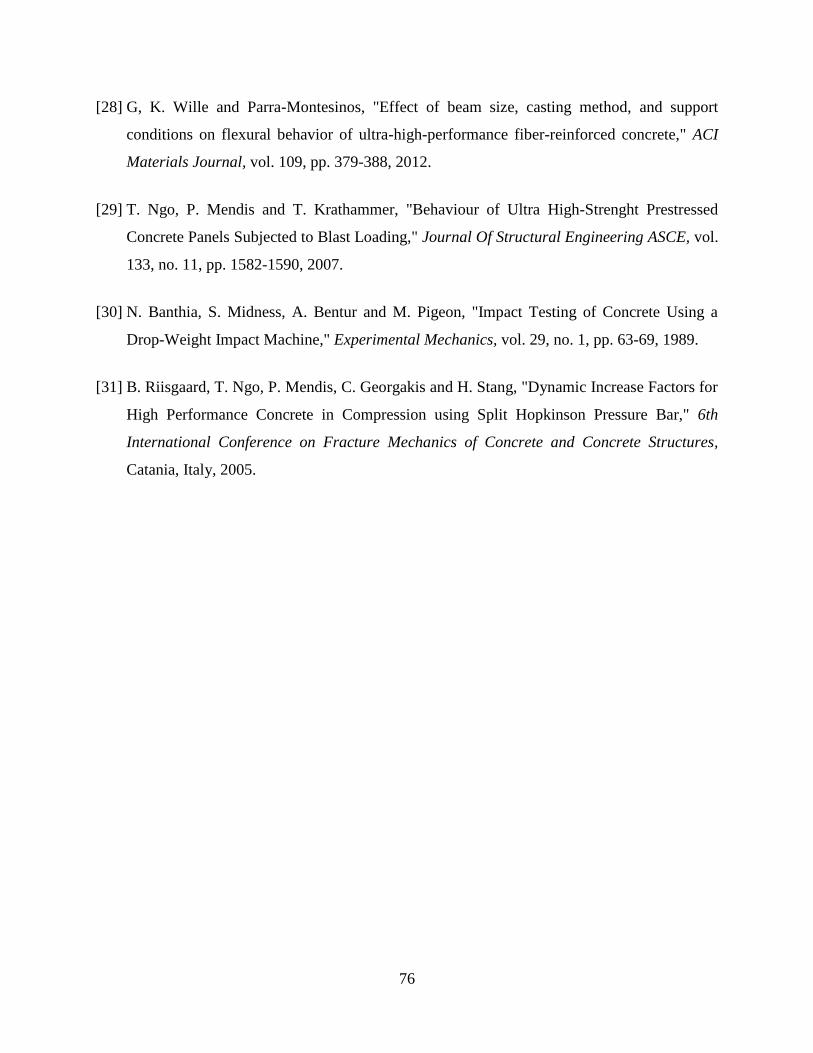
76
[28] G, K. Wille and Parra-Montesinos, "Effect of beam size, casting method, and support
conditions on flexural behavior of ultra-high-performance fiber-reinforced concrete," ACI
Materials Journal, vol. 109, pp. 379-388, 2012.
[29] T. Ngo, P. Mendis and T. Krathammer, "Behaviour of Ultra High-Strenght Prestressed
Concrete Panels Subjected to Blast Loading," Journal Of Structural Engineering ASCE, vol.
133, no. 11, pp. 1582-1590, 2007.
[30] N. Banthia, S. Midness, A. Bentur and M. Pigeon, "Impact Testing of Concrete Using a
Drop-Weight Impact Machine," Experimental Mechanics, vol. 29, no. 1, pp. 63-69, 1989.
[31] B. Riisgaard, T. Ngo, P. Mendis, C. Georgakis and H. Stang, "Dynamic Increase Factors for
High Performance Concrete in Compression using Split Hopkinson Pressure Bar," 6th
International Conference on Fracture Mechanics of Concrete and Concrete Structures,
Catania, Italy, 2005.
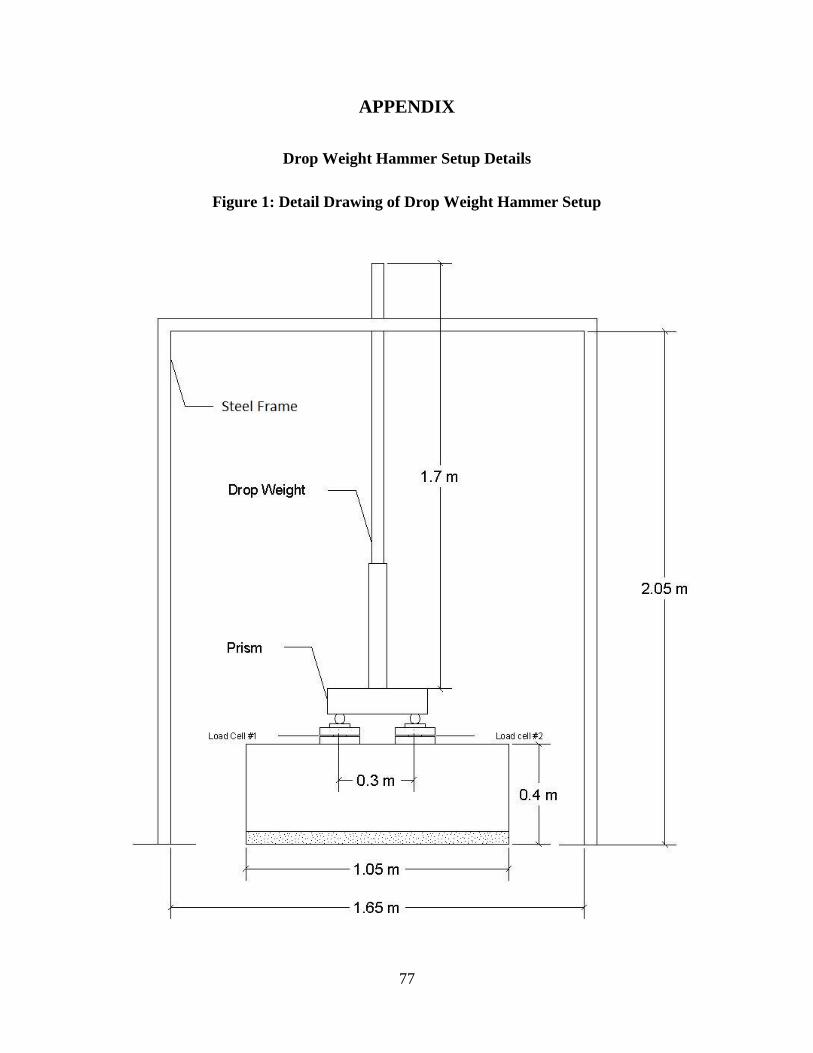
77
APPENDIX
Drop Weight Hammer Setup Details
Figure 1: Detail Drawing of Drop Weight Hammer Setup
78
Figure 2: Detail Drawing of Drop Weight Hammer Setup


![A MODEL OF ENHANCED STRAIN RATE SENSITIVITY IN ...2 A.G. Sheinerman and S.V. Bobylev metals have been suggested. Prasad and Armstrong [17] suggested that strain rate sensitivity is](https://img.pdfslide.net/doc/110x75/60bf5ee16240a414c6338d3f/a-model-of-enhanced-strain-rate-sensitivity-in-2-ag-sheinerman-and-sv-bobylev.jpg)