Embed Size (px)
Citation preview

Strategic Analysis & Reporting April 13, 2021
Washburn University Enrollment Report
Spring 2021

Washburn University Enrollment Report
Spring 2021 The purpose of the Spring 2021 Enrollment Report is to provide information and understanding of current enrollment patterns of Washburn University students. The first section provides a brief summary with comparisons to Spring 2020 of undergraduate level. The second section provides a more thorough breakdown for Spring 2021 of the WU student body in terms of headcount, registered credit hours, demographics, GPA, and hours earned, along with specific comparisons to Spring 2021. Summary tables are provided in the appendix. Summary All tables referenced in the summary section can be found in the appendix. WU headcount enrollment: Total enrolled student headcount was 5,109 for Spring 2021, which is a decline of 8.8% compared to Spring 2020 (Appendix: Table 1). WU credit hours: Total enrolled student credit hours were 55,340 for Spring of 2021, which is a decline of 9.6% from Spring 2020 (Appendix: Table 1). WU FTE: The full-time-equivalency of student headcount was 4,034 for Spring of 2021, which is a decline of 6.4% from Spring of 2020 (Appendix: Table 1). FT/PT enrollment: Of the WU student body 64.6% were enrolled as full-time students, and 35.4% were enrolled as part-time students (Appendix: Table 1). Average Credit Hour Load: On average undergraduate students took 12.2 credit hours, non-law graduate students took 6.9 credit hours, and law students took 14.1 credit hours during the spring 2021 term (Appendix: Table 1). Concurrent Enrollment Program: High school student enrollment, which is almost entirely CEP enrollment, was 616 students, which is a 10.8% increase from last spring (Appendix: Table 1). Attendance Pattern: On-campus credit hours or a mix of on-campus and on-line credit hours (47,681) comprised 86.2% of student credit hours for Spring 2021 (Appendix: Table 1) with an underlying drop of “on-campus only” student hours from fall to spring. Analysis and Analytics As an extension to the previous summary this section provides some historical framework and current trends in WU student enrollment for Spring 2021. Basic Counts As illustrated in Figure 1, Washburn’s spring headcount enrollment has continued to decline since 2012. Prior to Spring 2021, the decline was largest in 2014 with a 4.17% decrease and smallest in 2018 with a

0.23% decline in student enrollment from the previous spring. Spring 2021 had an 8.8% decline from Spring 2020. Figure 1: Washburn Spring 2021 Headcount Enrollment
WU student credit hour enrollment has fluctuated over the past ten spring terms, with Spring 2021 as the minimum. However, the year to year decline was next largest in Spring 2014 with a 5.3% decrease, where Spring 2021 had a 9.6% decrease in student credit hour enrollment. Figure 2: Washburn Spring 2021 Credit Hour Enrollment
6816 68016648
6371 62636062 6008 5994 5894
5599
5109
6421 63486208
58525707
5573 5457 53985267
5083
4492
4000
4500
5000
5500
6000
6500
7000
2011 2012 2013 2014 2015 2016 2017 2018 2019 2020 2021
Total Headcount Total Headcount Excluding HS Students
73333 7406172585
6876966885
64747 65346 65853
63760
61207
55340
71845 7238971000
66797
64675
62639 62958 63450
61079
58762
5274350000
55000
60000
65000
70000
75000
2011 2012 2013 2014 2015 2016 2017 2018 2019 2020 2021
Total SCH Total SCH Excluding HS Students

Undergraduate Enrollment Total undergraduate enrollment has followed the same declining trend as overall enrollment. Undergraduate enrollment is comprised of primarily of continuing students, 90.4% of degree seeking Undergraduates, see Appendix: Table 5 The remaining components of undergraduate enrollment includes 12.1% of high school student enrollment in WU’s concurrent enrollment program for Spring 2021, which reflects an 10.8% increase year over year, and less than 1% of non-CEP and non-degree-seeking students.
Washburn Institute of Technology
Enrollment by student type and student credit hours by department for spring 2021 with comparisons to Fall 2020 and to Spring 202 can be found in Appendix Tables 11-14.
Appendix to follow.

Term Count % of Term Term Count % of Term N %
Total Headcount 5,109 5,599 -490 -8.8%Total Student Credit Hours 55,340 61,207 -5,867 -9.6%Total FTE 4,034 4,309 -275 -6.4%
Headcount by Student Level & ClassificationFreshmen 585 11.5% 737 13.2% -152 -20.6%Sophomores 724 14.2% 803 14.3% -79 -9.8%Juniors 835 16.3% 962 17.2% -127 -13.2%Seniors 1,363 26.7% 1,481 26.5% -118 -8.0%Postbaccalaureate undergraduate 157 3.1% 168 3.0% -11 -6.5%
Subtotal undergraduate 3,664 71.7% 4,151 74.1% -487 -11.7%Master's 394 7.7% 408 7.3% -14 -3.4%Doctorate 87 1.7% 86 1.5% 1 1.2%
Subtotal graduate 481 9.4% 494 8.8% -13 -2.6%Law 316 6.2% 308 5.5% 8 2.6%
Subtotal degree-seeking 4,461 87.3% 4,953 88.5% -492 -9.9%High School 616 12.1% 556 9.9% 60 10.8%Other non-degree seeking 32 0.6% 90 1.6% -58 -64.4%
Subtotal non-degree seeking 648 12.7% 646 11.5% 2 0.3%Total Headcount 5,109 100.0% 5,599 100.0% -490 -8.8%
Headcount by Gender
Male 1,911 37.4% 2,150 38.4% -239 -11.1%Female 3,198 62.6% 3,449 61.6% -251 -7.3%
Total Headcount 5,109 100.0% 5,599 100.0% -490 -8.8%
Headcount by Resident/NonresidentKansas resident 4,685 91.7% 4,790 85.6% -105 -2.2%Nonresident 424 8.3% 809 14.4% -385 -47.6%
Total Headcount 5,109 100.0% 5,599 100.0% -490 -8.8%
Headcount by Full-time/Part-timeFull-time 3,301 64.6% 3,655 65.3% -354 -9.7%Part-time 1,808 35.4% 1,944 34.7% -136 -7.0%
Total Headcount 5,109 100.0% 5,599 100.0% -490 -8.8%
60 & Over Tuition-free Audit Program[1]
Headcount 0 217 -217 -100.0%Student Credit Hours 0 739 -739 -100.0%
Credit Hour based on Attendance PatternOn Campus Only 16,950 30.6% 24,802 40.5% -7,852 -31.7%Online Only 5,007 9.0% 5,022 8.2% -15 -0.3%Off Campus Only 2,652 4.8% 2,493 4.1% 159 6.4%Combination 30,731 55.5% 28,890 47.2% 1,841 6.4%
Total Credit Hours 55,340 100.0% 61,207 100.0% -5,867 -9.6%
Average Credit Hour LoadUndergraduate 12.2 12.2Graduate 6.9 7.1Law 14.1 14.2Non-degree seeking 4.3 4.4
Source: Enrollment Census Files Spring 2020, Spring 2021.
Table 1Washburn UniversityEnrollment Summary
Spring 2021 Compared to Spring 2020
Spring 2021 Spring 2020 Change

N %Term Count % of Term Term Count % of Term N %
Total Headcount 5,109 5,880 -771 -13.1%Total Student Credit Hours 55,340 63,926 -8,586 -13.4%Total FTE 4,034 4,394 -360 -8.2%
Headcount by Student Level & ClassificationFreshmen 585 11.5% 1007 17.1% -422 -41.9%Sophomores 724 14.2% 798 13.6% -74 -9.3%Juniors 835 16.3% 858 14.6% -23 -2.7%Seniors 1,363 26.7% 1,379 23.5% -16 -1.2%Postbaccalaureate undergraduate 157 3.1% 163 2.8% -6 -3.7%
Subtotal undergraduate 3,664 71.7% 4,205 71.5% -541 -12.9%Master's 394 7.7% 406 6.9% -12 -3.0%Doctorate 87 1.7% 94 1.6% -7 -7.4%
Subtotal graduate 481 9.4% 500 8.5% -19 -3.8%Law 316 6.2% 316 5.4% 0 0.0%
Subtotal degree-seeking 4,461 87.3% 5,021 85.4% -560 -11.2%High School 616 12.1% 833 14.2% -217 -26.1%Other non-degree seeking 32 0.6% 26 0.4% 6 23.1%
Subtotal non-degree seeking 648 12.7% 859 14.6% -211 -24.6%Total Headcount 5,109 100.0% 5,880 100.0% -771 -13.1%
Headcount by GenderMale 1,911 37.4% 2,220 37.8% -309 -13.9%Female 3,198 62.6% 3,660 62.2% -462 -12.6%Total Headcount 5,109 100.0% 5,880 100.0% -771 -13.1%
Headcount by Resident/NonresidentKansas resident 4,685 91.7% 5,056 86.0% -371 -7.3%Nonresident 424 8.3% 824 14.0% -400 -48.5%Total Headcount 5,109 100.0% 5,880 100.0% -771 -13.1%
Headcount by Full-time/Part-timeFull-time 3,301 64.6% 3,795 64.5% -494 -13.0%Part-time 1,808 35.4% 2,085 35.5% -277 -13.3%Total Headcount 5,109 100.0% 5,880 100.0% -771 -13.1%
60 & Over Tuition-free Audit ProgramHeadcount 0 0 0 0.0%Student Credit Hours 0 0 0 0.0%
Credit Hour based on Attendance PatternOn Campus Only 16,950 30.6% 23,923 37.4% -6,973 -29.1%Online Only 5,007 9.0% 6,108 9.6% -1,101 -18.0%Off Campus Only 2,652 4.8% 3,842 6.0% -1,190 -31.0%Combination 30,731 55.5% 30,053 47.0% 679 2.3%
Total Credit Hours 55,340 100.0% 63,926 100.0% -8,586 -13.4%
Average Credit Hour LoadUndergraduate 12.2 12.3Graduate 6.9 7.2Law 14.1 13.8Non-degree seeking 4.3 4.7
Spring 2021 Fall 2020Change
Table 2Washburn UniversityEnrollment Summary
Spring 2021 Compared to Fall 2020

Graph 1.1 Graph 1.2Enrollment by Student Classification Enrollment by Full-time/Part-time Status
Graph 1.3New Undergraduate Student Enrollment
Source: Enrollment census file
Graph 1Washburn University
Headcount EnrollmentSpring 2021
Freshmen58512%
Sophomores72414%
Juniors83516%
Seniors1,36327%
Postbac1573%
Graduate4819%
Law3166%
High School61612%
Non-degree seeking
321%
Freshmen Sophomores Juniors
Seniors Postbac Graduate
Law High School Non-degree seeking
010002000300040005000600070008000
2011 2012 2013 2014 2015 2016 2017 2018 2019 2020 2021
Full-time Part-time Total
0
50
100
150
200
250
300
2011 2012 2013 2014 2015 2016 2017 2018 2019 2020 2021
Transfer First-time Freshman

Spring Full-time1 % Part-time % Total % Student %
Semester Headcount Change Headcount Change Headcount Change Credit Hours Change
1971 NA NA 4,502
1972 NA NA 4,904 8.9%
1973 NA NA 4,936 0.7%
1974 NA NA 4,887 -1.0%
1975 NA NA 4,948 1.2%
1976 NA NA 5,477 10.7%
1977 NA NA 5,232 -4.5%
1978 NA NA 5,415 3.5%
1979 NA NA 5,309 -2.0%
1980 NA NA 5,373 1.2%
1981 NA NA 5,817 8.3%
1982 3,060 3,013 6,073 4.4% 58,458
1983 3,190 4.2% 3,340 10.9% 6,530 7.5% 60,806 4.0%
1984 3,405 6.7% 3,352 0.4% 6,757 3.5% 64,070 5.4%
1985 3,314 -2.7% 3,394 1.3% 6,708 -0.7% 63,271 -1.2%
1986 3,213 -3.0% 3,243 -4.4% 6,456 -3.8% 61,629 -2.6%
1987 3,186 -0.8% 3,176 -2.1% 6,362 -1.5% 61,051 -0.9%
1988 3,177 -0.3% 3,157 -0.6% 6,334 -0.4% 60,756 -0.5%
1989 3,188 0.3% 2,974 -5.8% 6,162 -2.7% 59,601 -1.9%
1990 3,229 1.3% 3,097 4.1% 6,326 2.7% 61,404 3.0%
1991 3,241 0.4% 2,910 -6.0% 6,151 -2.8% 60,729 -1.1%
1992 3,413 5.3% 3,069 5.5% 6,482 5.4% 63,409 4.4%
1993 3,375 -1.1% 3,124 1.8% 6,499 0.3% 63,242 -0.3%
1994 3,389 0.4% 3,019 -3.4% 6,408 -1.4% 62,917 -0.5%
1995 3,176 -6.3% 2,923 -3.2% 6,099 -4.8% 59,720 -5.1%
1996 3,186 0.3% 2,895 -1.0% 6,081 -0.3% 59,693 0.0%
1997 3,295 3.4% 2,828 -2.3% 6,123 0.7% 60,911 2.0%
1998 3,214 -2.5% 2,804 -0.8% 6,018 -1.7% 59,431 -2.4%
1999 3,170 -1.4% 2,687 -4.2% 5,857 -2.7% 58,695 -1.2%
2000 3,187 0.5% 2,491 -7.3% 5,678 -3.1% 57,564 -1.9%
2001 3,208 0.7% 2,461 -1.2% 5,669 -0.2% 58,094 0.9%
2002 3,436 7.1% 2,504 1.7% 5,940 4.8% 61,906 6.6%
2003 3,867 12.5% 2,546 1.7% 6,413 8.0% 68,462 10.6%
2004 4,164 7.7% 2,583 1.5% 6,747 5.2% 73,165 6.9%
2005 4,342 4.3% 2,514 -2.7% 6,856 1.6% 74,478 1.8%
2006 4,394 1.2% 2,466 -1.9% 6,860 0.1% 75,204 1.0%
2007 4,310 -1.9% 2,324 -5.8% 6,634 -3.3% 73,070 -2.8%
2008 4,206 -2.4% 2,309 -0.6% 6,515 -1.8% 71,150 -2.6%
2009 3,980 -5.4% 2,230 -3.4% 6,210 -4.7% 67,716 -4.8%
2010 4,119 3.5% 2,410 8.1% 6,529 5.1% 70,714 4.4%
2011 4,259 3.4% 2,557 6.1% 6,816 4.4% 73,333 3.7%
2012 4,413 3.6% 2,388 -6.6% 6,801 -0.2% 74,061 1.0%
2013 4,332 -1.8% 2,316 -3.0% 6,648 -2.2% 72,585 -2.0%
2014 4,061 -6.3% 2,310 -0.3% 6,371 -4.2% 68,769 -5.3%
2015 3,949 -2.8% 2,314 0.2% 6,263 -1.7% 66,885 -2.7%
2016 3,856 -2.4% 2,206 -4.7% 6,062 -3.2% 64,747 -3.2%
2017 3,929 1.9% 2,079 -5.8% 6,008 -0.9% 65,346 0.9%
2018 3,971 1.1% 2,023 -2.7% 5,994 -0.2% 65,853 0.8%
2019 3,810 -4.1% 2,084 3.0% 5,894 -1.7% 63,760 -3.2%
2020 3,655 -4.1% 1,944 -6.7% 5,599 -5.0% 61,207 -4.0%
2021 3,301 -9.7% 1,808 -7.0% 5,109 -8.8% 55,340 -9.6%
[1] Full-time status is based on enrollment of 12 or more hours for undergraduate, 9 or more for graduate and law. Prior to 2006-07, full-time
Source: Enrollment Census Files
Table 3Headcount Enrollment and Student Credit Hours
Spring 1970 to Spring 2021

Spring 2016Freshmen 523 13.6% 112 5.1% 635 10.5%Sophomores 720 18.7% 153 6.9% 873 14.4%Juniors 771 20.0% 269 12.2% 1,040 17.2%Seniors 1,188 30.8% 565 25.6% 1,753 28.9%Postbaccalaureate 83 2.2% 99 4.5% 182 3.0%
Subtotal undergraduate 3,285 85.2% 1,198 54.3% 4,483 74.0%Graduate 213 5.5% 358 16.2% 571 9.4%Law 296 7.7% 5 0.2% 301 5.0%Non-degree seeking 62 1.6% 645 29.2% 707 11.7%
Total 3,856 100.0% 2,206 100.0% 6,062 100.0%Percent Full-time/Part-time 63.6% 36.4%
Spring 2017Freshmen 575 14.6% 104 5.0% 679 11.3%Sophomores 724 18.4% 158 7.6% 882 14.7%Juniors 868 22.1% 225 10.8% 1,093 18.2%Seniors 1,100 28.0% 543 26.1% 1,643 27.3%Postbaccalaureate 83 2.1% 87 4.2% 170 2.8%
Subtotal undergraduate 3,350 85.3% 1,117 53.7% 4,467 74.4%Graduate 228 5.8% 305 14.7% 533 8.9%Law 299 7.6% 5 0.2% 304 5.1%Non-degree seeking 52 1.3% 652 31.4% 704 11.7%
Total 3,929 100.0% 2,079 100.0% 6,008 100.0%Percent Full-time/Part-time 65.4% 34.6%
Spring 2018Freshmen 522 13.1% 95 4.7% 617 10.3%Sophomores 767 19.3% 165 8.2% 932 15.5%Juniors 905 22.8% 220 10.9% 1,125 18.8%Seniors 1,156 29.1% 471 23.3% 1,627 27.1%Postbaccalaureate 80 2.0% 89 4.4% 169 2.8%
Subtotal undergraduate 3,430 86.4% 1,040 51.4% 4,470 74.6%Graduate 198 5.0% 293 14.5% 491 8.2%Law 301 7.6% 4 0.2% 305 5.1%Non-degree seeking 42 1.1% 686 33.9% 728 12.1%
Total 3,971 100.0% 2,023 100.0% 5,994 100.0%Percent Full-time/Part-time 66.2% 33.8%
Spring 2019Freshmen 630 16.5% 129 6.2% 759 12.9%Sophomores 724 19.0% 147 7.1% 871 14.8%Juniors 766 20.1% 198 9.5% 964 16.4%Seniors 1,095 28.7% 474 22.7% 1,569 26.6%Postbaccalaureate 75 2.0% 88 4.2% 163 2.8%
Subtotal undergraduate 3,290 86.4% 1,036 49.7% 4,326 73.4%Graduate 189 5.0% 329 15.8% 518 8.8%Law 300 7.9% 6 0.3% 306 5.2%Non-degree seeking 31 0.8% 713 34.2% 744 12.6%
Total 3,810 100.0% 2,084 100.0% 5,894 100.0%Percent Full-time/Part-time 64.6% 35.4%
Spring 2020Freshmen 586 16.0% 151 7.8% 737 13.2%Sophomores 657 18.0% 146 7.5% 803 14.3%Juniors 789 21.6% 173 8.9% 962 17.2%Seniors 1,039 28.4% 442 22.7% 1,481 26.5%Postbaccalaureate 87 2.4% 81 4.2% 168 3.0% Subtotal undergraduate 3,158 86.4% 993 51.1% 4,151 74.1%Graduate 166 4.5% 328 16.9% 494 8.8%Law 304 8.3% 4 0.2% 308 5.5%Non-degree seeking 27 0.7% 619 31.8% 646 11.5%Total 3,655 100.0% 1,944 100.0% 5,599 100.0%Percent Full-time/Part-time 65.3% 34.7%
Spring 2021Freshmen 490 14.8% 95 5.3% 585 11.5%Sophomores 580 17.6% 144 8.0% 724 14.2%Juniors 670 20.3% 165 9.1% 835 16.3%Seniors 987 29.9% 376 20.8% 1,363 26.7%Postbaccalaureate 88 2.7% 69 3.8% 157 3.1% Subtotal undergraduate 2,815 85.3% 849 47.0% 3,664 71.7%Graduate 159 4.8% 322 17.8% 481 9.4%Law 313 9.5% 3 0.2% 316 6.2%Non-degree seeking 14 0.4% 634 35.1% 648 12.7%Total 3,301 100.0% 1,808 100.0% 5,109 100.0%Percent Full-time/Part-time 64.6% 35.4%
Source: Enrollment Census Files
Table 4Headcount by Student Classification and Full-time/Part-time Status
Spring 2016 to Spring 2021
Full-time Part-time Total
[1] Full-time status is based on enrollment of 12 or more hours for undergraduate and 9 or more for graduate and law.

Spring 2018 Spring 2019
Student Type HeadcountPercent of
Total HeadcountPercent of
Total HeadcountPercent of
Total HeadcountPercent of
Total HeadcountPercent of
Total HeadcountPercent of
TotalFirst-time Freshmen 94 2.1% 68 2.1% 41 0.9% 57 1.3% 30 0.7% 55 1.5%Transfers 162 3.6% 182 3.6% 206 4.6% 187 4.3% 195 4.7% 151 4.1%
Subtotal New 256 5.7% 250 5.7% 247 5.5% 244 5.6% 225 5.4% 206 5.6%Returning[1] 213 4.8% 147 4.8% 156 3.5% 159 3.7% 161 3.9% 147 4.0%Continuing 4,014 89.5% 4,070 89.5% 4,067 91.0% 3,925 90.7% 3,746 90.7% 3,311 90.4%Total 4,483 100.0% 4,467 100.0% 4,470 100.0% 4,328 100.0% 4,132 100.0% 3,664 100.0%
[1] Returning students are students who are re-enrolling at Washburn after stopping out for one or more terms.
Source: Enrollment Census Files.
Spring 2020
Table 5Undergraduate Enrollment by Student Type
Spring 2016 to Spring 2021
Spring 2016 Spring 2017 Spring 2021
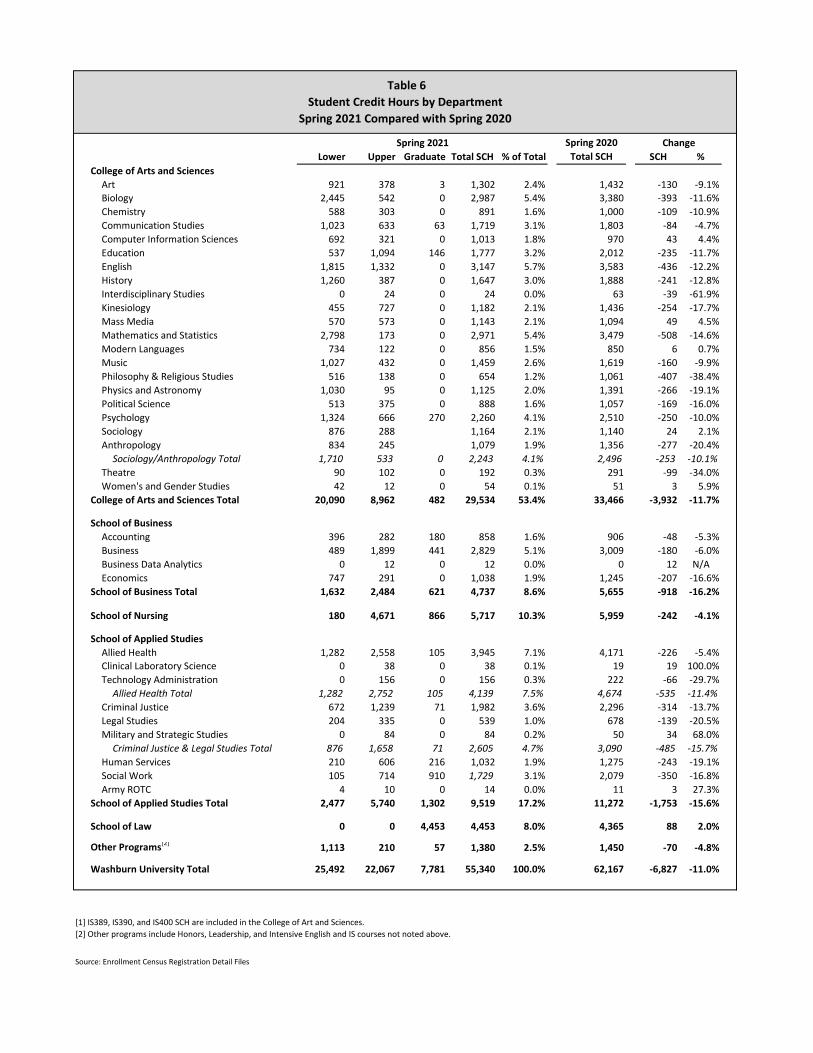
Lower Upper Graduate Total SCH % of Total SCH %College of Arts and Sciences
Art 921 378 3 1,302 2.4% 1,432 -130 -9.1%Biology 2,445 542 0 2,987 5.4% 3,380 -393 -11.6%Chemistry 588 303 0 891 1.6% 1,000 -109 -10.9%Communication Studies 1,023 633 63 1,719 3.1% 1,803 -84 -4.7%Computer Information Sciences 692 321 0 1,013 1.8% 970 43 4.4%Education 537 1,094 146 1,777 3.2% 2,012 -235 -11.7%English 1,815 1,332 0 3,147 5.7% 3,583 -436 -12.2%History 1,260 387 0 1,647 3.0% 1,888 -241 -12.8%Interdisciplinary Studies 0 24 0 24 0.0% 63 -39 -61.9%Kinesiology 455 727 0 1,182 2.1% 1,436 -254 -17.7%Mass Media 570 573 0 1,143 2.1% 1,094 49 4.5%Mathematics and Statistics 2,798 173 0 2,971 5.4% 3,479 -508 -14.6%Modern Languages 734 122 0 856 1.5% 850 6 0.7%Music 1,027 432 0 1,459 2.6% 1,619 -160 -9.9%Philosophy & Religious Studies 516 138 0 654 1.2% 1,061 -407 -38.4%Physics and Astronomy 1,030 95 0 1,125 2.0% 1,391 -266 -19.1%Political Science 513 375 0 888 1.6% 1,057 -169 -16.0%Psychology 1,324 666 270 2,260 4.1% 2,510 -250 -10.0%Sociology 876 288 1,164 2.1% 1,140 24 2.1%Anthropology 834 245 1,079 1.9% 1,356 -277 -20.4%
Sociology/Anthropology Total 1,710 533 0 2,243 4.1% 2,496 -253 -10.1%Theatre 90 102 0 192 0.3% 291 -99 -34.0%Women's and Gender Studies 42 12 0 54 0.1% 51 3 5.9%
College of Arts and Sciences Total 20,090 8,962 482 29,534 53.4% 33,466 -3,932 -11.7%
School of BusinessAccounting 396 282 180 858 1.6% 906 -48 -5.3%Business 489 1,899 441 2,829 5.1% 3,009 -180 -6.0%Business Data Analytics 0 12 0 12 0.0% 0 12 N/AEconomics 747 291 0 1,038 1.9% 1,245 -207 -16.6%
School of Business Total 1,632 2,484 621 4,737 8.6% 5,655 -918 -16.2%
School of Nursing 180 4,671 866 5,717 10.3% 5,959 -242 -4.1%
School of Applied StudiesAllied Health 1,282 2,558 105 3,945 7.1% 4,171 -226 -5.4%Clinical Laboratory Science 0 38 0 38 0.1% 19 19 100.0%Technology Administration 0 156 0 156 0.3% 222 -66 -29.7%
Allied Health Total 1,282 2,752 105 4,139 7.5% 4,674 -535 -11.4%Criminal Justice 672 1,239 71 1,982 3.6% 2,296 -314 -13.7%Legal Studies 204 335 0 539 1.0% 678 -139 -20.5%Military and Strategic Studies 0 84 0 84 0.2% 50 34 68.0%
Criminal Justice & Legal Studies Total 876 1,658 71 2,605 4.7% 3,090 -485 -15.7%Human Services 210 606 216 1,032 1.9% 1,275 -243 -19.1%Social Work 105 714 910 1,729 3.1% 2,079 -350 -16.8%Army ROTC 4 10 0 14 0.0% 11 3 27.3%
School of Applied Studies Total 2,477 5,740 1,302 9,519 17.2% 11,272 -1,753 -15.6%
School of Law 0 0 4,453 4,453 8.0% 4,365 88 2.0%
Other Programs[2] 1,113 210 57 1,380 2.5% 1,450 -70 -4.8%
Washburn University Total 25,492 22,067 7,781 55,340 100.0% 62,167 -6,827 -11.0%
Source: Enrollment Census Registration Detail Files
[2] Other programs include Honors, Leadership, and Intensive English and IS courses not noted above.
Table 6Student Credit Hours by Department
Spring 2021 Compared with Spring 2020
Spring 2021 ChangeSpring 2020 Total SCH
[1] IS389, IS390, and IS400 SCH are included in the College of Art and Sciences.

Graph 2.1 Graph 2.2Student Credit Hours by College/School Student Credit Hours by Division
Graph 2Washburn UniversityStudent Credit Hours
Spring 2021
Source: Enrollment census file
Arts and Sciences29,53453.4%
Applied Studies
951917.2%
Business47378.6%
Law44538.0%
Nursing5717
10.3%
Other13802.5%
Arts and Sciences Applied Studies Business
Law Nursing Other
Lower2549246.1%
Upper2206739.9%
Grad33286.0%
Law44538.0%
Lower Upper Grad Law
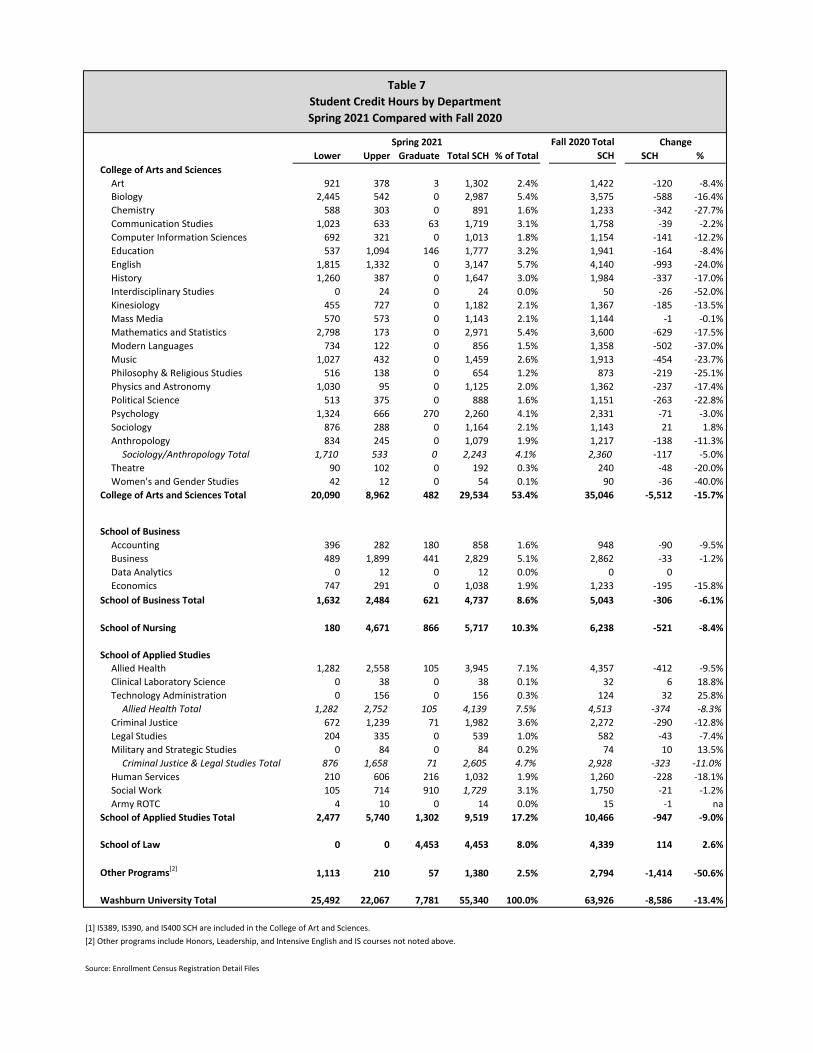
Lower Upper Graduate Total SCH % of Total SCH %College of Arts and Sciences
Art 921 378 3 1,302 2.4% 1,422 -120 -8.4%Biology 2,445 542 0 2,987 5.4% 3,575 -588 -16.4%Chemistry 588 303 0 891 1.6% 1,233 -342 -27.7%Communication Studies 1,023 633 63 1,719 3.1% 1,758 -39 -2.2%Computer Information Sciences 692 321 0 1,013 1.8% 1,154 -141 -12.2%Education 537 1,094 146 1,777 3.2% 1,941 -164 -8.4%English 1,815 1,332 0 3,147 5.7% 4,140 -993 -24.0%History 1,260 387 0 1,647 3.0% 1,984 -337 -17.0%Interdisciplinary Studies 0 24 0 24 0.0% 50 -26 -52.0%Kinesiology 455 727 0 1,182 2.1% 1,367 -185 -13.5%Mass Media 570 573 0 1,143 2.1% 1,144 -1 -0.1%Mathematics and Statistics 2,798 173 0 2,971 5.4% 3,600 -629 -17.5%Modern Languages 734 122 0 856 1.5% 1,358 -502 -37.0%Music 1,027 432 0 1,459 2.6% 1,913 -454 -23.7%Philosophy & Religious Studies 516 138 0 654 1.2% 873 -219 -25.1%Physics and Astronomy 1,030 95 0 1,125 2.0% 1,362 -237 -17.4%Political Science 513 375 0 888 1.6% 1,151 -263 -22.8%Psychology 1,324 666 270 2,260 4.1% 2,331 -71 -3.0%Sociology 876 288 0 1,164 2.1% 1,143 21 1.8%Anthropology 834 245 0 1,079 1.9% 1,217 -138 -11.3%
Sociology/Anthropology Total 1,710 533 0 2,243 4.1% 2,360 -117 -5.0%Theatre 90 102 0 192 0.3% 240 -48 -20.0%Women's and Gender Studies 42 12 0 54 0.1% 90 -36 -40.0%
College of Arts and Sciences Total 20,090 8,962 482 29,534 53.4% 35,046 -5,512 -15.7%
School of BusinessAccounting 396 282 180 858 1.6% 948 -90 -9.5%Business 489 1,899 441 2,829 5.1% 2,862 -33 -1.2%Data Analytics 0 12 0 12 0.0% 0 0Economics 747 291 0 1,038 1.9% 1,233 -195 -15.8%
School of Business Total 1,632 2,484 621 4,737 8.6% 5,043 -306 -6.1%
School of Nursing 180 4,671 866 5,717 10.3% 6,238 -521 -8.4%
School of Applied StudiesAllied Health 1,282 2,558 105 3,945 7.1% 4,357 -412 -9.5%Clinical Laboratory Science 0 38 0 38 0.1% 32 6 18.8%Technology Administration 0 156 0 156 0.3% 124 32 25.8%
Allied Health Total 1,282 2,752 105 4,139 7.5% 4,513 -374 -8.3%Criminal Justice 672 1,239 71 1,982 3.6% 2,272 -290 -12.8%Legal Studies 204 335 0 539 1.0% 582 -43 -7.4%Military and Strategic Studies 0 84 0 84 0.2% 74 10 13.5%
Criminal Justice & Legal Studies Total 876 1,658 71 2,605 4.7% 2,928 -323 -11.0%Human Services 210 606 216 1,032 1.9% 1,260 -228 -18.1%Social Work 105 714 910 1,729 3.1% 1,750 -21 -1.2%Army ROTC 4 10 0 14 0.0% 15 -1 na
School of Applied Studies Total 2,477 5,740 1,302 9,519 17.2% 10,466 -947 -9.0%
School of Law 0 0 4,453 4,453 8.0% 4,339 114 2.6%
Other Programs[2] 1,113 210 57 1,380 2.5% 2,794 -1,414 -50.6%
Washburn University Total 25,492 22,067 7,781 55,340 100.0% 63,926 -8,586 -13.4%
[1] IS389, IS390, and IS400 SCH are included in the College of Art and Sciences. [2] Other programs include Honors, Leadership, and Intensive English and IS courses not noted above.
Source: Enrollment Census Registration Detail Files
Table 7Student Credit Hours by DepartmentSpring 2021 Compared with Fall 2020
Spring 2021 Fall 2020 Total SCH
Change

Enrolled Credit Hours Undergraduate Graduate Law Non-degree seeking0 1 0 0 11 6 3 1 12 9 10 0 173 133 67 0 4224 29 34 0 05 10 61 0 256 260 100 1 1017 50 17 1 08 43 28 0 25
8.5 0 2 0 09 217 74 4 28
9.5 0 6 0 010 58 3 9 011 39 15 24 812 1,039 45 23 913 286 0 34 214 281 0 26 015 774 15 146 216 263 0 33 017 73 0 8 018 75 1 2 119 15 0 2 020 3 0 2 021 5 0 0 022 1 0 0 0
Total 3,670 481 316 642Average Credit Hour Load 12.2 6.9 14.1 4.3
Table 8Distribution of Hours Enrolled by Student Level
Spring 2021

AllFall 2020 Persisted to Persistence Cum Cum Cum Cum
Student Classification2 Class1 Spring 2021 Rate GPA3 N GPA N GPA N GPA
Freshmen 1,007 754 74.9% 3.00 686 3.01 68 2.88 65 1.63Sophomores 795 691 86.9% 3.17 599 3.23 92 2.83 45 2.62Juniors 851 753 88.5% 3.19 630 3.24 123 2.95 43 2.50Seniors 1,094 981 89.7% 3.27 759 3.31 222 3.12 74 2.86Post-baccalaureate undergraduate 147 125 85.0% 3.40 71 3.47 54 3.31 18 3.32 Subtotal undergraduate 3,894 3,304 84.8% 3.21 2,745 3.25 559 3.02 245 2.59Master's 389 336 86.4% 3.80 128 3.82 208 3.78 47 3.57Doctorate 90 87 96.7% 3.77 25 3.78 62 3.76 3 2.95Law 306 295 96.4% 2.90 295 2.90 6 3.12 Subtotal degree-seeking 4,679 4,022 86.0% 3.42 3,193 3.44 829 3.52 301 3.06Non-degree seeking 859 485 56.5% 1.76 21 3.38 464 1.69 373 1.60Total 5,538 4,507 81.4% 3.14 3,214 3.41 1,293 2.60 674 2.33
AllFall 2020 Persisted to Persistence Cum Cum Cum Cum
First-time Freshmen Cohort Spring 2021 Rate GPA N GPA N GPA N GPADirect from high school 609 490 80.5% 3.16 441 3.25 48 2.36 97 1.63Not direct from high school 51 33 64.7% 2.76 23 2.84 9 2.53 17 1.26Total first-time freshmen 660 523 79.2% 2.96 464 3.05 57 2.45 114 1.45
IPEDS Categories for ReportingFirst-time, full-time 626 505 80.7%First-time, part-time 34 18 52.9%
Regular Admission 541 452 83.5%Admission by Exception 57 40 70.2%Ignite 23 21 91.3%
Fall 2020 Persisted to Persistence CumCohort Spring 2021 Rate N GPA Good
First-time Freshmen 660 523 79.2% 114 1.57 48Live on Campus 574 511 89.0% 63 1.72 26WU 101 Enrollees 691 541 78.3% 150 1.58 54Admissions Scholarship Recipients 1,144 1,098 96.0% 46 2.73 28Athletes 393 378 96.2% 15 2.32 9
[4] WU 101 Enrollees does not include HN 101 enrollees
Source: Fall 2020 and Spring 2021 Enrollment Census Files, Fall 2020 EOT Enrollment File, Fall 2020 Degrees File.
Table 9Persistence
Cumulative GPA by Full-time and Part-time StatusFall 2020 to Spring 2021
Persisted Not PersitedFull-time Part-time
Persisted Not PersitedFull-time Part-time
[1] Fall 2020 enrollment of has been adjusted to allow for graduates/awards in Fall 2020. [2] Students retained in Spring 2021 are reported according to their student level in Fall 2020.[3] Grade point averages are calculated using Fall 2020 end-of-term grades.
Academic StandingNot PersistedPersisted
CumGPA Other3.133.253.003.433.27
267113
4 2
65Unknown
241125
5

SemestersFirst-time Freshmen Undergraduate1 Graduate2 Law Overall
Fall 2011 to Spring 2012 83.0% 85.3% 84.8% 97.7% 83.5%Fall 2012 to Spring 2013 83.6% 85.9% 85.7% 97.2% 84.3%Fall 2013 to Spring 2014 84.1% 86.1% 87.9% 97.5% 84.1%Fall 2014 to Spring 2015 84.3% 86.5% 90.0% 98.7% 84.8%Fall 2015 to Spring 2016 85.6% 86.4% 86.8% 97.9% 83.6%Fall 2016 to Spring 2017 87.8% 86.1% 90.3% 98.2% 83.8%Fall 2017 to Spring 2018 83.9% 86.7% 89.5% 97.9% 82.6%Fall 2018 to Spring 2019 86.7% 91.4% 91.0% 95.1% 88.5%Fall 2019 to Spring 20203 85.4% 87.0% 91.8% 94.4% 87.9%Fall 2020 to Spring 2021 79.2% 84.8% 88.3% 96.4% 86.0%
Ten-Year Average Fall-to-Spring 84.9% 86.8% 88.7% 97.2% 84.8%
[1] The Undergraudate category includes post-baccalaureate students.[2] Beginning with Fall 2013 to Spring 2014 Graduate retention rate includes the Doctorate of Nursing program.
Table 10Fall-to-Spring Degree-Seeking Student Persistence Rates
75%
80%
85%
90%
95%
100%
Fall 2011 toSpring 2012
Fall 2012 toSpring 2013
Fall 2013 toSpring 2014
Fall 2014 toSpring 2015
Fall 2015 toSpring 2016
Fall 2016 toSpring 2017
Fall 2017 toSpring 2018
Fall 2018 toSpring 2019
Fall 2019 toSpring 20203
Fall 2020 toSpring 2021
First-time Freshmen Undergraduate1 Graduate2 Law Overall

N PercentHeadcount
Degree-seeking/Certificate-seeking 1,030 100.0% 1,321 100.0% -291 -22.0%Non-degree seeking/Non-certificate seeking 0 0.0% 0 0.0% 0 n/aTotal Headcount 1,030 100.0% 1,321 100.0% -291 -22.0%
Student Credit Hours 12,945 16,558 -3,613 -21.8%
Total FTE 863 1,104 -241 -21.8%
Headcount by Student ClassificationPostsecondary 431 41.8% 592 44.8% -161 -27.2%High School 599 58.2% 729 55.2% -130 -17.8%Total Headcount 1,030 100.0% 1,321 100.0% -291 -22.0%
Headcount by GenderMale 602 58.4% 826 62.5% -224 -27.1%Female 390 37.9% 495 37.5% -105 -21.2%Not Indicated 38 3.7% 0 0.0% 38 n/aTotal Headcount 1,030 100.0% 1,321 100.0% -291 -22.0%
Headcount by Resident/Nonresident [1]
Kansas Resident 1,030 100.0% 1,321 100.0% -291 -22.0%Nonresident 0 0.0% 0 0.0% 0 0.0%Total Headcount 1,030 100.0% 1,321 100.0% -291 -22.0%
Headcount by Full-time/Part-timeFull-time 812 78.8% 996 75.4% -184 -18.5%Part-time 218 21.2% 325 24.6% -107 -32.9%Total Headcount 1,030 100.0% 1,321 100.0% -291 -22.0%
Average AgePostsecondary Students 25.8 25.4High School Students 17.2 17.1
Average Credit Hour LoadPostsecondary Students 13.1 13.6High School Students 12.2 11.6
Table 11Washburn Tech
Enrollment SummarySpring 2021 Compared with Spring 2020
ChangeSpring 2021 Spring 2020
[1] Residency status is in relation to tuition as of the beginning of the term.

N PercentHeadcount
Degree-seeking/Certificate-seeking 1,030 100.0% 1,107 100.0% -77 -7.0%Non-degree seeking/Non-certificate seeking 0 0.0% 0 0.0% 0 0.0%Total Headcount 1,030 100.0% 1,107 100.0% -77 -7.0%
Student Credit HoursDegree-seeking/Certificate-seeking 12,945 100.0% 13,975 100.0% -1,030 -7.4%Non-degree seeking/Non-certificate seeking 0 0.0% 0 0.0% 0 0.0%Total Student Credit Hours 12,945 100.0% 13,975 100.0% -1,030 -7.4%
Total FTE 863 932 -69 -7.4%
Headcount by Student ClassificationPostsecondary 431 41.8% 496 44.8% -65 -13.1%High School 599 58.2% 611 55.2% -12 -2.0%Total Headcount 1,030 100.0% 1,107 100.0% -77 -7.0%
Headcount by GenderMale 602 58.4% 672 60.7% -70 -10.4%Female 390 37.9% 398 36.0% -8 -2.0%Not Indicated 38 3.7% 37 3.3% 1 2.7%Total Headcount 1,030 100.0% 1,107 100.0% -77 -7.0%
Headcount by Resident/Nonresident [1]
Kansas Resident 1,030 100.0% 1,107 100.0% -77 -7.0%Nonresident 0 0.0% 0 0.0% 0 0.0%Total Headcount 1,030 100.0% 1,107 100.0% -77 -7.0%
Minority Enrollment [2] 29.0% 29.1%
Headcount by Full-time/Part-timeFull-time 812 78.8% 892 80.6% -80 -9.0%Part-time 218 21.2% 215 19.4% 3 1.4%Total Headcount 1,030 100.0% 1,107 100.0% -77 -7.0%
Average AgePostsecondary Students 25.8 24.9High School Students 17.2 16.8
Average Credit Hour LoadPostsecondary Students 13.1 13.4High School Students 12.2 12.0
[1] Residency status is in relation to tuition as of the beginning of the term.[2] Student ethnicity/race is self-reported. This figure represents the percentage of students reporting minority status out of the students who chose to provide race/ethnicity information.
Table 12Washburn Tech
Enrollment SummarySpring 2021 Compared with Fall 2020
ChangeSpring 2021 Fall 2020

Percent of Program Spring 2021 Total Spring 2020 SCH Percent
Advanced Systems Technology 391 3.0% 762 -371 -48.7%Automotive Collision & Repair 273 2.1% 430 -157 -36.5%Automotive Technology 1,105 8.5% 1,184 -79 -6.7%Building Automation Systems 0 0.0% 3 -3 -100.0%Business Bookkeeping & Accounting 144 1.1% 292 -148 -50.7%Cabinet & Millwork 132 1.0% 144 -12 -8.3%Carpentry 447 3.5% 935 -488 -52.2%CNA/CMA/HHA 173 1.3% 273 -100 -36.6%Certified Production Technology 182 1.4% 84 98 116.7%Climate & Energy Control Technologies 349 2.7% 430 -81 -18.8%Commercial/Heavy Construction 100 0.8% 160 -60 -37.5%Commercial Truck Driving n/a n/a 165 n/a n/aCosmetology 733 5.7% 1,083 -350 -32.3%Culinary Arts 249 1.9% 323 -74 -22.9%Diesel Technology 534 4.1% 748 -214 -28.6%Early Childhood Professional 167 1.3% 328 -161 -49.1%
Electrical Technology 666 5.1% 765 -99 -12.9%Emergency Communications - Dispatch n/a n/a 109 n/a n/aEmergency Medical Technician 234 1.8% 315 -81 -25.7%Graphics Technology 439 3.4% 337 102 30.3%Health Care Technology 1,268 9.8% 1,100 168 15.3%Health Care Technology - Advanced n/a n/a 94 n/a n/aHeavy Diesel Construction Technology 204 1.6% 72 132 183.3%Information Systems Technology 948 7.3% 1,144 -196 -17.1%Legal Office Professional 96 0.7% 216 -120 -55.6%Locomotive Diesel Technology 12 0.1% 92 -80 -87.0%Machine Technology 352 2.7% 359 -7 -1.9%Medical Office Assistant 48 0.4% 36 12 33.3%Medical Office Specialist 36 0.3% 84 -48 -57.1%Medical Scribe n/a n/a 10 n/a n/aOffice Careers Technology 64 0.5% 84 -20 -23.8%Phlebotomy 161 1.2% 175 -14 -8.0%Practical Nursing 869 6.7% 1,161 -292 -25.2%Surgical Technology 243 1.9% 414 -171 -41.3%Technical Drafting 214 1.7% 276 -62 -22.5%Welding Fabrication 132 1.0% 120 12 10.0%Welding Technology 1,665 12.9% 1,936 -271 -14.0%
OtherPrerequisites - Health Fields 315 2.4% 315 0 0.0%Non-Degree Seeking/Undeclared 0 0.0% 0 0 0.0%
Washburn Tech Total 12,945 100.0% 16,558 -3,613 -21.8%
Table 13Washburn Tech
Student Credit Hours by ProgramSpring 2021 Compared with Spring 2020
Change

Percent of Program Spring 2021 Total Fall 2020 SCH Percent
Advanced Systems Technology 391 3.0% 492 -101 -20.5%Automotive Collision & Repair 273 2.1% 430 -157 -36.5%Automotive Technology 1,105 8.5% 926 179 19.3%Business Bookkeeping & Accounting 144 1.1% 144 0 0.0%Cabinet & Millwork 132 1.0% 127 5 1.1%Carpentry 447 3.5% 447 0 0.0%CNA/CMA/HHA 173 1.3% 132 41 24.4%Certified Production Technology 182 1.4% 168 14 2.9%Climate & Energy Control Technologies 349 2.7% 484 -135 -117.4%Commercial/Heavy Construction 100 0.8% 115 -15 -1.7%Cosmetology 733 5.7% 899 -166 -18.5%Culinary Arts 249 1.9% 393 -144 -36.6%Diesel Technology 534 4.1% 692 -158 -22.8%Early Childhood Professional 167 1.3% 228 -61 -26.8%
Electrical Technology 666 5.1% 580 86 14.8%Emergency Medical Technician 234 1.8% 261 -27 -10.3%Graphics Technology 439 3.4% 436 3 0.7%Health Care Technology 1,268 9.8% 1,080 188 17.4%Health Care Technology - Advanced n/a n/a 117 n/a n/aHeavy Diesel Construction Technology 204 1.6% 157 47 29.9%Information Systems Technology 948 7.3% 1,212 -264 -21.8%Legal Office Professional 96 0.7% 112 -16 -14.3%Locomotive Diesel Technology 12 0.1% 12 0 0.0%Machine Technology 352 2.7% 322 30 9.3%Medical Office Assistant 48 0.4% 48 0 0.0%Medical Office Specialist 36 0.3% 48 -12 -25.0%Office Careers Technology 64 0.5% 48 16 33.3%Phlebotomy 161 1.2% 118 43 36.4%Practical Nursing 869 6.7% 992 -123 -12.4%Surgical Technology 243 1.9% 270 -27 -10.0%Technical Drafting 214 1.7% 292 -78 -26.7%Welding Fabrication 132 1.0% 1,808 -1,676 -92.7%Welding Technology 1,665 12.9% 132 1,533 1161.4%
OtherPrerequisites - Health Fields 315 2.4% 253 62 24.5%Non-Degree Seeking/Undeclared 0 0.0% 0 0 0.0%
Washburn Tech Total 12,945 100.0% 13,975 -1,030 -7.4%
Table 14Washburn Tech
Student Credit Hours by ProgramSpring 2021 Compared with Fall 2020
Change