Embed Size (px)
Citation preview
10
STRATEGIC ANALYSIS OF OPERATING INCOME
LEARNING OUTCOMES
After studying this chapter, you will be able to:
❑ Evaluate Profitability
❑ Evaluate Activity Based Management
© The Institute of Chartered Accountants of India
10.2 STRATEGIC COST MANAGEMENT AND PERFORMANCE EVALUATION
CHAPTER OVERVIEW
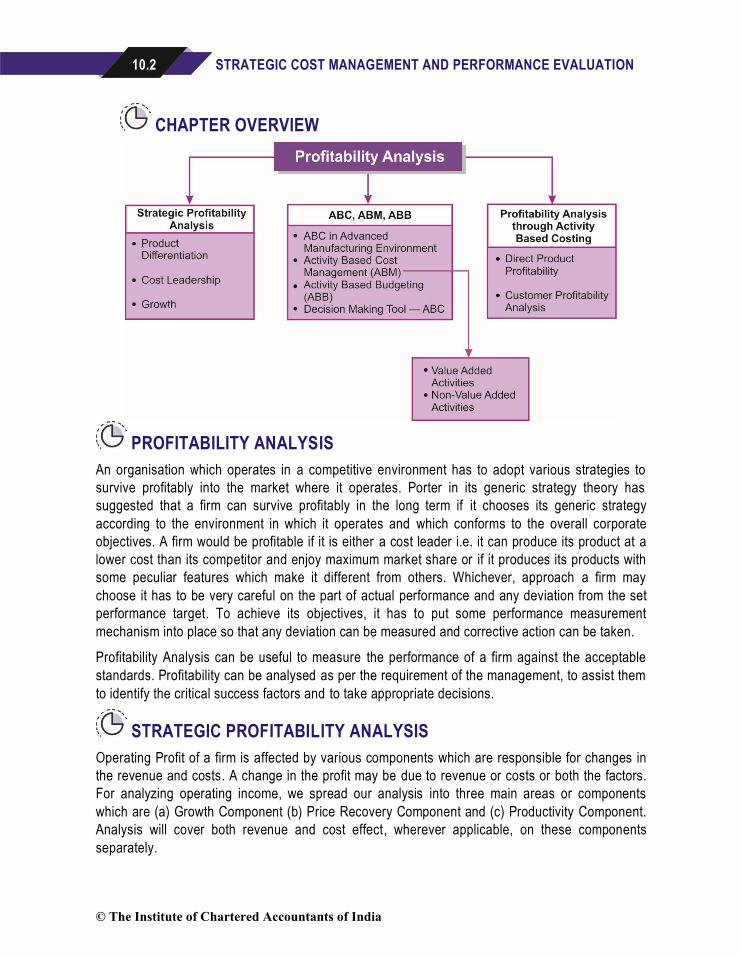
PROFITABILITY ANALYSIS
An organisation which operates in a competitive environment has to adopt various strategies to
survive profitably into the market where it operates. Porter in its generic strategy theory has
suggested that a firm can survive profitably in the long term if it chooses its generic strategy
according to the environment in which it operates and which conforms to the overall corporate
objectives. A firm would be profitable if it is either a cost leader i.e. it can produce its product at a
lower cost than its competitor and enjoy maximum market share or if it produces its products with
some peculiar features which make it different from others. Whichever, approach a firm may
choose it has to be very careful on the part of actual performance and any deviation from the set
performance target. To achieve its objectives, it has to put some performance measurement
mechanism into place so that any deviation can be measured and corrective action can be taken.
Profitability Analysis can be useful to measure the performance of a firm against the acceptable
standards. Profitability can be analysed as per the requirement of the management, to assist them
to identify the critical success factors and to take appropriate decisions.
STRATEGIC PROFITABILITY ANALYSIS
Operating Profit of a firm is affected by various components which are responsible for changes in
the revenue and costs. A change in the profit may be due to revenue or costs or both the factors.
For analyzing operating income, we spread our analysis into three main areas or components
which are (a) Growth Component (b) Price Recovery Component and (c) Productivity Component.
Analysis will cover both revenue and cost effect, wherever applicable, on these components
separately.
© The Institute of Chartered Accountants of India
STRATEGIC ANALYSIS OF OPERATING INCOME 10.3
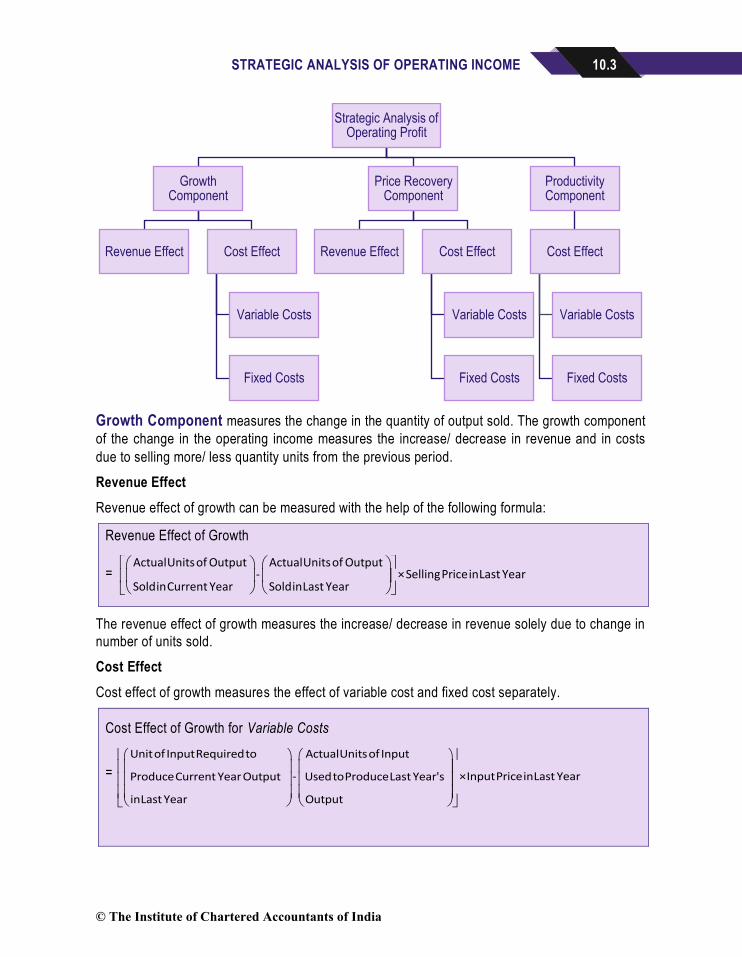
Growth Component measures the change in the quantity of output sold. The growth component
of the change in the operating income measures the increase/ decrease in revenue and in costs
due to selling more/ less quantity units from the previous period.
Revenue Effect
Revenue effect of growth can be measured with the help of the following formula:
Revenue Effect of Growth
=
ActualUnitsof Output ActualUnitsof Output- ×SellingPriceinLast Year
SoldinCurrent Year SoldinLast Year
The revenue effect of growth measures the increase/ decrease in revenue solely due to change in
number of units sold.
Cost Effect
Cost effect of growth measures the effect of variable cost and fixed cost separately.
Cost Effect of Growth for Variable Costs
=
Unitof InputRequiredto ActualUnitsof Input
- ×InputPriceinLast YearProduceCurrent YearOutput UsedtoProduceLast Year's
inLast Year Output
Strategic Analysis of Operating Profit
Growth Component
Revenue Effect Cost Effect
Variable Costs
Fixed Costs
Price Recovery Component
Revenue Effect Cost Effect
Variable Costs
Fixed Costs
Productivity Component
Cost Effect
Variable Costs
Fixed Costs
© The Institute of Chartered Accountants of India
10.4 STRATEGIC COST MANAGEMENT AND PERFORMANCE EVALUATION
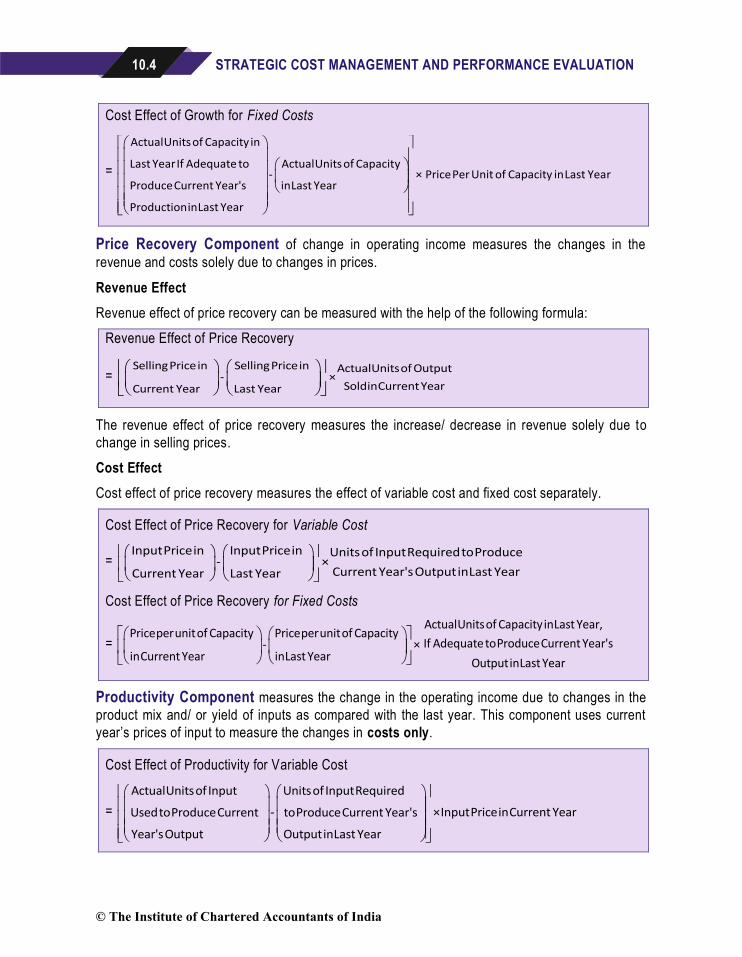
Cost Effect of Growth for Fixed Costs
=
ActualUnitsof Capacity in
Last YearIf Adequate to ActualUnitsof Capacity- × Price Per Unit of Capacity in Last Year
ProduceCurrent Year's inLast Year
ProductioninLast Year
Price Recovery Component of change in operating income measures the changes in the
revenue and costs solely due to changes in prices.
Revenue Effect
Revenue effect of price recovery can be measured with the help of the following formula:
Revenue Effect of Price Recovery
=
SellingPricein SellingPricein ActualUnitsof Output- ×
SoldinCurrentYearCurrent Year Last Year
The revenue effect of price recovery measures the increase/ decrease in revenue solely due to
change in selling prices.
Cost Effect
Cost effect of price recovery measures the effect of variable cost and fixed cost separately.
Cost Effect of Price Recovery for Variable Cost
=
InputPricein InputPricein Unitsof InputRequiredtoProduce- ×
Current Year'sOutputinLast YearCurrent Year Last Year
Cost Effect of Price Recovery for Fixed Costs
=
ActualUnitsof Capacity inLast Year,Priceperunitof Capacity Priceperunitof Capacity
If AdequatetoProduceCurrent Year's- × inCurrent Year inLast Year
OutputinLast Year
Productivity Component measures the change in the operating income due to changes in the
product mix and/ or yield of inputs as compared with the last year. This component uses current
year’s prices of input to measure the changes in costs only.
Cost Effect of Productivity for Variable Cost
=
ActualUnitsof Input Unitsof InputRequired
- ×InputPriceinCurrent YearUsedtoProduceCurrent toProduceCurrent Year's
Year'sOutput OutputinLast Year
© The Institute of Chartered Accountants of India
STRATEGIC ANALYSIS OF OPERATING INCOME 10.5
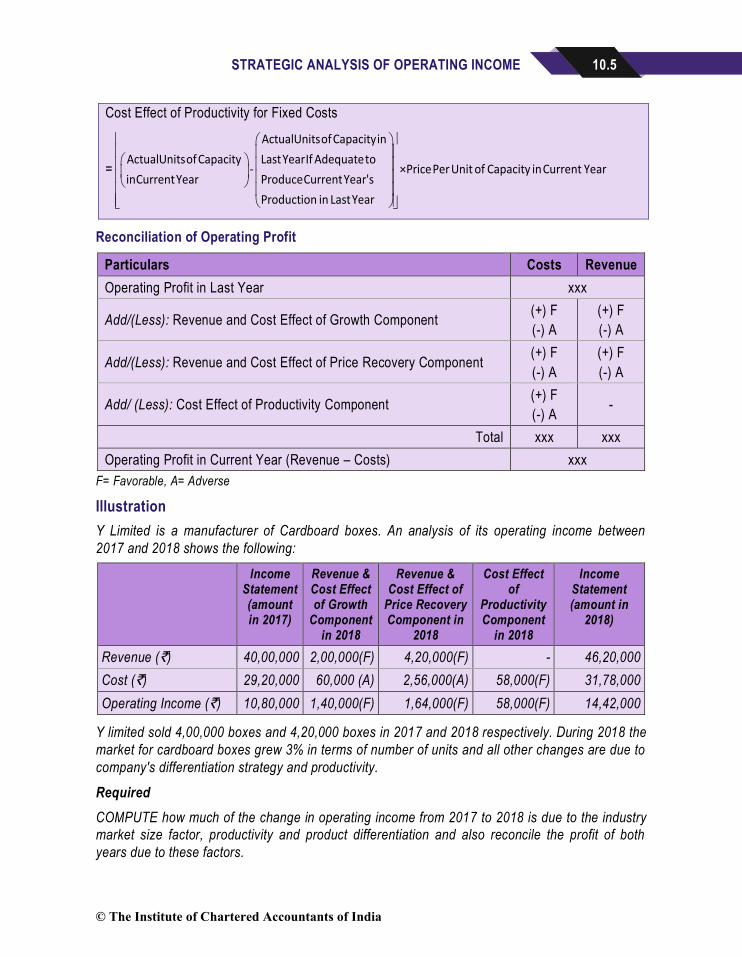
Cost Effect of Productivity for Fixed Costs
=
ActualUnitsofCapacityin
ActualUnitsofCapacity LastYearIf Adequateto- ×Price Per Unit of Capacity in Current Year
inCurrentYear ProduceCurrentYear's
Production in LastYear
Reconciliation of Operating Profit
Particulars Costs Revenue
Operating Profit in Last Year xxx
Add/(Less): Revenue and Cost Effect of Growth Component (+) F
(-) A
(+) F
(-) A
Add/(Less): Revenue and Cost Effect of Price Recovery Component (+) F
(-) A
(+) F
(-) A
Add/ (Less): Cost Effect of Productivity Component (+) F
(-) A -
Total xxx xxx
Operating Profit in Current Year (Revenue – Costs) xxx
F= Favorable, A= Adverse
Illustration
Y Limited is a manufacturer of Cardboard boxes. An analysis of its operating income between
2017 and 2018 shows the following:
Income Statement (amount in 2017)
Revenue & Cost Effect of Growth
Component in 2018
Revenue & Cost Effect of
Price Recovery Component in
2018
Cost Effect of
Productivity Component
in 2018
Income Statement (amount in
2018)
Revenue (`) 40,00,000 2,00,000(F) 4,20,000(F) - 46,20,000
Cost (`) 29,20,000 60,000 (A) 2,56,000(A) 58,000(F) 31,78,000
Operating Income (`) 10,80,000 1,40,000(F) 1,64,000(F) 58,000(F) 14,42,000
Y limited sold 4,00,000 boxes and 4,20,000 boxes in 2017 and 2018 respectively. During 2018 the
market for cardboard boxes grew 3% in terms of number of units and all other changes are due to
company's differentiation strategy and productivity.
Required
COMPUTE how much of the change in operating income from 2017 to 2018 is due to the industry
market size factor, productivity and product differentiation and also reconcile the profit of both
years due to these factors.
© The Institute of Chartered Accountants of India
10.6 STRATEGIC COST MANAGEMENT AND PERFORMANCE EVALUATION
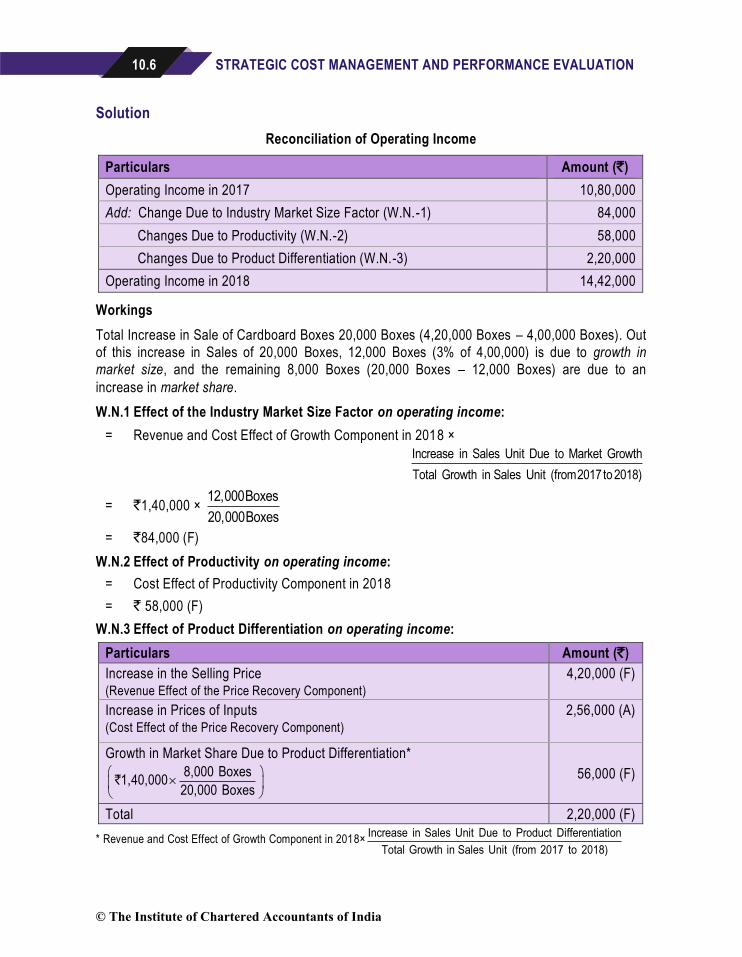
Solution
Reconciliation of Operating Income
Particulars Amount (`)
Operating Income in 2017 10,80,000
Add: Change Due to Industry Market Size Factor (W.N.-1) 84,000
Changes Due to Productivity (W.N.-2) 58,000
Changes Due to Product Differentiation (W.N.-3) 2,20,000
Operating Income in 2018 14,42,000
Workings
Total Increase in Sale of Cardboard Boxes 20,000 Boxes (4,20,000 Boxes – 4,00,000 Boxes). Out
of this increase in Sales of 20,000 Boxes, 12,000 Boxes (3% of 4,00,000) is due to growth in
market size, and the remaining 8,000 Boxes (20,000 Boxes – 12,000 Boxes) are due to an
increase in market share.
W.N.1 Effect of the Industry Market Size Factor on operating income:
= Revenue and Cost Effect of Growth Component in 2018 ×
Increase in Sales Unit Due to Market Growth
Total Growth in Sales Unit (from2017to2018)
= `1,40,000 × 12,000Boxes
20,000Boxes
= `84,000 (F)
W.N.2 Effect of Productivity on operating income:
= Cost Effect of Productivity Component in 2018
= ` 58,000 (F)
W.N.3 Effect of Product Differentiation on operating income:
Particulars Amount (`)
Increase in the Selling Price (Revenue Effect of the Price Recovery Component)
4,20,000 (F)
Increase in Prices of Inputs (Cost Effect of the Price Recovery Component)
2,56,000 (A)
Growth in Market Share Due to Product Differentiation*
8,000 Boxes1,40,000
20,000 Boxes
` 56,000 (F)
Total 2,20,000 (F)
* Revenue and Cost Effect of Growth Component in 2018×Increase in Sales Unit Due to Product Differentiation
Total Growth in Sales Unit (from 2017 to 2018)
© The Institute of Chartered Accountants of India
STRATEGIC ANALYSIS OF OPERATING INCOME 10.7
PROFITABILITY ANALYSIS THROUGH ACTIVITY BASED COSTING
Activity Based Costing (ABC) which has become an important aspect of manufacturing or service
organizations can be defined as a methodology that means the cost and performance of activities,
resources, and cost objects. A well designed and implemented ABC system is a powerful aid to
management evaluation and decision making, thereby improving organizational performance. In
service sector, direct costs are generally low and overheads tend not to be volume related or
capable of being easily attributed to product/ service/ customer being supplied . In this situation,
ABC, with its emphasis on activities and their cost drivers, helps cost to identify more easily and
managed more effectively. In addition, because the resource consumption by different products,
customers or segments of the business is more accurately measured, activity -based profitability
analysis is likely to provide more useful information to management.
Direct Product Profitability (DPP)
For a profit making organisation, profit earned from an operation is a key performance indicator
which assures and controls the direction towards the organisation’s objectives. In today’s
competitive business era most of the firms are having a portfolio of various ranges of products
either for the same consumer market or for different consumer markets. A firm which has a
portfolio of profitable products enjoys high profitability. However, it is very important to know the
relative profitability of an individual product so that management can concentrate on the profitable
products and weed out the loss-making products from the products’ portfolio. Direct Product
Profitability is one among the various analytical methods which analyse the profitability for each
product or segment of products separately.
DPP is used to measure the profitability of an individual product and assist management to know
the true profitability to make appropriate decisions. As opposed to the traditional absorption
costing, where normally labour hours or machine hours are used as a basis for absorption of
indirect costs, DPP uses variety of measures like space used for transportation and storing of
goods, refrigeration time etc. DPP is generally used in the retail trade to determine profitability
from an individual product.
CIMA describe DPP “used primarily within the retail sector, DPP involves the attribution of both
the purchase price and other indirect costs (for example distribution, warehousing and retailing)
to each product line. Thus, a net profit, as opposed to a gross profit, can be identified for each
product. The cost attribution process utilizes a variety of measures (for example warehousing
space and transport time) to reflect the resource consumption of individual products.”
Benefits of DPP
▪ Better cost analysis.
▪ Better pricing decisions.
▪ Better management of stores and warehouse space.
▪ The rationalisation of product ranges.
© The Institute of Chartered Accountants of India
10.8 STRATEGIC COST MANAGEMENT AND PERFORMANCE EVALUATION
Direct Product Profitability Statement
Retail organisations traditionally deducted the bought in cost of goods from the selling price to give
a gross margin. The gross margin is useless measure for controlling the costs of the organisation
itself or making decisions about the profitability of the different products. This is because none of
the costs generated by the retail organisation itself are included in its calculation. For example, it
does not include the storage costs of the different goods and these costs vary considerably from
one goods to another. A method was needed which relates the indirect costs to the goods
according to the way the goods uses or creates these costs.
Indirect costs, for DPP may be analysed into basic cost categories as follows:
(i) Overhead Cost: This is incurred through an activity that is not directly linked to a particular
product.
(ii) Volume Related Cost: The cost is incurred in relation to the space occupied by products. This
includes storage and transport costs.
(iii) Product Batch Cost: This cost is often a time-based cost. If product items (that is a number of
identical products which are handled together as a batch) are stocked on shelves a labour
time cost is incurred.
(iv) Inventory Financing Costs: This is the cost of tying up money in stock and is the cost of the
product multiplied by interest rate per day or per week.
Direct Product Profit can be derived as shown below:
Sales xx
Less: Cost of Goods Sold xx
Gross Margin xx
Less: Direct Product Costs
(Warehouse, Transportation, Store etc.)
xx
Direct Product Profit xx
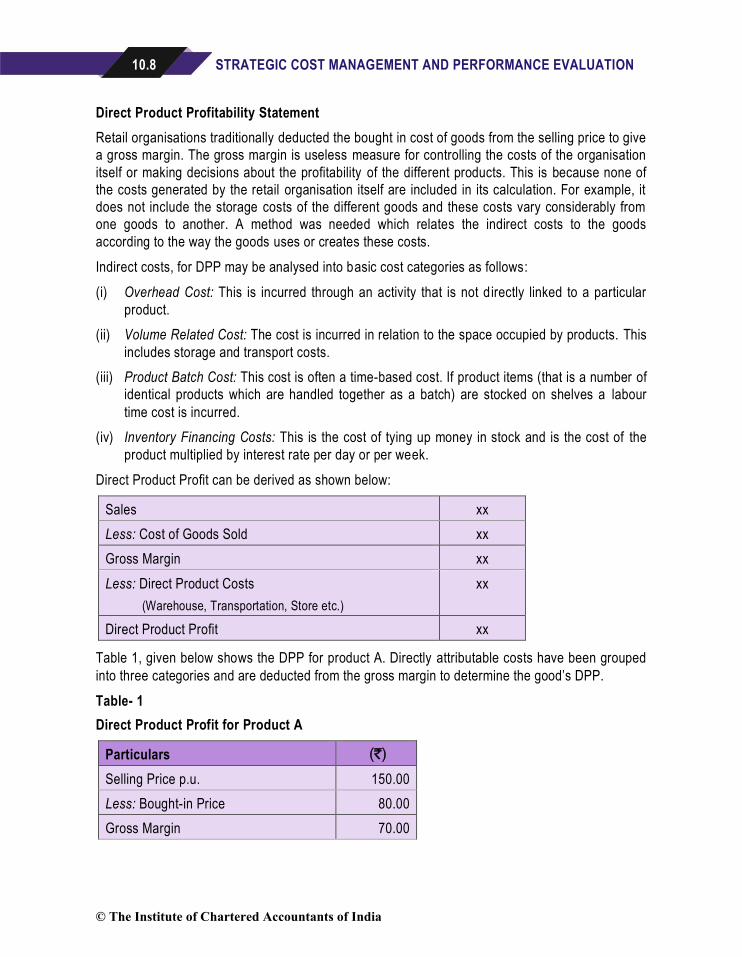
Table 1, given below shows the DPP for product A. Directly attributable costs have been grouped
into three categories and are deducted from the gross margin to determine the good’s DPP.
Table- 1
Direct Product Profit for Product A
Particulars (`)
Selling Price p.u. 150.00
Less: Bought-in Price 80.00
Gross Margin 70.00
© The Institute of Chartered Accountants of India

STRATEGIC ANALYSIS OF OPERATING INCOME 10.9
Less: Direct Product Costs:
Warehouse Costs 16.00
Transport Costs 18.00
Store Costs 22.00
Direct Product Profit p.u. 14.00
Warehouse and store costs will include items such as labour, space and insurance costs, while ,
transport costs will include labour, fuel and vehicle maintenance costs. The usual way to spread
these costs across the different goods sold is in relation to vo lume or area occupied, as most costs
increase in direct proportion to the volume of the good or the space it occupies. However, there
are some exceptions to this; for example, insurance costs may be better spread on value or on a
risk index. Risk is greater with refrigerated or perishable goods. Refrigeration costs must only be
related to those products that need to be stored in the refrigerator.
The result of this type of DPP cost analysis may give information such as that given in the
following table:
Table-2
Profit Gross Margin (%) DPP (%)
Ice-Cream 20.40 4.60
Baby Food 11.00 5.50
Tooth Paste 31.20 18.80
Wine 45.30 17.20
Paper Tissues 15.70 0.00
Above table-2 shows that for ice-cream there is a considerable gap between the gross margin and
the DPP because its refrigerated storage is expensive. It also shows that paper tissues, which had
quite a healthy gross margin, are just breaking even with DPP; this is because they are very bulky
relative to their price.
While the super market or other retailer does not have the luxury of stopping selling paper tissues,
because obviously, it would lose considerable trade if it did not stock a complete range of goods, it
does have other choices. The choices are merchandising ones, such as where to display the stock
and in what position on the shelves. Stocks at eye level sells more quickly than the above or below
eye level. The brand with the greatest margin should be placed at eye level. Goods at the front of
the store tend to sell faster than goods at the back. This explains why tissues are rarely found
close to the entrance or the cash till.
With manufactured products cost per unit for the different products is often calculated and the
products ranked. For a retail organization, DPP per unit may not be the best measure to use.
DPP per unit of time adds another dimension to the measurement and DPP per unit of time per
measure of space adds a third. This is automatically built in when overheads are spread if a cost
© The Institute of Chartered Accountants of India
10.10 STRATEGIC COST MANAGEMENT AND PERFORMANCE EVALUATION
each product uses this rate multiplied by the volume and the number of days or weeks in the
system. In the example in Table-1, the store costs would be based on a rate per cubic centimeter
or metre per day and the product cost can be calculated according to its size and the time it takes
to flow through the system. For example, if the store cost per cubic cm is `0.0073 per day and
good A is 10 cubic cms and the average stay in the store is three days, the store cost per item is `0.0073 × 10 cms. × 3 days = `0.22.
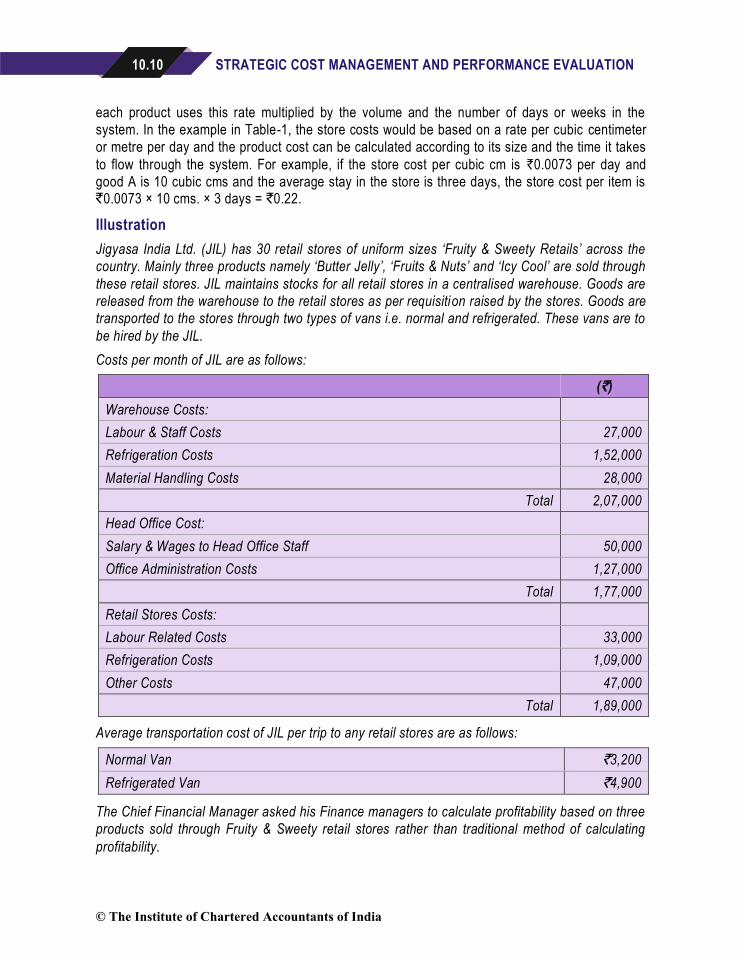
Illustration
Jigyasa India Ltd. (JIL) has 30 retail stores of uniform sizes ‘Fruity & Sweety Retails’ across the
country. Mainly three products namely ‘Butter Jelly’, ‘Fruits & Nuts’ and ‘Icy Cool’ are sold through
these retail stores. JIL maintains stocks for all retail stores in a centralised warehouse. Goods are
released from the warehouse to the retail stores as per requisition raised by the stores. Goods are
transported to the stores through two types of vans i.e. normal and refrigerated. These vans are to
be hired by the JIL.
Costs per month of JIL are as follows:
(`)
Warehouse Costs:
Labour & Staff Costs 27,000
Refrigeration Costs 1,52,000
Material Handling Costs 28,000
Total 2,07,000
Head Office Cost:
Salary & Wages to Head Office Staff 50,000
Office Administration Costs 1,27,000
Total 1,77,000
Retail Stores Costs:
Labour Related Costs 33,000
Refrigeration Costs 1,09,000
Other Costs 47,000
Total 1,89,000
Average transportation cost of JIL per trip to any retail stores are as follows:
Normal Van `3,200
Refrigerated Van `4,900
The Chief Financial Manager asked his Finance managers to calculate profitability based on three
products sold through Fruity & Sweety retail stores rather than traditional method of calculating
profitability.
© The Institute of Chartered Accountants of India
STRATEGIC ANALYSIS OF OPERATING INCOME 10.11
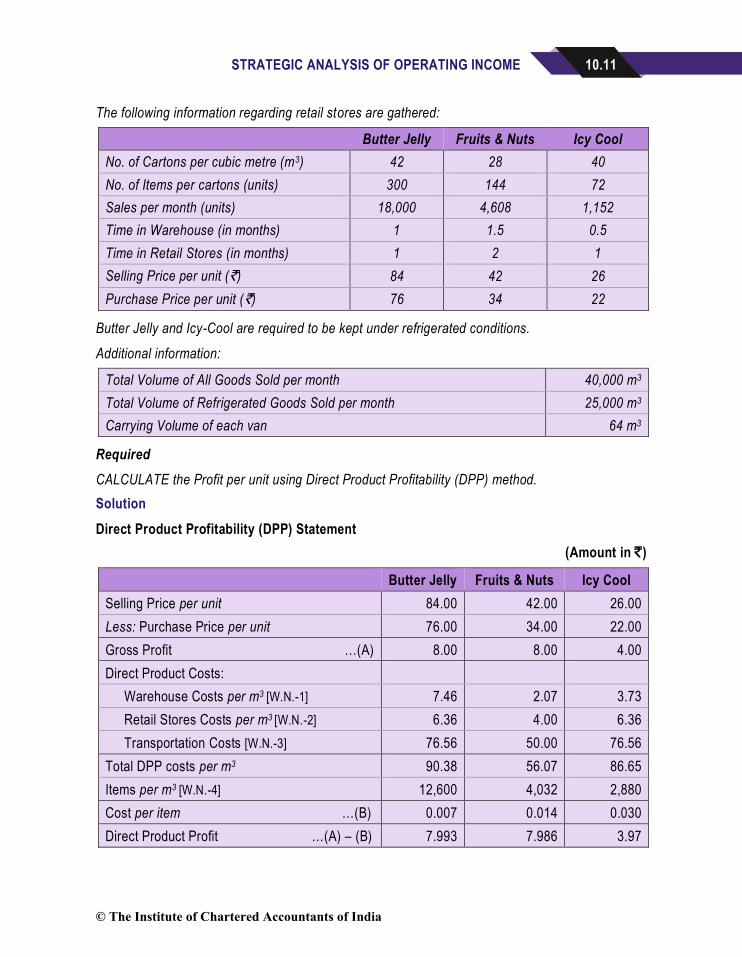
The following information regarding retail stores are gathered:
Butter Jelly Fruits & Nuts Icy Cool
No. of Cartons per cubic metre (m3) 42 28 40
No. of Items per cartons (units) 300 144 72
Sales per month (units) 18,000 4,608 1,152
Time in Warehouse (in months) 1 1.5 0.5
Time in Retail Stores (in months) 1 2 1
Selling Price per unit (`) 84 42 26
Purchase Price per unit (`) 76 34 22
Butter Jelly and Icy-Cool are required to be kept under refrigerated conditions.
Additional information:
Total Volume of All Goods Sold per month 40,000 m3
Total Volume of Refrigerated Goods Sold per month 25,000 m3
Carrying Volume of each van 64 m3
Required
CALCULATE the Profit per unit using Direct Product Profitability (DPP) method.
Solution
Direct Product Profitability (DPP) Statement
(Amount in `)
Butter Jelly Fruits & Nuts Icy Cool
Selling Price per unit 84.00 42.00 26.00
Less: Purchase Price per unit 76.00 34.00 22.00
Gross Profit …(A) 8.00 8.00 4.00
Direct Product Costs:
Warehouse Costs per m3 [W.N.-1] 7.46 2.07 3.73
Retail Stores Costs per m3 [W.N.-2] 6.36 4.00 6.36
Transportation Costs [W.N.-3] 76.56 50.00 76.56
Total DPP costs per m3 90.38 56.07 86.65
Items per m3 [W.N.-4] 12,600 4,032 2,880
Cost per item …(B) 0.007 0.014 0.030
Direct Product Profit …(A) – (B) 7.993 7.986 3.97
© The Institute of Chartered Accountants of India
10.12 STRATEGIC COST MANAGEMENT AND PERFORMANCE EVALUATION
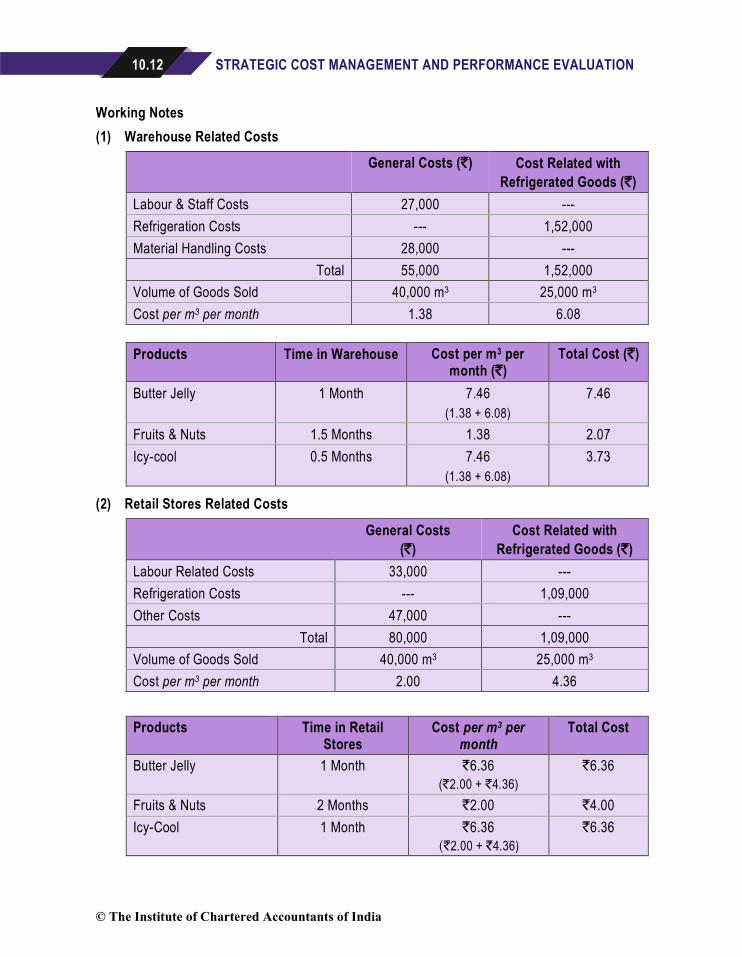
Working Notes
(1) Warehouse Related Costs
General Costs (`) Cost Related with
Refrigerated Goods (`)
Labour & Staff Costs 27,000 ---
Refrigeration Costs --- 1,52,000
Material Handling Costs 28,000 ---
Total 55,000 1,52,000
Volume of Goods Sold 40,000 m3 25,000 m3
Cost per m3 per month 1.38 6.08
Products Time in Warehouse Cost per m3 per month (`)
Total Cost (`)
Butter Jelly 1 Month 7.46
(1.38 + 6.08)
7.46
Fruits & Nuts 1.5 Months 1.38 2.07
Icy-cool 0.5 Months 7.46
(1.38 + 6.08)
3.73
(2) Retail Stores Related Costs
General Costs
(`)
Cost Related with
Refrigerated Goods (`)
Labour Related Costs 33,000 ---
Refrigeration Costs --- 1,09,000
Other Costs 47,000 ---
Total 80,000 1,09,000
Volume of Goods Sold 40,000 m3 25,000 m3
Cost per m3 per month 2.00 4.36
Products Time in Retail Stores
Cost per m3 per month
Total Cost
Butter Jelly 1 Month `6.36
(`2.00 + `4.36)
`6.36
Fruits & Nuts 2 Months `2.00 `4.00
Icy-Cool 1 Month `6.36
(`2.00 + `4.36)
`6.36
© The Institute of Chartered Accountants of India
STRATEGIC ANALYSIS OF OPERATING INCOME 10.13
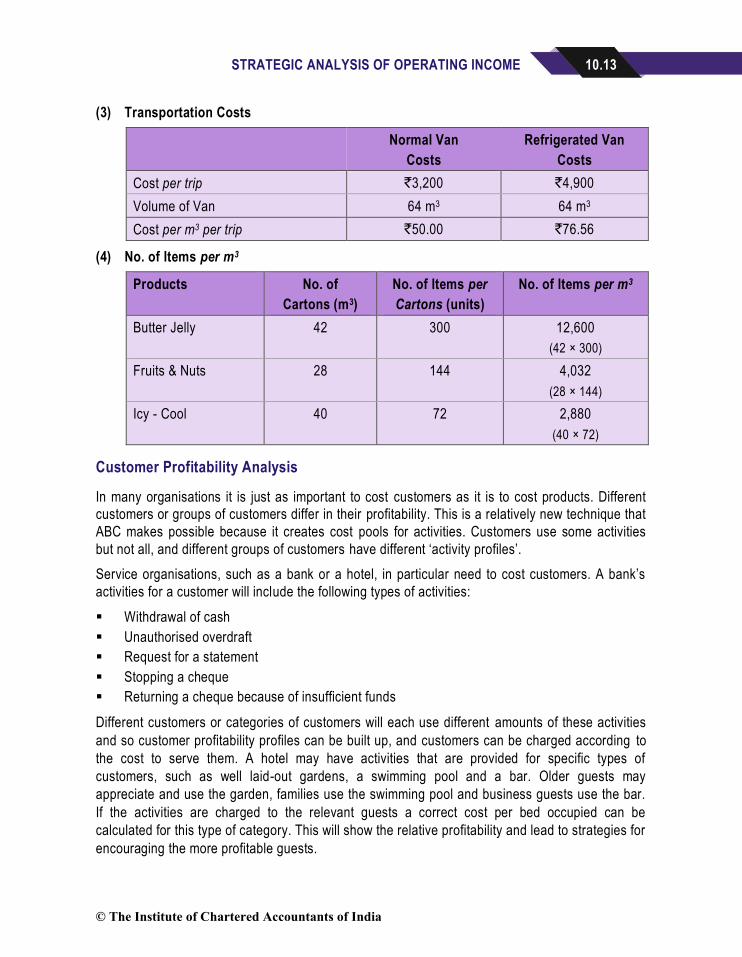
(3) Transportation Costs
Normal Van
Costs
Refrigerated Van
Costs
Cost per trip `3,200 `4,900
Volume of Van 64 m3 64 m3
Cost per m3 per trip `50.00 `76.56
(4) No. of Items per m3
Products No. of
Cartons (m3)
No. of Items per
Cartons (units)
No. of Items per m3
Butter Jelly 42 300 12,600
(42 × 300)
Fruits & Nuts 28 144 4,032
(28 × 144)
Icy - Cool 40 72 2,880
(40 × 72)
Customer Profitability Analysis
In many organisations it is just as important to cost customers as it is to cost products. Different
customers or groups of customers differ in their profitability. This is a relatively new technique that
ABC makes possible because it creates cost pools for activities. Customers use some activities
but not all, and different groups of customers have different ‘activity profiles’.
Service organisations, such as a bank or a hotel, in particular need to cost customers. A bank’s
activities for a customer will include the following types of activities:
▪ Withdrawal of cash
▪ Unauthorised overdraft
▪ Request for a statement
▪ Stopping a cheque
▪ Returning a cheque because of insufficient funds
Different customers or categories of customers will each use different amounts of these activities
and so customer profitability profiles can be built up, and customers can be charged according to
the cost to serve them. A hotel may have activities that are provided for specific types of
customers, such as well laid-out gardens, a swimming pool and a bar. Older guests may
appreciate and use the garden, families use the swimming pool and business guests use the bar.
If the activities are charged to the relevant guests a correct cost per bed occupied can be
calculated for this type of category. This will show the relative profitability and lead to strategies for
encouraging the more profitable guests.
© The Institute of Chartered Accountants of India
10.14 STRATEGIC COST MANAGEMENT AND PERFORMANCE EVALUATION
Even a manufacturing organization can benefit from costing its customers. Not all customers cost
the same to serve even if they require the same products. Some customers may be located a long
way from the factory and transport may cost more. Other customers may be disruptive and place
rush orders that interrupt production scheduling and require immediate special transport. Some
customers need after sales service and help with technical matters, etc.
Benefits of Customer Profitability Analysis
▪ It helps the supplier to identify which customers are eroding overall profitability and which
customers are contributing to it.
▪ It can help to provide a basis for constructive dialogue between buyer and seller to improve
margins.
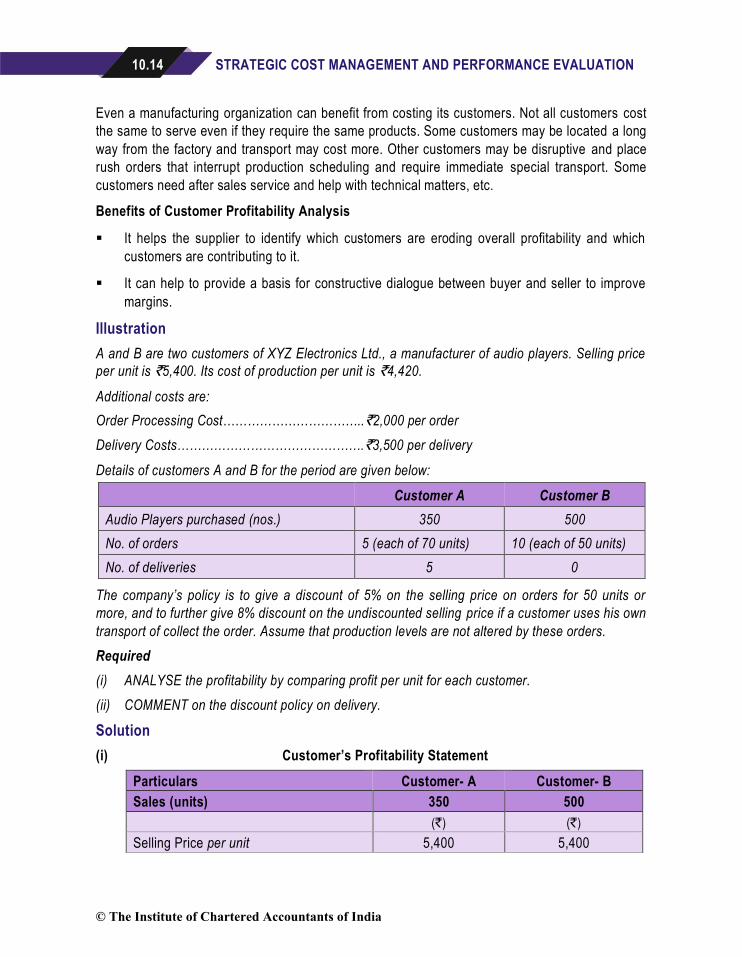
Illustration
A and B are two customers of XYZ Electronics Ltd., a manufacturer of audio players. Selling price
per unit is `5,400. Its cost of production per unit is `4,420.
Additional costs are:
Order Processing Cost……………………………..`2,000 per order
Delivery Costs……………………………………….`3,500 per delivery
Details of customers A and B for the period are given below:
Customer A Customer B
Audio Players purchased (nos.) 350 500
No. of orders 5 (each of 70 units) 10 (each of 50 units)
No. of deliveries 5 0
The company’s policy is to give a discount of 5% on the selling price on orders for 50 units or
more, and to further give 8% discount on the undiscounted selling price if a customer uses his own
transport of collect the order. Assume that production levels are not altered by these orders.
Required
(i) ANALYSE the profitability by comparing profit per unit for each customer.
(ii) COMMENT on the discount policy on delivery.
Solution
(i) Customer’s Profitability Statement
Particulars Customer- A Customer- B
Sales (units) 350 500
(`) (`)
Selling Price per unit 5,400 5,400
© The Institute of Chartered Accountants of India
STRATEGIC ANALYSIS OF OPERATING INCOME 10.15
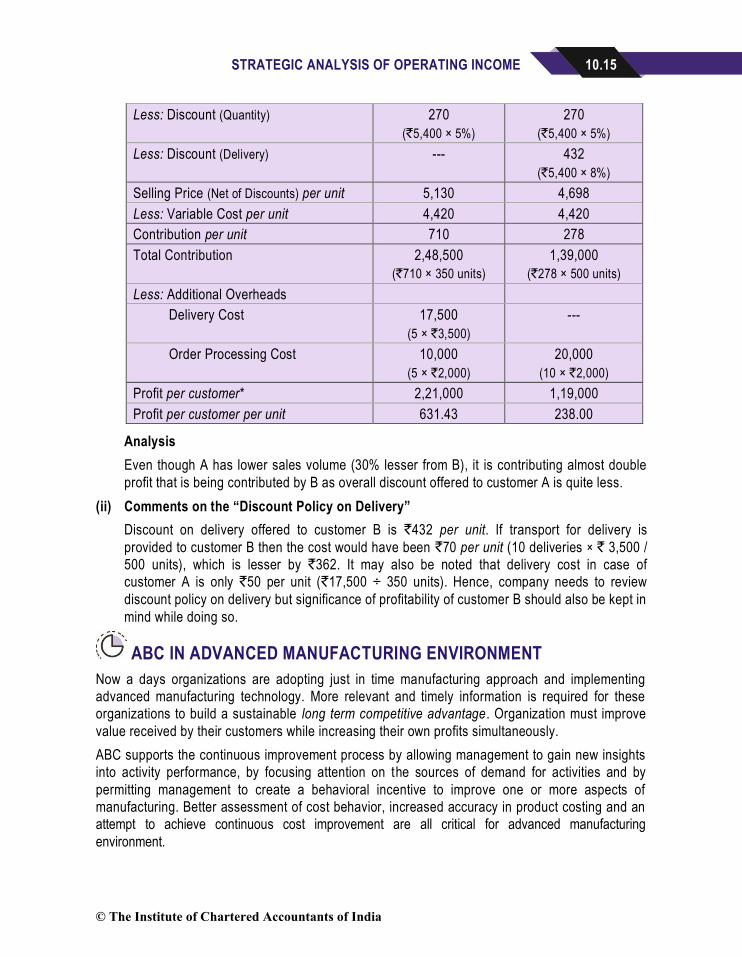
Less: Discount (Quantity)
270
(`5,400 × 5%)
270
(`5,400 × 5%)
Less: Discount (Delivery)
--- 432
(`5,400 × 8%)
Selling Price (Net of Discounts) per unit 5,130 4,698
Less: Variable Cost per unit 4,420 4,420
Contribution per unit 710 278
Total Contribution 2,48,500
(`710 × 350 units)
1,39,000
(`278 × 500 units)
Less: Additional Overheads
Delivery Cost
17,500
(5 × `3,500)
---
Order Processing Cost
10,000
(5 × `2,000)
20,000
(10 × `2,000)
Profit per customer* 2,21,000 1,19,000
Profit per customer per unit 631.43 238.00
Analysis
Even though A has lower sales volume (30% lesser from B), it is contributing almost double
profit that is being contributed by B as overall discount offered to customer A is quite less.
(ii) Comments on the “Discount Policy on Delivery”
Discount on delivery offered to customer B is `432 per unit. If transport for delivery is
provided to customer B then the cost would have been `70 per unit (10 deliveries × ` 3,500 /
500 units), which is lesser by `362. It may also be noted that delivery cost in case of
customer A is only `50 per unit (`17,500 ÷ 350 units). Hence, company needs to review
discount policy on delivery but significance of profitability of customer B should also be kept in
mind while doing so.
ABC IN ADVANCED MANUFACTURING ENVIRONMENT
Now a days organizations are adopting just in time manufacturing approach and implementing
advanced manufacturing technology. More relevant and timely information is required for these
organizations to build a sustainable long term competitive advantage. Organization must improve
value received by their customers while increasing their own profits simultaneously.
ABC supports the continuous improvement process by allowing management to gain new insights
into activity performance, by focusing attention on the sources of demand for activities and by
permitting management to create a behavioral incentive to improve one or more aspects of
manufacturing. Better assessment of cost behavior, increased accuracy in product costing and an
attempt to achieve continuous cost improvement are all critical for advanced manufacturing
environment.
© The Institute of Chartered Accountants of India
10.16 STRATEGIC COST MANAGEMENT AND PERFORMANCE EVALUATION
In advanced manufacturing environment, where support function overheads constitute a large
share of total costs, ABC provides more realistic and accurate product costing, as traditional
volume based costing system does not take into account the Non-unit Level Overhead Costs such
as Setup Cost, Inspection Cost, and Material Handling Cost etc. Cost Analysis under ABC system
shows that while these costs are largely fixed with respect to sales volume, but they are not fixed
to other appropriate cost drivers.
The concepts underlying a relevant costing analysis continue to be completely valid in an
advanced manufacturing setting and in a situation where activity based costing is used.
Further it is pertinent to mention that ABC offers no increase in product-costing accuracy for
single-product setting.
ACTIVITY BASED COST MANAGEMENT (ABM)
Empirical studies of ABC implementation have frequently shown that the greater benefit derived
from its adoption are in Cost Management rather in providing accurate product cost. The term
Activity based management (ABM) is used to describe the Cost Management application of
ABC. The use of ABC as a costing tool to manage costs at activity level is known as Activity
Based Cost Management (ABM). ABM is a discipline that focuses on the efficient and effective
management of activities as the route to continuously improving the value received by customers.
ABM utilizes cost information gathered through ABC. Through various different types of analysis,
ABM manages activities rather than resources. It determines what drives the activities of the
organisation and how these activities can be improved to increase the profitability.
Consortium for Advanced Management International (CAM) defines ABM as “adds a dynamic,
continuous improvement dimension to the more static ABC model”.
CAM-1 defines ABM as: “A discipline that focuses on the management of activities as the route
to improving the value received by the customer and the profit achieved by providing this value.
This discipline includes cost driver analysis, activity analysis, and performance measurement.
Activity-Based Management draws on Activity-Based Costing as its major source of
information.”
Interestingly, it has been observed that Japanese accountants began exploring activity -based
techniques in the early 1990s following movement in the United States toward the ABM model.
© The Institute of Chartered Accountants of India
STRATEGIC ANALYSIS OF OPERATING INCOME 10.17
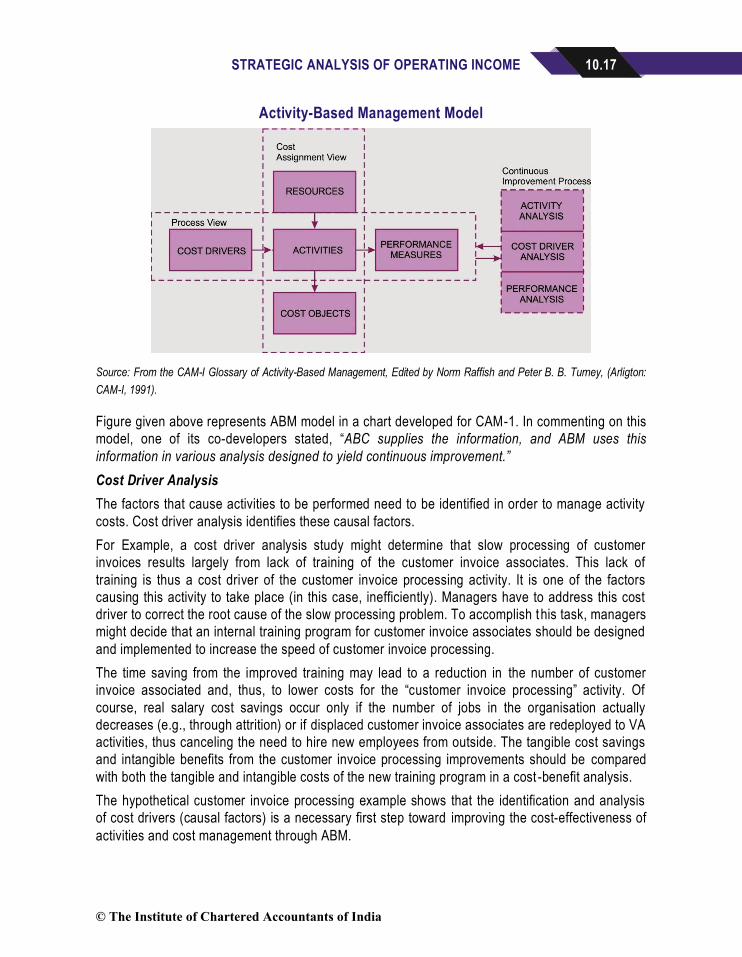
Activity-Based Management Model
Source: From the CAM-I Glossary of Activity-Based Management, Edited by Norm Raffish and Peter B. B. Turney, (Arligton:
CAM-I, 1991).
Figure given above represents ABM model in a chart developed for CAM-1. In commenting on this
model, one of its co-developers stated, “ABC supplies the information, and ABM uses this
information in various analysis designed to yield continuous improvement.”
Cost Driver Analysis
The factors that cause activities to be performed need to be identified in order to manage activity
costs. Cost driver analysis identifies these causal factors.
For Example, a cost driver analysis study might determine that slow processing of customer
invoices results largely from lack of training of the customer invoice associates. This lack of
training is thus a cost driver of the customer invoice processing activity. It is one of the factors
causing this activity to take place (in this case, inefficiently). Managers have to address this cost
driver to correct the root cause of the slow processing problem. To accomplish this task, managers
might decide that an internal training program for customer invoice associates should be designed
and implemented to increase the speed of customer invoice processing.
The time saving from the improved training may lead to a reduction in the number of customer
invoice associated and, thus, to lower costs for the “customer invoice processing” activity. Of
course, real salary cost savings occur only if the number of jobs in the organisation actually
decreases (e.g., through attrition) or if displaced customer invoice associates are redeployed to VA
activities, thus canceling the need to hire new employees from outside. The tangible cost savings
and intangible benefits from the customer invoice processing improvements should be compared
with both the tangible and intangible costs of the new training program in a cost -benefit analysis.
The hypothetical customer invoice processing example shows that the identification and analysis
of cost drivers (causal factors) is a necessary first step toward improving the cost-effectiveness of
activities and cost management through ABM.
© The Institute of Chartered Accountants of India
10.18 STRATEGIC COST MANAGEMENT AND PERFORMANCE EVALUATION
Activity Analysis
Activity analysis, defined in above section, identifies the activities of an organisation and the
activity centres (or activity cost pools) that should be used in an ABC system. Activity analysis also
identifies Value Added (VA) and Non- Value Added (NVA) activities. The degree to which activities
are grouped together into activity centres depends on the costs and benefits of the alternatives.
The number of activity centres is likely to change over time as organisational needs for activity
information evolve.
For Example, only a few activity centres may be used in an initial ABC pilot study. As managers
become more accustomed to the initial ABC system and find the output useful, they may request a
more detailed and refined ABC model.
Performance Analysis
Performance analysis involves the identification of appropriate measures to report the performance
of activity centres or other organisational units, consistent with each unit’s goals and objectives.
Performance analysis aims to identify the best ways to measure the performance of factors that
are important to organisations in order to stimulate continuous improvement.
Value Added (VA) Activities / Non-Value Added (NVA) Activities
ABM views the business as a set of linked activities that ultimately add value to the customer. ABM
is based on the premise that activities consume costs. Therefore, by managing activities costs will
be managed in long term. Activities may be grouped in such a way as to describe the total
process.
For Example, serving a particular customer involves a number of discrete activities, but the sum
total of these activities represents the process by which the client is serviced. ABM classifies each
activity within a process as value-added activities or non-value added activities.
Value-Added Activities
The VA activities are those activities which are indispensable in order to complete the process.
The customers are usually willing to pay (in some way) for these services.
For Example, polishing furniture by a manufacturer dealing in furniture is a value- added activity.
© The Institute of Chartered Accountants of India
STRATEGIC ANALYSIS OF OPERATING INCOME 10.19
Non-Value-Added Activities1
The NVA activity represents work that is not valued by the external or internal customer. NVA
activities do not improve the quality or function of a product or service, but they can adversely
affect costs and prices. Non-Value Added activities create waste, result in delay of some sort, add
costs to the products or services and for which the customer is not willing to pay. Moving materials
and machine set up for a production run are examples of NVA activities.
By measuring activities rather than traditional departmental costs, business can focus on cross
functional processes in order to identify NVA activities and pinpoint the time drives of cost at each
stage.
NVA Costs should be reported in activity center cost reports. One approach that management
accountant find useful in identifying NVA activities is to classify the ways in which time spent in a
manufacturing process. In most manufacturing operations, time is spent in the following ways:
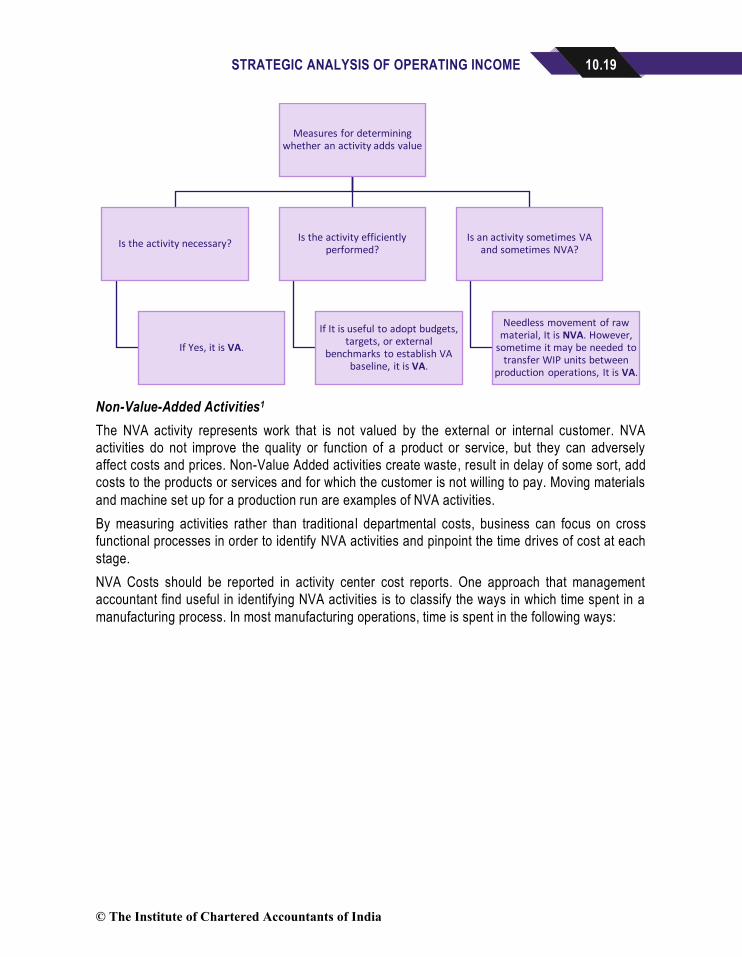
Measures for determining whether an activity adds value
Is the activity necessary?
If Yes, it is VA.
Is the activity efficiently performed?
If It is useful to adopt budgets, targets, or external
benchmarks to establish VA baseline, it is VA.
Is an activity sometimes VA and sometimes NVA?
Needless movement of raw material, It is NVA. However,
sometime it may be needed to transfer WIP units between
production operations, It is VA.
© The Institute of Chartered Accountants of India
10.20 STRATEGIC COST MANAGEMENT AND PERFORMANCE EVALUATION
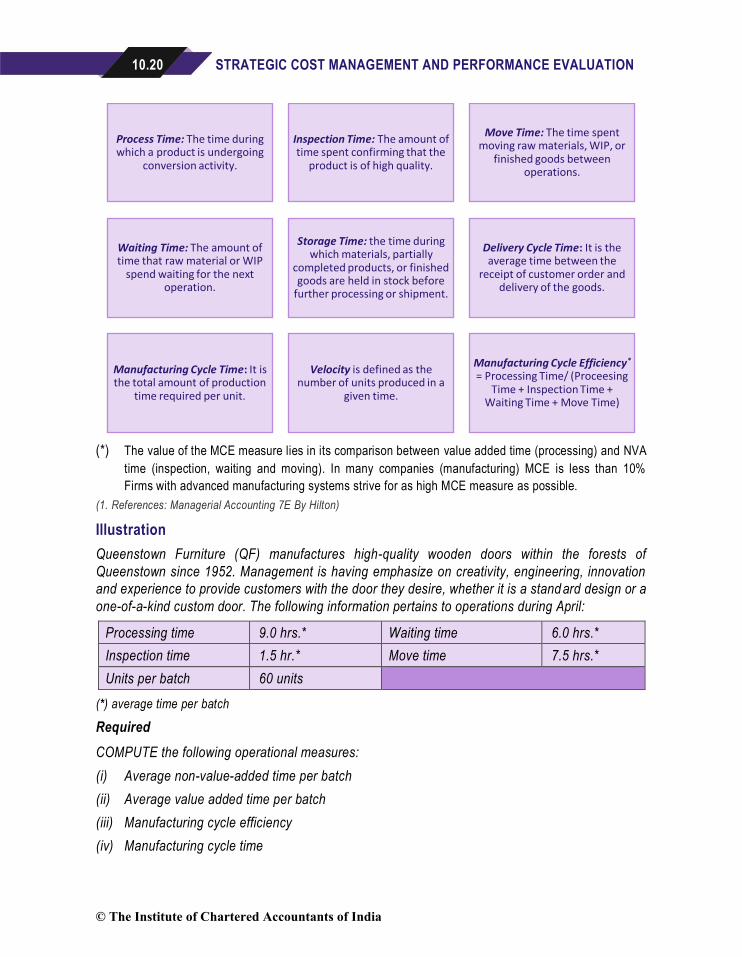
(*) The value of the MCE measure lies in its comparison between value added time (processing) and NVA
time (inspection, waiting and moving). In many companies (manufacturing) MCE is less than 10%
Firms with advanced manufacturing systems strive for as high MCE measure as possible.
(1. References: Managerial Accounting 7E By Hilton)
Illustration
Queenstown Furniture (QF) manufactures high-quality wooden doors within the forests of
Queenstown since 1952. Management is having emphasize on creativity, engineering, innovation
and experience to provide customers with the door they desire, whether it is a stand ard design or a
one-of-a-kind custom door. The following information pertains to operations during April:
Processing time 9.0 hrs.* Waiting time 6.0 hrs.*
Inspection time 1.5 hr.* Move time 7.5 hrs.*
Units per batch 60 units
(*) average time per batch
Required
COMPUTE the following operational measures:
(i) Average non-value-added time per batch
(ii) Average value added time per batch
(iii) Manufacturing cycle efficiency
(iv) Manufacturing cycle time
Process Time: The time during which a product is undergoing
conversion activity.
Inspection Time: The amount of time spent confirming that the
product is of high quality.
Move Time: The time spent moving raw materials, WIP, or
finished goods between operations.
Waiting Time: The amount of time that raw material or WIP
spend waiting for the next operation.
Storage Time: the time during which materials, partially
completed products, or finished goods are held in stock before
further processing or shipment.
Delivery Cycle Time: It is the average time between the
receipt of customer order and delivery of the goods.
Manufacturing Cycle Time: It is the total amount of production
time required per unit.
Velocity is defined as the number of units produced in a
given time.
Manufacturing Cycle Efficiency*
= Processing Time/ (Proceesing Time + Inspection Time +
Waiting Time + Move Time)
© The Institute of Chartered Accountants of India
STRATEGIC ANALYSIS OF OPERATING INCOME 10.21
Solution
(i) Average Non-Value Added Time per batch
= Inspection Time + Waiting Time + Move Time
= 1.5 hr. + 6.0 hrs. + 7.5 hrs.
= 15 hrs.
(ii) Average Value Added Time per batch
= Processing Time
= 9 hrs.
(iii) Manufacturing Cycle Efficiency
= ProcessingTime
ProcessingTime + Inspection Time + Waiting Time + Move Time
= 9.0 hrs.
9.0 hrs.+ 1.5 hr.+ 6.0 hrs.+ 7.5 hrs.
= 37.5%
(iv) Manufacturing Cycle Time
= Total Production Time
Units per Batch
= 24 hrs.
60 units
= 0.40 hrs. per unit
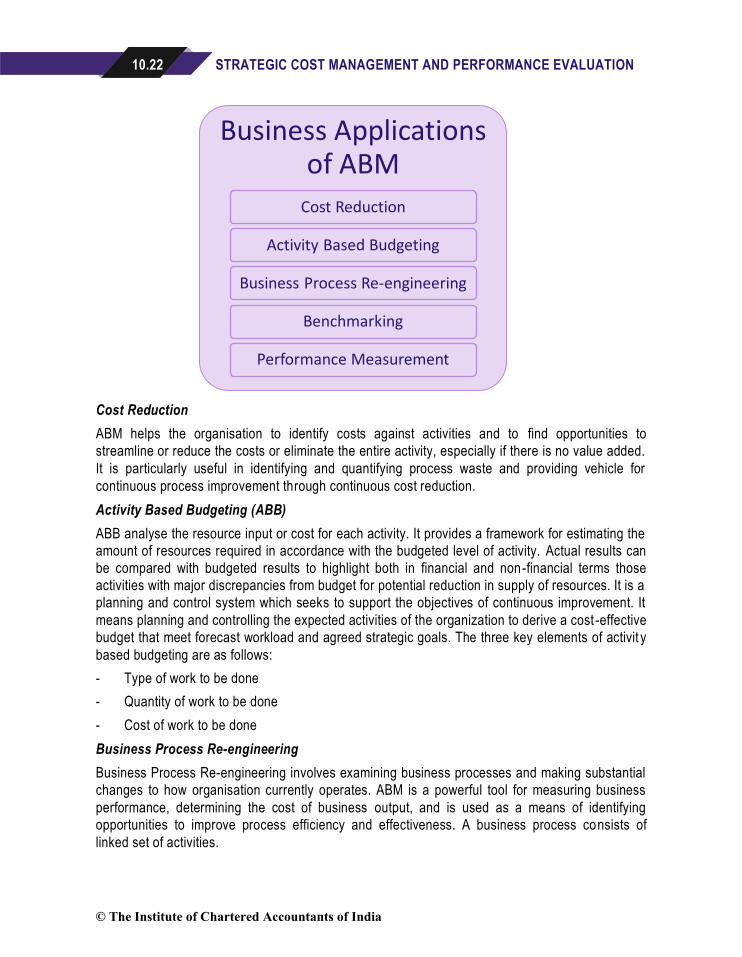
Business Applications of ABM
The goal of the ABCM is to make customer needs to be satisfied while making fewer demands for
resources. Current research suggests that customers have perceived needs in four areas, all of
which must be satisfied simultaneously.
The customers require- lower costs, higher quality, faster response time & greater innovation.
To satisfy these needs ABM currently being used for a variety of business applications. Such as:
© The Institute of Chartered Accountants of India
10.22 STRATEGIC COST MANAGEMENT AND PERFORMANCE EVALUATION
Cost Reduction
ABM helps the organisation to identify costs against activities and to find opportunities to
streamline or reduce the costs or eliminate the entire activity, especially if there is no value added.
It is particularly useful in identifying and quantifying process waste and providing vehicle for
continuous process improvement through continuous cost reduction.
Activity Based Budgeting (ABB)
ABB analyse the resource input or cost for each activity. It provides a framework for estimating the
amount of resources required in accordance with the budgeted level of activity. Actual results can
be compared with budgeted results to highlight both in financial and non-financial terms those
activities with major discrepancies from budget for potential reduction in supply of resources. It is a
planning and control system which seeks to support the objectives of continuous improvement. It
means planning and controlling the expected activities of the organization to derive a cost -effective
budget that meet forecast workload and agreed strategic goals. The three key elements of activit y
based budgeting are as follows:
- Type of work to be done
- Quantity of work to be done
- Cost of work to be done
Business Process Re-engineering
Business Process Re-engineering involves examining business processes and making substantial
changes to how organisation currently operates. ABM is a powerful tool for measuring business
performance, determining the cost of business output, and is used as a means of identifying
opportunities to improve process efficiency and effectiveness. A business process consists of
linked set of activities.
Business Applications of ABM
Cost Reduction
Activity Based Budgeting
Business Process Re-engineering
Benchmarking
Performance Measurement
© The Institute of Chartered Accountants of India
STRATEGIC ANALYSIS OF OPERATING INCOME 10.23
For example, purchasing of materials might be considered as business process consist of activities
such as receiving a purchase request, identifying supplies, preparing purchase orders, mailing
purchase orders, and performing follow up. One way the process might be reengineered by
sending the production schedule direct to the suppliers and to enter into a contractual agreement
to deliver materials according to the production schedule. The end result might be permanent
reduction or elimination of some activities like raising a requisition every time if there is a need for
materials, identifying potential suppliers each time, waiting for their bid which may result in a delay
of the production process and thereby hamper the organisation’s goals.
Benchmarking
Benchmarking is a process of comparing of ABC derived activity costs of one segment of company
with those of other segments. It requires uniformity in the definition of activities a nd measurement
of their costs.
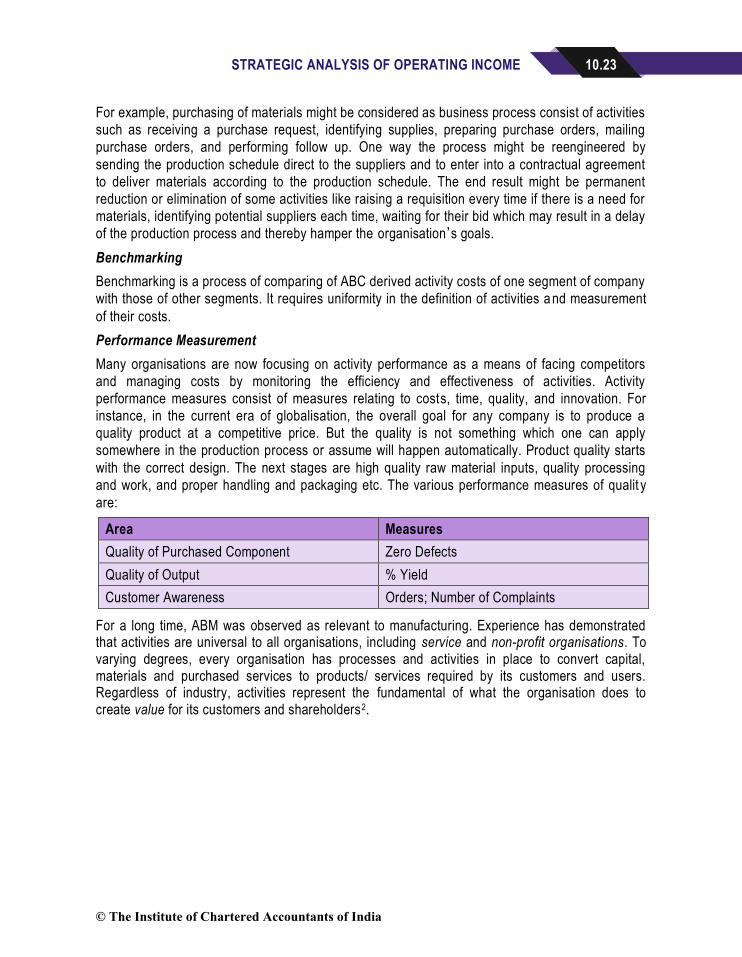
Performance Measurement
Many organisations are now focusing on activity performance as a means of facing competitors
and managing costs by monitoring the efficiency and effectiveness of activities. Activity
performance measures consist of measures relating to costs, time, quality, and innovation. For
instance, in the current era of globalisation, the overall goal for any company is to produce a
quality product at a competitive price. But the quality is not something which one can apply
somewhere in the production process or assume will happen automatically. Product quality starts
with the correct design. The next stages are high quality raw material inputs, quality processing
and work, and proper handling and packaging etc. The various performance measures of qualit y
are:
Area Measures
Quality of Purchased Component Zero Defects
Quality of Output % Yield
Customer Awareness Orders; Number of Complaints
For a long time, ABM was observed as relevant to manufacturing. Experience has demonstrated that activities are universal to all organisations, including service and non-profit organisations. To varying degrees, every organisation has processes and activities in place to convert capital, materials and purchased services to products/ services required by its customers and users. Regardless of industry, activities represent the fundamental of what the organisation does to create value for its customers and shareholders2.
© The Institute of Chartered Accountants of India
10.24 STRATEGIC COST MANAGEMENT AND PERFORMANCE EVALUATION
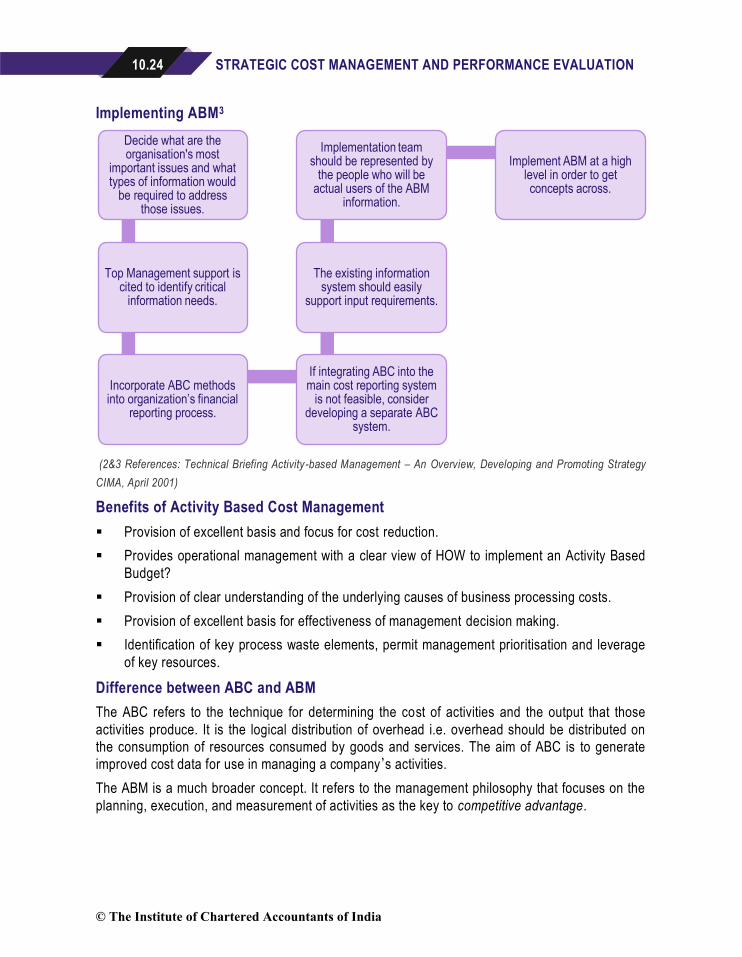
Implementing ABM3
(2&3 References: Technical Briefing Activity-based Management – An Overview, Developing and Promoting Strategy
CIMA, April 2001)
Benefits of Activity Based Cost Management
▪ Provision of excellent basis and focus for cost reduction.
▪ Provides operational management with a clear view of HOW to implement an Activity Based
Budget?
▪ Provision of clear understanding of the underlying causes of business processing costs.
▪ Provision of excellent basis for effectiveness of management decision making.
▪ Identification of key process waste elements, permit management prioritisation and leverage
of key resources.
Difference between ABC and ABM
The ABC refers to the technique for determining the cost of activities and the output that those
activities produce. It is the logical distribution of overhead i.e. overhead should be distributed on
the consumption of resources consumed by goods and services. The aim of ABC is to generate
improved cost data for use in managing a company’s activities.
The ABM is a much broader concept. It refers to the management philosophy that focuses on the
planning, execution, and measurement of activities as the key to competitive advantage.
Decide what are the organisation's most
important issues and what types of information would
be required to address those issues.
Top Management support is cited to identify critical
information needs.
Incorporate ABC methods into organization’s financial
reporting process.
If integrating ABC into the main cost reporting system
is not feasible, consider developing a separate ABC
system.
The existing information system should easily
support input requirements.
Implementation team should be represented by
the people who will be actual users of the ABM
information.
Implement ABM at a high level in order to get concepts across.
© The Institute of Chartered Accountants of India
STRATEGIC ANALYSIS OF OPERATING INCOME 10.25
ACTIVITY BASED BUDGETING (ABB)4
Activity Based Budgeting is a process of planning and controlling the expected activities for the
organisation to derive a cost-effective budget that meets forecast workload and agreed strategic
goals. An activity based budget is a quantitative expression of the expected activities of the firm,
reflecting management’s forecast of workload and financial and non-financial requirements to
meet agreed strategic goals and planned changes to improve performance.
Thus, the key elements of ABB are:
▪ Type of work/activity to be performed;
▪ Quantity of work/activity to be performed; and
▪ Cost of work/activity to be performed.
ABB focuses on the activity/ business processes. Resources required are determined on the
expected activities and workload. The objective is to bring in efficiency into the system. So, in the
process of budget preparation, many key questions need to be addressed and properly answered.
ABB is a technique for enhancing the accuracy of financial forecasts and increasing management
understanding. When automated, ABB can rapidly and accurately produce financial plans and
models based on varying levels of volume assumptions. Also, ABB eliminates much of the
needless rework created by traditional budgeting techniques.
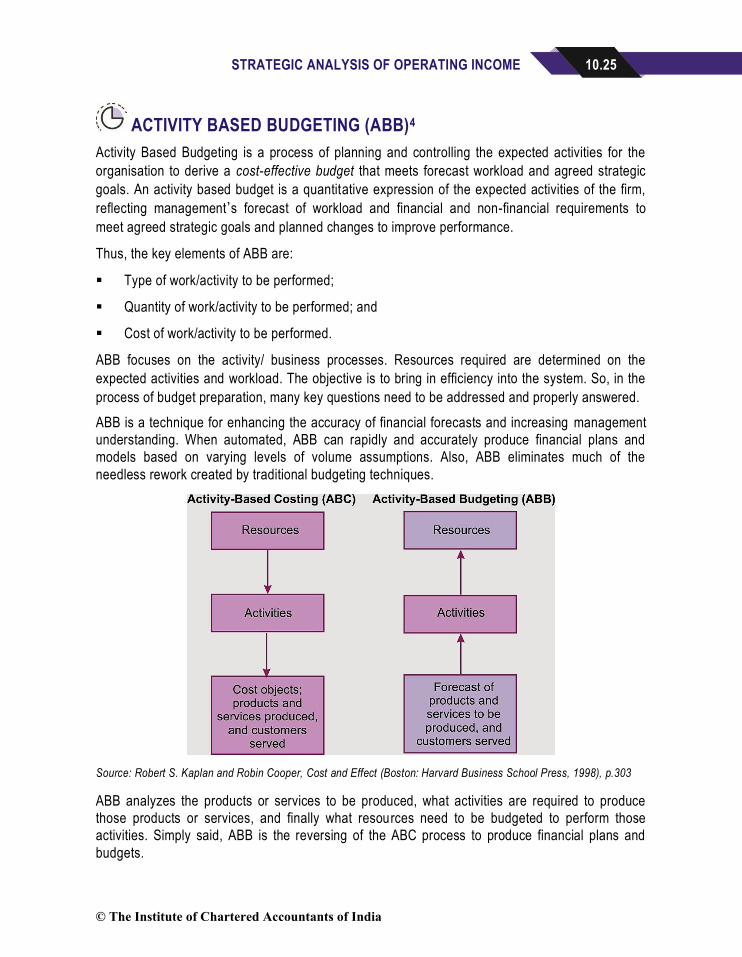
Source: Robert S. Kaplan and Robin Cooper, Cost and Effect (Boston: Harvard Business School Press, 1998), p.303
ABB analyzes the products or services to be produced, what activities are required to produce
those products or services, and finally what resources need to be budgeted to perform those
activities. Simply said, ABB is the reversing of the ABC process to produce financial plans and
budgets.
© The Institute of Chartered Accountants of India
10.26 STRATEGIC COST MANAGEMENT AND PERFORMANCE EVALUATION
Traditional, functional- based budgeting is concerned with budgeting the costs of resources
associated with organizational units, such as departments and plants. Firms that have
implemented an activity-based costing system may also wish to install an activity-based budgeting
system.
A budgetary system at the activity level can be a useful approach to support continuous
improvement and process management. Furthermore, because activities are what consume
resources and, thus, are the causes of costs, activity-based budgeting may prove to be a much
more powerful planning and control tool than the traditional, functional-based budgeting approach.
An activity-based budgetary approach can be used to emphasize cost reduction through the
elimination of wasteful activities and improving the efficiency of necessary activities.
As with traditional, functional-based budgeting, ABB begins with sales and production budgets.
Direct materials and direct labor budgets also are compatible with an ABC framework because
these production inputs are directly traceable to the individual products. The major differences
between functional and activity-based budgeting are found within the overhead and selling and
administration categories. In a functional- based approach, budgets within these categories
typically are detailed by cost elements. These cost elements are classified as variable or fixed,
using production or sales output measures as the basis for determining cost behavior. ABB, on the
other hand, identifies the overhead, selling, and administrative activities and then builds a budget
for each activity, based on the resources needed to provide the required activity output levels.
Costs are classified as variable or fixed with respect to the activity output measure.
Activity Flexible Budgeting
The ability to identify changes in activity costs as activity output changes allows managers to more
carefully plan and monitor activity improvements. Activity flexible budgeting is the prediction of
what activity costs will be as activity output changes. Variance analysis within an activity
framework makes it possible to improve traditional budgetary performance reporting. It also
enhances the ability to manage activities. Activity flexible budgets differ from traditional flexible
budgets because the cost formulas are based on the activity drivers for the respective activities
rather than being based only on a single unit-based driver, such as direct labor hours.
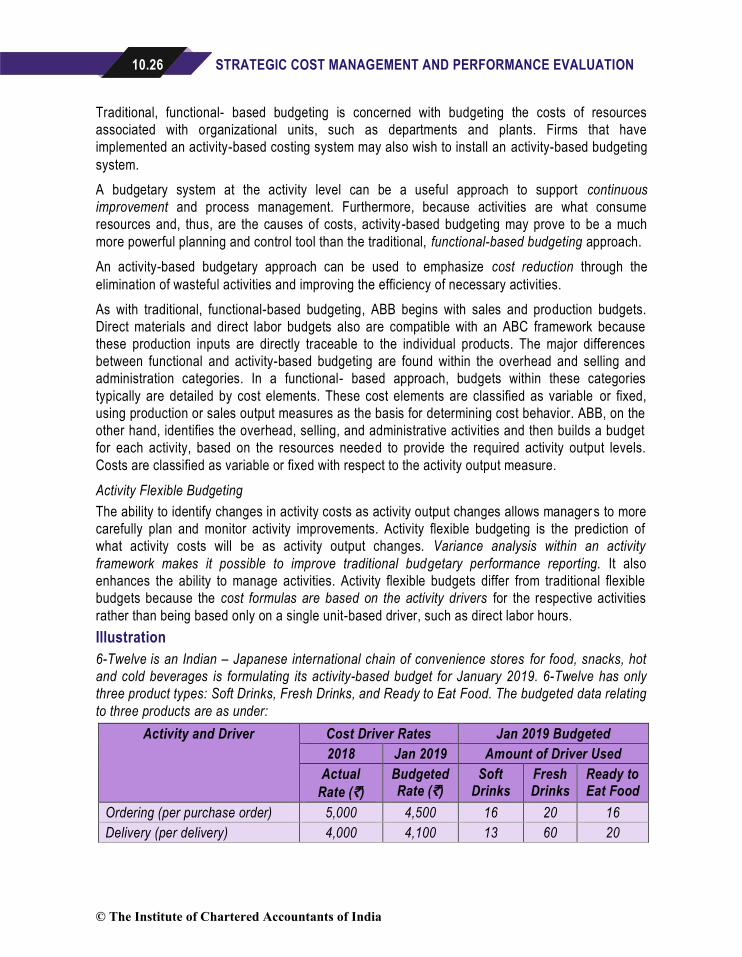
Illustration
6-Twelve is an Indian – Japanese international chain of convenience stores for food, snacks, hot
and cold beverages is formulating its activity-based budget for January 2019. 6-Twelve has only
three product types: Soft Drinks, Fresh Drinks, and Ready to Eat Food. The budgeted data relating
to three products are as under:
Activity and Driver Cost Driver Rates Jan 2019 Budgeted
2018 Jan 2019 Amount of Driver Used
Actual
Rate (`)
Budgeted Rate (`)
Soft Drinks
Fresh Drinks
Ready to Eat Food
Ordering (per purchase order) 5,000 4,500 16 20 16
Delivery (per delivery) 4,000 4,100 13 60 20
© The Institute of Chartered Accountants of India

STRATEGIC ANALYSIS OF OPERATING INCOME 10.27
Shelf-Stocking (per hour) 1,000 1,050 15 170 93
Customer Support (per item sold) 10 9 4,500 34,600 10,500
6-Twelve has a continuous improvement system to budgeting monthly activity costs for each
month of 2019. February's budgeted cost-driver rate is 0.996 times the budgeted January 2019
rate. March's budgeted cost-driver rate is 0.996 times the budgeted February 2019 rate and so on.
Required
(i) COMPUTE total budgeted cost for each activity in January 2019.
(ii) DISCUSS advantages might 6-Twelve gain by using an activity-based budgeting approach
over, say, an approach that allocates the cost of these activities to products as a percentage
of the cost of goods sold.
(iii) COMPUTE total budgeted cost for each activity in March 2019 if March 2019 has the same
budgeted amount of cost-driver usage as January 2019.
(iv) STATE benefits of 6-Tweleve adopting a kaizen budgeting approach. IDENTIFY limitations?
Solution
(i) Calculation of Total Budgeted Cost for Each Activity
(`)
Activity Cost Hierarchy Soft
Drinks
Fresh
Drinks
Ready to Eat Food
Total
Ordering (`4,500 × 16; 20; 16)
Batch-Level 72,000
90,000 72,000 2,34,000
Delivery (`4,100 × 13; 60; 20)
Batch-Level 53,300 2,46,000 82,000 3,81,300
Shelf stocking (`1,050 × 15; 170; 93)
Output Unit Level 15,750 1,78,500 97,650 2,91,900
Customer support (`9 × 4,500; 34,600; 10,500)
Output Unit Level 40,500 3,11,400 94,500 4,46,400
Total Budgeted Costs 1,81,550 8,25,900 3,46,150 13,53,600
(ii) An Activity Based Budgeting approach identifies how different products require different
mixes of support activities. The relative percentage of how each product area uses the cost
driver at each activity area is:
Activity Cost Hierarchy Soft Drinks
(%)
Fresh Drinks
(%)
Ready to Eat Food
(%)
Total
(%)
Ordering Batch-Level 30.77 38.46 30.77 100.0
Delivery Batch-Level 13.98 64.52 21.50 100.0
© The Institute of Chartered Accountants of India
10.28 STRATEGIC COST MANAGEMENT AND PERFORMANCE EVALUATION
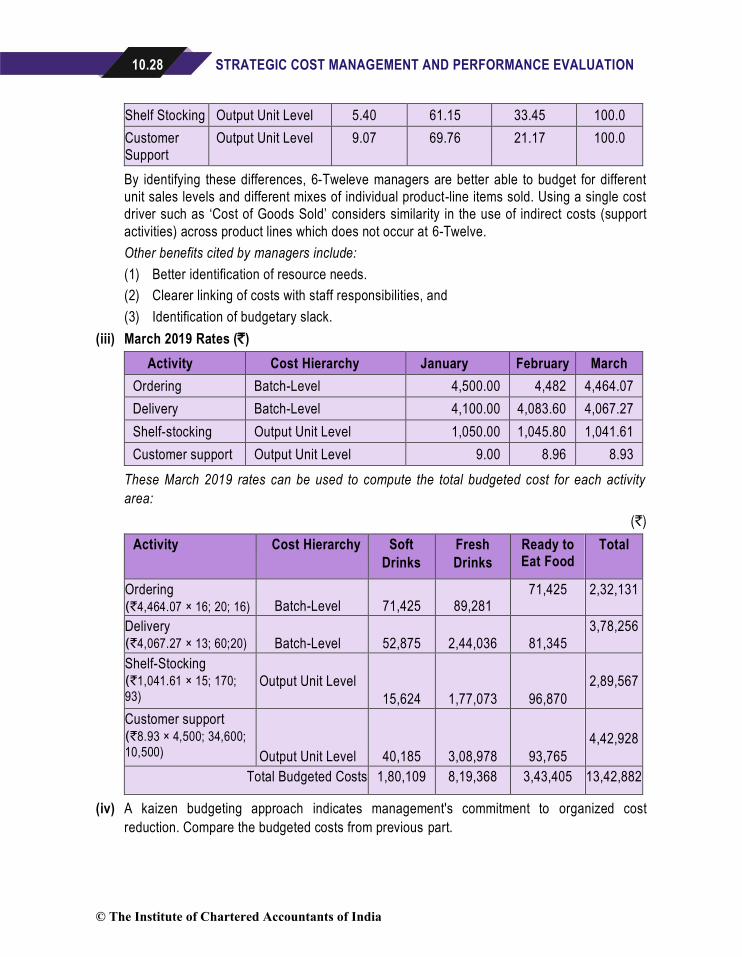
Shelf Stocking Output Unit Level 5.40 61.15 33.45 100.0
Customer Support
Output Unit Level 9.07 69.76 21.17 100.0
By identifying these differences, 6-Tweleve managers are better able to budget for different
unit sales levels and different mixes of individual product-line items sold. Using a single cost
driver such as ‘Cost of Goods Sold’ considers similarity in the use of indirect costs (support
activities) across product lines which does not occur at 6-Twelve.
Other benefits cited by managers include:
(1) Better identification of resource needs.
(2) Clearer linking of costs with staff responsibilities, and
(3) Identification of budgetary slack.
(iii) March 2019 Rates (`)
Activity Cost Hierarchy January February March
Ordering Batch-Level 4,500.00 4,482 4,464.07
Delivery Batch-Level 4,100.00 4,083.60 4,067.27
Shelf-stocking Output Unit Level 1,050.00 1,045.80 1,041.61
Customer support Output Unit Level 9.00 8.96 8.93
These March 2019 rates can be used to compute the total budgeted cost for each activity
area:
(`)
Activity Cost Hierarchy Soft
Drinks
Fresh
Drinks
Ready to Eat Food
Total
Ordering (`4,464.07 × 16; 20; 16) Batch-Level 71,425 89,281
71,425
2,32,131
Delivery (`4,067.27 × 13; 60;20) Batch-Level 52,875 2,44,036 81,345
3,78,256
Shelf-Stocking (`1,041.61 × 15; 170; 93)
Output Unit Level
15,624 1,77,073 96,870
2,89,567
Customer support (`8.93 × 4,500; 34,600; 10,500) Output Unit Level 40,185 3,08,978 93,765
4,42,928
Total Budgeted Costs 1,80,109 8,19,368 3,43,405 13,42,882
(iv) A kaizen budgeting approach indicates management's commitment to organized cost
reduction. Compare the budgeted costs from previous part.
© The Institute of Chartered Accountants of India

STRATEGIC ANALYSIS OF OPERATING INCOME 10.29
Ordering
Delivery Shelf-Stocking
Customer Support
Part (i) 2,34,000 3,81,300
2,91,900
3,81,300
Part (iii) 2,32,131 3,78,256
2,89,567
4,46,400
The kaizen budget number will show unfavorable variances for managers whose activities do
not meet the required monthly cost reductions. This likely will put more pressure on
managers to creatively seek out cost reductions by working ‘better' within 6-Twelve.
One limitation of kaizen budgeting, as illustrated, is that it considers minor incremental
improvements each month. It is possible that some cost improvements arise from irregular
fluctuations in operating processes, supplier networks, or customer interactions. Companies
need to highlight the importance of seeking these improvements as well as the minor
incremental improvements
(Sources: 4. Cost Accounting: A Managerial Emphasis, 13/e By Charles T. Horngren; Cost Management: Accounting
and Control By Don Hansen, Maryanne Mowen, Liming Guan; Cornerstones of Financial and Managerial Accounting By
Jay Rich, Jeff Jones, Dan L. Heitger, Maryanne Mowen, Don Hansen)
ABC: A DECISION - MAKING TOOL
It is a useful tool for many of the management decisions facing companies today. It can bring a
picture of the operation to light that may not be obvious through other analysis tools. Specifically,
ABC is useful in analyzing specific segments of an organization. This might include a market line,
a group of products (even a single product), a customer, or an employee. The ABC is implemented
in following decisions:
▪ ABC is a complement to total quality management (TQM). It provides quantitative data that
can track the financial impact of improvements implemented as part of the TQM initiative.
Some have even suggested that ABC is the most important concept introduced since TQM.
Amoco Performance Products, Transparent Container Co. and Fellowes Manufacturing Co.
are a few companies that have utilized the ABC/TQM modeling concept to improve
performance and profitability.
▪ Wholesale distributors can gain significant advantage in the decision-making process through
implementation of ABC concepts. The expansion of line offerings has brought about difficult
decisions for the distributor. Using traditional financial data, overhead burden is distributed
equally across the product line. Introduction of new products or vendors might also introduce
variance to the overhead. For instance, the need to support a special storage area for control
or environmental reasons, or the need of new handling equipment will increase overall
operational costs. These costs will be spread over the product line, reducing margin on
existing products and reducing the cost impact of the new items.
ABC models the costs back to the activity. The burden created by the new product is correctly
reflected. This allows the existing merits while leaving the new line to justify itself.
© The Institute of Chartered Accountants of India
10.30 STRATEGIC COST MANAGEMENT AND PERFORMANCE EVALUATION
▪ Other decisions that can be assisted by ABC include facility and resource expansion. Often
the basis for relocation or opening of a new distribution center is based on cost associations.
Reduction in freight or other logistics costs can offset the expense of the new facility, staff or
equipment. When the numbers used are enterprise-based, the return might not develop as
expected. The ABC model can identify the specific cost elements being targeted, providing a
much clearer picture from which management can act.
▪ Decision support for human resources can be augmented by ABC. Where activity, and
therefore cost, can be associated to an individual, new levels of financial performance can be
determined. This might be appropriate in cases of branch management or sales. Adding or
deleting resource slots can be determined based on costs of activities as well. The added
data provided through ABC can present a number of options, including outsourcing,
productivity improvements through automation, and a determination of employee/revenue
ratios.
▪ Companies who wish to determine price based on cost plus markup basis find ABC method of
costing very relevant and are able to determine competitive prices for their products.
▪ Using Traditional absorption costing, overheads may get distributed equally across al l product
lines. ABC traces costs back to the activity and the consumption of resources by each
product. Thus, product line profitability can be determined in more realistic terms.
In summary, activity-based costing is a management decision-making tool. It provides financial
support data structured in a fashion fundamentally different from accounting data provided in the
general ledger. By associating cost to the activity, a clear relationship can be established between
sources of activity demand and the related costs. This association can benefit the distributor in
determining where costs are being incurred, what is initiating the costs and where to apply efforts
to curb inflationary costs. This can be of particular value in tracking new products or custome rs. It
can also provide tracking of logistics costs, one of the fastest growing areas of expense to the
distribution operation.
Concept in Practice
Coca Cola Enterprises Belgium (CCEB) produces, distributes and sells the different brands of
‘The Coca-Cola Company’. In the field of distribution, it is also CCEB who services the entire
Belgian and Luxembourg market. CCEB is present in more than 85,000 points of sale
(supermarkets, grocery stores, companies, hospitals, cinemas, amusement parks, sport center).
By the end of 2009, CCEB employed more than 2,500 employees in Belgium and Luxembourg
with revenue of €1.1 billion.
Like many other companies, Coca-Cola Enterprises Belgium was confronted with an increasing
Cost to Serve (CTS) due to a changing customer landscape. This created a challenge to which
CCEB needed to formulate decisive answers to stay on track towards achieving their growth path
and their company objectives.
© The Institute of Chartered Accountants of India
STRATEGIC ANALYSIS OF OPERATING INCOME 10.31
When companies are confronted with increasing CTS, it is essential to analyse the organisation,
its revenues & costs and its processes down to the most detailed level of information. It is this
data that give the true reasons behind certain evolutions so that management can take fact -
based decisions. When having such a challenge at hand, Activity Based Costing is the most
advanced and complete method to gain this information. Thus, CCEB wanted to use the
information from ABC analysis to formulate:
- Cost/ Profit Modeling
- Performance Modeling and
- Set-up an Internal Recharge Mechanism to Sales
By implementing Activity-Based Costing, CCEB obtained the right information that enabled them
to harmonize and streamline the processes of their different distribution centers.
This made it possible for CCEB to calculate the costs in a fair and transparent way, so that the
sales force is charged correctly according to the complexity that Supply Chain had to deal with.
From the capacity insights that CCEB got from Activity-Based Costing, multiple initiatives were
derived that ultimately led to the redesign of the regional distribution strategy, including:
- Optimizing efficiency and capacity within the logistic department.
- Designing the most efficient processes, based on the time equations from ABC Analysis.
- Implementing "best practice" processes in the CCEB distribution centers
These actions successfully reduce their Cost to Serve and still be in line with the new corporate
strategy.
SUMMARY
▪ Strategic Profitability Analysis – Operating Profit of a firm is affected by various components
which are responsible for changes in the revenue and costs. Majorly there are three
components –
(i) Growth Component measures the change in the quantity of output sold. The growth
component of the change in the operating income measures the increase/ decrease in
revenue and in costs due to selling more/ less quantity units from the previous period.
(ii) Price Recovery Component of change in operating income measures the changes in the
revenue and costs solely due to changes in prices.
(iii) Productivity Component measures the change in the operating income due to
changes in the product mix and/ or yield of inputs as compared with the last year. This
component uses current year’s prices of input to measure the changes in costs only.
© The Institute of Chartered Accountants of India
10.32 STRATEGIC COST MANAGEMENT AND PERFORMANCE EVALUATION
▪ Profitability Analysis Through Activity Based Costing –
(i) Activity Based Costing (ABC) which has become an important aspect of manufacturing or service organizations can be defined as a methodology that means the cost and performance of activities, resources, and cost objects.
(ii) It acts as an aid to management evaluation and decision making.
(iii) In service sector, direct costs are generally low and overheads tend not to be volume related or capable of being easily attributed to product/ service/ customer being supplied. ABC helps cost to identify more easily and managed more effectively.
(iv) The resource consumption by different products, customers, or segments of the business is more accurately measured, activity-based profitability analysis is likely to provide more useful information to management.
▪ Direct Product Profitability (DPP) – DPP “used primarily within the retail sector, DPP involves
the attribution of both the purchase price and other indirect costs (for example distribution,
warehousing, and retailing) to each product line. Thus, a net profit, as opposed to a gross
profit, can be identified for each product. The cost attribution process utilizes a variety of
measures (for example warehousing space and transport time) to reflect the resource
consumption of individual products.”
▪ Benefits of DPP – Cost analysis, pricing decisions, management of stores and warehouse
space, rationalization of product ranges.
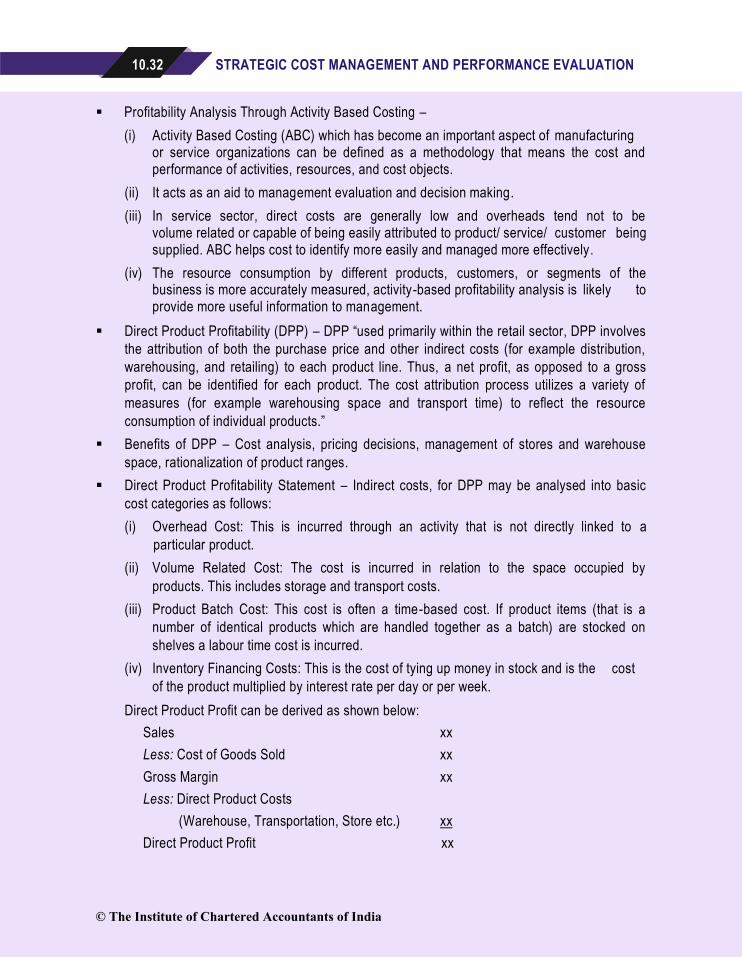
▪ Direct Product Profitability Statement – Indirect costs, for DPP may be analysed into basic
cost categories as follows:
(i) Overhead Cost: This is incurred through an activity that is not directly linked to a
particular product.
(ii) Volume Related Cost: The cost is incurred in relation to the space occupied by
products. This includes storage and transport costs.
(iii) Product Batch Cost: This cost is often a time-based cost. If product items (that is a
number of identical products which are handled together as a batch) are stocked on
shelves a labour time cost is incurred.
(iv) Inventory Financing Costs: This is the cost of tying up money in stock and is the cost
of the product multiplied by interest rate per day or per week.
Direct Product Profit can be derived as shown below:
Sales xx
Less: Cost of Goods Sold xx
Gross Margin xx
Less: Direct Product Costs
(Warehouse, Transportation, Store etc.) xx
Direct Product Profit xx
© The Institute of Chartered Accountants of India

STRATEGIC ANALYSIS OF OPERATING INCOME 10.33
▪ Customer Profitability Analysis – In many organizations, it is just as important to cost
customers as it is to cost products. Different customers or groups of customers differ in their
profitability. Not all customers cost the same to serve even if they require the same products.
Some customers may be located a long way from the factory and transport may cost more.
▪ Benefits of Customer Profitability Analysis – Identification of profitable customers/ non-
profitable customers, provides a basis for constructive dialogue between buyer and seller to
improve margins.
▪ Activity Based Costing in Advanced Manufacturing Environment – In advanced manufacturing
environment, where support function overheads constitute a large share of total costs, ABC
provides more realistic and accurate product costing.
▪ Activity Based Cost Management (ABM) – A discipline that focuses on the management of
activities as the route to improving the value received by the customer and the profit achieved
by providing this value. This discipline includes cost driver analysis, ac tivity analysis, and
performance measurement.
▪ Value-Added Activities (VA) – The VA activities are those activities which are indispensable in
order to complete the process. The customers are usually willing to pay (in some way) for
these services. Eg. polishing furniture by a manufacturer dealing in furniture is a value- added
activity.
▪ Non-Value-Added Activities (NVA) – The NVA activity represents work that is not valued by
the external or internal customer. NVA activities do not improve the quality or fu nction of a
product or service, but they can adversely affect costs and prices. Non-Value Added activities
create waste, result in delay of some sort, add costs to the products or services and for which
the customer is not willing to pay. Moving materials and machine set up for a production run
are examples of NVA activities.
▪ Difference between ABC and ABM – The ABC refers to the technique for determining the cost
of activities and the output that those activities produce. ABM refers to the management
philosophy that focuses on the planning, execution and measurement of activities as the key
to competitive advantage
▪ Activity Based Budgeting (ABB) – Activity Based Budgeting is a process of planning and
controlling the expected activities for the organisation to derive a cost-effective budget that
meets forecast workload and agreed strategic goals.
© The Institute of Chartered Accountants of India
10.34 STRATEGIC COST MANAGEMENT AND PERFORMANCE EVALUATION
TEST YOUR KNOWLEDGE
Profitability Analysis
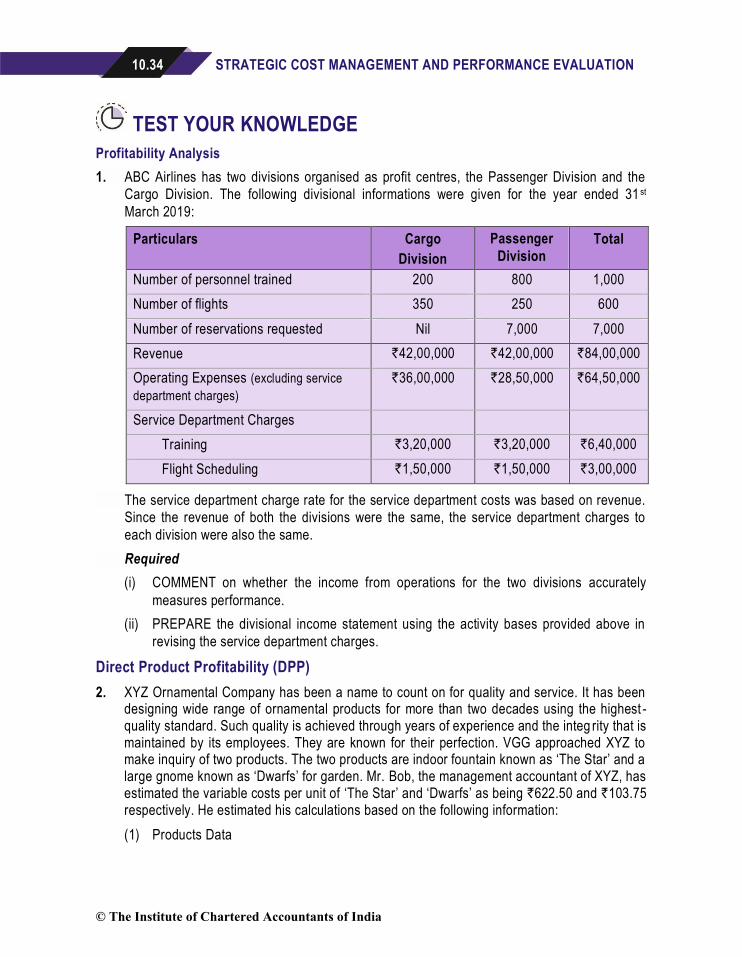
1. ABC Airlines has two divisions organised as profit centres, the Passenger Division and the
Cargo Division. The following divisional informations were given for the year ended 31 st
March 2019:
Particulars Cargo
Division
Passenger
Division
Total
Number of personnel trained 200 800 1,000
Number of flights 350 250 600
Number of reservations requested Nil 7,000 7,000
Revenue `42,00,000 `42,00,000 `84,00,000
Operating Expenses (excluding service
department charges)
`36,00,000 `28,50,000 `64,50,000
Service Department Charges
Training `3,20,000 `3,20,000 `6,40,000
Flight Scheduling `1,50,000 `1,50,000 `3,00,000
The service department charge rate for the service department costs was based on revenue.
Since the revenue of both the divisions were the same, the service department charges to
each division were also the same.
Required
(i) COMMENT on whether the income from operations for the two divisions accurately
measures performance.
(ii) PREPARE the divisional income statement using the activity bases provided above in
revising the service department charges.
Direct Product Profitability (DPP)
2. XYZ Ornamental Company has been a name to count on for quality and service. It has been designing wide range of ornamental products for more than two decades using the highest -quality standard. Such quality is achieved through years of experience and the integ rity that is maintained by its employees. They are known for their perfection. VGG approached XYZ to make inquiry of two products. The two products are indoor fountain known as ‘The Star’ and a large gnome known as ‘Dwarfs’ for garden. Mr. Bob, the management accountant of XYZ, has estimated the variable costs per unit of ‘The Star’ and ‘Dwarfs’ as being `622.50 and `103.75 respectively. He estimated his calculations based on the following information:
(1) Products Data
© The Institute of Chartered Accountants of India
STRATEGIC ANALYSIS OF OPERATING INCOME 10.35
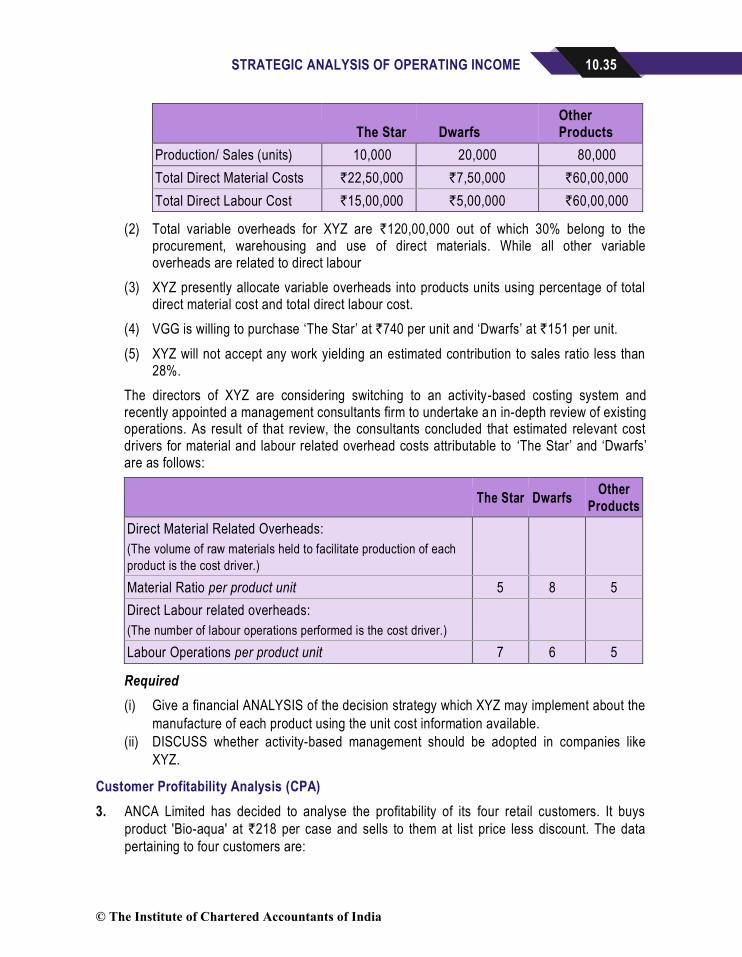
The Star Dwarfs Other Products
Production/ Sales (units) 10,000 20,000 80,000
Total Direct Material Costs `22,50,000 `7,50,000 `60,00,000
Total Direct Labour Cost `15,00,000 `5,00,000 `60,00,000
(2) Total variable overheads for XYZ are `120,00,000 out of which 30% belong to the procurement, warehousing and use of direct materials. While all other variable overheads are related to direct labour
(3) XYZ presently allocate variable overheads into products units using percentage of total direct material cost and total direct labour cost.
(4) VGG is willing to purchase ‘The Star’ at `740 per unit and ‘Dwarfs’ at `151 per unit.
(5) XYZ will not accept any work yielding an estimated contribution to sales ratio less than 28%.
The directors of XYZ are considering switching to an activity-based costing system and recently appointed a management consultants firm to undertake an in-depth review of existing operations. As result of that review, the consultants concluded that estimated relevant cost drivers for material and labour related overhead costs attributable to ‘The Star’ and ‘Dwarfs’ are as follows:
The Star Dwarfs
Other Products
Direct Material Related Overheads:
(The volume of raw materials held to facilitate production of each
product is the cost driver.)
Material Ratio per product unit 5 8 5
Direct Labour related overheads:
(The number of labour operations performed is the cost driver.)
Labour Operations per product unit 7 6 5
Required
(i) Give a financial ANALYSIS of the decision strategy which XYZ may implement about the
manufacture of each product using the unit cost information available.
(ii) DISCUSS whether activity-based management should be adopted in companies like
XYZ.
Customer Profitability Analysis (CPA)
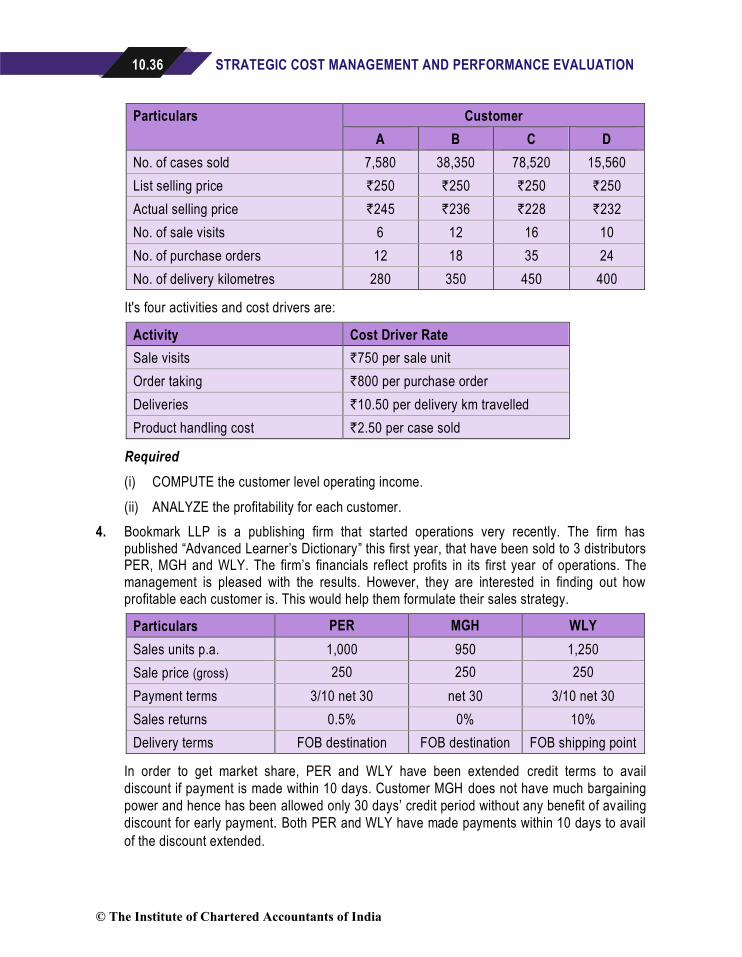
3. ANCA Limited has decided to analyse the profitability of its four retail customers. It buys
product 'Bio-aqua' at `218 per case and sells to them at list price less discount. The data
pertaining to four customers are:
© The Institute of Chartered Accountants of India
10.36 STRATEGIC COST MANAGEMENT AND PERFORMANCE EVALUATION
Particulars Customer
A B C D
No. of cases sold 7,580 38,350 78,520 15,560
List selling price `250 `250 `250 `250
Actual selling price `245 `236 `228 `232
No. of sale visits 6 12 16 10
No. of purchase orders 12 18 35 24
No. of delivery kilometres 280 350 450 400
It's four activities and cost drivers are:
Activity Cost Driver Rate
Sale visits `750 per sale unit
Order taking `800 per purchase order
Deliveries `10.50 per delivery km travelled
Product handling cost `2.50 per case sold
Required
(i) COMPUTE the customer level operating income.
(ii) ANALYZE the profitability for each customer.
4. Bookmark LLP is a publishing firm that started operations very recently. The firm has published “Advanced Learner’s Dictionary” this first year, that have been sold to 3 distributors PER, MGH and WLY. The firm’s financials reflect profits in its first year of operations. The management is pleased with the results. However, they are interested in finding out how profitable each customer is. This would help them formulate their sales strategy.
Particulars PER MGH WLY
Sales units p.a. 1,000 950 1,250
Sale price (gross) 250 250 250
Payment terms 3/10 net 30 net 30 3/10 net 30
Sales returns 0.5% 0% 10%
Delivery terms FOB destination FOB destination FOB shipping point
In order to get market share, PER and WLY have been extended credit terms to avail
discount if payment is made within 10 days. Customer MGH does not have much bargaining
power and hence has been allowed only 30 days’ credit period without any benefit of availing
discount for early payment. Both PER and WLY have made payments within 10 days to avail
of the discount extended.
© The Institute of Chartered Accountants of India
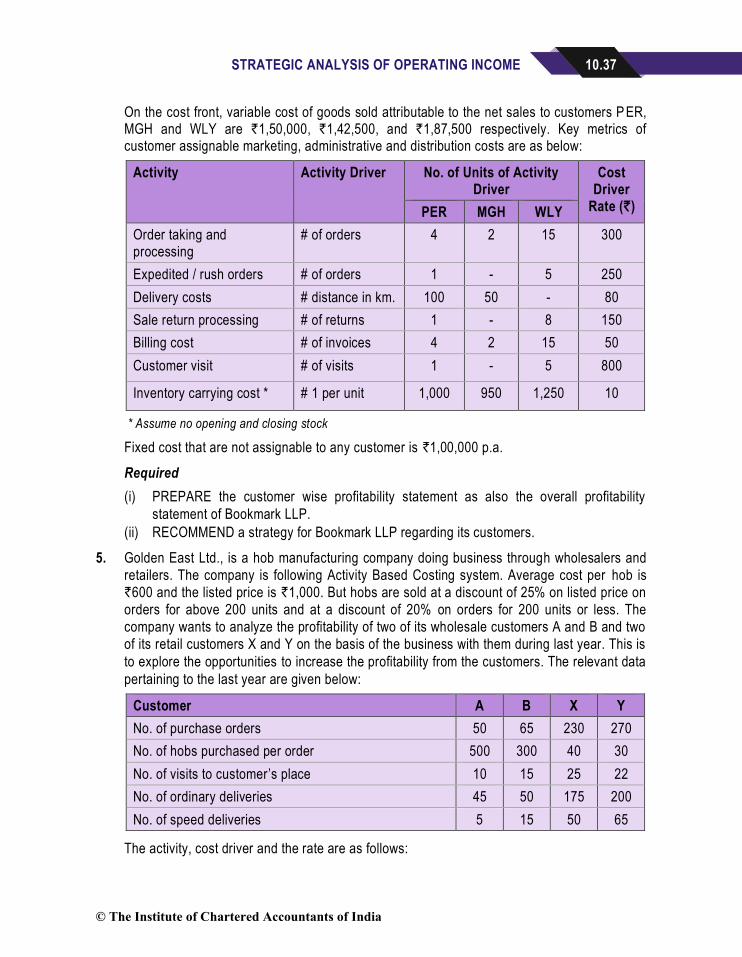
STRATEGIC ANALYSIS OF OPERATING INCOME 10.37
On the cost front, variable cost of goods sold attributable to the net sales to customers P ER, MGH and WLY are `1,50,000, `1,42,500, and `1,87,500 respectively. Key metrics of customer assignable marketing, administrative and distribution costs are as below:
Activity Activity Driver No. of Units of Activity Driver
Cost Driver
Rate (`) PER MGH WLY
Order taking and processing
# of orders 4 2 15 300
Expedited / rush orders # of orders 1 - 5 250
Delivery costs # distance in km. 100 50 - 80
Sale return processing # of returns 1 - 8 150
Billing cost # of invoices 4 2 15 50
Customer visit # of visits 1 - 5 800
Inventory carrying cost * # 1 per unit 1,000 950 1,250 10
* Assume no opening and closing stock
Fixed cost that are not assignable to any customer is `1,00,000 p.a.
Required
(i) PREPARE the customer wise profitability statement as also the overall profitability
statement of Bookmark LLP.
(ii) RECOMMEND a strategy for Bookmark LLP regarding its customers.
5. Golden East Ltd., is a hob manufacturing company doing business through wholesalers and
retailers. The company is following Activity Based Costing system. Average cost per hob is
`600 and the listed price is `1,000. But hobs are sold at a discount of 25% on listed price on
orders for above 200 units and at a discount of 20% on orders for 200 units or less. The
company wants to analyze the profitability of two of its wholesale customers A and B and two
of its retail customers X and Y on the basis of the business with them during last year. This is
to explore the opportunities to increase the profitability from the customers. The relevant data
pertaining to the last year are given below:
Customer A B X Y
No. of purchase orders 50 65 230 270
No. of hobs purchased per order 500 300 40 30
No. of visits to customer ’s place 10 15 25 22
No. of ordinary deliveries 45 50 175 200
No. of speed deliveries 5 15 50 65
The activity, cost driver and the rate are as follows:
© The Institute of Chartered Accountants of India
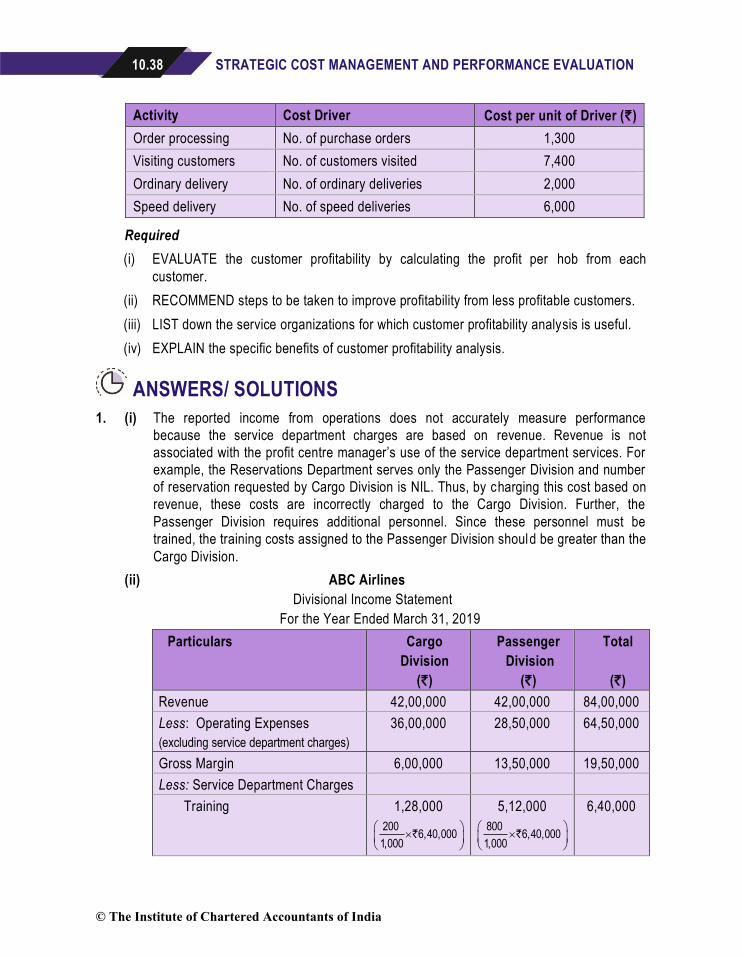
10.38 STRATEGIC COST MANAGEMENT AND PERFORMANCE EVALUATION
Activity Cost Driver Cost per unit of Driver (`)
Order processing No. of purchase orders 1,300
Visiting customers No. of customers visited 7,400
Ordinary delivery No. of ordinary deliveries 2,000
Speed delivery No. of speed deliveries 6,000
Required
(i) EVALUATE the customer profitability by calculating the profit per hob from each
customer.
(ii) RECOMMEND steps to be taken to improve profitability from less profitable customers.
(iii) LIST down the service organizations for which customer profitability analysis is useful.
(iv) EXPLAIN the specific benefits of customer profitability analysis.
ANSWERS/ SOLUTIONS
1. (i) The reported income from operations does not accurately measure performance
because the service department charges are based on revenue. Revenue is not
associated with the profit centre manager’s use of the service department services. For
example, the Reservations Department serves only the Passenger Division and number
of reservation requested by Cargo Division is NIL. Thus, by charging this cost based on
revenue, these costs are incorrectly charged to the Cargo Division. Further, the
Passenger Division requires additional personnel. Since these personnel must be
trained, the training costs assigned to the Passenger Division should be greater than the
Cargo Division.
(ii) ABC Airlines
Divisional Income Statement
For the Year Ended March 31, 2019
Particulars Cargo
Division
(`)
Passenger
Division
(`)
Total
(`)
Revenue 42,00,000 42,00,000 84,00,000
Less: Operating Expenses
(excluding service department charges)
36,00,000 28,50,000 64,50,000
Gross Margin 6,00,000 13,50,000 19,50,000
Less: Service Department Charges
Training 1,28,000
200 6,40,000
1,000
`
5,12,000
800 6,40,000
1,000
`
6,40,000
© The Institute of Chartered Accountants of India
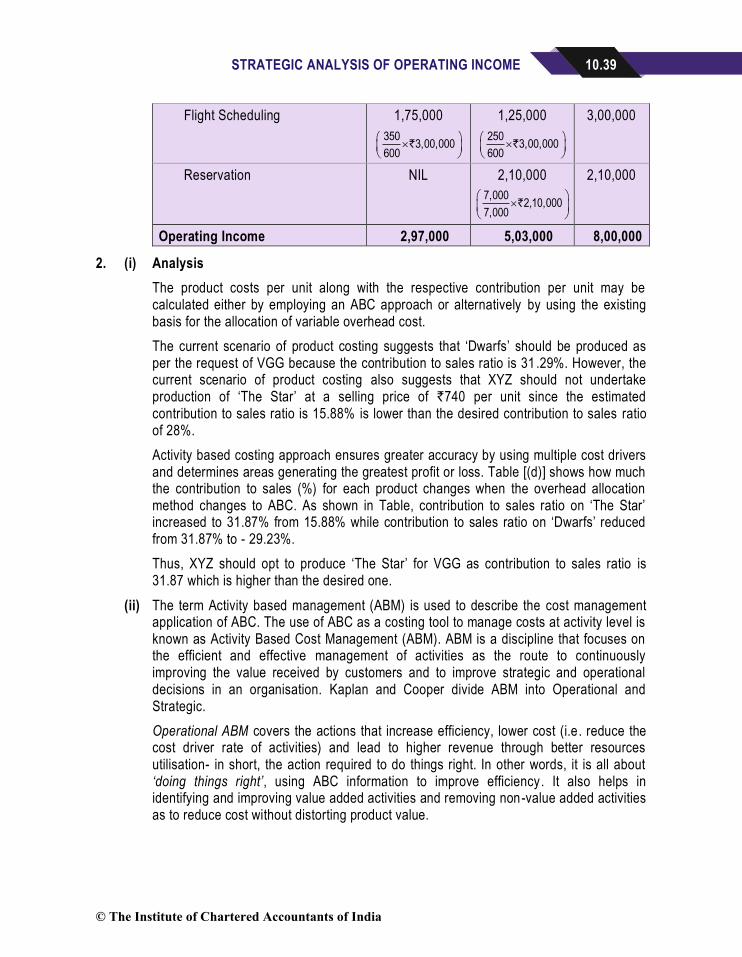
STRATEGIC ANALYSIS OF OPERATING INCOME 10.39
Flight Scheduling 1,75,000
3503,00,000
600
`
1,25,000
2503,00,000
600
`
3,00,000
Reservation NIL 2,10,000
7,0002,10,000
7,000
`
2,10,000
Operating Income 2,97,000 5,03,000 8,00,000
2. (i) Analysis
The product costs per unit along with the respective contribution per unit may be calculated either by employing an ABC approach or alternatively by using the existing basis for the allocation of variable overhead cost.
The current scenario of product costing suggests that ‘Dwarfs’ should be produced as per the request of VGG because the contribution to sales ratio is 31 .29%. However, the current scenario of product costing also suggests that XYZ should not undertake production of ‘The Star’ at a selling price of `740 per unit since the estimated contribution to sales ratio is 15.88% is lower than the desired contribution to sales ratio of 28%.
Activity based costing approach ensures greater accuracy by using multiple cost drivers and determines areas generating the greatest profit or loss. Table [(d)] shows how much the contribution to sales (%) for each product changes when the overhead allocation method changes to ABC. As shown in Table, contribution to sales ratio on ‘The Star’ increased to 31.87% from 15.88% while contribution to sales ratio on ‘Dwarfs’ reduced from 31.87% to - 29.23%.
Thus, XYZ should opt to produce ‘The Star’ for VGG as contribution to sales ratio is 31.87 which is higher than the desired one.
(ii) The term Activity based management (ABM) is used to describe the cost management application of ABC. The use of ABC as a costing tool to manage costs at activity level is known as Activity Based Cost Management (ABM). ABM is a discipline that focuses on the efficient and effective management of activities as the route to continuously improving the value received by customers and to improve strategic and operational decisions in an organisation. Kaplan and Cooper divide ABM into Operational and Strategic.
Operational ABM covers the actions that increase efficiency, lower cost (i.e. reduce the cost driver rate of activities) and lead to higher revenue through better resources utilisation- in short, the action required to do things right. In other words, it is all about ‘doing things right’, using ABC information to improve efficiency. It also helps in identifying and improving value added activities and removing non-value added activities as to reduce cost without distorting product value.
© The Institute of Chartered Accountants of India
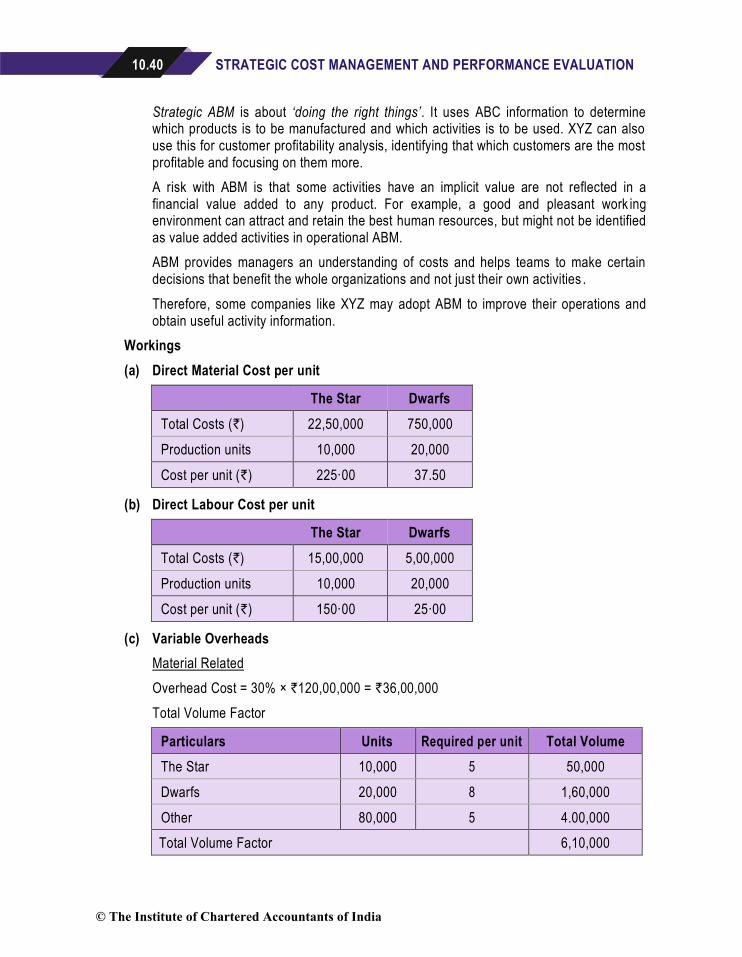
10.40 STRATEGIC COST MANAGEMENT AND PERFORMANCE EVALUATION
Strategic ABM is about ‘doing the right things’. It uses ABC information to determine which products is to be manufactured and which activities is to be used. XYZ can also use this for customer profitability analysis, identifying that which customers are the most profitable and focusing on them more.
A risk with ABM is that some activities have an implicit value are not reflected in a financial value added to any product. For example, a good and pleasant work ing environment can attract and retain the best human resources, but might not be identified as value added activities in operational ABM.
ABM provides managers an understanding of costs and helps teams to make certain decisions that benefit the whole organizations and not just their own activities .
Therefore, some companies like XYZ may adopt ABM to improve their operations and obtain useful activity information.
Workings
(a) Direct Material Cost per unit
The Star Dwarfs
Total Costs (`) 22,50,000 750,000
Production units 10,000 20,000
Cost per unit (`) 225·00 37.50
(b) Direct Labour Cost per unit
The Star Dwarfs
Total Costs (`) 15,00,000 5,00,000
Production units 10,000 20,000
Cost per unit (`) 150·00 25·00
(c) Variable Overheads
Material Related
Overhead Cost = 30% × `120,00,000 = `36,00,000
Total Volume Factor
Particulars Units Required per unit Total Volume
The Star 10,000 5 50,000
Dwarfs 20,000 8 1,60,000
Other 80,000 5 4.00,000
Total Volume Factor 6,10,000
© The Institute of Chartered Accountants of India
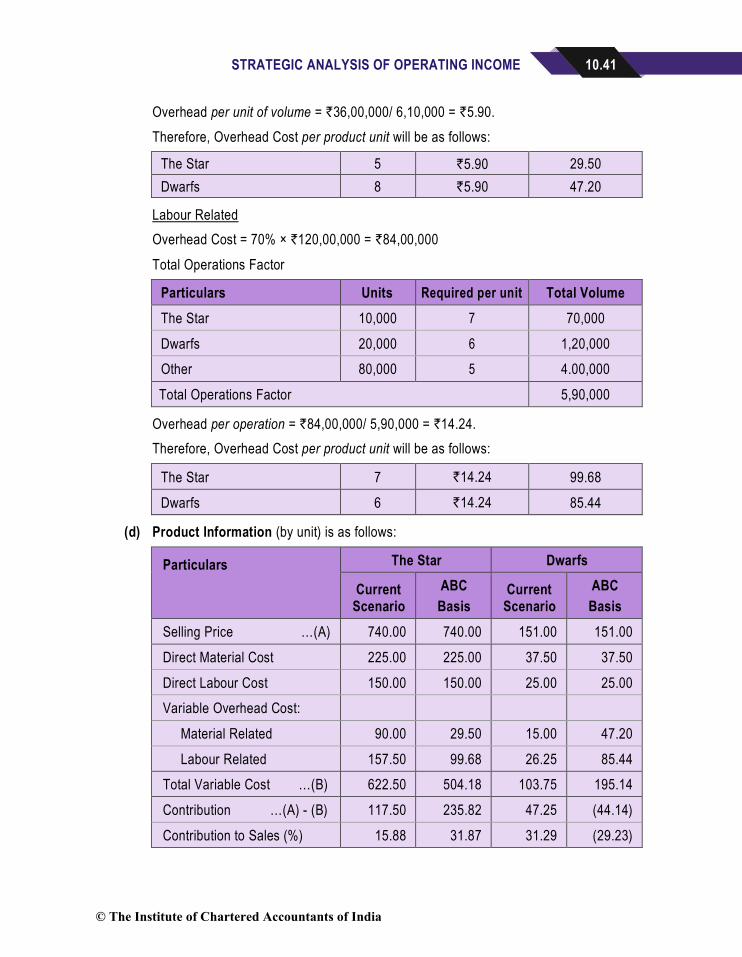
STRATEGIC ANALYSIS OF OPERATING INCOME 10.41
Overhead per unit of volume = `36,00,000/ 6,10,000 = `5.90.
Therefore, Overhead Cost per product unit will be as follows:
The Star 5 `5.90 29.50
Dwarfs 8 `5.90 47.20
Labour Related
Overhead Cost = 70% × `120,00,000 = `84,00,000
Total Operations Factor
Particulars Units Required per unit Total Volume
The Star 10,000 7 70,000
Dwarfs 20,000 6 1,20,000
Other 80,000 5 4.00,000
Total Operations Factor 5,90,000
Overhead per operation = `84,00,000/ 5,90,000 = `14.24.
Therefore, Overhead Cost per product unit will be as follows:
The Star 7 `14.24 99.68
Dwarfs 6 `14.24 85.44
(d) Product Information (by unit) is as follows:
Particulars
The Star Dwarfs
Current Scenario
ABC
Basis Current
Scenario
ABC
Basis
Selling Price …(A) 740.00 740.00 151.00 151.00
Direct Material Cost 225.00 225.00 37.50 37.50
Direct Labour Cost 150.00 150.00 25.00 25.00
Variable Overhead Cost:
Material Related 90.00 29.50 15.00 47.20
Labour Related 157.50 99.68 26.25 85.44
Total Variable Cost …(B) 622.50 504.18 103.75 195.14
Contribution …(A) - (B) 117.50 235.82 47.25 (44.14)
Contribution to Sales (%) 15.88 31.87 31.29 (29.23)
© The Institute of Chartered Accountants of India
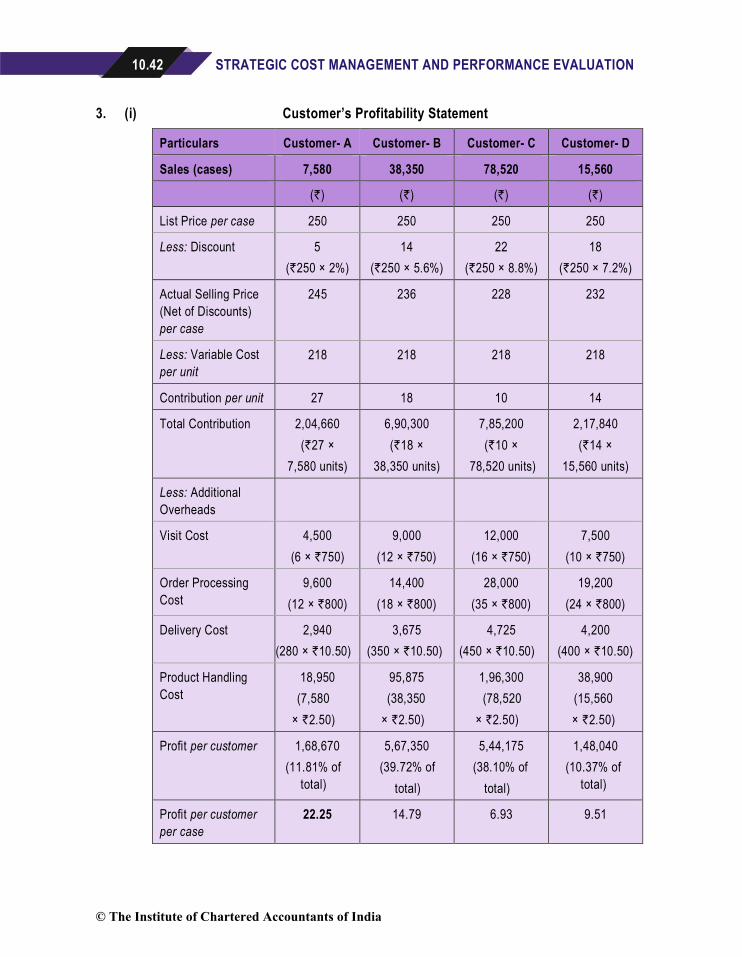
10.42 STRATEGIC COST MANAGEMENT AND PERFORMANCE EVALUATION
3. (i) Customer’s Profitability Statement
Particulars Customer- A Customer- B Customer- C Customer- D
Sales (cases) 7,580 38,350 78,520 15,560
(`) (`) (`) (`)
List Price per case 250 250 250 250
Less: Discount 5
(`250 × 2%)
14
(`250 × 5.6%)
22
(`250 × 8.8%)
18
(`250 × 7.2%)
Actual Selling Price
(Net of Discounts)
per case
245 236 228 232
Less: Variable Cost
per unit
218 218 218 218
Contribution per unit 27 18 10 14
Total Contribution 2,04,660
(`27 ×
7,580 units)
6,90,300
(`18 ×
38,350 units)
7,85,200
(`10 ×
78,520 units)
2,17,840
(`14 ×
15,560 units)
Less: Additional
Overheads
Visit Cost
4,500
(6 × `750)
9,000
(12 × `750)
12,000
(16 × `750)
7,500
(10 × `750)
Order Processing
Cost
9,600
(12 × `800)
14,400
(18 × `800)
28,000
(35 × `800)
19,200
(24 × `800)
Delivery Cost
2,940
(280 × `10.50)
3,675
(350 × `10.50)
4,725
(450 × `10.50)
4,200
(400 × `10.50)
Product Handling
Cost
18,950
(7,580
× `2.50)
95,875
(38,350
× `2.50)
1,96,300
(78,520
× `2.50)
38,900
(15,560
× `2.50)
Profit per customer 1,68,670
(11.81% of
total)
5,67,350
(39.72% of
total)
5,44,175
(38.10% of
total)
1,48,040
(10.37% of
total)
Profit per customer
per case
22.25 14.79 6.93 9.51
© The Institute of Chartered Accountants of India
STRATEGIC ANALYSIS OF OPERATING INCOME 10.43
(ii) Going by volume of cases sold, customer C is the biggest customer accounting for 56%
of total sales volume, followed by customer B (27%), customer D (11%) and customer A
(6%). However, in terms of profit per customer, Customer B is the most profitable
accounting for 39.72% of the cumulative customer profits of `14,28,235. Customer C
contributes to 38.10% of the same. Comparing customers B and C, customer B is more
profitable despite accounting for sales volume that is less than half of customer B
(customer C’s 56% of sale volume versus customer B ’s 27%). The primary reason for
this is because the discount given to customer C (8.8%) is higher than that given to
customer B (5.6%). The difference is terms of sale could be due to the fact that
customer C is the biggest customer and hence is able to negotiate for a higher discount.
Consequently, for each case sold, customer C gets an additional discount of `8 as
compared to customer B. This is reflected in the contribution generated per case. Sale
of one case to customer C generates `10 contribution versus sale of one case to
customer B generates `18 contribution. This has a huge impact on profitability. In terms
of profit generated per case sold, customer C has the lowest contribution at `6.93 per
case. The company may review whether this difference in terms of sale to each of its
customers is justified. If the discount to customer C at 8.8% was initially extended to
promote sales, negotiations can be made to reduce this to mutually acceptable rates.
However, care must be taken not to lose customer C to competitors.
Customer D is the least profitable accounting for just 10.37% of the total customer
profits. In terms of sale volume, the customer ranks third providing 11% volume.
However, the customer is not profitable because of the following reasons:
(a) A discount rate of 7.2% is provided to the customer. Each case sold after a
discount of `18 per case, generates a contribution per case of only `14 per case.
This is much lower compared to the contribution per case of customer A (`27 per
case) and customer B (`18 per case). This discount policy may need to be
reviewed. One scenario where such a high discount may be justified would be
where customer D supplies the products that it manufactures at a discounted rate
to a sister concern of the company. Therefore, at a parent company / overall level,
the higher discount rate for a low volume customer D may be justified.
(b) For a customer that provides 11% of volume, the number of site visits during the
year were 10. Customer C giving 56% of volume had only 16 visits and customer B
giving 27% of volume had only 12 visits. This indicates that customer D, although a
smaller customer, requires more visits than regular customers. Therefore, site visit
costs are higher for this customer. The reason for a higher handholding by the
company for this customer has to be analyzed. For example, one possible reason
could be that customer D requires the cases customized to its production
requirement. This may require more site visits by the company’s personnel. To
resolve this, due to the extra work involved, the company may wish to charge a
higher sale price for the cases customized for customer D. In another other
scenario, it may choose to charge the customer a fixed rate for each site visit.
© The Institute of Chartered Accountants of India
10.44 STRATEGIC COST MANAGEMENT AND PERFORMANCE EVALUATION
(c) For a customer that provides 11% of volume, the number of orders placed in a year
are 24. Customer C giving 56% of volume placed 35 orders in a year and customer
B giving 27% of volume placed 18 orders in a year. This indicates that customer D,
although a small customer, places orders more frequently than other larger
customers. Therefore, order processing costs are higher for customer D. The
company may revise ordering schedule for this customer or find out the reason for
higher proportion of purchase orders, in order to pass on some of the cost to the
customer. For example, let us say, customer D has an agreement with the
company to provide cases “just in time” resulting in more frequent orders as
compared to other customers. Therefore, the company is providing flexibility in
procurement to customer D. For this convenience, it may pass on some of the
ordering cost to customer D by way of a higher selling price or a lower discount.
(d) Again, given the volume, the number of deliveries to customer D (400) is at a
higher proportion compared to the larger customers C (450) and B (350). The
company may revise delivery schedule for this customer or find out the reason for
higher proportion of deliveries, in order to pass on some of the cost to the
customer. For example, let us say, customer D has an agreement with the
company to provide cases “just in time” resulting in more frequent deliveries as
compared to other customers. Therefore, the company is providing flexibility in
procurement to customer D. For this convenience, it may pass on some of the
delivery cost to customer D by way of a higher selling price or a lower discount.
Customer A is the smallest customer providing only 6% of total sale volume. However,
with a contribution per case at `27 per case and a profit per case at
`22.25 per case, it is the most profitable of all customers. The primary reason for this is
the discount of 2% offered is much lower than other customers. Each case sold to
customer A yields a contribution of `27 as compared to a contribution of
`10 from customer C, the biggest customer. Possible reason for a lower discount maybe
customer A, being a smaller player, may have lesser bargaining power compared to
other customers. If the company wishes to have a longer business relationsh ip with
customer A, it may wish to provide more favorable discount terms to this party.
However, since customers B and C are much larger customers, any benefit passed onto
customer A should not impact the company adversely in the long run. For example, in
order get more orders from customer A, the company gives a 10% discount to the party.
Consequently, the profitability of customer A will decrease. Let us say customer A
places huge orders due to which there are capacity constraints within the company.
Sales to customers B and C, the current larger customers, may be impacted. This could
affect the company adversely in terms of lost sales to customers B and C and loss of
business relationships with these parties. Therefore, careful consideration should be
given before extending discounts to improve sales from customer A.
© The Institute of Chartered Accountants of India
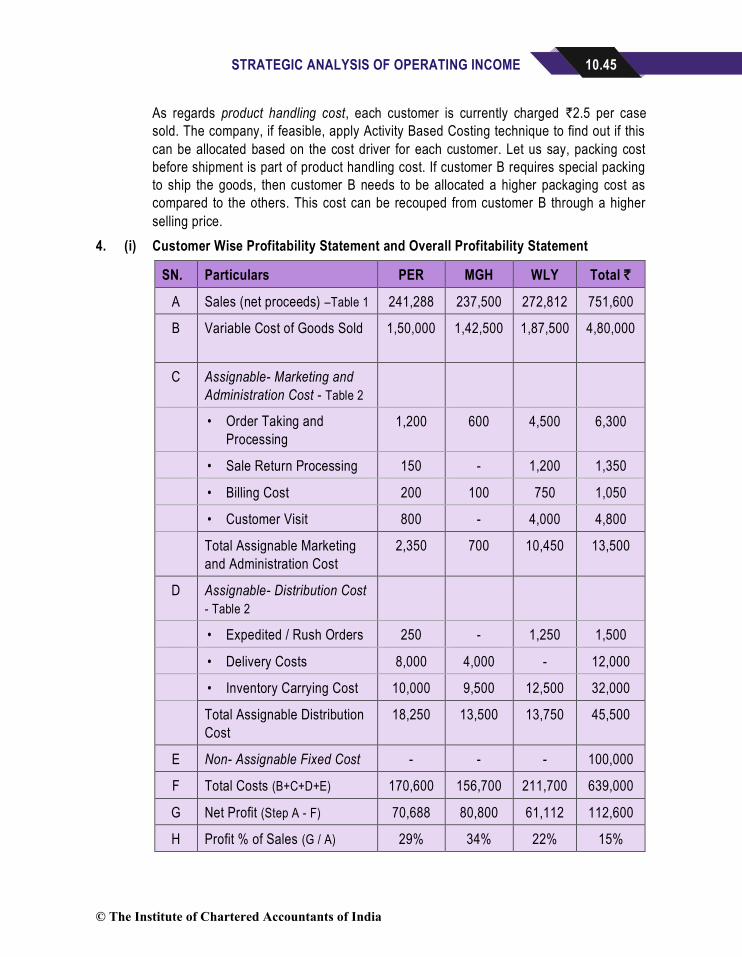
STRATEGIC ANALYSIS OF OPERATING INCOME 10.45
As regards product handling cost, each customer is currently charged `2.5 per case
sold. The company, if feasible, apply Activity Based Costing technique to find out if this
can be allocated based on the cost driver for each customer. Let us say, packing cost
before shipment is part of product handling cost. If customer B requires special packing
to ship the goods, then customer B needs to be allocated a higher packaging cost as
compared to the others. This cost can be recouped from customer B through a higher
selling price.
4. (i) Customer Wise Profitability Statement and Overall Profitability Statement
SN. Particulars PER MGH WLY Total `
A Sales (net proceeds) –Table 1 241,288 237,500 272,812 751,600
B Variable Cost of Goods Sold
1,50,000 1,42,500 1,87,500 4,80,000
C Assignable- Marketing and
Administration Cost - Table 2
• Order Taking and
Processing
1,200 600 4,500 6,300
• Sale Return Processing 150 - 1,200 1,350
• Billing Cost 200 100 750 1,050
• Customer Visit 800 - 4,000 4,800
Total Assignable Marketing
and Administration Cost
2,350 700 10,450 13,500
D Assignable- Distribution Cost
- Table 2
• Expedited / Rush Orders 250 - 1,250 1,500
• Delivery Costs 8,000 4,000 - 12,000
• Inventory Carrying Cost 10,000 9,500 12,500 32,000
Total Assignable Distribution
Cost
18,250 13,500 13,750 45,500
E Non- Assignable Fixed Cost - - - 100,000
F Total Costs (B+C+D+E) 170,600 156,700 211,700 639,000
G Net Profit (Step A - F) 70,688 80,800 61,112 112,600
H Profit % of Sales (G / A) 29% 34% 22% 15%
© The Institute of Chartered Accountants of India
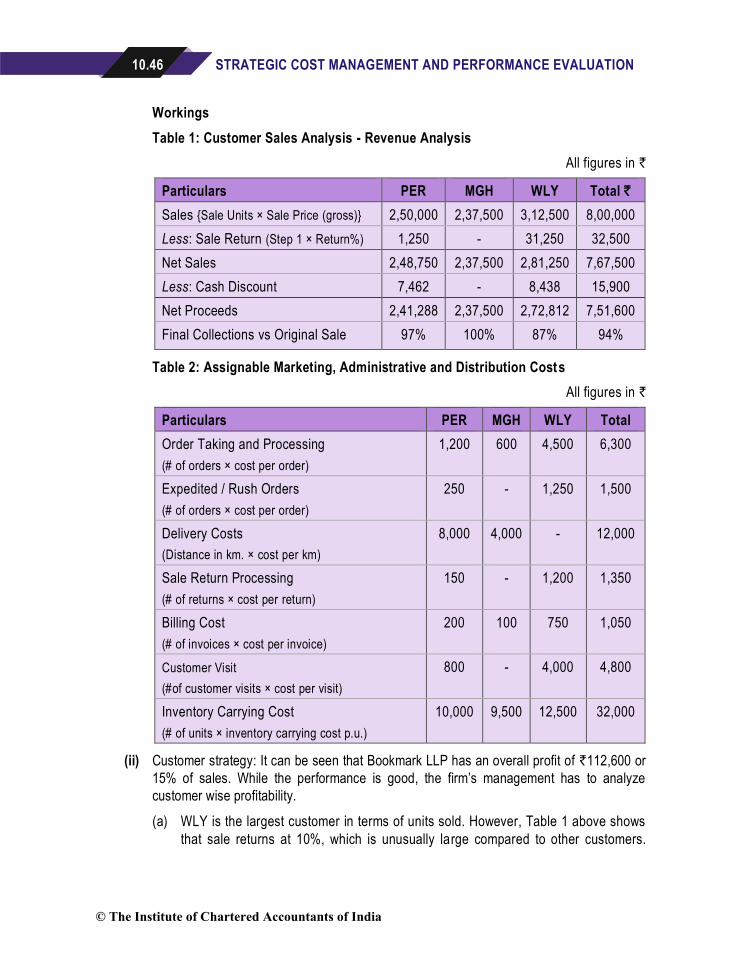
10.46 STRATEGIC COST MANAGEMENT AND PERFORMANCE EVALUATION
Workings
Table 1: Customer Sales Analysis - Revenue Analysis
All figures in `
Particulars PER MGH WLY Total `
Sales {Sale Units × Sale Price (gross)} 2,50,000 2,37,500 3,12,500 8,00,000
Less: Sale Return (Step 1 × Return%) 1,250 - 31,250 32,500
Net Sales 2,48,750 2,37,500 2,81,250 7,67,500
Less: Cash Discount 7,462 - 8,438 15,900
Net Proceeds 2,41,288 2,37,500 2,72,812 7,51,600
Final Collections vs Original Sale 97% 100% 87% 94%
Table 2: Assignable Marketing, Administrative and Distribution Costs
All figures in `
Particulars PER MGH WLY Total
Order Taking and Processing
(# of orders × cost per order)
1,200 600 4,500 6,300
Expedited / Rush Orders
(# of orders × cost per order)
250 - 1,250 1,500
Delivery Costs
(Distance in km. × cost per km)
8,000 4,000 - 12,000
Sale Return Processing
(# of returns × cost per return)
150 - 1,200 1,350
Billing Cost
(# of invoices × cost per invoice)
200 100 750 1,050
Customer Visit
(#of customer visits × cost per visit)
800 - 4,000 4,800
Inventory Carrying Cost
(# of units × inventory carrying cost p.u.)
10,000 9,500 12,500 32,000
(ii) Customer strategy: It can be seen that Bookmark LLP has an overall profit of `112,600 or
15% of sales. While the performance is good, the firm’s management has to analyze
customer wise profitability.
(a) WLY is the largest customer in terms of units sold. However, Table 1 above shows
that sale returns at 10%, which is unusually large compared to other customers.
© The Institute of Chartered Accountants of India
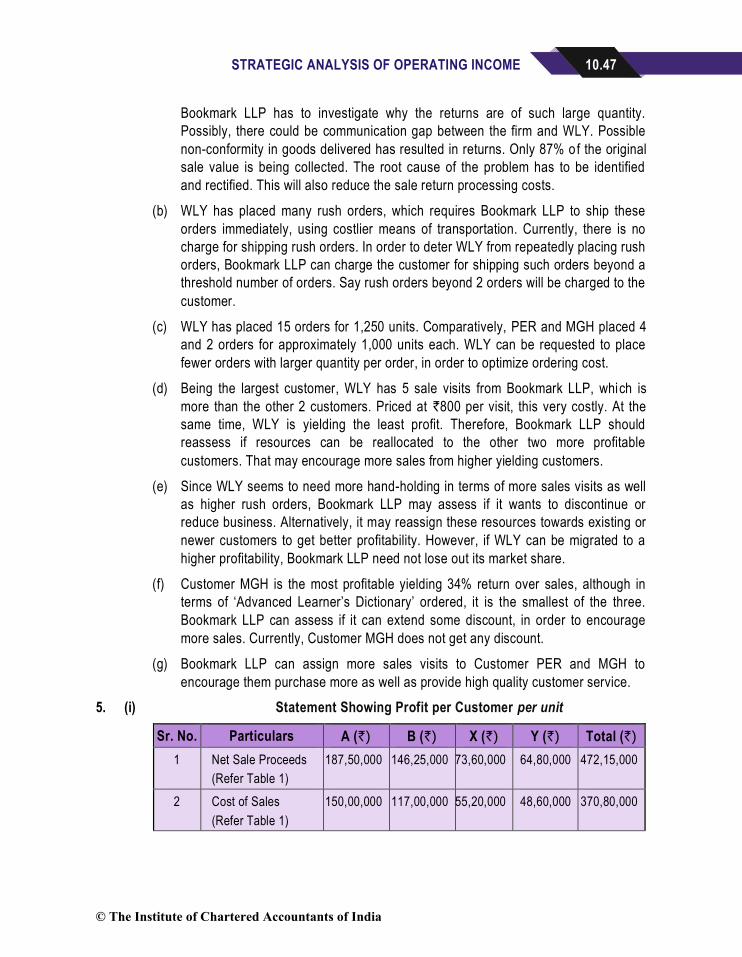
STRATEGIC ANALYSIS OF OPERATING INCOME 10.47
Bookmark LLP has to investigate why the returns are of such large quantity.
Possibly, there could be communication gap between the firm and WLY. Possible
non-conformity in goods delivered has resulted in returns. Only 87% of the original
sale value is being collected. The root cause of the problem has to be identified
and rectified. This will also reduce the sale return processing costs.
(b) WLY has placed many rush orders, which requires Bookmark LLP to ship these
orders immediately, using costlier means of transportation. Currently, there is no
charge for shipping rush orders. In order to deter WLY from repeatedly placing rush
orders, Bookmark LLP can charge the customer for shipping such orders beyond a
threshold number of orders. Say rush orders beyond 2 orders will be charged to the
customer.
(c) WLY has placed 15 orders for 1,250 units. Comparatively, PER and MGH placed 4
and 2 orders for approximately 1,000 units each. WLY can be requested to place
fewer orders with larger quantity per order, in order to optimize ordering cost.
(d) Being the largest customer, WLY has 5 sale visits from Bookmark LLP, which is
more than the other 2 customers. Priced at `800 per visit, this very costly. At the
same time, WLY is yielding the least profit. Therefore, Bookmark LLP should
reassess if resources can be reallocated to the other two more profitable
customers. That may encourage more sales from higher yielding customers.
(e) Since WLY seems to need more hand-holding in terms of more sales visits as well
as higher rush orders, Bookmark LLP may assess if it wants to discontinue or
reduce business. Alternatively, it may reassign these resources towards existing or
newer customers to get better profitability. However, if WLY can be migrated to a
higher profitability, Bookmark LLP need not lose out its market share.
(f) Customer MGH is the most profitable yielding 34% return over sales, although in
terms of ‘Advanced Learner’s Dictionary’ ordered, it is the smallest of the three.
Bookmark LLP can assess if it can extend some discount, in order to encourage
more sales. Currently, Customer MGH does not get any discount.
(g) Bookmark LLP can assign more sales visits to Customer PER and MGH to
encourage them purchase more as well as provide high quality customer service.
5. (i) Statement Showing Profit per Customer per unit
Sr. No. Particulars A (`) B (`) X (`) Y (`) Total (`)
1 Net Sale Proceeds
(Refer Table 1)
187,50,000 146,25,000 73,60,000 64,80,000 472,15,000
2 Cost of Sales
(Refer Table 1)
150,00,000 117,00,000 55,20,000 48,60,000 370,80,000
© The Institute of Chartered Accountants of India
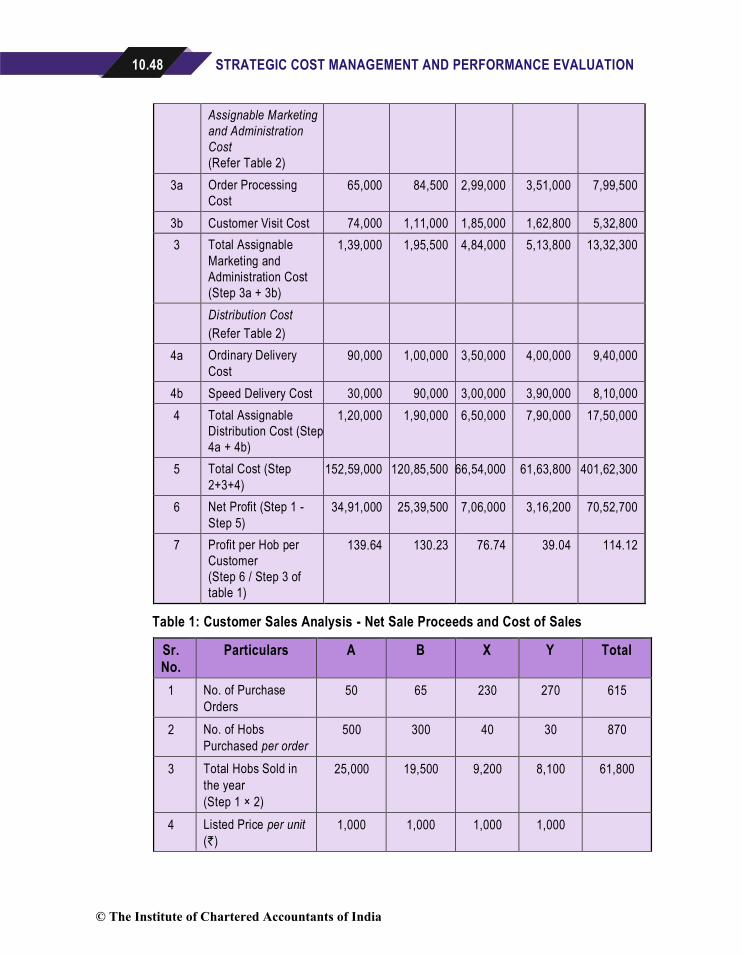
10.48 STRATEGIC COST MANAGEMENT AND PERFORMANCE EVALUATION
Assignable Marketing
and Administration
Cost
(Refer Table 2)
3a Order Processing
Cost 65,000 84,500 2,99,000 3,51,000 7,99,500
3b Customer Visit Cost 74,000 1,11,000 1,85,000 1,62,800 5,32,800
3 Total Assignable
Marketing and
Administration Cost
(Step 3a + 3b)
1,39,000 1,95,500 4,84,000 5,13,800 13,32,300
Distribution Cost
(Refer Table 2)
4a Ordinary Delivery
Cost
90,000 1,00,000 3,50,000 4,00,000 9,40,000
4b Speed Delivery Cost 30,000 90,000 3,00,000 3,90,000 8,10,000
4 Total Assignable
Distribution Cost (Step
4a + 4b)
1,20,000 1,90,000 6,50,000 7,90,000 17,50,000
5 Total Cost (Step
2+3+4)
152,59,000 120,85,500 66,54,000 61,63,800 401,62,300
6 Net Profit (Step 1 -
Step 5)
34,91,000 25,39,500 7,06,000 3,16,200 70,52,700
7 Profit per Hob per
Customer
(Step 6 / Step 3 of
table 1)
139.64
130.23
76.74
39.04
114.12
Table 1: Customer Sales Analysis - Net Sale Proceeds and Cost of Sales
Sr. No.
Particulars A B X Y Total
1 No. of Purchase
Orders
50 65 230 270 615
2 No. of Hobs
Purchased per order
500 300 40 30 870
3 Total Hobs Sold in
the year
(Step 1 × 2)
25,000
19,500
9,200
8,100
61,800
4 Listed Price per unit
(`)
1,000 1,000 1,000 1,000
© The Institute of Chartered Accountants of India
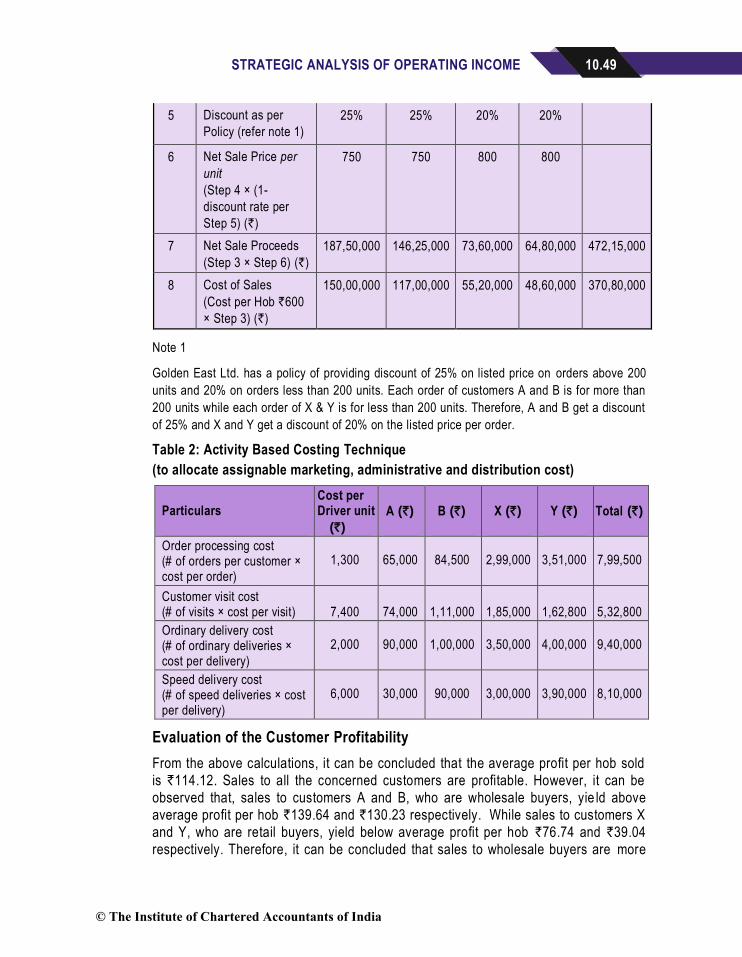
STRATEGIC ANALYSIS OF OPERATING INCOME 10.49
5 Discount as per
Policy (refer note 1)
25% 25% 20% 20%
6 Net Sale Price per
unit
(Step 4 × (1-
discount rate per
Step 5) (`)
750
750
800
800
7 Net Sale Proceeds
(Step 3 × Step 6) (`)
187,50,000 146,25,000 73,60,000 64,80,000 472,15,000
8 Cost of Sales
(Cost per Hob `600
× Step 3) (`)
150,00,000
117,00,000
55,20,000
48,60,000
370,80,000
Note 1
Golden East Ltd. has a policy of providing discount of 25% on listed price on orders above 200
units and 20% on orders less than 200 units. Each order of customers A and B is for more than
200 units while each order of X & Y is for less than 200 units. Therefore, A and B get a discount
of 25% and X and Y get a discount of 20% on the listed price per order.
Table 2: Activity Based Costing Technique
(to allocate assignable marketing, administrative and distribution cost)
Particulars
Cost per Driver unit
(`)
A (`)
B (`)
X (`)
Y (`)
Total (`)
Order processing cost (# of orders per customer × cost per order)
1,300
65,000
84,500
2,99,000
3,51,000
7,99,500
Customer visit cost (# of visits × cost per visit) 7,400 74,000 1,11,000 1,85,000 1,62,800 5,32,800 Ordinary delivery cost (# of ordinary deliveries × cost per delivery)
2,000
90,000
1,00,000
3,50,000
4,00,000
9,40,000
Speed delivery cost (# of speed deliveries × cost per delivery)
6,000
30,000
90,000
3,00,000
3,90,000
8,10,000
Evaluation of the Customer Profitability
From the above calculations, it can be concluded that the average profit per hob sold
is `114.12. Sales to all the concerned customers are profitable. However, it can be
observed that, sales to customers A and B, who are wholesale buyers, yie ld above
average profit per hob `139.64 and `130.23 respectively. While sales to customers X
and Y, who are retail buyers, yield below average profit per hob `76.74 and `39.04
respectively. Therefore, it can be concluded that sales to wholesale buyers are more
© The Institute of Chartered Accountants of India
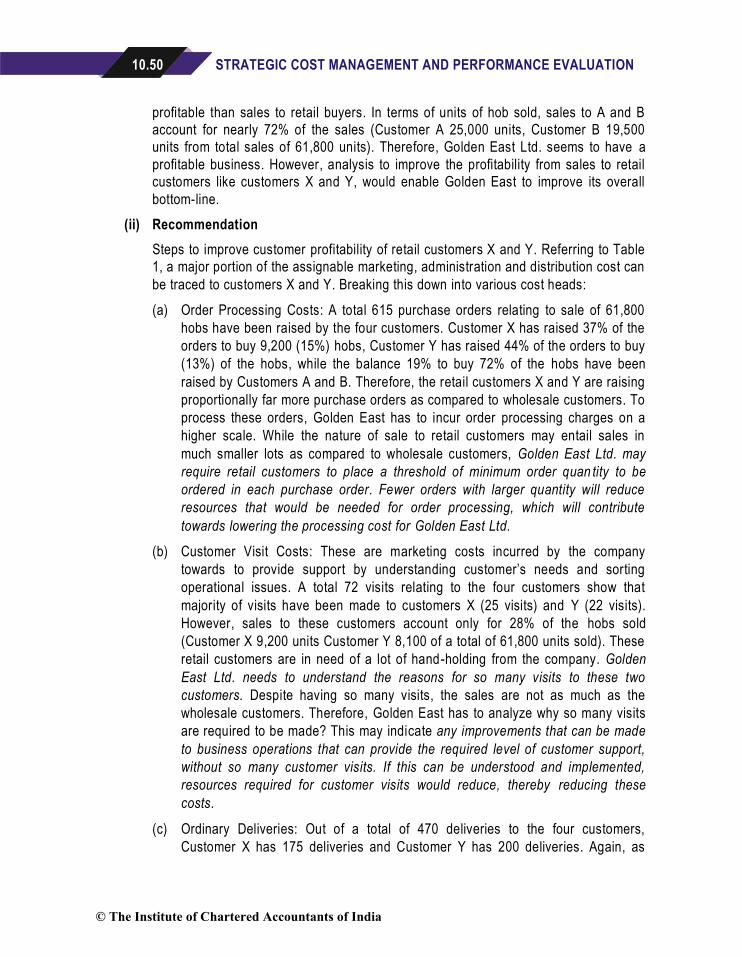
10.50 STRATEGIC COST MANAGEMENT AND PERFORMANCE EVALUATION
profitable than sales to retail buyers. In terms of units of hob sold, sales to A and B
account for nearly 72% of the sales (Customer A 25,000 units, Customer B 19,500
units from total sales of 61,800 units). Therefore, Golden East Ltd. seems to have a
profitable business. However, analysis to improve the profitability from sales to retail
customers like customers X and Y, would enable Golden East to improve its overall
bottom-line.
(ii) Recommendation
Steps to improve customer profitability of retail customers X and Y. Referring to Table
1, a major portion of the assignable marketing, administration and distribution cost can
be traced to customers X and Y. Breaking this down into various cost heads:
(a) Order Processing Costs: A total 615 purchase orders relating to sale of 61,800
hobs have been raised by the four customers. Customer X has raised 37% of the
orders to buy 9,200 (15%) hobs, Customer Y has raised 44% of the orders to buy
(13%) of the hobs, while the balance 19% to buy 72% of the hobs have been
raised by Customers A and B. Therefore, the retail customers X and Y are raising
proportionally far more purchase orders as compared to wholesale customers. To
process these orders, Golden East has to incur order processing charges on a
higher scale. While the nature of sale to retail customers may entail sales in
much smaller lots as compared to wholesale customers, Golden East Ltd. may
require retail customers to place a threshold of minimum order quan tity to be
ordered in each purchase order. Fewer orders with larger quantity will reduce
resources that would be needed for order processing, which will contribute
towards lowering the processing cost for Golden East Ltd.
(b) Customer Visit Costs: These are marketing costs incurred by the company
towards to provide support by understanding customer’s needs and sorting
operational issues. A total 72 visits relating to the four customers show that
majority of visits have been made to customers X (25 visits) and Y (22 visits).
However, sales to these customers account only for 28% of the hobs sold
(Customer X 9,200 units Customer Y 8,100 of a total of 61,800 units sold). These
retail customers are in need of a lot of hand-holding from the company. Golden
East Ltd. needs to understand the reasons for so many visits to these two
customers. Despite having so many visits, the sales are not as much as the
wholesale customers. Therefore, Golden East has to analyze why so many visits
are required to be made? This may indicate any improvements that can be made
to business operations that can provide the required level of customer support,
without so many customer visits. If this can be understood and implemented,
resources required for customer visits would reduce, thereby reducing these
costs.
(c) Ordinary Deliveries: Out of a total of 470 deliveries to the four customers,
Customer X has 175 deliveries and Customer Y has 200 deliveries. Again, as
© The Institute of Chartered Accountants of India
STRATEGIC ANALYSIS OF OPERATING INCOME 10.51
explained above in point (a), retail customer orders lesser quantity as compared
to wholesale customers. Therefore, the number of deliveries will be more.
However, if Golden East Ltd. requires customers to order a minimum quantity
each time, this can reduce the number of deliveries. This would reduce the
resources required for making deliveries, thereby reducing the costs as well.
(d) Speed Deliveries: These are rush orders placed by customers to meet their
urgent and immediate requirements. Since demand is required to be met in a
short time span, Golden East may have to employ faster means of delivery. In the
given problem, the cost of speed delivery is thrice the cost of an ordinary
delivery. Out of a total of 135 deliveries, Customer X has 50 and Customer Y has
65 speed deliveries. At the same time, they account for only 28% of hob sales.
Golden East Ltd. can require these customers to place of minimum order amount
as part of their regular orders. This could reduce the need for speed deliveries. It
could also make speed deliveries chargeable, if the number of such orders
exceed a certain threshold say 10 orders in a year. This will enable Golden East
Ltd. to recover some portion of the costs that it incurs to make these deliveries.
(iii) List of service organizations using customer profitability analysis:
(a) Financial institutions like Banks and Insurance Companies.
(b) Hospitality services like Hotels, Travel Agents, and Tour Operators.
(c) Professional services like Audit and Accounting Firms, Law Firms, Consultancy
Firms like IT Consultancy, Management Consultancy.
(d) Hospitals and Healthcare providers.
(e) Logistics and Freight Companies that transport goods to various destinations.
(iv) Benefits of Customer Profitability Analysis:
(a) It helps the supplier to identify which customers are eroding overall profitability and
which customers are contributing to it.
(b) It can help to provide a basis for constructive dialogue between buyer and seller to
improve margins.
© The Institute of Chartered Accountants of India