Embed Size (px)
Citation preview
This presentation does not contain any proprietary, confidential, or otherwise restricted information
Strategic Analysis Support
WBS (4.1.1.30)
March 9, 2021
Data, Model and Analysis
Ling Tao, Eric Tan, Yimin Zhang and Avantika Singh
National Renewable Energy Laboratory (NREL)
NREL | 2
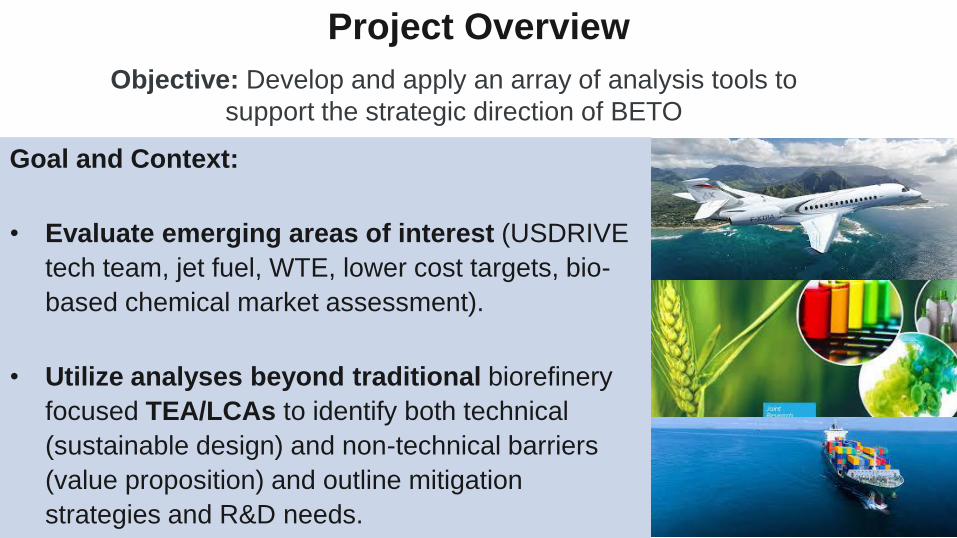
Project Overview
Objective: Develop and apply an array of analysis tools to
support the strategic direction of BETO
Goal and Context:
• Evaluate emerging areas of interest (USDRIVE
tech team, jet fuel, WTE, lower cost targets, bio-
based chemical market assessment).
• Utilize analyses beyond traditional biorefinery
focused TEA/LCAs to identify both technical
(sustainable design) and non-technical barriers
(value proposition) and outline mitigation
strategies and R&D needs.
NREL | 3
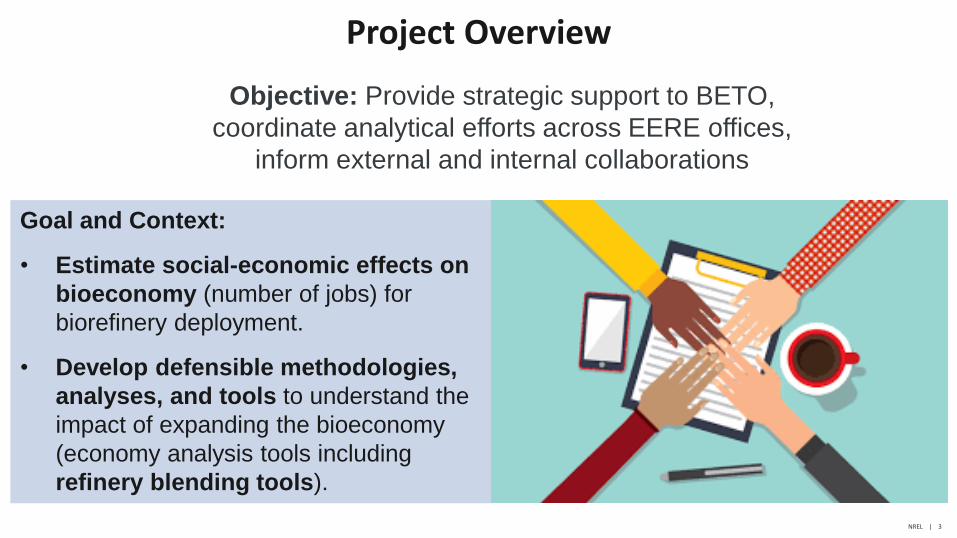
Project Overview
Objective: Provide strategic support to BETO,
coordinate analytical efforts across EERE offices,
inform external and internal collaborations
Goal and Context:
• Estimate social-economic effects on
bioeconomy (number of jobs) for
biorefinery deployment.
• Develop defensible methodologies,
analyses, and tools to understand the
impact of expanding the bioeconomy
(economy analysis tools including
refinery blending tools).

NREL | 4
1. Management: Task Structure
Tool development for stakeholder (e.g., local
governments, biofuel developers)
Inform BETO of potential socio-economic benefits
Sustainable
Process Design
(Eric Tan)
Jobs Analysis and
Model Development
(Yimin Zhang)
Strategic TEA
(Ling Tao)
Strategic Support
(Ling Tao)
BETO Conversion team
BETO/VTO/FCTO and ATB SupportEngagement with stakeholders to review approach & results
Supports GREET, BSM, JEDI
Engagement with CAAFI, FAA, Universities
BETO Conversion team
Assess impacts of biomass-derived blendstocks with
petroleum-derived blendstocks, Co-Optima, BSM
Outputs Inform
Methodology implementation for stakeholder (industry)
BETO Conversion team
Refinery
Optimization
(Avantika Singh)
Integrate multiple dimensions of strategic support for BETO and for external and
internal stakeholders
Input from:
BETO
Stakeholders
Collaborators
NREL | 5
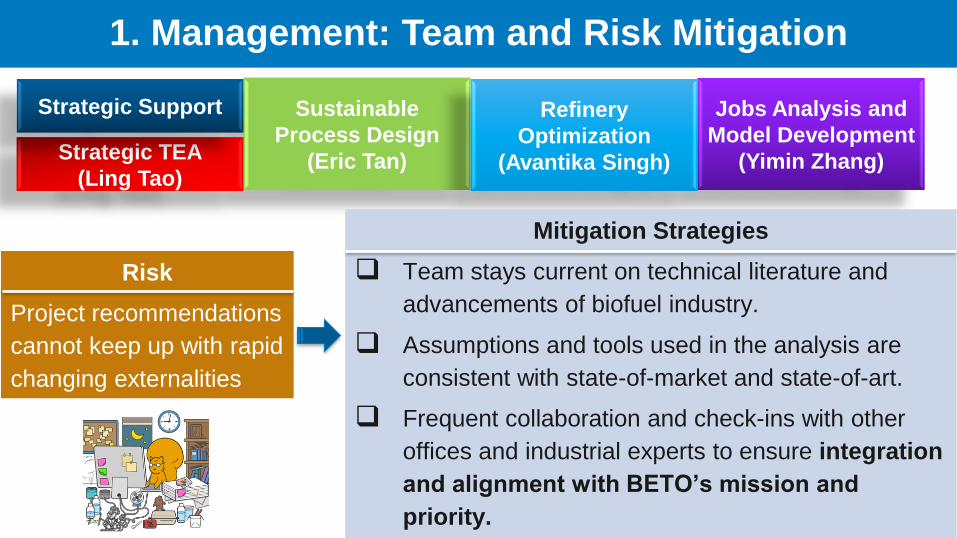
1. Management: Team and Risk Mitigation
Sustainable
Process Design
(Eric Tan)
Jobs Analysis and
Model Development
(Yimin Zhang)Strategic TEA
(Ling Tao)
Strategic Support Refinery
Optimization
(Avantika Singh)
Risk
Project recommendations
cannot keep up with rapid
changing externalities
Mitigation Strategies
❑ Team stays current on technical literature and
advancements of biofuel industry.
❑ Assumptions and tools used in the analysis are
consistent with state-of-market and state-of-art.
❑ Frequent collaboration and check-ins with other
offices and industrial experts to ensure integration
and alignment with BETO’s mission and
priority.

NREL | 6
1. Management
Outcomes Support and Bridge a Range of DOE BETO Projects and Beyond
Strategic Support Project
Feedstock Conversion
Interface Consortium Performance
Advantaged Bioproducts
and Agile Biofoundry
WTE, Marine, SAF and
E2M
Core Conversion Analyses
EPA RtC3, GREET, BEIOM
BSM, BOTTLE
Co-Optima,
USDRIVE
Support FCIC on failure
modes and effect analysis
Supply screening
metrics for bioproducts
Provide initial scoping
study and TEA for WTE,
Marine, SAF and E2M
Integrate for consistency and best
practices taken
for TEA (error bars and coproducts)
and LCA (coproduct methodologies)
Provide process and
social economic data
Provide key TEA and
TRL data for
emerging pathways
Develop models to be
utilized in Co-Optima
(JEDI, Refinery Blending)
and USDRIVE (TEA)
NREL | 7
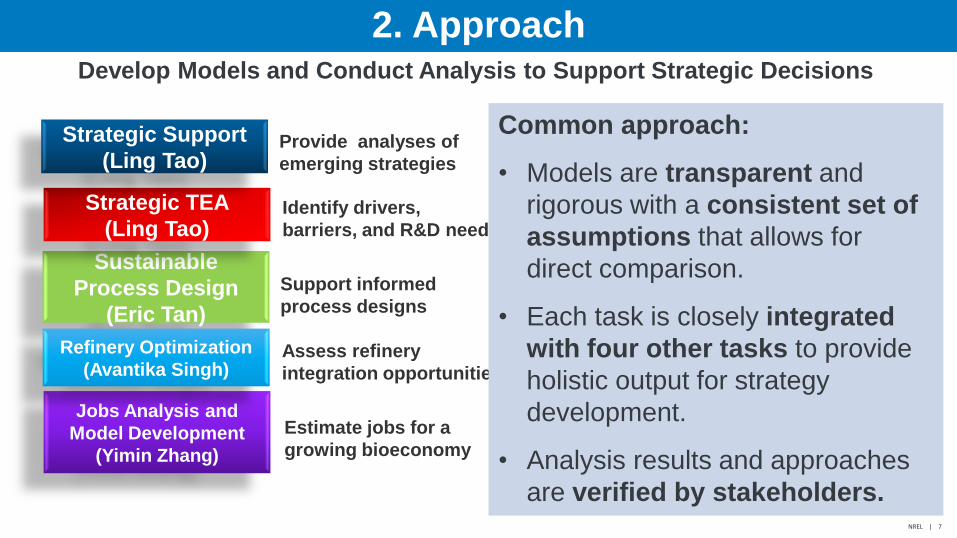
2. ApproachDevelop Models and Conduct Analysis to Support Strategic Decisions
Estimate jobs for a
growing bioeconomy
Support informed
process designs
Identify drivers,
barriers, and R&D needs
Provide analyses of
emerging strategies
Assess refinery
integration opportunities
Sustainable
Process Design
(Eric Tan)
Jobs Analysis and
Model Development
(Yimin Zhang)
Strategic TEA
(Ling Tao)
Strategic Support
(Ling Tao)
Refinery Optimization
(Avantika Singh)
Common approach:
• Models are transparent and
rigorous with a consistent set of
assumptions that allows for
direct comparison.
• Each task is closely integrated
with four other tasks to provide
holistic output for strategy
development.
• Analysis results and approaches
are verified by stakeholders.
NREL | 8
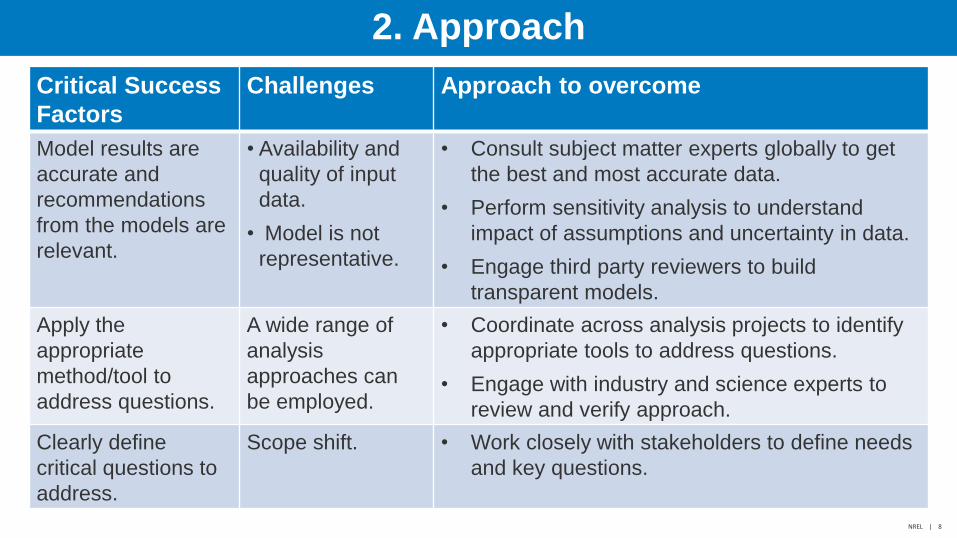
2. Approach
Critical Success
Factors
Challenges Approach to overcome
Model results are
accurate and
recommendations
from the models are
relevant.
• Availability and
quality of input
data.
• Model is not
representative.
• Consult subject matter experts globally to get
the best and most accurate data.
• Perform sensitivity analysis to understand
impact of assumptions and uncertainty in data.
• Engage third party reviewers to build
transparent models.
Apply the
appropriate
method/tool to
address questions.
A wide range of
analysis
approaches can
be employed.
• Coordinate across analysis projects to identify
appropriate tools to address questions.
• Engage with industry and science experts to
review and verify approach.
Clearly define
critical questions to
address.
Scope shift. • Work closely with stakeholders to define needs
and key questions.
NREL | 9
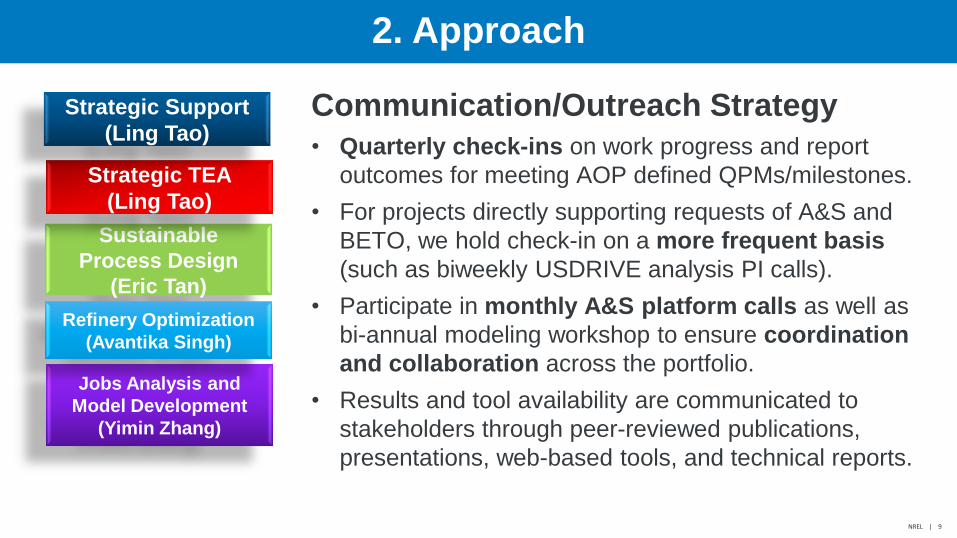
2. Approach
Communication/Outreach Strategy
• Quarterly check-ins on work progress and report
outcomes for meeting AOP defined QPMs/milestones.
• For projects directly supporting requests of A&S and
BETO, we hold check-in on a more frequent basis
(such as biweekly USDRIVE analysis PI calls).
• Participate in monthly A&S platform calls as well as
bi-annual modeling workshop to ensure coordination
and collaboration across the portfolio.
• Results and tool availability are communicated to
stakeholders through peer-reviewed publications,
presentations, web-based tools, and technical reports.
Sustainable
Process Design
(Eric Tan)
Jobs Analysis and
Model Development
(Yimin Zhang)
Strategic TEA
(Ling Tao)
Strategic Support
(Ling Tao)
Refinery Optimization
(Avantika Singh)
NREL | 10
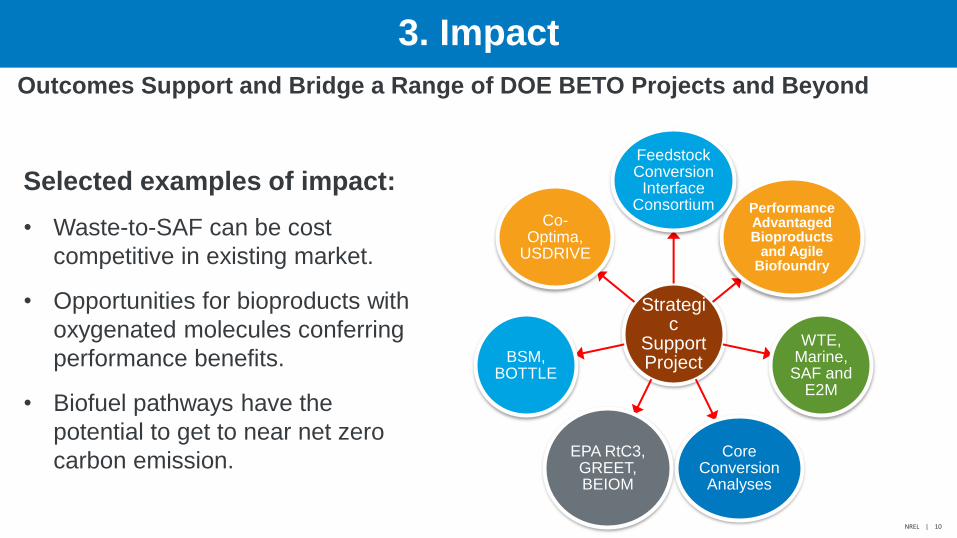
Relevance 3. Impact
Strategic
Support Project
Feedstock Conversion
Interface Consortium Performance
Advantaged Bioproducts
and Agile Biofoundry
WTE, Marine,
SAF and E2M
Core Conversion Analyses
EPA RtC3, GREET, BEIOM
BSM, BOTTLE
Co-Optima,
USDRIVE
Selected examples of impact:
• Waste-to-SAF can be cost
competitive in existing market.
• Opportunities for bioproducts with
oxygenated molecules conferring
performance benefits.
• Biofuel pathways have the
potential to get to near net zero
carbon emission.
Outcomes Support and Bridge a Range of DOE BETO Projects and Beyond
NREL | 11
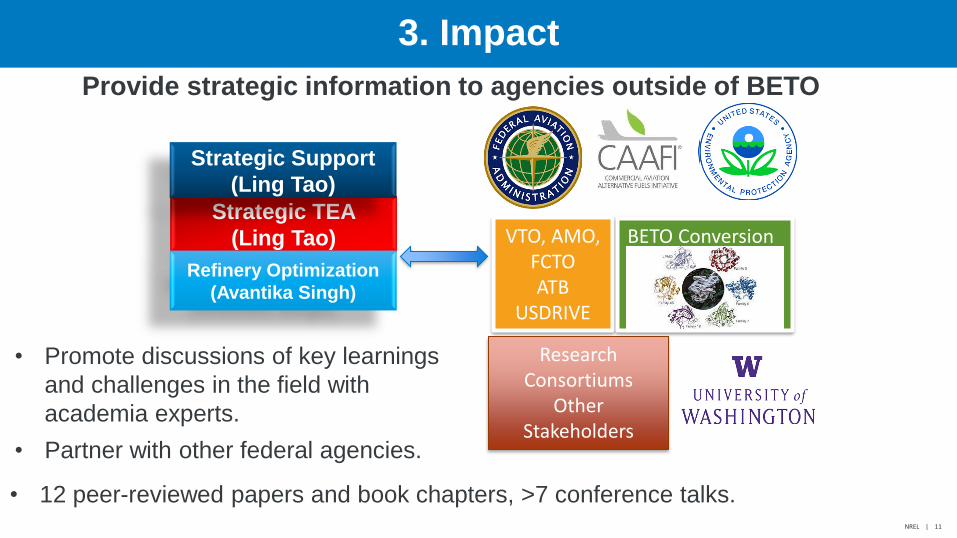
Relevance 3. Impact
Strategic TEA
(Ling Tao)
Refinery Optimization
(Avantika Singh)
Strategic Support
(Ling Tao)
VTO, AMO, FCTOATB
USDRIVE
Research Consortiums
Other Stakeholders
BETO Conversion
• Promote discussions of key learnings
and challenges in the field with
academia experts.
• Partner with other federal agencies.
• 12 peer-reviewed papers and book chapters, >7 conference talks.
Provide strategic information to agencies outside of BETO
NREL | 12
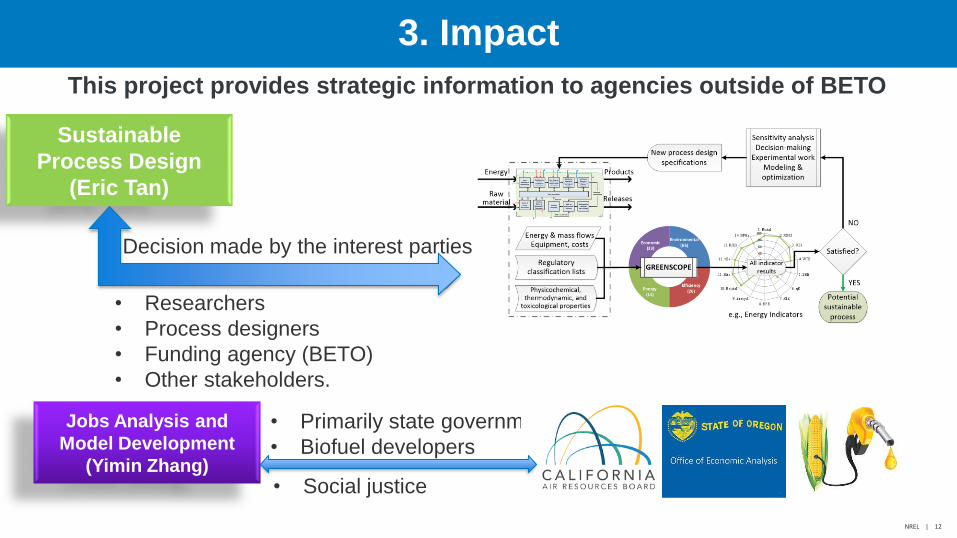
Relevance 3. Impact
Sustainable
Process Design
(Eric Tan)
• Researchers
• Process designers
• Funding agency (BETO)
• Other stakeholders.
Decision made by the interest parties
Jobs Analysis and
Model Development
(Yimin Zhang)
• Primarily state governments
• Biofuel developers
• Social justice
This project provides strategic information to agencies outside of BETO
NREL | 13
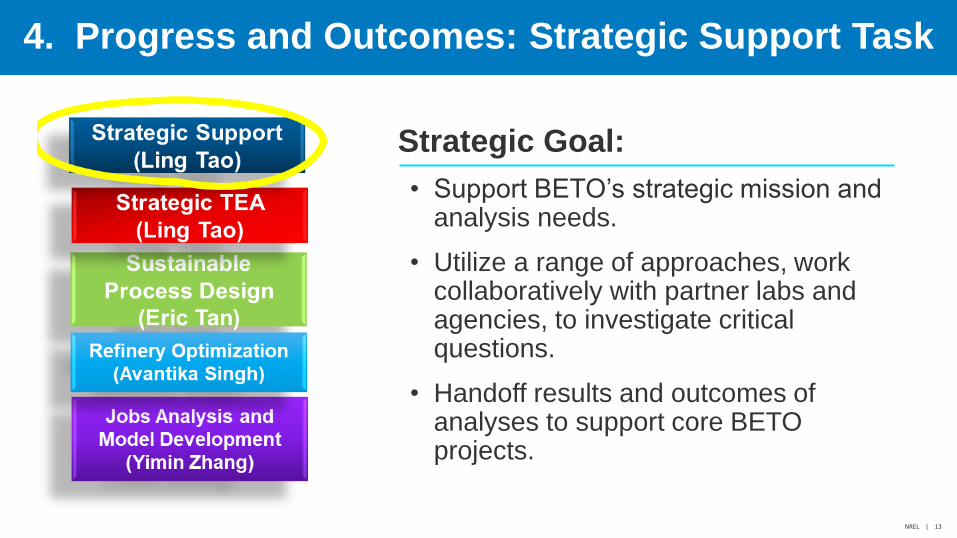
4. Progress and Outcomes: Strategic Support Task
Strategic Goal:
• Support BETO’s strategic mission and analysis needs.
• Utilize a range of approaches, work collaboratively with partner labs and agencies, to investigate critical questions.
• Handoff results and outcomes of analyses to support core BETO projects.
NREL | 14
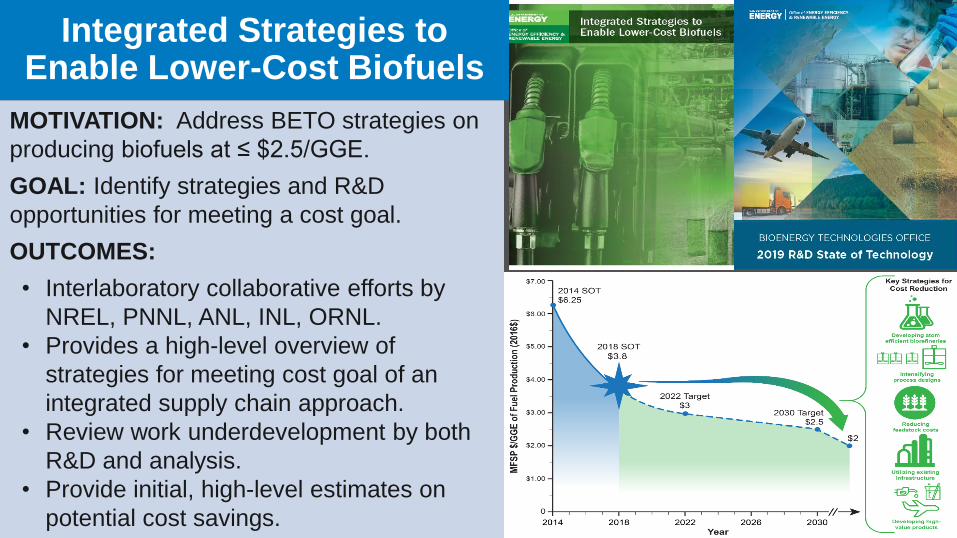
Integrated Strategies to Enable Lower-Cost Biofuels
MOTIVATION: Address BETO strategies on
producing biofuels at ≤ $2.5/GGE.
GOAL: Identify strategies and R&D
opportunities for meeting a cost goal.
OUTCOMES:
• Interlaboratory collaborative efforts by
NREL, PNNL, ANL, INL, ORNL.
• Provides a high-level overview of
strategies for meeting cost goal of an
integrated supply chain approach.
• Review work underdevelopment by both
R&D and analysis.
• Provide initial, high-level estimates on
potential cost savings.
NREL | 15
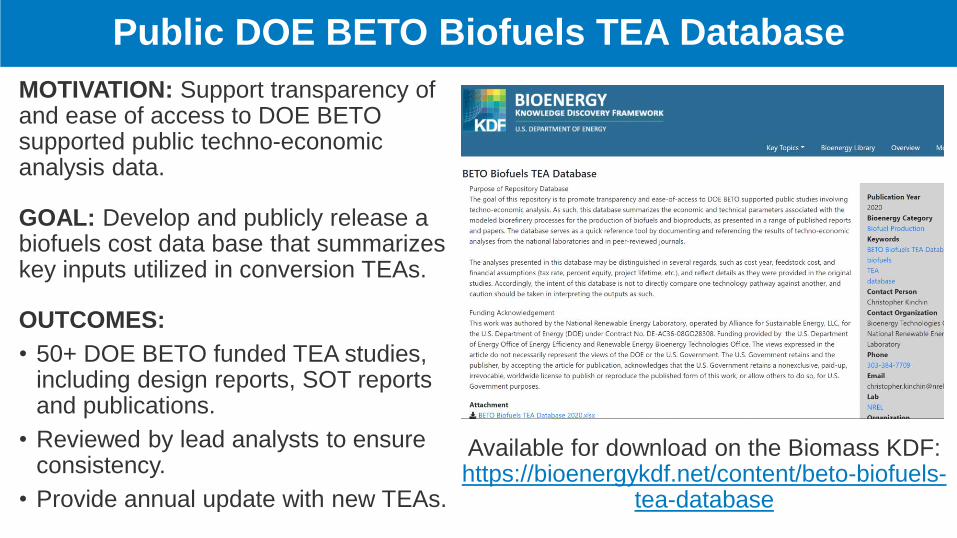
Public DOE BETO Biofuels TEA Database
MOTIVATION: Support transparency of and ease of access to DOE BETO supported public techno-economic analysis data.
GOAL: Develop and publicly release a biofuels cost data base that summarizes key inputs utilized in conversion TEAs.
OUTCOMES:
• 50+ DOE BETO funded TEA studies, including design reports, SOT reports and publications.
• Reviewed by lead analysts to ensure consistency.
• Provide annual update with new TEAs.
Available for download on the Biomass KDF:https://bioenergykdf.net/content/beto-biofuels-
tea-database
NREL | 16
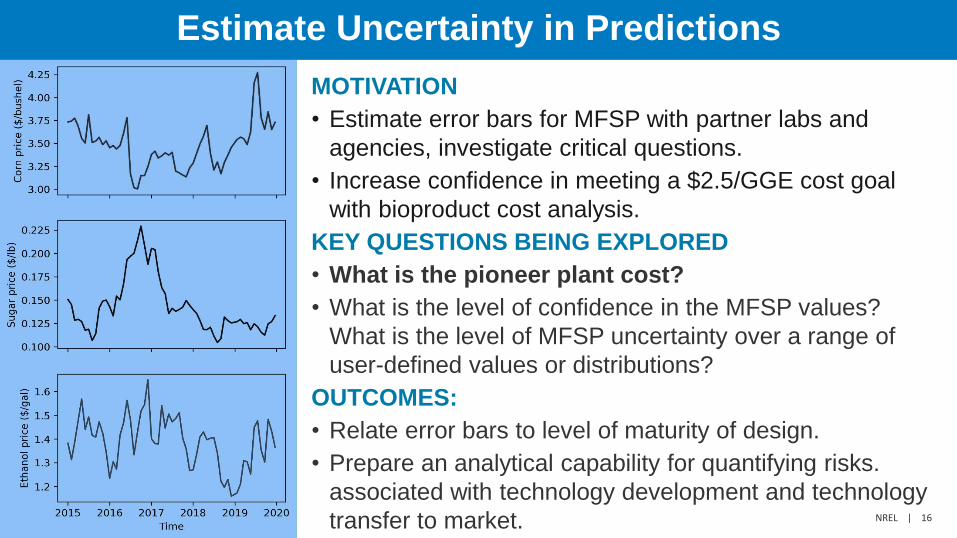
Estimate Uncertainty in Predictions
MOTIVATION
• Estimate error bars for MFSP with partner labs and
agencies, investigate critical questions.
• Increase confidence in meeting a $2.5/GGE cost goal
with bioproduct cost analysis.
KEY QUESTIONS BEING EXPLORED
• What is the pioneer plant cost?
• What is the level of confidence in the MFSP values?
What is the level of MFSP uncertainty over a range of
user-defined values or distributions?
OUTCOMES:
• Relate error bars to level of maturity of design.
• Prepare an analytical capability for quantifying risks.
associated with technology development and technology
transfer to market.
NREL | 17
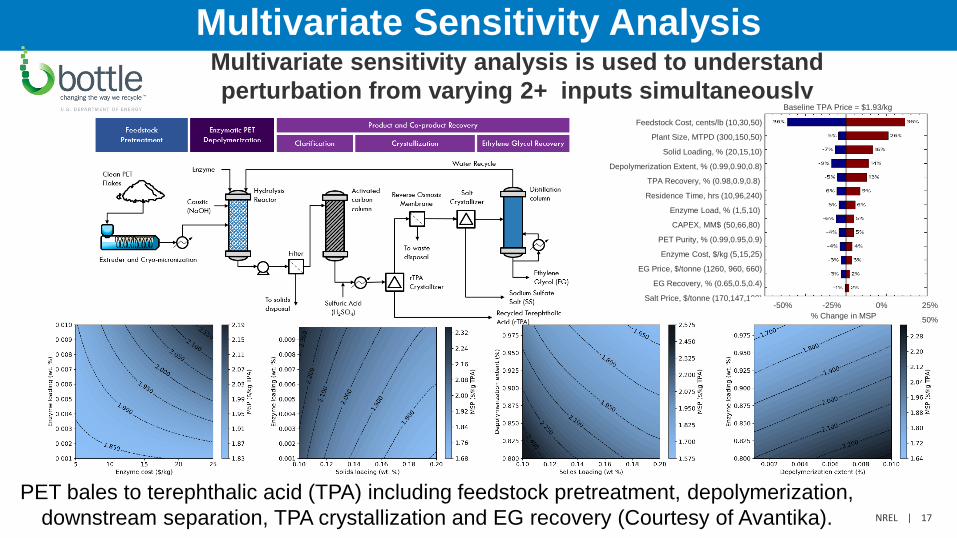
Multivariate Sensitivity AnalysisMultivariate sensitivity analysis is used to understand
perturbation from varying 2+ inputs simultaneously
PET bales to terephthalic acid (TPA) including feedstock pretreatment, depolymerization,
downstream separation, TPA crystallization and EG recovery (Courtesy of Avantika).
Feedstock Cost, cents/lb (10,30,50)
Plant Size, MTPD (300,150,50)
Solid Loading, % (20,15,10)
Depolymerization Extent, % (0.99,0.90,0.8)
TPA Recovery, % (0.98,0.9,0.8)
Residence Time, hrs (10,96,240)
Enzyme Load, % (1,5,10)
CAPEX, MM$ (50,66,80)
PET Purity, % (0.99,0.95,0.9)
Enzyme Cost, $/kg (5,15,25)
EG Price, $/tonne (1260, 960, 660)
EG Recovery, % (0.65,0.5,0.4)
Salt Price, $/tonne (170,147,100)
% Change in MSP
Baseline TPA Price = $1.93/kg
-50% -25% 0% 25%
50%
NREL | 18
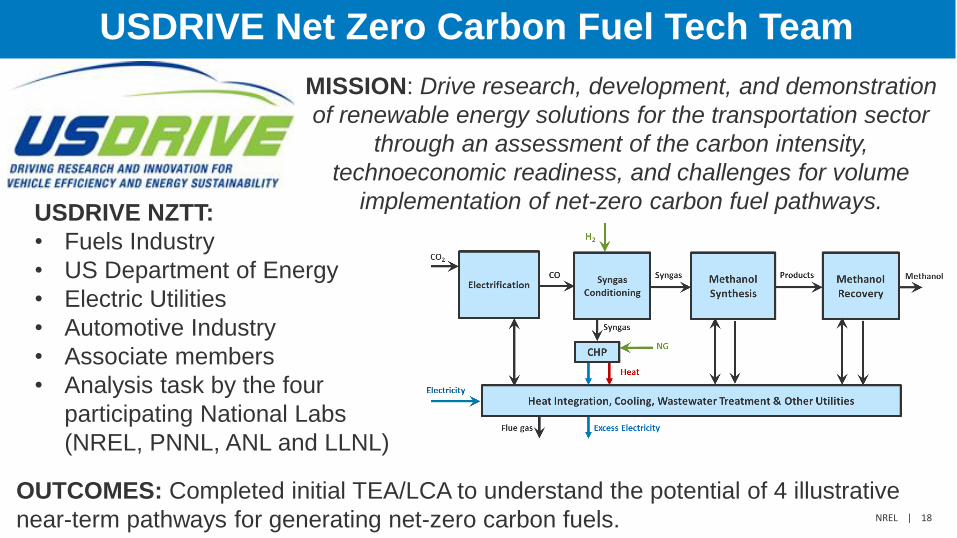
USDRIVE Net Zero Carbon Fuel Tech Team
MISSION: Drive research, development, and demonstration
of renewable energy solutions for the transportation sector
through an assessment of the carbon intensity,
technoeconomic readiness, and challenges for volume
implementation of net-zero carbon fuel pathways.USDRIVE NZTT:
• Fuels Industry
• US Department of Energy
• Electric Utilities
• Automotive Industry
• Associate members
• Analysis task by the four
participating National Labs
(NREL, PNNL, ANL and LLNL)
OUTCOMES: Completed initial TEA/LCA to understand the potential of 4 illustrative
near-term pathways for generating net-zero carbon fuels.
NREL | 19
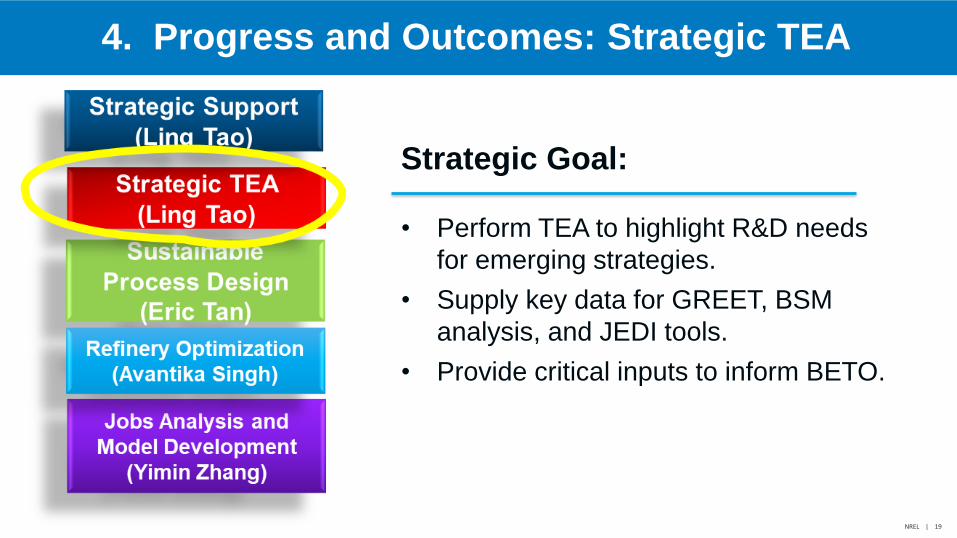
4. Progress and Outcomes: Strategic TEA
Strategic Goal:
• Perform TEA to highlight R&D needs
for emerging strategies.
• Supply key data for GREET, BSM
analysis, and JEDI tools.
• Provide critical inputs to inform BETO.
NREL | 20
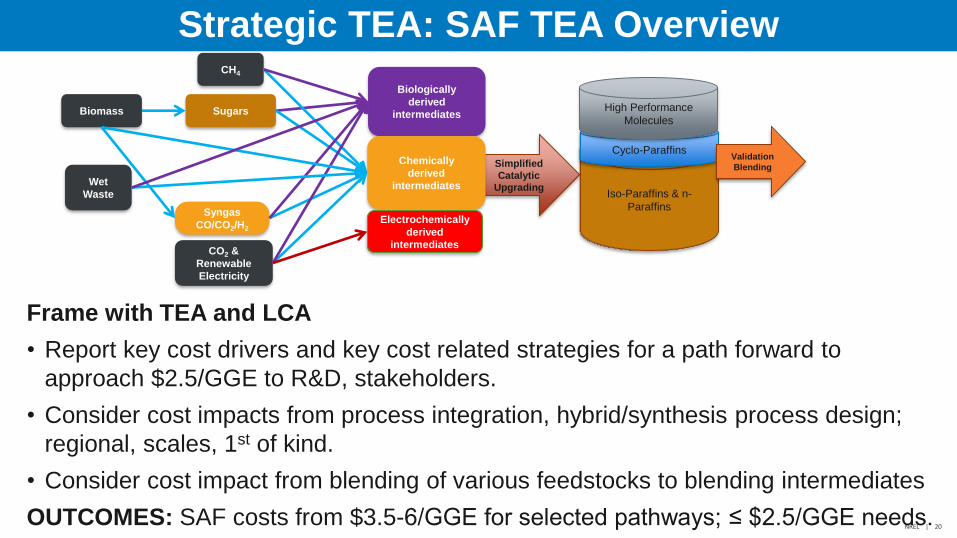
Strategic TEA: SAF TEA Overview
Biomass Sugars
Biologically
derived
intermediates
Simplified
Catalytic
Upgrading
Syngas
CO/CO2/H2
Iso-Paraffins & n-
Paraffins
Cyclo-Paraffins
CH4
Chemically
derived
intermediates
CO2 &
Renewable
Electricity
High Performance
Molecules
Validation
Blending
Electrochemically
derived
intermediates
Frame with TEA and LCA
• Report key cost drivers and key cost related strategies for a path forward to
approach $2.5/GGE to R&D, stakeholders.
• Consider cost impacts from process integration, hybrid/synthesis process design;
regional, scales, 1st of kind.
• Consider cost impact from blending of various feedstocks to blending intermediates
OUTCOMES: SAF costs from $3.5-6/GGE for selected pathways; ≤ $2.5/GGE needs.
Wet
Waste
NREL | 21
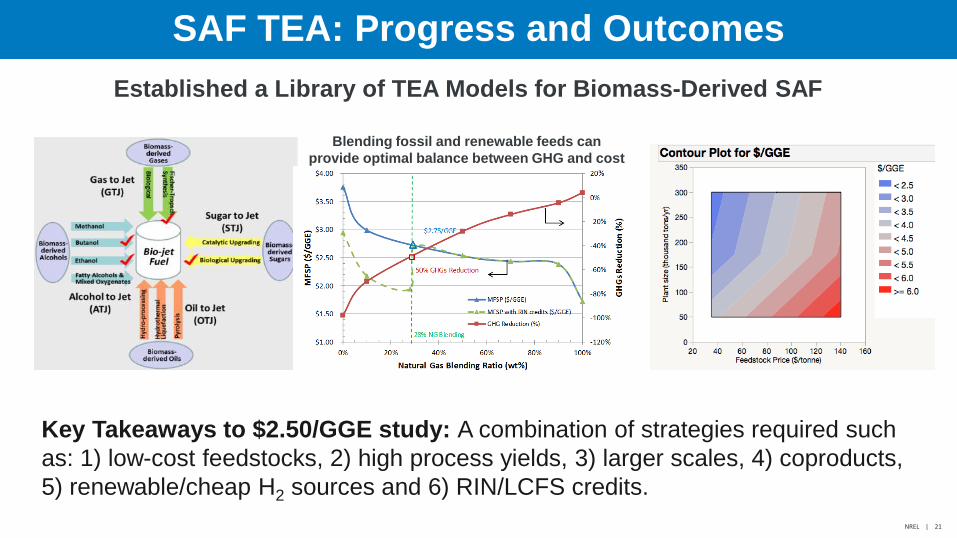
SAF TEA: Progress and Outcomes
Established a Library of TEA Models for Biomass-Derived SAF
Key Takeaways to $2.50/GGE study: A combination of strategies required such
as: 1) low-cost feedstocks, 2) high process yields, 3) larger scales, 4) coproducts,
5) renewable/cheap H2 sources and 6) RIN/LCFS credits.
Blending fossil and renewable feeds can
provide optimal balance between GHG and cost
NREL | 22
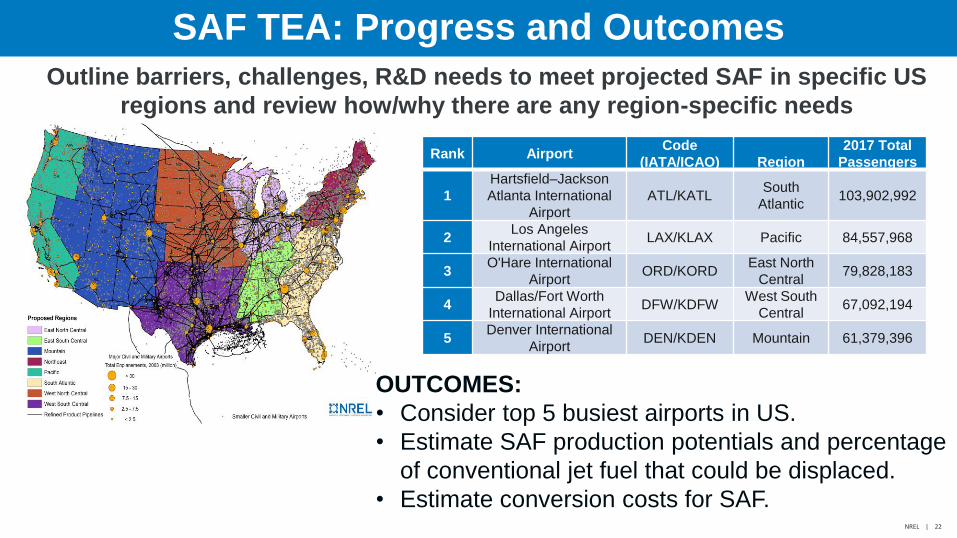
SAF TEA: Progress and Outcomes
Outline barriers, challenges, R&D needs to meet projected SAF in specific US
regions and review how/why there are any region-specific needs
Rank AirportCode
(IATA/ICAO) Region
2017 Total
Passengers
1
Hartsfield–Jackson
Atlanta International
Airport
ATL/KATLSouth
Atlantic103,902,992
2Los Angeles
International AirportLAX/KLAX Pacific 84,557,968
3O'Hare International
AirportORD/KORD
East North
Central79,828,183
4Dallas/Fort Worth
International AirportDFW/KDFW
West South
Central67,092,194
5Denver International
AirportDEN/KDEN Mountain 61,379,396
OUTCOMES:
• Consider top 5 busiest airports in US.
• Estimate SAF production potentials and percentage
of conventional jet fuel that could be displaced.
• Estimate conversion costs for SAF.
NREL | 23
4. Progress and Outcomes: Sustainable Process Design
Strategic Goal:
Further incorporate and integrate sustainability into conversion process design.
NREL | 24
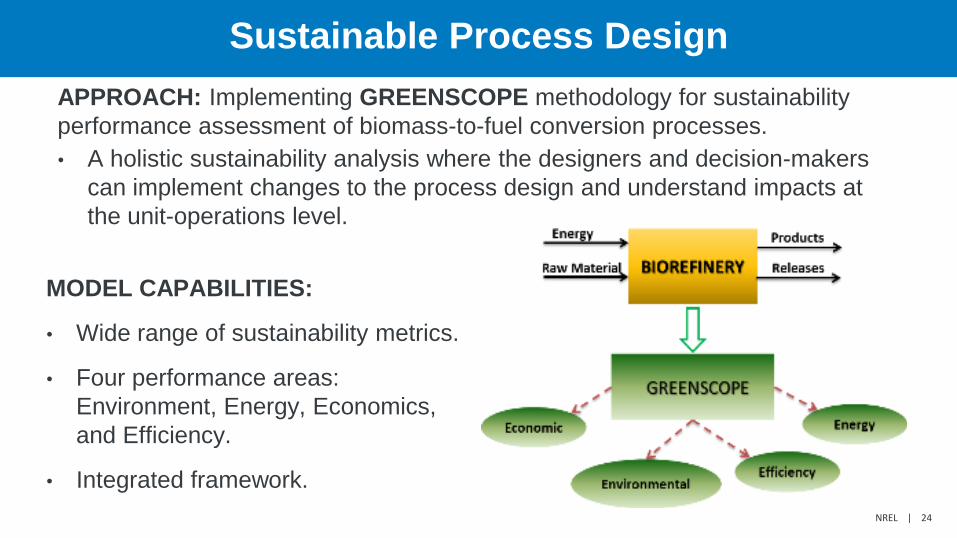
Sustainable Process Design
APPROACH: Implementing GREENSCOPE methodology for sustainability
performance assessment of biomass-to-fuel conversion processes.
• A holistic sustainability analysis where the designers and decision-makers
can implement changes to the process design and understand impacts at
the unit-operations level.
MODEL CAPABILITIES:
• Wide range of sustainability metrics.
• Four performance areas:
Environment, Energy, Economics,
and Efficiency.
• Integrated framework.

NREL | 25
Integrate Sustainability in Biorefinery Design
21 Economic Indicators
6 out of 21 economic indicators exhibit sustainability scores < 50%:
• Specific raw material cost (17. CSRM).
• Total material cost (18. Cmat,tot).
• Discounted payback period (19. DPBP).
• Cumulative cash ratio (20. CCR).
• Rate of return on investment (21. ROI).
Best case
scenario
100%
Worst
case
scenario
0%
Case Study
NREL | 26
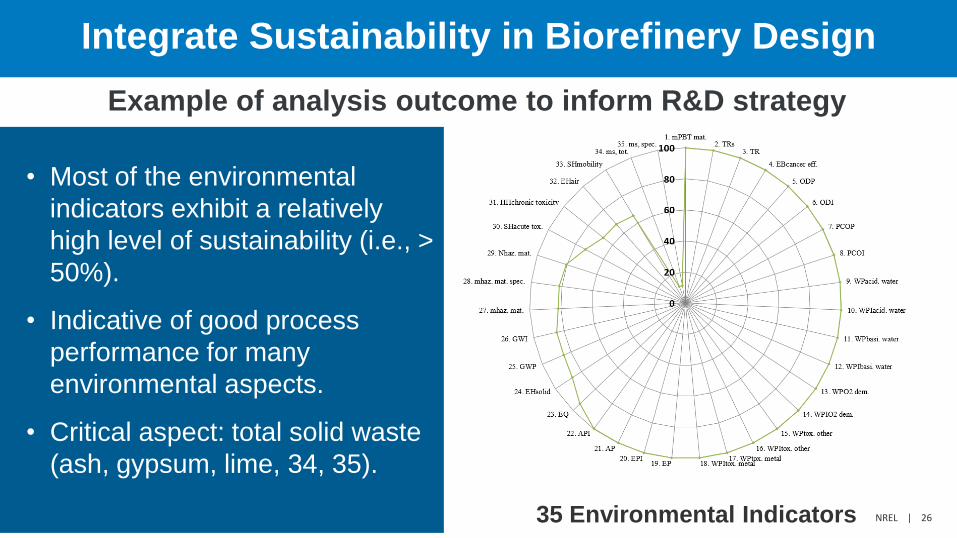
Integrate Sustainability in Biorefinery Design
Example of analysis outcome to inform R&D strategy
• Most of the environmental
indicators exhibit a relatively
high level of sustainability (i.e., >
50%).
• Indicative of good process
performance for many
environmental aspects.
• Critical aspect: total solid waste
(ash, gypsum, lime, 34, 35).
35 Environmental Indicators
NREL | 27
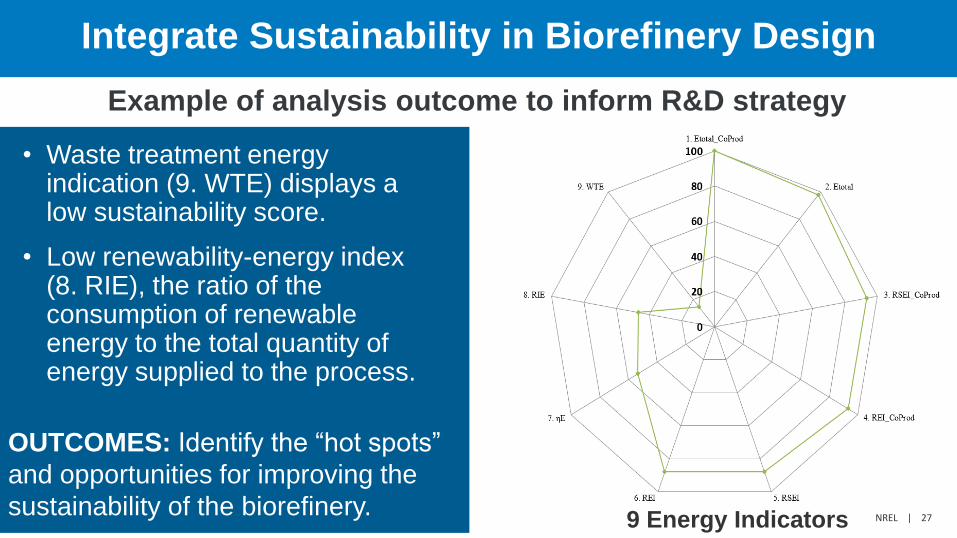
Integrate Sustainability in Biorefinery Design
Example of analysis outcome to inform R&D strategy
• Waste treatment energy indication (9. WTE) displays a low sustainability score.
• Low renewability-energy index (8. RIE), the ratio of the consumption of renewable energy to the total quantity of energy supplied to the process.
9 Energy Indicators
OUTCOMES: Identify the “hot spots”
and opportunities for improving the
sustainability of the biorefinery.
NREL | 28
4. Progress and Outcomes: Refinery Optimization
Strategic Goal:
Seek opportunities for biofuels in the context of petroleum refineries.
NREL | 29
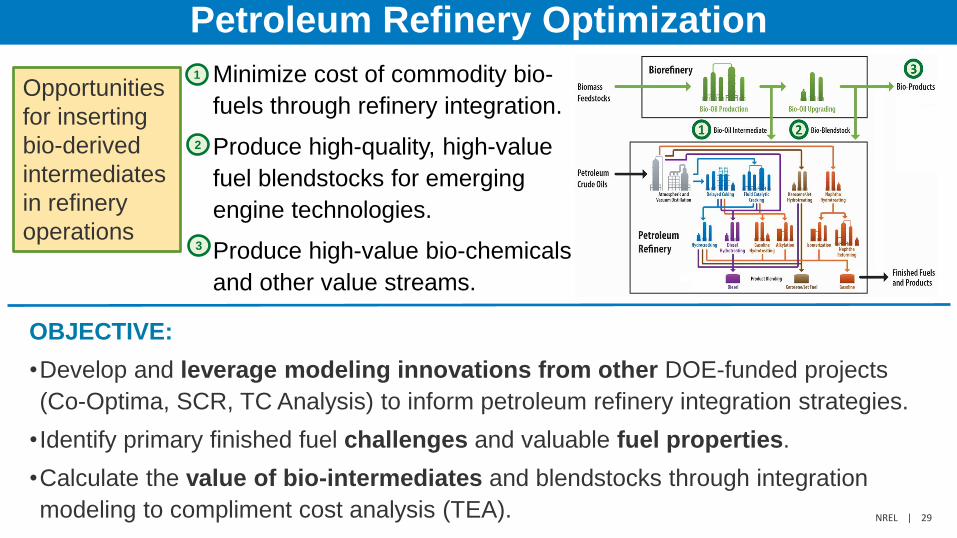
Petroleum Refinery Optimization
OBJECTIVE:
•Develop and leverage modeling innovations from other DOE-funded projects
(Co-Optima, SCR, TC Analysis) to inform petroleum refinery integration strategies.
•Identify primary finished fuel challenges and valuable fuel properties.
•Calculate the value of bio-intermediates and blendstocks through integration
modeling to compliment cost analysis (TEA).
Minimize cost of commodity bio-
fuels through refinery integration.
Produce high-quality, high-value
fuel blendstocks for emerging
engine technologies.
Produce high-value bio-chemicals
and other value streams.
2
3
1
Opportunities
for inserting
bio-derived
intermediates
in refinery
operations
NREL | 30
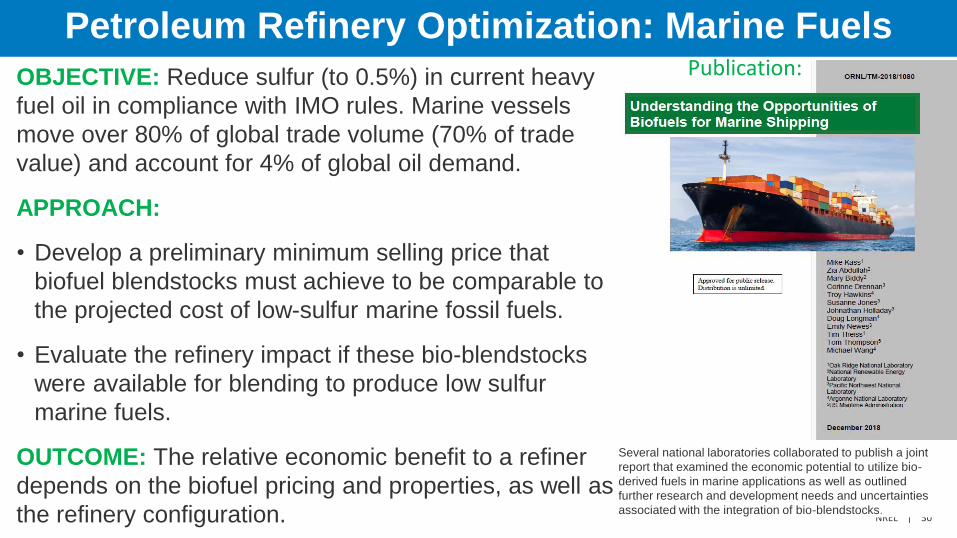
Several national laboratories collaborated to publish a joint
report that examined the economic potential to utilize bio-
derived fuels in marine applications as well as outlined
further research and development needs and uncertainties
associated with the integration of bio-blendstocks.
Petroleum Refinery Optimization: Marine Fuels
OBJECTIVE: Reduce sulfur (to 0.5%) in current heavy
fuel oil in compliance with IMO rules. Marine vessels
move over 80% of global trade volume (70% of trade
value) and account for 4% of global oil demand.
APPROACH:
• Develop a preliminary minimum selling price that
biofuel blendstocks must achieve to be comparable to
the projected cost of low-sulfur marine fossil fuels.
• Evaluate the refinery impact if these bio-blendstocks
were available for blending to produce low sulfur
marine fuels.
OUTCOME: The relative economic benefit to a refiner
depends on the biofuel pricing and properties, as well as
the refinery configuration.
Publication:
NREL | 31
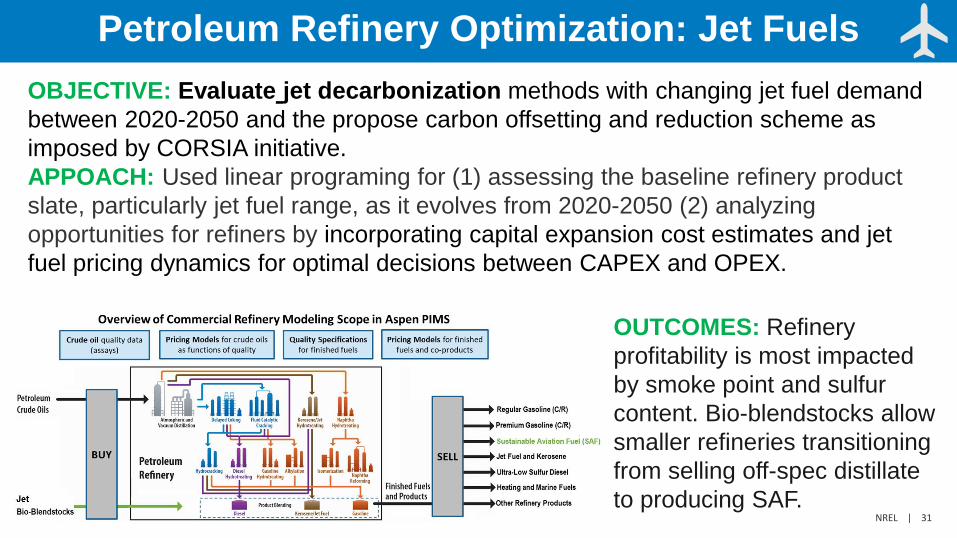
Petroleum Refinery Optimization: Jet Fuels
OBJECTIVE: Evaluate jet decarbonization methods with changing jet fuel demand
between 2020-2050 and the propose carbon offsetting and reduction scheme as
imposed by CORSIA initiative.
APPOACH: Used linear programing for (1) assessing the baseline refinery product
slate, particularly jet fuel range, as it evolves from 2020-2050 (2) analyzing
opportunities for refiners by incorporating capital expansion cost estimates and jet
fuel pricing dynamics for optimal decisions between CAPEX and OPEX.
OUTCOMES: Refinery
profitability is most impacted
by smoke point and sulfur
content. Bio-blendstocks allow
smaller refineries transitioning
from selling off-spec distillate
to producing SAF.
NREL | 32
4. Progress and Outcomes: Job Analysis
Strategic Goal:
Understand the potential of job creation and economic benefits resulting from the build-out of new biorefineries.
NREL | 33
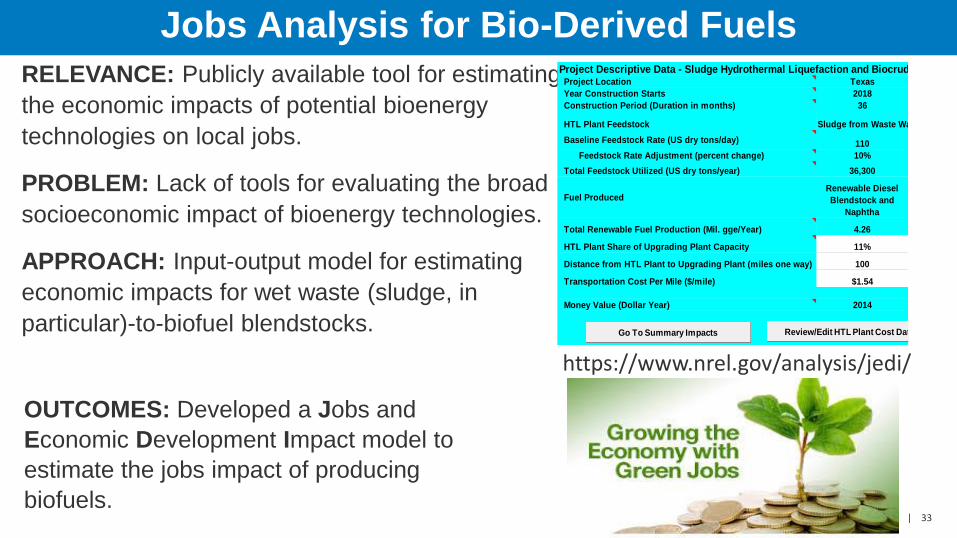
RELEVANCE: Publicly available tool for estimating
the economic impacts of potential bioenergy
technologies on local jobs.
PROBLEM: Lack of tools for evaluating the broad
socioeconomic impact of bioenergy technologies.
APPROACH: Input-output model for estimating
economic impacts for wet waste (sludge, in
particular)-to-biofuel blendstocks.
Project Descriptive Data - Sludge Hydrothermal Liquefaction and Biocrude Upgrading Project Location Texas
Year Construction Starts 2018
Construction Period (Duration in months) 36
HTL Plant Feedstock Sludge from Waste Water Treatment Facility
Baseline Feedstock Rate (US dry tons/day) 110
Feedstock Rate Adjustment (percent change) 10%
Total Feedstock Utilized (US dry tons/year) 36,300
Fuel ProducedRenewable Diesel
Blendstock and
Naphtha
Total Renewable Fuel Production (Mil. gge/Year) 4.26
HTL Plant Share of Upgrading Plant Capacity 11%
Distance from HTL Plant to Upgrading Plant (miles one way) 100
Transportation Cost Per Mile ($/mile) $1.54
Money Value (Dollar Year) 2014
Go To Summary Impacts Review/Edit HTL Plant Cost Data
Jobs Analysis for Bio-Derived Fuels
OUTCOMES: Developed a Jobs and
Economic Development Impact model to
estimate the jobs impact of producing
biofuels.
https://www.nrel.gov/analysis/jedi/

NREL | 34
Jobs Analysis for Gen 1.5 Technology
RELEVANCE: Potential job growth opportunities from bolt-on Gen 1.5
technologies to produce additional ethanol in dry mills in Midwest.
OBJECTIVE: How do bolt-on Gen 1.5 compare to stand-alone cellulosic ethanol
biorefinery in terms of job creation?
APPROACH: LeveragE TEA for an economic input-output analysis to quality
state-level job potential of adopting Gen 1.5 bolt-on technologies.
OUTCOMES:
• Between 0.89 and 1.27 annual jobs could be supported
by each million gallons of Gen 1.5 ethanol produced.
• In comparison, a stand-alone biorefinery is expected to
support 0.98 annual jobs per million gallons of ethanol
production.
*Gen 1.5 uses feedstock fiber already on-site to produce cellulosic ethanol.
NREL | 35
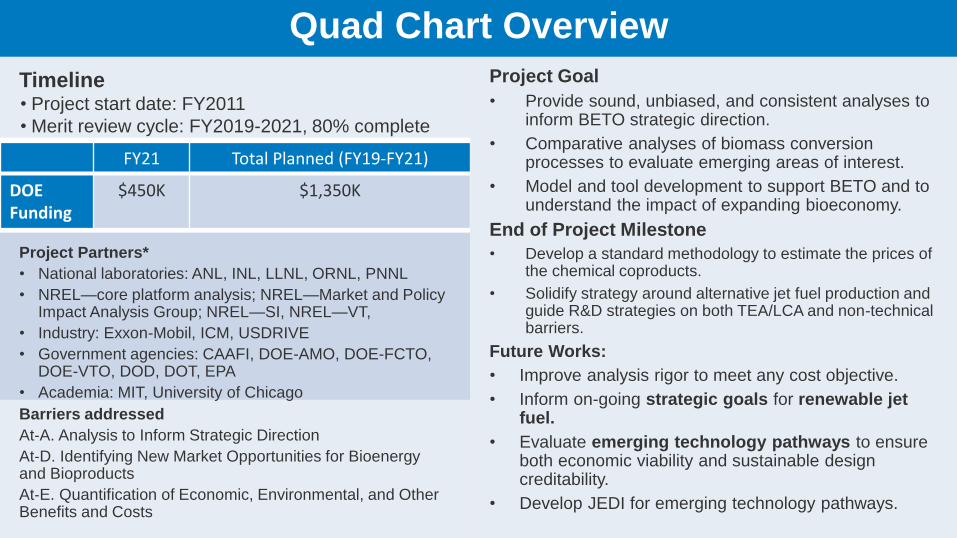
Timeline• Project start date: FY2011
• Merit review cycle: FY2019-2021, 80% complete
FY21 Total Planned (FY19-FY21)
DOE Funding
$450K $1,350K
Barriers addressed
At‐A. Analysis to Inform Strategic Direction
At‐D. Identifying New Market Opportunities for Bioenergy and Bioproducts
At‐E. Quantification of Economic, Environmental, and Other Benefits and Costs
Project Goal
• Provide sound, unbiased, and consistent analyses to inform BETO strategic direction.
• Comparative analyses of biomass conversion processes to evaluate emerging areas of interest.
• Model and tool development to support BETO and to understand the impact of expanding bioeconomy.
End of Project Milestone
• Develop a standard methodology to estimate the prices of the chemical coproducts.
• Solidify strategy around alternative jet fuel production and guide R&D strategies on both TEA/LCA and non-technical barriers.
Future Works:
• Improve analysis rigor to meet any cost objective.
• Inform on-going strategic goals for renewable jet fuel.
• Evaluate emerging technology pathways to ensure both economic viability and sustainable design creditability.
• Develop JEDI for emerging technology pathways.
Project Partners*
• National laboratories: ANL, INL, LLNL, ORNL, PNNL
• NREL—core platform analysis; NREL—Market and Policy Impact Analysis Group; NREL—SI, NREL—VT,
• Industry: Exxon-Mobil, ICM, USDRIVE
• Government agencies: CAAFI, DOE-AMO, DOE-FCTO, DOE-VTO, DOD, DOT, EPA
• Academia: MIT, University of Chicago
Quad Chart Overview
NREL | 36
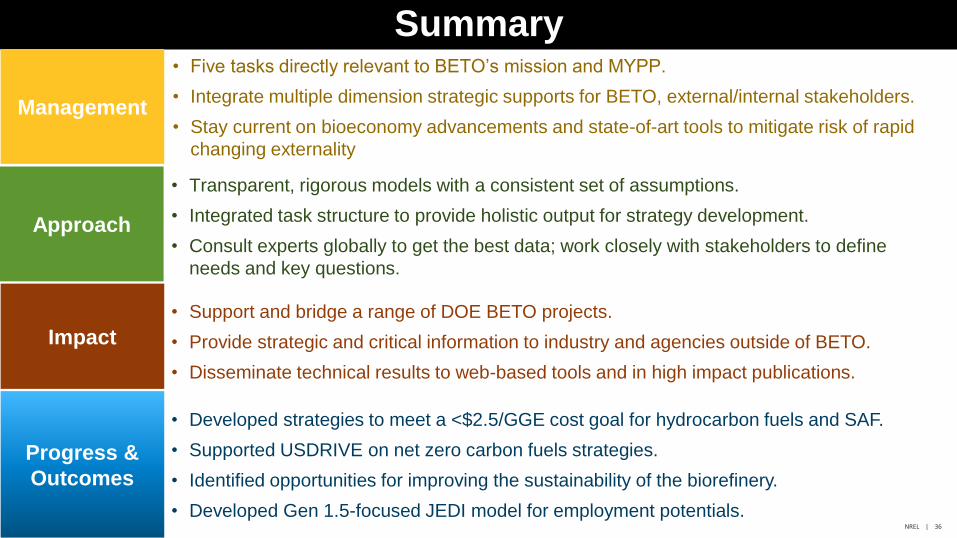
Summary• Five tasks directly relevant to BETO’s mission and MYPP.
• Integrate multiple dimension strategic supports for BETO, external/internal stakeholders.
• Stay current on bioeconomy advancements and state-of-art tools to mitigate risk of rapid
changing externality
Management
Approach
Impact
Progress &
Outcomes
• Transparent, rigorous models with a consistent set of assumptions.
• Integrated task structure to provide holistic output for strategy development.
• Consult experts globally to get the best data; work closely with stakeholders to define
needs and key questions.
• Support and bridge a range of DOE BETO projects.
• Provide strategic and critical information to industry and agencies outside of BETO.
• Disseminate technical results to web-based tools and in high impact publications.
• Developed strategies to meet a <$2.5/GGE cost goal for hydrocarbon fuels and SAF.
• Supported USDRIVE on net zero carbon fuels strategies.
• Identified opportunities for improving the sustainability of the biorefinery.
• Developed Gen 1.5-focused JEDI model for employment potentials.
NREL | 37
Acknowledgements
NREL: Zia Abdullah, Adam Bratis, Nick Carlson, Ryan Davis,
Abhijit Dutta, Gary Grim, Kylee Harris, Jenny Huang, Daniel
Inman, Chris Kinchin, Anelia Milbrandt, Michael Talmadge,
Eric Tan, Matt Wiatrowski, Yimin Zhang, Helena Chum, Mark
Davis, Rick Elander, Tom Foust, and NREL technology
platform researchers
PNNL: Lesley Snowden-Swan, Aye Meyer, Corinne Drennan,
Yunhua Zhu, Steve Phillips
ANL: Michael Wang, Uisung Lee, Troy Hawkins, Eunji Yoo
LLNL: A.J. Simon, Hannah Goldstein, Daniel Sanchez
(Berkeley)
INL: Damon Hartley
Other industrial and academic collaborators
Bioenergy Technologies Office
(BETO): Alicia Lindauer, Zia
Haq, Ian Rowe, Andrea Bailey,
Beau Hoffman, Nichole
Fitzgerald, Kevin Craig, Jay
Fitzgerald, Liz Moore

www.nrel.gov

NREL | 39
Additional Slides
NREL | 40
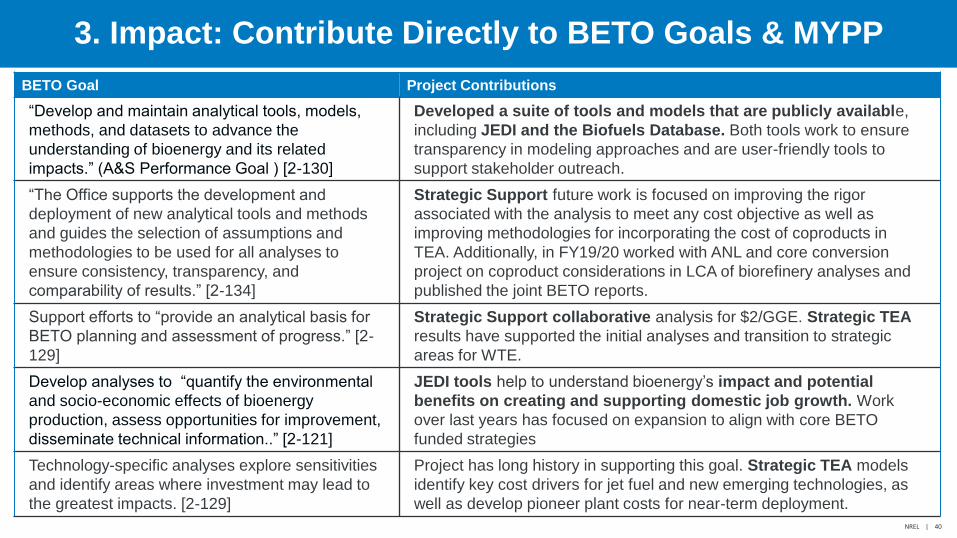
BETO Goal Project Contributions
“Develop and maintain analytical tools, models,
methods, and datasets to advance the
understanding of bioenergy and its related
impacts.” (A&S Performance Goal ) [2-130]
Developed a suite of tools and models that are publicly available,
including JEDI and the Biofuels Database. Both tools work to ensure
transparency in modeling approaches and are user-friendly tools to
support stakeholder outreach.
“The Office supports the development and
deployment of new analytical tools and methods
and guides the selection of assumptions and
methodologies to be used for all analyses to
ensure consistency, transparency, and
comparability of results.” [2-134]
Strategic Support future work is focused on improving the rigor
associated with the analysis to meet any cost objective as well as
improving methodologies for incorporating the cost of coproducts in
TEA. Additionally, in FY19/20 worked with ANL and core conversion
project on coproduct considerations in LCA of biorefinery analyses and
published the joint BETO reports.
Support efforts to “provide an analytical basis for
BETO planning and assessment of progress.” [2-
129]
Strategic Support collaborative analysis for $2/GGE. Strategic TEA
results have supported the initial analyses and transition to strategic
areas for WTE.
Develop analyses to “quantify the environmental
and socio-economic effects of bioenergy
production, assess opportunities for improvement,
disseminate technical information..” [2-121]
JEDI tools help to understand bioenergy’s impact and potential
benefits on creating and supporting domestic job growth. Work
over last years has focused on expansion to align with core BETO
funded strategies
Technology-specific analyses explore sensitivities
and identify areas where investment may lead to
the greatest impacts. [2-129]
Project has long history in supporting this goal. Strategic TEA models
identify key cost drivers for jet fuel and new emerging technologies, as
well as develop pioneer plant costs for near-term deployment.
Relevance3. Impact: Contribute Directly to BETO Goals & MYPP
NREL | 41
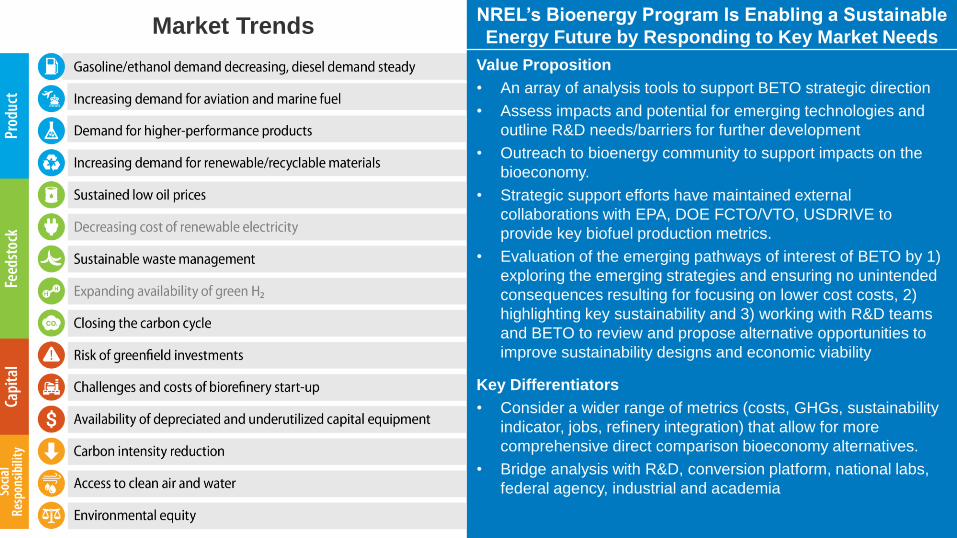
Value Proposition
• An array of analysis tools to support BETO strategic direction
• Assess impacts and potential for emerging technologies and
outline R&D needs/barriers for further development
• Outreach to bioenergy community to support impacts on the
bioeconomy.
• Strategic support efforts have maintained external
collaborations with EPA, DOE FCTO/VTO, USDRIVE to
provide key biofuel production metrics.
• Evaluation of the emerging pathways of interest of BETO by 1)
exploring the emerging strategies and ensuring no unintended
consequences resulting for focusing on lower cost costs, 2)
highlighting key sustainability and 3) working with R&D teams
and BETO to review and propose alternative opportunities to
improve sustainability designs and economic viability
Key Differentiators
• Consider a wider range of metrics (costs, GHGs, sustainability
indicator, jobs, refinery integration) that allow for more
comprehensive direct comparison bioeconomy alternatives.
• Bridge analysis with R&D, conversion platform, national labs,
federal agency, industrial and academia
NREL’s Bioenergy Program Is Enabling a Sustainable
Energy Future by Responding to Key Market NeedsMarket Trends
NREL | 42
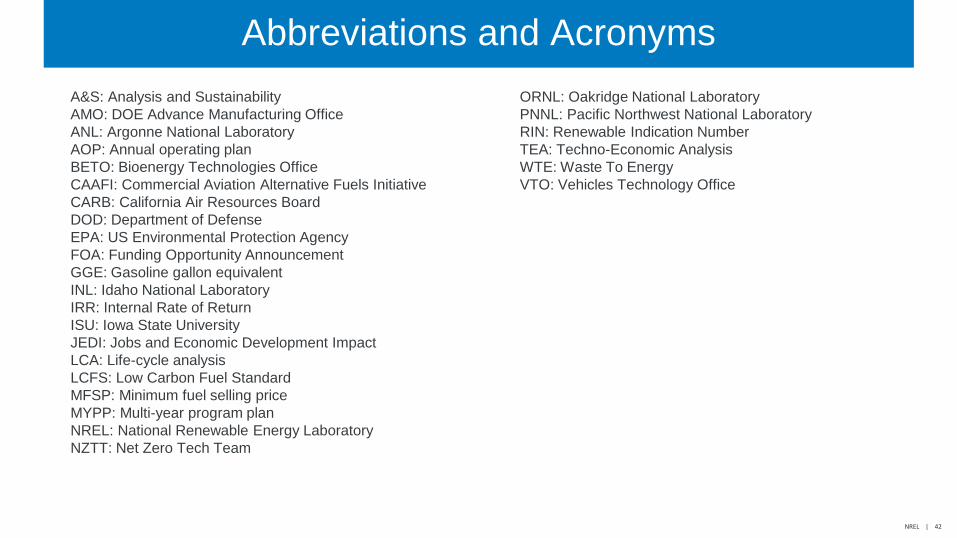
Abbreviations and Acronyms
A&S: Analysis and Sustainability
AMO: DOE Advance Manufacturing Office
ANL: Argonne National Laboratory
AOP: Annual operating plan
BETO: Bioenergy Technologies Office
CAAFI: Commercial Aviation Alternative Fuels Initiative
CARB: California Air Resources Board
DOD: Department of Defense
EPA: US Environmental Protection Agency
FOA: Funding Opportunity Announcement
GGE: Gasoline gallon equivalent
INL: Idaho National Laboratory
IRR: Internal Rate of Return
ISU: Iowa State University
JEDI: Jobs and Economic Development Impact
LCA: Life-cycle analysis
LCFS: Low Carbon Fuel Standard
MFSP: Minimum fuel selling price
MYPP: Multi-year program plan
NREL: National Renewable Energy Laboratory
NZTT: Net Zero Tech Team
Abbreviations and Acronyms
ORNL: Oakridge National Laboratory
PNNL: Pacific Northwest National Laboratory
RIN: Renewable Indication Number
TEA: Techno-Economic Analysis
WTE: Waste To Energy
VTO: Vehicles Technology Office
NREL | 43
Publications and Technical Reports
1. Zhang Y, Sahir AH, Tan EC, Talmadge MS, Davis R, Biddy MJ, Tao L. Economic and environmental potentials for natural
gas to enhance biomass-to-liquid fuels technologies. Green Chemistry. 2018;20(23):5358-73.
https://pubs.rsc.org/en/content/articlehtml/2018/gc/c8gc01257a
2. Dunn, J.B., Newes, E., Cai, H., Zhang, Y., Brooker, A., Ou, L., Mundt, N., Bhatt, A., Peterson, S. and Biddy, M., 2020.
Energy, economic, and environmental benefits assessment of co-optimized engines and bio-blendstocks. Energy &
Environmental Science.
3. Fei, Q., Liang, B., Tao, L., Tan, E.C., Gonzalez, R., Henard, C. and Guarnieri, M., 2020. Biological valorization of natural
gas for the production of lactic acid: techno-economic analysis and life cycle assessment. Biochemical Engineering
Journal, p.107500.“Applying Environmental Release Inventories and Indicators to the Evaluation of Chemical
Manufacturing Processes in Early-Stage Development,” ACS Sustainable Chemistry & Engineering, 7, 10937-10950
(2019).
4. Adhikari, S.P., Zhang, J., Guo, Q., Unocic, K.A., Tao, L. and Li, Z., 2020. A hybrid pathway to biojet fuel via 2, 3-
butanediol. Sustainable Energy & Fuels.“An Integrated Sustainability Evaluation of High-Octane Gasoline Production from
Lignocellulosic Biomass,” Biofuels, Bioproducts and Biorefining, 13, 1439-1453 (2019).
5. Tan, E.C.D., “Sustainable Biomass Conversion Process Assessment,” in Recent Advances in Process Intensification and
Integration for Sustainable Design, ed. Wiley VCH (May 20, 2020) ISBN-13: 978-3527345472 .
6. Joint contributions from 2.1.0.100 (Biochemical Platform Analysis), 2.1.0.302 (Thermochemical Platform Analysis),
4.1.1.30 (Strategic Support), and collaborations with other partners from ANL, INL, PNNL, ORNL: “Integrated Strategies to
Enable Lower-Cost Biofuels.” DOE Technical Report, July 2020: https://www.energy.gov/sites/prod/files/2020/07/f76/beto-
integrated-strategies-to-enable-low-cost-biofuels-july-2020.pdf
NREL | 44
Publications and Technical Reports
7. Tan, E.C., Ruddy, D., Nash, C.P., Dupuis, D.P., Dutta, A., Hartley, D. and Cai, H., 2020. High-Octane Gasoline from
Lignocellulosic Biomass via Syngas and Methanol/Dimethyl Ether Intermediates: 2020 State of Technology and Future
Research (No. NREL/TP-5100-76619). National Renewable Energy Lab.(NREL), Golden, CO (United States).
https://www.nrel.gov/docs/fy20osti/76619.pdf
8. Tan, E.C. and Tao., L., 2020. Biomass-Derived Liquid Fuels Via Fischer-Tropsch Process As a Potential Replacement for
Marine Fuels (No. NREL/PR-5100-75504). National Renewable Energy Lab.(NREL), Golden, CO (United States).
9. Shen R, Tao L, Yang B. Techno‐economic analysis of jet‐fuel production from biorefinery waste lignin. Biofuels,
Bioproducts and Biorefining. 2019 May;13(3):486-501. https://onlinelibrary.wiley.com/doi/pdf/10.1002/bbb.1952
10. Cai H, Benavides T, Lee U, Wang M, Tan E, Davis R, Dutta A, Biddy M, Clippinger J, Grundl N, Tao L. Supply Chain
Sustainability Analysis of Renewable Hydrocarbon Fuels via Indirect Liquefaction, Ex Situ Catalytic Fast Pyrolysis,
Hydrothermal Liquefaction, Combined Algal Processing, and Biochemical Conversion: Update of the 2018 State-of-
Technology Cases and Design Cases. Argonne National Laboratory, Argonne, IL (United States); 2018 Dec 1.
https://publications.anl.gov/anlpubs/2019/01/149543.pdf
11. Mann MK, Biddy MJ, Augustine CR, Nguyen Q, Hu H, Ebadian M, Webb E. Evaluation of Agricultural Equipment
Manufacturing for a Bio-Based Economy. National Renewable Energy Laboratory, Golden, CO (United States); 2019 Jun
26. https://www.nrel.gov/docs/fy19osti/71570.pdf
12. Sahir AH, Zhang Y, Tan EC, Tao L. Understanding the role of Fischer–Tropsch reaction kinetics in techno‐economic
analysis for co‐conversion of natural gas and biomass to liquid transportation fuels. Biofuels, Bioproducts and Biorefining.
2019 Jul. https://onlinelibrary.wiley.com/doi/pdf/10.1002/bbb.2035
NREL | 45
Conference Papers
1. “Techno-Economic Analysis and Life-Cycle Assessment for Gas Phase Catalytic Oxidation of Lignin to Produce Phenolic
Compounds, National Renewable Energy Laboratory Presentation”. 2018 AIChE Annual Meeting, Pittsburgh, PA, 2018
Oct. https://www.osti.gov/biblio/1482502
2. “Evaluating Indicators and Life Cycle Inventories for Processes in Early Stages of Technical Readiness,” 2017 AIChE
Annual Meeting, Minneapolis, MN, October 29 – November 3, 2017.
3. “An Integrated Sustainability Evaluation of Indirect Liquefaction of Biomass to Liquid Fuels,” 7th International Congress on
Sustainability Science & Engineering, Cincinnati, OH, August 12-15, 2018.
4. “Sustainable Process Design for Biofuel Production via Syngas Conversion Pathway,” 8th International Congress on
Sustainability Science & Engineering, Kuala Lumpur, Malaysia, July 1-3, 2019.
5. “Estimating Chemical Releases and Evaluating Indicators for Manufacturing Processes: Biorefinery Case Studies,” 2020
AIChE Annual Meeting, Virtual, November 15-20, 2020.
6. “Sustainable Process Design for Biofuel Production Via Syngas Conversion Pathway”. 8th International Congress on
Sustainability Science & Engineering (ICOSSE ’19: Industry, Innovation and Sustainability), Kuala Lumpur, Malaysia 2019
https://www.osti.gov/biblio/1542267
7. “The Technical and Economic Feasibility of CO2 Reduction Using Low-Cost Electrons”. USCAR/BETO Joint Workshop,
USCAR offices, Detroit, MI. 2019 Jul.

NREL | 46
Responses to Previous Reviewers’ Comments
• Reviewer comment: This team provided excellent work results. This type of analysis in
industry is routine and often starts early in large projects. The value of such analysis work at
early, middle and late-stage projects is critical to BETO programs. These analyses increase
dramatically the speed of development providing where to focus future efforts to drive down
cost or where to stop working since further refinement is not impactful. Only question is can
BETO provide some level of techno-economics to even smaller start projects to make sure
that the original strategy has right to succeed. Only other comment is funding for plant
capital for new technologies typically, from my experience, is not 20 years payout but more
like 10 years, thus only true for nth plant. Also never know a plant to come in on original
capital cost estimates. Some confidence info on calculations i.e. +- x% would be helpful as
well for reviewers.
• Response: We thank the reviewers for their helpful feedback and comments. Going
forward, we will work to adopt suggestions from the panel to estimate cost ranges and to
consider more near-term cost estimation (pre-Nth plant evaluations) for these new and
novel technologies. We will also consider payback period potential for these new
technologies as replacement for incumbent baseline technologies and further expand our
sustainability analysis to consider a wider range of metrics.