Embed Size (px)
Citation preview
1
Strategic Education
Plan
Greenville Middle
Academy Dr. Robert Palmer, Principal
The School District
of Greenville County Mr. Burke Royster, Superintendent
2013-2018
2
3
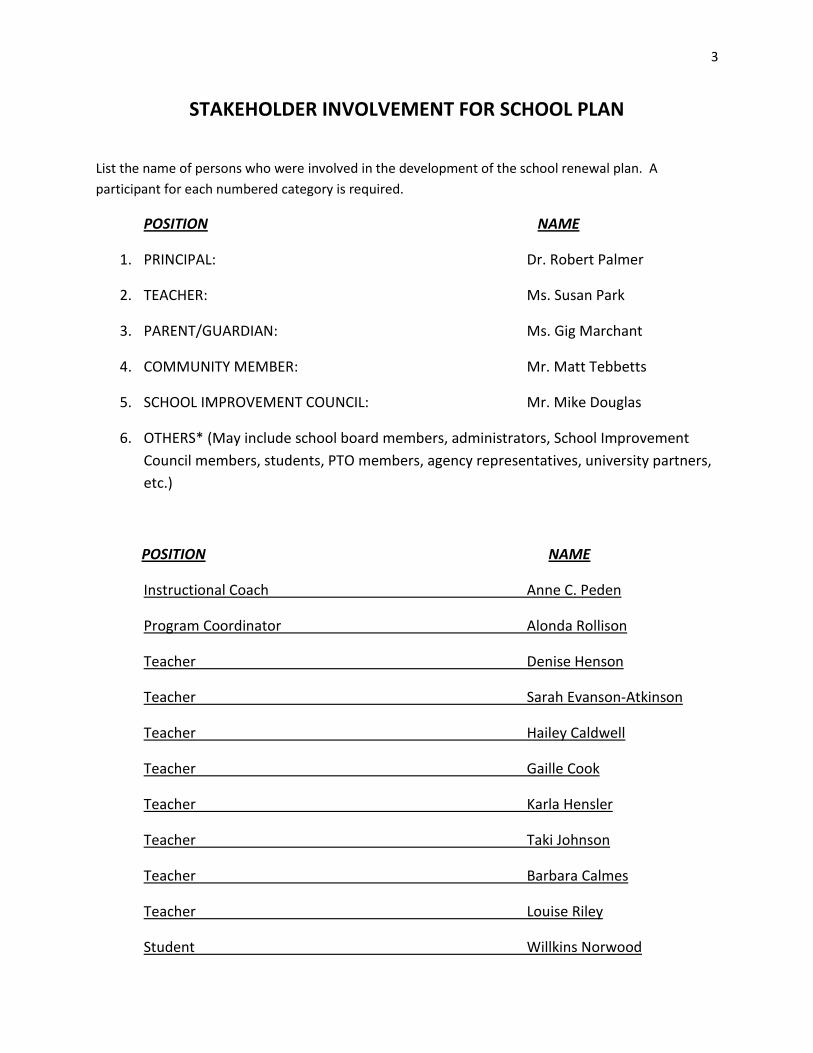
STAKEHOLDER INVOLVEMENT FOR SCHOOL PLAN
List the name of persons who were involved in the development of the school renewal plan. A
participant for each numbered category is required.
POSITION NAME
1. PRINCIPAL: Dr. Robert Palmer
2. TEACHER: Ms. Susan Park
3. PARENT/GUARDIAN: Ms. Gig Marchant
4. COMMUNITY MEMBER: Mr. Matt Tebbetts
5. SCHOOL IMPROVEMENT COUNCIL: Mr. Mike Douglas
6. OTHERS* (May include school board members, administrators, School Improvement
Council members, students, PTO members, agency representatives, university partners,
etc.)
POSITION NAME
Instructional Coach Anne C. Peden
Program Coordinator Alonda Rollison
Teacher Denise Henson
Teacher Sarah Evanson-Atkinson
Teacher Hailey Caldwell
Teacher Gaille Cook
Teacher Karla Hensler
Teacher Taki Johnson
Teacher Barbara Calmes
Teacher Louise Riley
Student Willkins Norwood
4
*REMINDER: If state or federal grant applications require representation by other stakeholder groups, it is appropriate to include additional stakeholders to meet those requirements and to ensure that the plans are aligned.
5
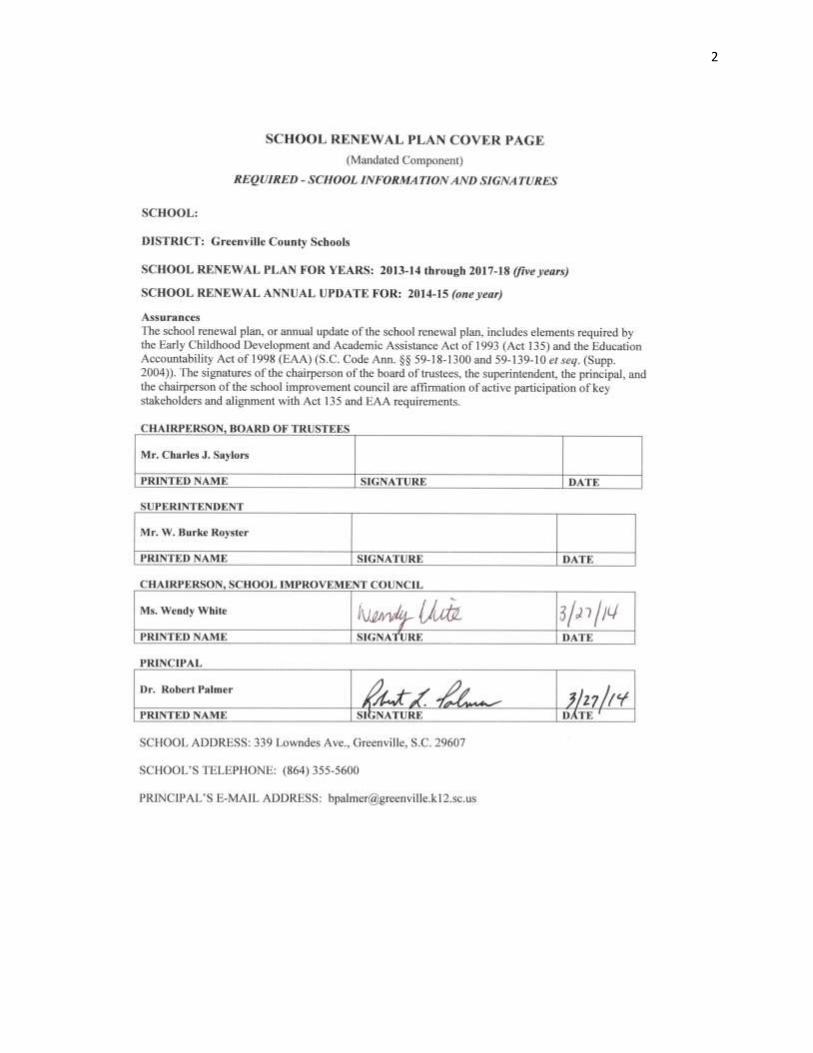
ASSURANCES FOR SCHOOL PLAN
Act 135 Assurances
Assurances, checked by the principal, attest that the district complies with all applicable Act 135
requirements.
_____ Academic Assistance, PreK–3
The school makes special efforts to assist children in PreK–3 who demonstrate a need for extra
or alternative instructional attention (e.g., after-school homework help centers, individual
tutoring, and group remediation).
__X__ Academic Assistance, Grades 4–12
The school makes special efforts to assist children in grades 4–12 who demonstrate a need for
extra or alternative instructional attention (e.g., after-school homework help centers,
individual tutoring, and group remediation).
__X__ Parent Involvement
The school encourages and assists parents in becoming more involved in their
children’s education. Some examples of parent involvement initiatives include making
special efforts to meet with parents at times more convenient for them, providing
parents with their child’s individual test results and an interpretation of the results,
providing parents with information on the district’s curriculum and assessment
program, providing frequent, two-way communication between home and school,
providing parents an opportunity to participate on decision-making groups,
designating space in schools for parents to access educational resource materials,
including parent involvement expectations as part of the principal’s and
superintendent’s evaluations, and providing parents with information pertaining to
expectations held for them by the school system, such as ensuring attendance and
punctuality of their children.
__X__ Staff Development
The school provides staff development training for teachers and administrators in the teaching
techniques and strategies needed to implement the school/district plan for the improvement
of student academic performance. The staff development program reflects requirements of
Act 135, the EAA, and the National Staff Development Council’s revised Standards for Staff
Development.
6
__X__ Technology
The school integrates technology into professional development, curriculum development, and
classroom instruction to improve teaching and learning.
__X__ Recruitment
The district makes special and intensive efforts to recruit and give priority to serving those
parents or guardians of children, ages birth through five years, who are considered at-risk of
school failure. “At-risk children are defined as those whose school readiness is jeopardized by
any of, but no limited to, the following personal or family situation(s): Educational level of
parent below high school graduation, poverty, limited English proficiency, significant
developmental delays, instability or inadequate basic capacity within the home and/or family,
poor health (physical, mental, emotional) and/or child abuse and neglect.
__X__ Collaboration
The school (regardless of the grades served) collaborates with health and human services
agencies (e.g., county health departments, social services departments, mental health
departments, First Steps, and the family court system).
__X _ Developmental Screening
The school ensures that the young child receives all services necessary for growth and
development. Instruments are used to assess physical, social, emotional, linguistic, and
cognitive developmental levels. This program normally is appropriate at primary and
elementary schools, although screening efforts could take place at any location.
_____ Half-Day Child Development
The school provides half-day child development programs for four-year-olds (some districts
fund full-day programs). The programs usually function at primary and elementary schools,
although they may be housed at locations with other grade levels or completely separate from
schools.
_____ Developmentally Appropriate Curriculum for PreK–3
The school ensures that the scope and sequence of the curriculum for PreK–3 are appropriate
for the maturation levels of students. Instructional practices accommodate individual
differences in maturation level and take into account the student's social and cultural context.
_____ Parenting and Family Literacy
The school provides a four component program that integrates all of the following activities:
interactive literacy activities between parents and their children (Interactive Literacy Activities);
training for parents regarding how to be the primary teachers for their children and full
7
partners in the education of their children (parenting skills for adults, parent education); parent
literacy training that leads to economic self-sufficiency (adult education); and an age-
appropriated education to prepare children for success in school and life experiences (early
childhood education). Family Literacy is not grade specific, but generally is most appropriate
for parents of children at the primary and elementary school levels and below, and for
secondary school students who are parents. Family Literacy program goals are to strengthen
parent involvement in the learning process of preschool children ages birth through five years;
promote school readiness of preschool children; offer parents special opportunities to
improve their literacy skills and education, a chance to recover from dropping out of school;
and identify potential developmental delays in preschool children by offering developmental
screening.
_____ Coordination of Act 135 Initiatives with Other Federal, State, and District Programs
The district ensures as much program effectiveness as possible by developing a district-
wide/school-wide coordinated effort among all programs and funding. Act 135
initiatives are coordinated with programs such as Head Start, First Steps, Title I, and
programs for students with disabilities.
8
TABLE OF CONTENTS
COVER PAGE FOR SCHOOL PLANS STAKE HOLDER INVOLVEMENT FOR SCHOOL PLANS ASSURANCES FOR SCHOOL PLANS
TABLE OF CONTENTS ............................................................................................................. 8
INTRODUCTION ..................................................................................................................... 9
EXECUTIVE SUMMARY ......................................................................................................... 12
SCHOOL PROFILE ................................................................................................................. 14
MISSION, VISION, BELIEFS.................................................................................................... 20
DATA ANALYSIS AND NEEDS ASSESSMENT ........................................................................... 24
STUDENT ACHIEVEMENT-GOAL 1 ......................................................................................... 24
TEACHER AND ADMINISTRATOR QUALITY-GOAL 2 ............................................................... 26
SCHOOL CLIMATE-GOAL 3 .................................................................................................... 27
ACTION PLAN ...................................................................................................................... 29
GOAL AREA 1 ...................................................................................................................... 29
GOAL AREA 2 ....................................................................................................................... 49
GOAL AREA 3 ....................................................................................................................... 51
SCHOOL REPORT CARD 2012-2013 ....................................................................................... 60
9
Greenville Middle Academy
Introduction
An executive committee, consisting of the five Standards chairs who divided the stakeholders into subgroups for working teams. Following the Greenville County Portfolio process, the committees gathered data on Information and Communication/Values/Beliefs, Leadership, Curriculum and Instruction, Resources/Services, Assessment/Data. As teams worked, they presented findings to the stakeholders in faculty and SIC meetings. The Committees used data to compile indicators for the Portfolio and AdvancED documents. The Greenville County Portfolio process helped guide the AdvancED Self-Study. We analyzed data using Parent, Staff, Student Survey results, State Depart School Reports Cards, and ESEA Federal Accountability Rating. The self-study was guided by State and District Technology Plans, National Professional Development Standards, the Greenville County Strategic Plan, and the Greenville County Portfolio process. Greenville Middle School Academy is fully accredited by the South Carolina State Department of Education and AdvancED. We also meet all planning, implementation, evaluation and reporting requirements of the Educational Accountability Act and Act 135, and the Greenville County Strategic Plan. Executive Committee members included chairs of each of the subcommittees. Each grade level team or the ELA, Math, Special Education, or Related Arts Department was represented. The committees included the following: Communication/Values/Beliefs, Leadership; Curriculum and Instruction, Resources/Services, and Assessment/Data.
10
AdvancED Groups
Standard 1
Communication/Values/Beliefs
Karla Hensler--Chair
Claire Berg
Gaille Cook
Haydn Culbertson
Gabbie Dempsey
Karen Greene
Cindy Kay
Amy Knobel-Chester
Susan Park
Sara Tuttle
Standard 2 – Leadership
Kenneth Skipper--Chair
Hailey Caldwell
Charlie Forrester
Jim Hensler
Ann Howell
Anne Matthews
Mary McDade
Kristine White
Louise Riley
Cathy Stephens
Stephanie Yarbrough
Standard 3 – Curriculum and Instruction
Ginger Shirley--Chair
Brad Baker
Kathleen Carey
Frank Anderson
Joey Colon
Christina Devon
Angela Phillips
Nick Hall
Temple Langston
11
Barry Rhodes
David Roach
Allonda Rollison
Standard 4 -- Resources/Services Elizabeth Seay--Chair
Irena Anderson
Pamela Cao
Sheri Corbin
Laurie Gallego
Chancey Greco
Sean Hogan
Standard 5 – Assessment/Data Barbara Calmes--Chair
Temechia Bates
Jackie Batson
Laura Black
David Gray
Denise Henson
Taki Johnson
Debra Lusk
Brooke Patterson
Blair Powers
Janie Wassynger
12
EXECUTIVE SUMMARY OF NEEDS ASSESSMENT FINDINGS Greenville Middle School Academy of Traditional Studies
Needs Assessment In the area of Student Achievement, to raise the academic challenge and performance of each student in all minority groups has been our most significant challenge. Achievement is discussed in the Data Analysis for Goal 1. Greenville Middle needs to:
Focus on maintaining school writing performance as measured by PASS.
increase overall school ELA performance by 0.3 percent each year.
increase overall school Math performance by 1 percent each year.
increase overall school Science performance by 0.5 percent each year.
increase overall school Social Studies performance by 0.5 percent each year.
focus on raising minority student performance (African-Americans and Hispanics) in all subject areas.
In the area of Teacher/Administrative Quality, goal two focuses on maintaining quality instructional and administrative personnel. We need to:
maintain in-house Professional Development to improve instruction in reading and writing across the curriculum and Global integrated studies.
revisit 21st Century and Common Core skills.
continue reading/writing/vocabulary across the curriculum.
continue data analysis and incentives. School Climate, goal three, addresses several delineated items regarding Greenville Middle: attendance; expulsion rate; and parent, student, and teacher survey results regarding learning environment and safety at school. Although survey results are generally high in all areas, several concerns were identified. We need to:
maintain the Global perspective and classes that have been initiated and work to extend this focus.
introduce Classroom Character Education/Career Education Program.
introduce Focus Discussion Groups.
teach Etiquette and Safety in all life connections.
communicate this work with parents, students, and teachers. Academic Programs and Features
Greenville Middle School Academy of Traditional and Global Studies maintains an emphasis on reading, writing, and vocabulary development across the curriculum with a strong liberal arts interdisciplinary curriculum. Our program also includes a global focus which incorporates skills identified by the Partnership for the 21st Century. Because 21st Century Skills include “world
13
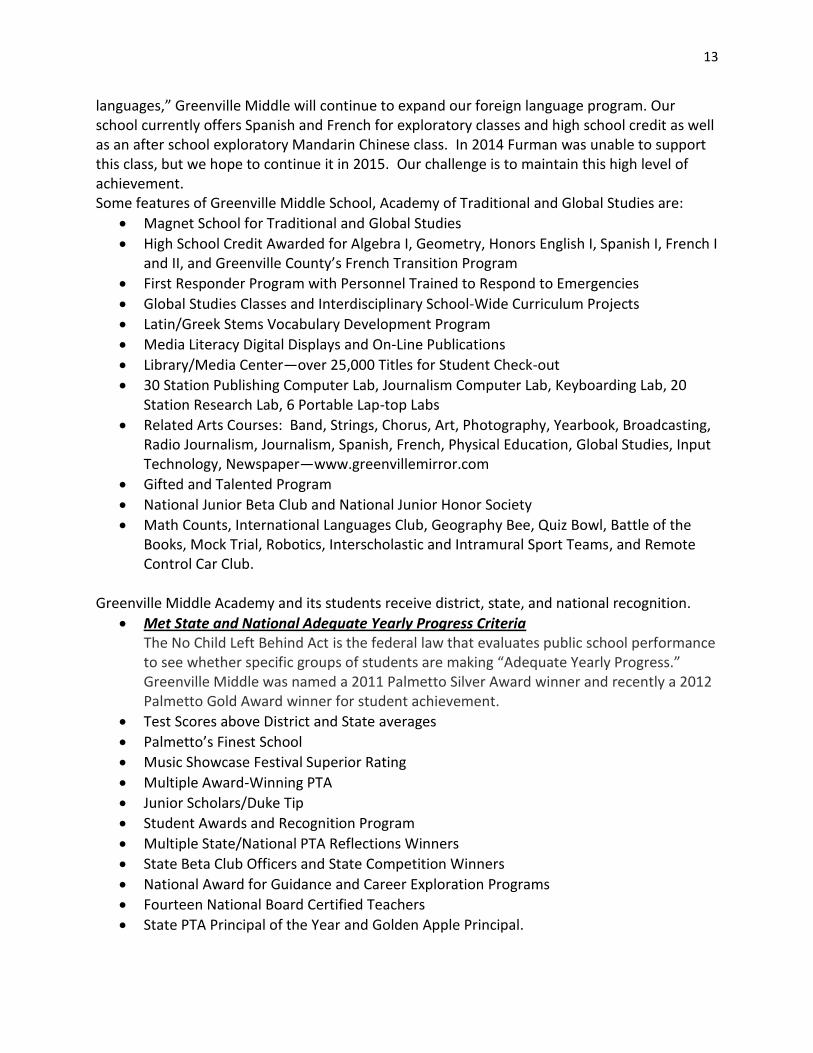
languages,” Greenville Middle will continue to expand our foreign language program. Our school currently offers Spanish and French for exploratory classes and high school credit as well as an after school exploratory Mandarin Chinese class. In 2014 Furman was unable to support this class, but we hope to continue it in 2015. Our challenge is to maintain this high level of achievement. Some features of Greenville Middle School, Academy of Traditional and Global Studies are:
Magnet School for Traditional and Global Studies
High School Credit Awarded for Algebra I, Geometry, Honors English I, Spanish I, French I and II, and Greenville County’s French Transition Program
First Responder Program with Personnel Trained to Respond to Emergencies
Global Studies Classes and Interdisciplinary School-Wide Curriculum Projects
Latin/Greek Stems Vocabulary Development Program
Media Literacy Digital Displays and On-Line Publications
Library/Media Center—over 25,000 Titles for Student Check-out
30 Station Publishing Computer Lab, Journalism Computer Lab, Keyboarding Lab, 20 Station Research Lab, 6 Portable Lap-top Labs
Related Arts Courses: Band, Strings, Chorus, Art, Photography, Yearbook, Broadcasting, Radio Journalism, Journalism, Spanish, French, Physical Education, Global Studies, Input Technology, Newspaper—www.greenvillemirror.com
Gifted and Talented Program
National Junior Beta Club and National Junior Honor Society
Math Counts, International Languages Club, Geography Bee, Quiz Bowl, Battle of the Books, Mock Trial, Robotics, Interscholastic and Intramural Sport Teams, and Remote Control Car Club.
Greenville Middle Academy and its students receive district, state, and national recognition.
Met State and National Adequate Yearly Progress Criteria The No Child Left Behind Act is the federal law that evaluates public school performance to see whether specific groups of students are making “Adequate Yearly Progress.” Greenville Middle was named a 2011 Palmetto Silver Award winner and recently a 2012 Palmetto Gold Award winner for student achievement.
Test Scores above District and State averages
Palmetto’s Finest School
Music Showcase Festival Superior Rating
Multiple Award-Winning PTA
Junior Scholars/Duke Tip
Student Awards and Recognition Program
Multiple State/National PTA Reflections Winners
State Beta Club Officers and State Competition Winners
National Award for Guidance and Career Exploration Programs
Fourteen National Board Certified Teachers
State PTA Principal of the Year and Golden Apple Principal.
14
Greenville Middle Academy of Traditional Studies Greenville Middle School Academy of Traditional Studies
Characteristics School Profile
History Greenville Middle School began in 1938 as Greenville Junior High School in the building that had been Greenville High School. It was located on Prospect Hill at the head of what is now known as McBee Avenue. Originally constructed in 1888, the facility was the first public school building in the city. Greenville Junior High School served the community from 1938 until 1965 at this location. During this period, the 82 separate school districts in Greenville County were consolidated into one unified district. By 1949, the school's population had increased to 1600 students. In the fall of 1965, Greenville Junior High moved to the current facility. When the school district implemented the middle school concept, Greenville Junior High School became Greenville Middle School. Because of declining population, in 1997 Greenville Middle School became a Select School, Greenville Middle Academy, with a focus on reading, writing, and vocabulary across the curriculum. Select School status impacts our school program in two major ways. As a Select School, we are allowed to recruit students from all attendance areas of the school district— students who are interested in our academic focus on "Reading, Writing, and Vocabulary Development across the Curriculum." Students have chosen to attend Greenville Middle Academy from approximately twenty other public and private middle schools. The school district also budgets extra funds to support Select School programs. Our budget has funded hardware and software for a Writing Lab, a lab manager/technology coordinator, a program coordinator, a journalism teacher, and instructional supplies to support our school-wide focus. Beginning 2007-2008, Greenville Middle proposed a rebirth from “Traditional Studies” to “Traditional Studies: A Global Perspective.” This new Renaissance for our “flat world” learner must include expanding our study of the English Language Arts of Reading, Writing, and Vocabulary Across the Curriculum by including the other two Language Arts as defined in the state Standards—Listening/Speaking and Thinking. At the same time, we plan to expand our study of language to examine cultural norms, analyze ways of thinking and problem-solving, and explore global culture while at the same time, delve more deeply into our own complex and diverse cultures. Our recent SACS-CASI Portfolio process identified a need for focus on academic achievement for all students and for minority students in particular. In 2010, Greenville Middle met Adequate Yearly Progress as defined by the SC Department of Education. GMA was the first middle level school in the district to attain that goal.
15
Teacher and Administrator Quality Greenville Middle Academy has a highly qualified staff. 60% of teachers have ten or more years’ experience. 81.6% of staff members hold advanced degrees, and 5.5% of staff members hold Doctorate degrees. Eight teachers (14.6%) are National Board Certified. Over the past few years the experience level of our normally stable staff has lowered as many teachers have retired. Teacher attendance rate for 2012-2013 was 94.9%. 24% of the staff is male, and 93% are white with 7% African American. Administration Our school PTSA is routinely involved in the operation of our school. Without them, many of the efforts we initiate would not be possible. Currently, we send out a form at the beginning of the school year to determine the volunteer skills available. Parents, teachers, and administrators are very involved in our School Improvement Council. They meet quarterly and discuss opportunities to support our school. They are currently seeking ways to help our school maintain a high level of instruction. Greenville Middle School currently has a Leadership Team made up of grade level team leaders, special area team leaders, and administrators. They meet with the principal on the second Tuesday of the month to share and discuss school-wide issues. Administrators: Dr. Robert Palmer Ms. Stephanie Yarbrough – MA +30 Dr. Lee Givins Support staff: 2.5 guidance counselors: Taki Johnson, Pamela Cao, Laurie Gallego Three clerks for data, guidance, and attendance: Faye Fedder, Jill Hall, Sandra Lord Secretary/bookkeeper: Rhonda Duncan Program Director – Alonda Rollison
Instructional Coach – Dr. Anne Peden
Student Demographic Data Greenville Middle is an inner-city school. From 1988 to 1996 as families began to leave the downtown area and relocate in suburban areas, enrollment dropped from 832 students to 654. District plans to construct a new Riverside Middle School further impacted Greenville Middle's enrollment. In 1996, Greenville Middle applied to become a "Select School" and in 1997 became Greenville Middle School Academy of Traditional Studies.
16
Since that time, our enrollment has increased. During the 2004-2005 school year, we began to prepare for building renovation while remaining on site. After two years with the eighth grade in portable classrooms and no progress toward construction, the district decided to move Greenville Middle off site to the old Southside High School approximately 7 miles and 15-20 minutes from Greenville Middle. Because of the distance, many of our home-based students decided to attend schools closer to their neighborhoods, and magnet interest dropped as well. Since we have returned to the newly remodeled building, students have returned to GMA. Currently, we serve 810 home-based and magnet students.
17
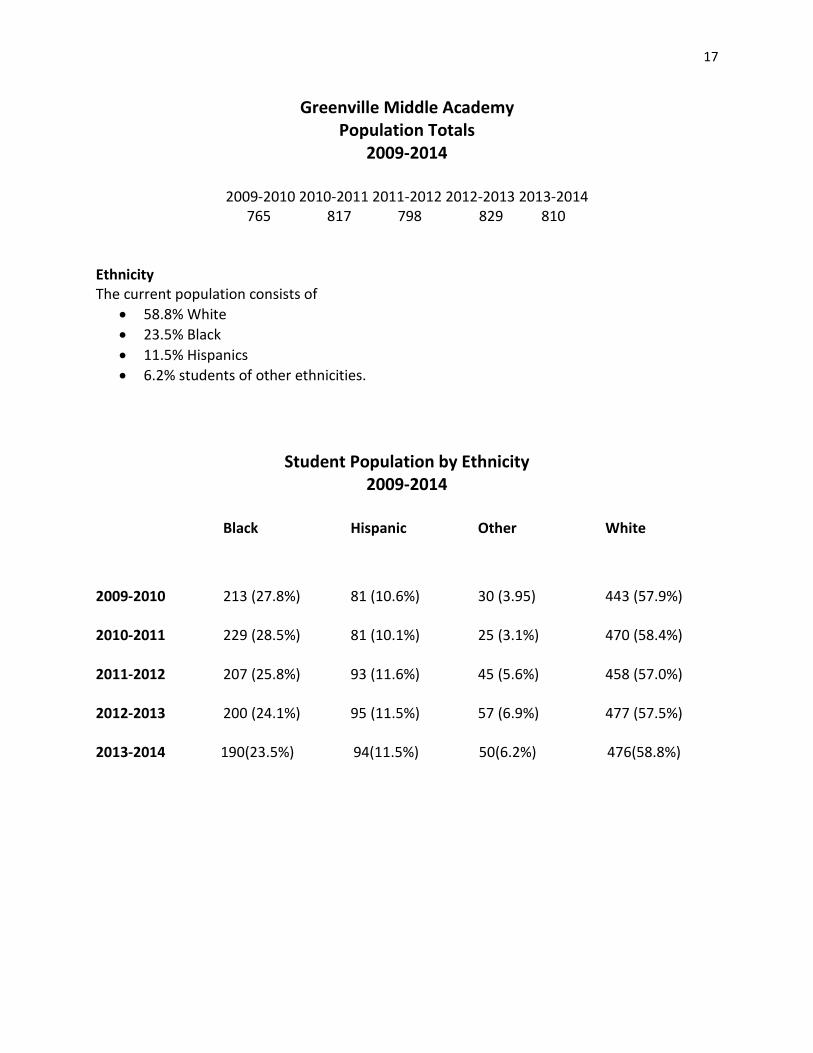
Greenville Middle Academy Population Totals
2009-2014
2009-2010 2010-2011 2011-2012 2012-2013 2013-2014 765 817 798 829 810
Ethnicity The current population consists of
58.8% White
23.5% Black
11.5% Hispanics
6.2% students of other ethnicities.
Student Population by Ethnicity 2009-2014
Black Hispanic Other White
2009-2010 213 (27.8%) 81 (10.6%) 30 (3.95) 443 (57.9%)
2010-2011 229 (28.5%) 81 (10.1%) 25 (3.1%) 470 (58.4%)
2011-2012
207 (25.8%) 93 (11.6%) 45 (5.6%) 458 (57.0%)
2012-2013
200 (24.1%) 95 (11.5%) 57 (6.9%) 477 (57.5%)
2013-2014 190(23.5%) 94(11.5%) 50(6.2%) 476(58.8%)

18
Lunch Status 2009-2013
Paid Free/Reduced
2008-2009 59.3% 40.7%
2009-2010 54% 46.0%
2010-2011 55.8% 44.2%
2011-2012 2012-2013
58.5%
60.7%
41.5%
39.1%
Attendance Over the 2012-2013 year, 97.0% was Greenville Middle’s average attendance. Retention Rate During the academic year 2012-2013 Greenville Middle had a student retention rate of 1.0% which was down from 1.5% the year before. Exceptional Education GMS served 10.7% students who are classified as needing special education in 2012-2013. The majority of students receiving special education assistance were learning disabled, followed by speech and language impaired, autistic, trainable mentally disabled, and visually handicapped. Gifted and Talented Students in our gifted program are identified according to the South Carolina state guidelines and school district policies. At the middle school level, these students are served in the Language Arts classrooms for Gifted and Talented instruction. Total gifted population was 32.7% in 2011-2012 and 31.5% in 2012-2013 . 39.8% of the total population was enrolled in high school credit courses in 2011-2012.
19
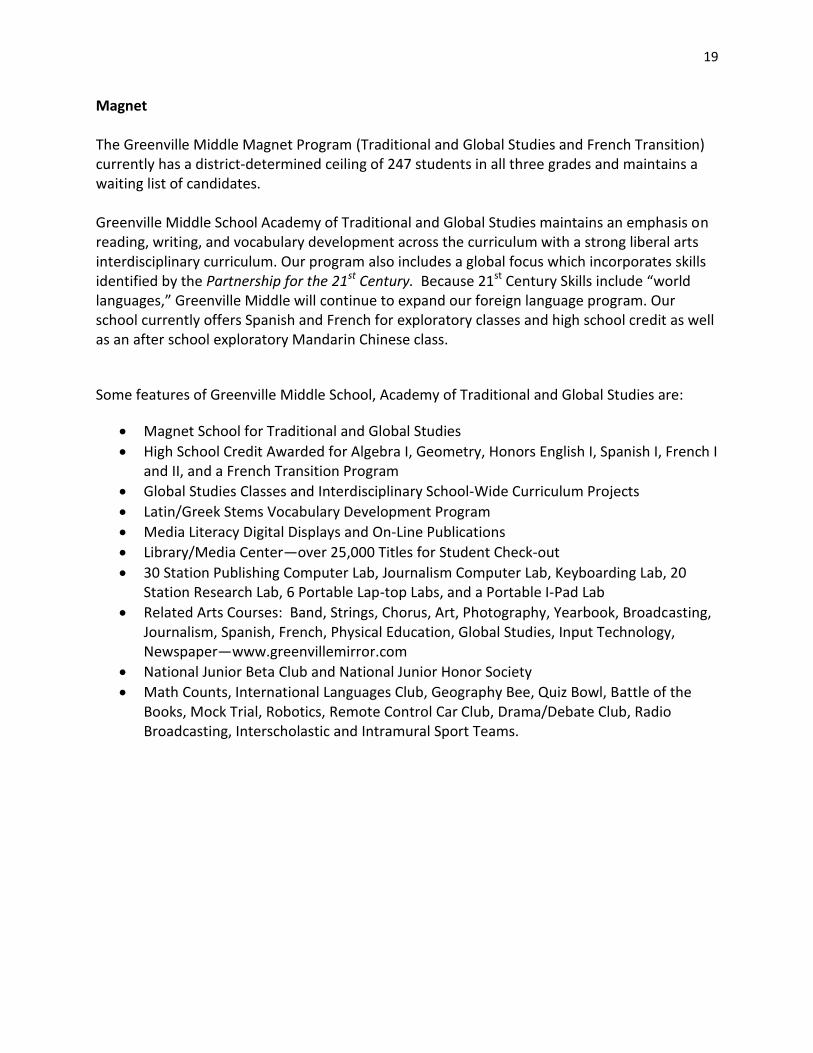
Magnet The Greenville Middle Magnet Program (Traditional and Global Studies and French Transition) currently has a district-determined ceiling of 247 students in all three grades and maintains a waiting list of candidates. Greenville Middle School Academy of Traditional and Global Studies maintains an emphasis on reading, writing, and vocabulary development across the curriculum with a strong liberal arts interdisciplinary curriculum. Our program also includes a global focus which incorporates skills identified by the Partnership for the 21st Century. Because 21st Century Skills include “world languages,” Greenville Middle will continue to expand our foreign language program. Our school currently offers Spanish and French for exploratory classes and high school credit as well as an after school exploratory Mandarin Chinese class.
Some features of Greenville Middle School, Academy of Traditional and Global Studies are:
Magnet School for Traditional and Global Studies
High School Credit Awarded for Algebra I, Geometry, Honors English I, Spanish I, French I and II, and a French Transition Program
Global Studies Classes and Interdisciplinary School-Wide Curriculum Projects
Latin/Greek Stems Vocabulary Development Program
Media Literacy Digital Displays and On-Line Publications
Library/Media Center—over 25,000 Titles for Student Check-out
30 Station Publishing Computer Lab, Journalism Computer Lab, Keyboarding Lab, 20 Station Research Lab, 6 Portable Lap-top Labs, and a Portable I-Pad Lab
Related Arts Courses: Band, Strings, Chorus, Art, Photography, Yearbook, Broadcasting, Journalism, Spanish, French, Physical Education, Global Studies, Input Technology, Newspaper—www.greenvillemirror.com
National Junior Beta Club and National Junior Honor Society
Math Counts, International Languages Club, Geography Bee, Quiz Bowl, Battle of the Books, Mock Trial, Robotics, Remote Control Car Club, Drama/Debate Club, Radio Broadcasting, Interscholastic and Intramural Sport Teams.
20
MISSION, VISION, BELIEFS In September of the 2012-2013 school year, Greenville Middle School began rebranding our beliefs and mission by examining our School Renewal Plan and Greenville County’s Guide for Educational Excellence: Priorities for Performance. Our charge was to revisit and re-brand ourselves. This comprehensive process to build consensus involved all school stakeholders: teachers, administrators, support staff, parents, students, the School Improvement Committee and the local PTA Board. A core group of faculty met to begin the process to clarify our values and beliefs, purpose, mission, vision, and goals. Study groups examined the school’s current mission and vision statements. We then answered the following questions about Greenville Middle:
What does GMA do very well? What are the most important things we want to communicate to the community?
Is there anything we need to change about what we already do?
What are several ways we can reach out to the community? This faculty study group prepared an initial draft of the composite beliefs and submitted them to the full staff for review and comment. We revised the draft based on feedback we received. Values and Beliefs We understand the necessity for preparing students for increasingly rigorous higher order thinking and performance, a mastery of 21st Century Skills, and our need to prepare them to compete in a global society. Our students will face career challenges and participate in a globally competitive workforce. The results of those sessions follow. We believe...
The student is the center of the educational process.
Education is the shared responsibility of the student, home, school, and community.
All students can progress.
Each student is a valued individual with unique intellectual, physical, social, and emotional needs.
Students learn best in a safe, orderly, and inviting environment that provides opportunities for success.
Students learn best when they accept responsibility for being actively engaged with the teacher in the learning process.
Positive relationships and mutual respect among and between students and staff enhance students' self-esteem.
Students learn in different ways and should be provided with a variety of curricula, instructional approaches, activities, and assessments to support their learning.
A unified focus with state and international standards should integrate international content through all subject areas.
21
The school should provide career awareness and experiences for all students.
Children need opportunities to connect with international communities.
High expectations for all students and teachers should guide the development of curriculum and instructional strategies.
Students should have opportunities to study one or more world languages.
The school should provide educational experiences that actively engage students and enable them:
o to demonstrate understanding of essential knowledge and skills o to communicate effectively o to solve problems competently o to think critically and creatively o to act responsibly o to apply learning in meaningful contexts o to produce quality work.
Commitment to continuous improvement is critical for all students to achieve their maximum potential.
Mission E=MC2
Enlightenment = Making Children Count
Shared Vision The following are the curriculum, instruction, assessment, and environmental strategies to support effective learning for Greenville Middle School students: Curriculum
Organize teaching to address state standards.
Integrate standards into our Magnet School interdisciplinary focus.
Provide a variety of instructional methods to accommodate learning styles.
Emphasize reading and writing across the curriculum as a means of accessing, organizing, and communicating information in all disciplines.
Focus on Latin and Greek stems to enhance vocabulary development.
Teach specific Global Knowledge and Skills
Offer a capstone course devoted to global knowledge and skills.
Provide a comprehensive career awareness program.
Align instruction and assessment.
Offer a challenging curriculum. Instruction
Employ current research-based methodology.
Maintain high expectations for teachers and students.
Vary expectations to address all learning styles and abilities.
22
Provide hands-on, interactive, student-centered learning.
Implement a technologically advanced communication and learning program. Allow flexibility in grouping students for instruction.
Design lessons for students to learn to work cooperatively.
Employ Learning Focused methods.
Maintain a range of ages, experiences, and backgrounds of staff members.
Group students and teachers to allow for teaming and time for team planning.
Foster independent learning techniques in students.
Focus staff development to address identified instructional needs. Assessment
Use multiple assessment formats—portfolios, performances, rubrics, teacher created assessments, and student created self-assessments.
Use assessments to identify areas for re-teaching.
Vary assessments according to ability levels.
Design objective and alternative types of assessments Environment
Insure an environment that is o safe o caring o supportive o respectful o inviting o friendly.
Maintain and consistently enforce a strong school-wide discipline plan.
Maintain a comfortable temperature.
Continue a strong and supportive PTA relationship.
Maintain a supportive and visible administration.
Value school, student, and teacher achievement.
Vision Greenville Middle School Academy of Traditional Studies’ vision is to offer a strong Traditional and Global Studies program as a choice for Greenville County students. The academic program encompasses diverse, academically challenging opportunities focusing on reading, writing, and vocabulary development, acquiring 21st Century skills, and global understanding as a means of accessing, organizing, and communicating knowledge in all subject areas. The staff of GMA plans to prepare adolescents to become motivated, self-directed, confident, life-long learners and global citizens in an ever changing technological world. We understand the necessity for preparing students for increasingly rigorous higher education coursework in order for them to compete in a global society. Our students will face career challenges and participate in a globally competitive workforce.
23
Goals Raise student performance by offering an academically challenging curriculum focused
on reading, writing, and vocabulary development in all curricular areas.
Support learning by insuring a safe, caring, supportive respectful, inviting, and friendly school environment.
Collect relevant data in a timely, organized, and systematic manner.
24
Data Analysis and Needs Assessment
Student Achievement – Goal 1
Data from the relevant sources include PASS data from the SC State Report Cards, 2012 and
2013, and the ESEA/Federal Accountability System Report. For the 2013 School Year, the Report
Card afforded Greenville Middle an “Excellent” Absolute Rating and a “Good” Growth Rating.
The Federal Accountability System awarded Overall Weighted Points of 92.8 and an Overall
Grade Conversion of A.
DATA ANALYSIS
The first goal addresses student achievement. Therefore, teachers looked at PASS data to
analyze for strengths and gaps. The following information is key to their findings.
GMA’s magnet focus is Traditional Studies (reading, writing, and vocabulary across the
curriculum). An emphasis on improving learning in all subject areas, reading data is especially
important. The following PASS data helps reveal our strengths and needs.
Over time PASS English Language Arts scores show the percentages of students scoring Met or
Exemplary have been near 80%. This slight fluctuation may be attributed to changes in the
specific students enrolled, but the baseline percentage (82.6%) was the highest of any year
recorded. Maintaining that high percentage proved difficult. In 2009- 2010 the percentage fell
to 77.8%, which was a drop of nearly six points. In 2010-2011 two points were regained
(79.8%). The percentage of students who scored Met and Exemplary in 2012 rose to 87.7%. In
2013 the percentage fell slightly to 86.9% which is less than a percentage point.
For 2013-2018, our goal is to maintain the percentage of students meeting standard in writing
as measured by the Palmetto Assessment of State Standards from <0.5% in 2012 to <0.5% in
2018. For ELA our goal is to increase the percentage of students meeting standard in English
Language Arts (reading and research) as measured by the PASS test from 83.7% in 2012 to
85.5% in 2018.
2012-2013 Data
On closer analysis of all tested areas in 2013, Greenville Middle scored in the middle of state
“Schools Like Ours” and at or near the top of all district middle schools especially in the
communication areas. In Writing and ELA, PASS scores for all students show percent of students
scoring Exemplary to rise and then decrease over the 3-year period. In 2012, 66.8% of students
scored Exemplary in Writing, but in 2013 only 60.4% scored at that level. Over the 3-year
25
period, Math, Science, and Social Studies saw an increase in percent of students scoring
Exemplary while the percent scoring Not Met decreased over this same period.
For all ethnicities, the percent scoring Not Met has remained relatively constant over the three-
year period. Hispanic students’ scores show an increase in percent of students scoring
Exemplary over the period while the percent scoring Not Met remained unchanged. For White
students percent of students scoring Exemplary has increased over the period while percent of
students scoring Not Met has increased 205%. Similar to White students, Black students’
Exemplary scores increased over time as did Not Met scores. On the PASS ELA test, more White
students score Met or Exemplary than both Blacks and Hispanics. Of the three subgroups,
Hispanic students scored lowest.
In Math, Hispanic students’ scores showed improvement in percent of students moving from
Not Met into the Met category. Percent scoring Exemplary was basically unchanged. Scores for
White students over this period have remained unchanged in the Not Met category while the
percent of student scoring Exemplary has increased about 10% over time. The same is true for
Black students. The percent of Black students in the Not Met category is about four times
greater than White students. Fewer percent of Hispanic students score Not Met than do Blacks.
For all subgroups in Social Studies, percent scoring Met has increased over the three-year
period. All subgroups score lower that on ELA PASS tests. While percent of White students
scoring has increased over time, so has the percent scoring Not Met. For Black students,
students scoring Not Met has decreased over the period and the percent scoring Exemplary has
increased.
Information was also gathered using the Performance Goals on student achievement. For
comparing growth from 2012 to 2013 the following data was garnered.
Writing scores improved 3.3 percentage points above maintance.
ELA scores improved 3.2 percentage points exceeding the goal of 0.3 percent.
Math scores improved 2.9 percentage points exceeding the goal of 1 percent.
Science scores improved 1 percentage point exceeding the goal of 0.5 percent.
Social Studies scores declined 1.7 percentage points not meeting the goal of 0.5 percent.
In ELA African American students increased 6.2 points and Hispanics improved 11.4. In
Math African Americans increased 3.5 points and Hispanics improved 10.6. For these
groups growth was not evident in Science and Social Studies. The overall data shows
growth from both groups.
26
In addition teachers at Greenville Middle Academy use MAP data for individual class and
student to facilitate unit and lesson planning and to facilitate student improvement.
Teachers identify skills from the Des Cartes charts provided by NWEA in order to instruct pupils
at their levels. Each year fall MAP scores are studied and teachers identify students on which
they focus instruction to move them into the MET category on PASS testing. Teachers aid
students in reaching their growth goals through the use of Des Cartes skills for lesson plans and
by providing incentives.
Teacher and Administrator Quality – Goal 2
The second goal addresses in-house professional development at GMA. Since the magnet focus
at GMA is reading, writing, vocabulary across the curriculum and Global studies, professional
development has been recursive covering these topics as often as possible.
Teachers are offered specific professional development weekly at Greenville Middle. Weekly
Curriculum Meetings focus on teaching skills in reading and writing for all teachers. Specific
data analysis for individuals, grades, departments, and the whole school is implemented every
fall in order to find strengths and weaknesses. Also, technology workshops are used to promote
integration of new programs in the curriculum. Monthly afternoon workshops are offered and
speakers are often brought in to share expertise in various areas. Some teachers also attend
conferences and other out of building offerings using professional development days offered by
the district. The district encourages staff to visit other classrooms within the building as well as
in other schools.
Offerings are often planned according to issues that arise during each year. Teachers are often
given opportunities to lead these workshops and to share ideas and worries in all gatherings.
The Professional Development Calendar lists all in-house PD for this year. Not listed are teacher
classroom visits and attendance at conferences.
NEEDS ASSESSMENT
The preceding discussion identified the following needs.
Continuing opportunities for peer classroom visits are needed.
27
Staff needs to revisit 21st Century Skills and Common Core Standards as implementation
begins.
Revisit teaching reading, writing, and vocabulary across the curriculum and global issues
yearly.
Continue data analysis and incentives yearly.
School Climate – Goal 3
The third goal, School Climate, concerns several delineated items regarding Greenville Middle:
attendance; expulsion rate; and parent, student, and teacher survey results regarding learning
environment and safety at school.
Over the past five years, Greenville Middle has focused on increasing the number of student
opportunities for Global experiences in order to improve several factors especially attendance
and learning environment. New offerings include the following:
Global Studies Exploratory Class for all grades and all students
French Exploratory Class for all grades and all students
French I
International Club
Student opportunities for summer World Travel (France, China, Costa Rica, Europe)
French Immersion Classes
Grade level Integrated Global Units
Mandarin After-school Course
French II.
GMA’s attendance rate in the baseline year of 2012-2013 was 97.0% and the survey results on
the learning environment questions were similarly high. The parent’s score being 91.3%,
28
student’s score 81.1%, and teacher’s score 100%. These perceptions are validation of the work
that has been done.
The two factors relating to security during the school day are expulsion rate and survey results
concerning safety. In the baseline year, no child was expelled from Greenville Middle. Several
were at alternative school for short periods of time though. The survey question regarding
safety at school were all above 90% (parents, 90.6%; students, 91.1%; teachers, 100.0%), which
fell from the previous year slightly for parent and students, but rose for teachers. Several
deadly safety breaches happened in schools across the nation just prior to the survey in 2013.
NEEDS ASSESSMENT
From this discussion the staff has identified the following list of next steps.
Maintain the Global perspective and classes that have been initiated and work to extend
this focus.
Introduce Classroom Character Education/Career Education Program
Introduce Focus Discussion Groups
Teach Etiquette and Safety in all life connections
Communicate this work with parents, students, and teachers.
29
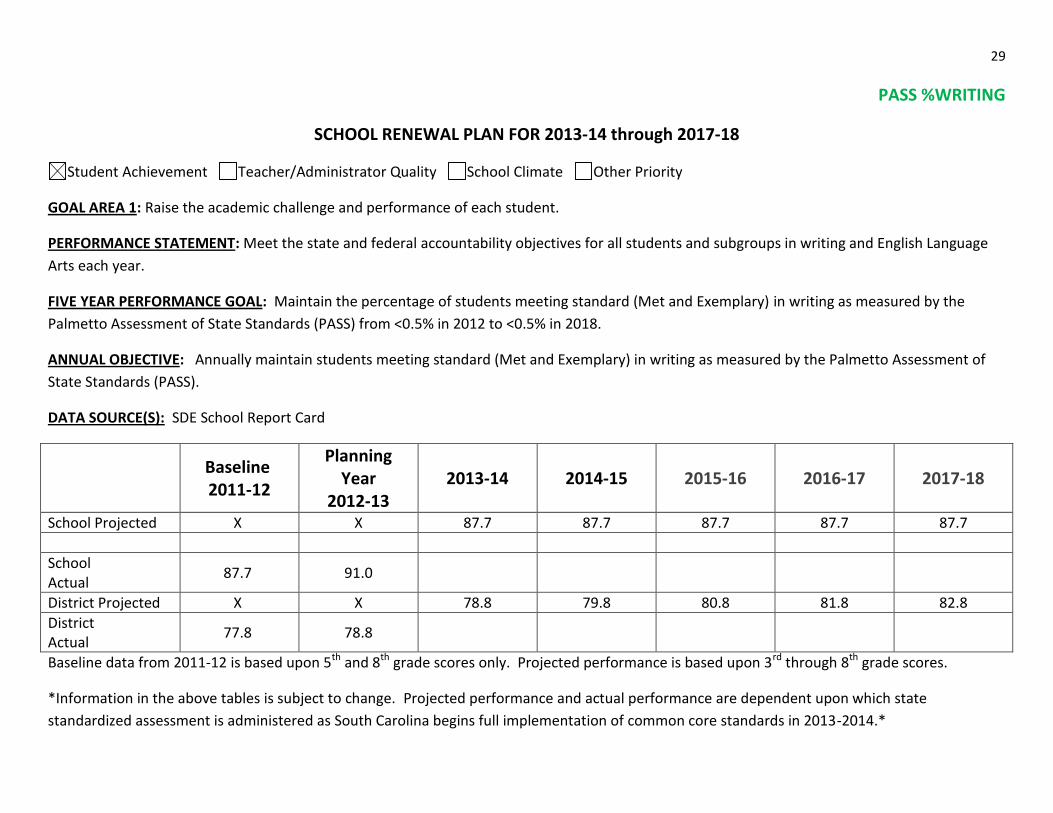
PASS %WRITING
SCHOOL RENEWAL PLAN FOR 2013-14 through 2017-18
Student Achievement Teacher/Administrator Quality School Climate Other Priority
GOAL AREA 1: Raise the academic challenge and performance of each student.
PERFORMANCE STATEMENT: Meet the state and federal accountability objectives for all students and subgroups in writing and English Language
Arts each year.
FIVE YEAR PERFORMANCE GOAL: Maintain the percentage of students meeting standard (Met and Exemplary) in writing as measured by the
Palmetto Assessment of State Standards (PASS) from <0.5% in 2012 to <0.5% in 2018.
ANNUAL OBJECTIVE: Annually maintain students meeting standard (Met and Exemplary) in writing as measured by the Palmetto Assessment of
State Standards (PASS).
DATA SOURCE(S): SDE School Report Card
Baseline 2011-12
Planning Year
2012-13 2013-14 2014-15 2015-16 2016-17 2017-18
School Projected X X 87.7 87.7 87.7 87.7 87.7
School Actual
87.7 91.0
District Projected X X 78.8 79.8 80.8 81.8 82.8
District Actual
77.8 78.8
Baseline data from 2011-12 is based upon 5th and 8th grade scores only. Projected performance is based upon 3rd through 8th grade scores.
*Information in the above tables is subject to change. Projected performance and actual performance are dependent upon which state
standardized assessment is administered as South Carolina begins full implementation of common core standards in 2013-2014.*
30
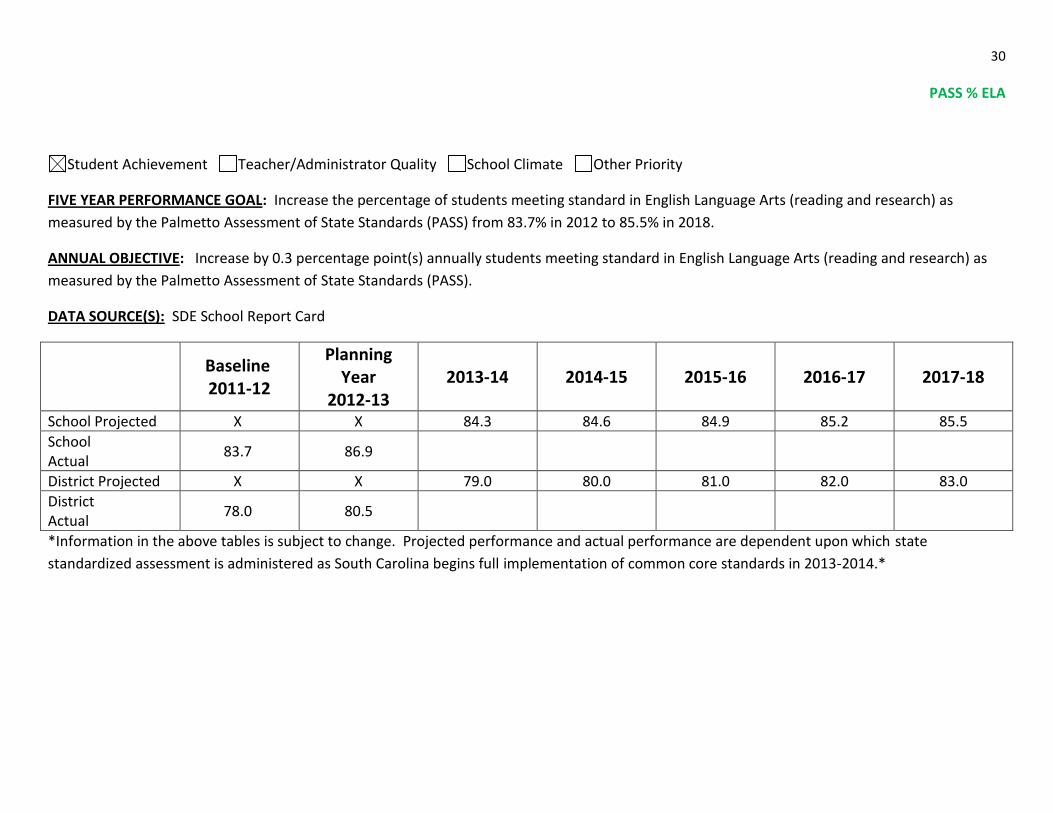
PASS % ELA
Student Achievement Teacher/Administrator Quality School Climate Other Priority
FIVE YEAR PERFORMANCE GOAL: Increase the percentage of students meeting standard in English Language Arts (reading and research) as
measured by the Palmetto Assessment of State Standards (PASS) from 83.7% in 2012 to 85.5% in 2018.
ANNUAL OBJECTIVE: Increase by 0.3 percentage point(s) annually students meeting standard in English Language Arts (reading and research) as
measured by the Palmetto Assessment of State Standards (PASS).
DATA SOURCE(S): SDE School Report Card
Baseline 2011-12
Planning Year
2012-13 2013-14 2014-15 2015-16 2016-17 2017-18
School Projected X X 84.3 84.6 84.9 85.2 85.5
School Actual
83.7 86.9
District Projected X X 79.0 80.0 81.0 82.0 83.0
District Actual
78.0 80.5
*Information in the above tables is subject to change. Projected performance and actual performance are dependent upon which state
standardized assessment is administered as South Carolina begins full implementation of common core standards in 2013-2014.*
31
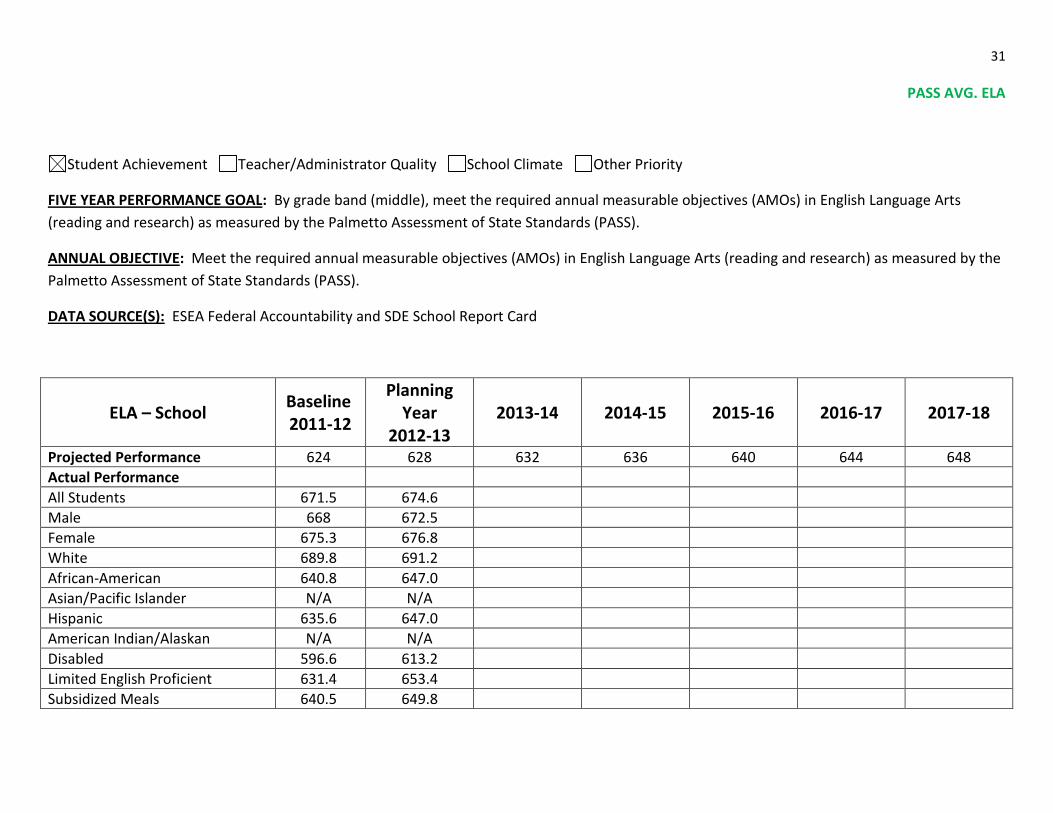
PASS AVG. ELA
Student Achievement Teacher/Administrator Quality School Climate Other Priority
FIVE YEAR PERFORMANCE GOAL: By grade band (middle), meet the required annual measurable objectives (AMOs) in English Language Arts
(reading and research) as measured by the Palmetto Assessment of State Standards (PASS).
ANNUAL OBJECTIVE: Meet the required annual measurable objectives (AMOs) in English Language Arts (reading and research) as measured by the
Palmetto Assessment of State Standards (PASS).
DATA SOURCE(S): ESEA Federal Accountability and SDE School Report Card
ELA – School Baseline 2011-12
Planning Year
2012-13 2013-14 2014-15 2015-16 2016-17 2017-18
Projected Performance 624 628 632 636 640 644 648
Actual Performance
All Students 671.5 674.6
Male 668 672.5
Female 675.3 676.8
White 689.8 691.2
African-American 640.8 647.0
Asian/Pacific Islander N/A N/A
Hispanic 635.6 647.0
American Indian/Alaskan N/A N/A
Disabled 596.6 613.2
Limited English Proficient 631.4 653.4
Subsidized Meals 640.5 649.8
32
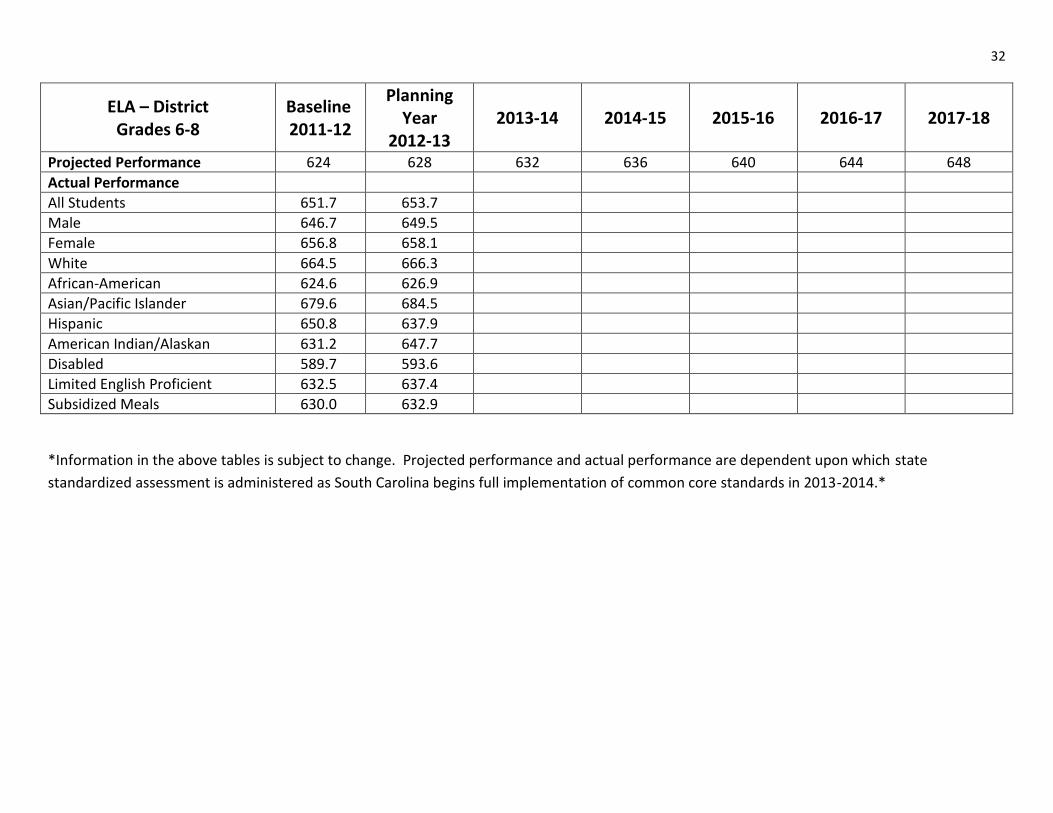
ELA – District Grades 6-8
Baseline 2011-12
Planning Year
2012-13 2013-14 2014-15 2015-16 2016-17 2017-18
Projected Performance 624 628 632 636 640 644 648
Actual Performance
All Students 651.7 653.7
Male 646.7 649.5
Female 656.8 658.1
White 664.5 666.3
African-American 624.6 626.9
Asian/Pacific Islander 679.6 684.5
Hispanic 650.8 637.9
American Indian/Alaskan 631.2 647.7
Disabled 589.7 593.6
Limited English Proficient 632.5 637.4
Subsidized Meals 630.0 632.9
*Information in the above tables is subject to change. Projected performance and actual performance are dependent upon which state
standardized assessment is administered as South Carolina begins full implementation of common core standards in 2013-2014.*
33
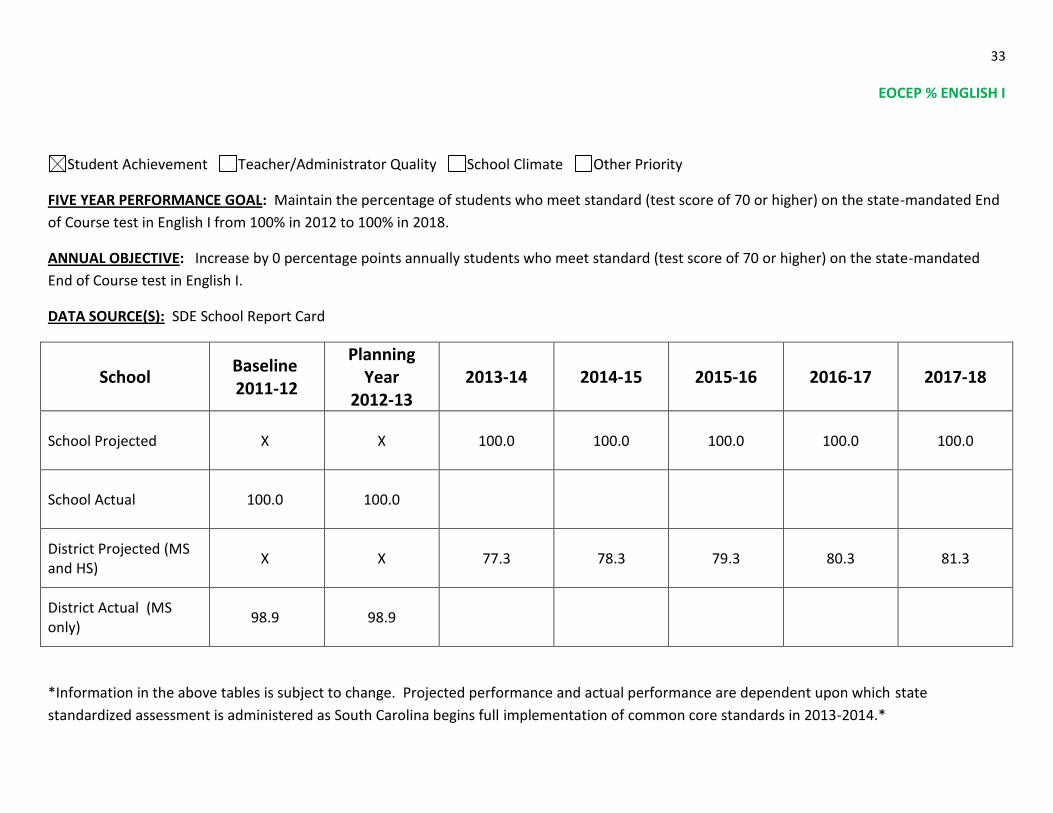
EOCEP % ENGLISH I
Student Achievement Teacher/Administrator Quality School Climate Other Priority
FIVE YEAR PERFORMANCE GOAL: Maintain the percentage of students who meet standard (test score of 70 or higher) on the state-mandated End
of Course test in English I from 100% in 2012 to 100% in 2018.
ANNUAL OBJECTIVE: Increase by 0 percentage points annually students who meet standard (test score of 70 or higher) on the state-mandated
End of Course test in English I.
DATA SOURCE(S): SDE School Report Card
School Baseline 2011-12
Planning Year
2012-13 2013-14 2014-15 2015-16 2016-17 2017-18
School Projected X X 100.0 100.0 100.0 100.0 100.0
School Actual 100.0 100.0
District Projected (MS and HS)
X X 77.3 78.3 79.3 80.3 81.3
District Actual (MS only)
98.9 98.9
*Information in the above tables is subject to change. Projected performance and actual performance are dependent upon which state
standardized assessment is administered as South Carolina begins full implementation of common core standards in 2013-2014.*
34
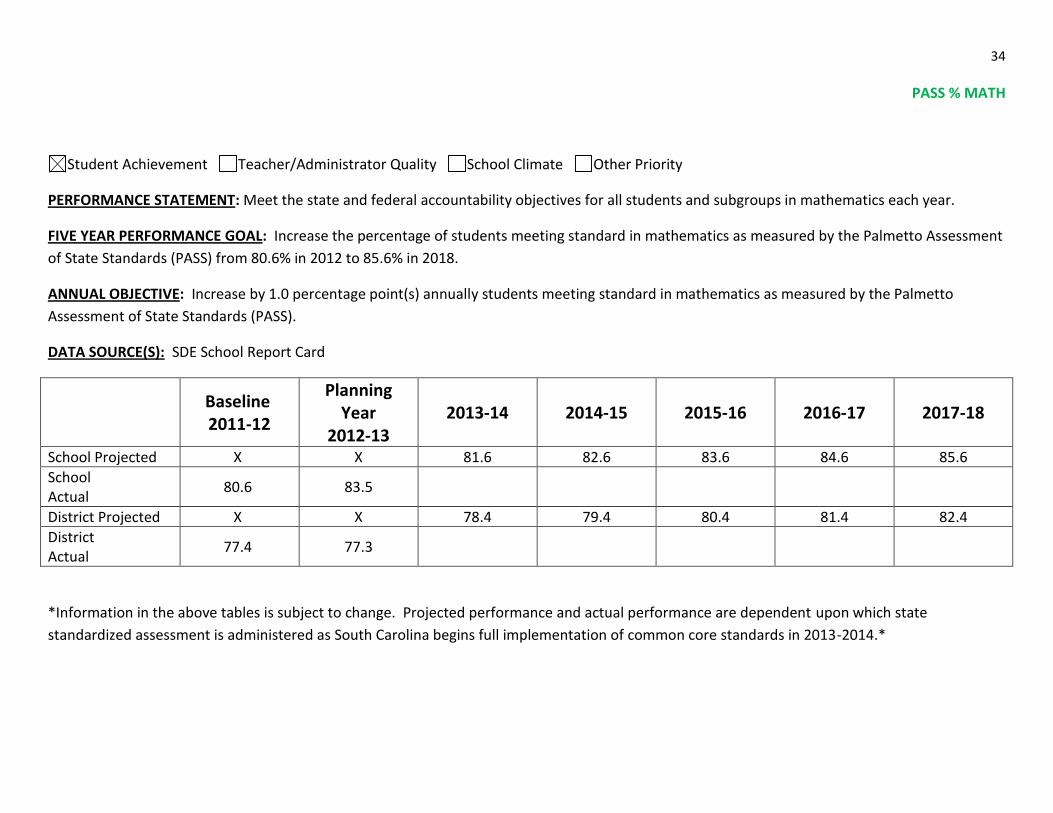
PASS % MATH
Student Achievement Teacher/Administrator Quality School Climate Other Priority
PERFORMANCE STATEMENT: Meet the state and federal accountability objectives for all students and subgroups in mathematics each year.
FIVE YEAR PERFORMANCE GOAL: Increase the percentage of students meeting standard in mathematics as measured by the Palmetto Assessment
of State Standards (PASS) from 80.6% in 2012 to 85.6% in 2018.
ANNUAL OBJECTIVE: Increase by 1.0 percentage point(s) annually students meeting standard in mathematics as measured by the Palmetto
Assessment of State Standards (PASS).
DATA SOURCE(S): SDE School Report Card
Baseline 2011-12
Planning Year
2012-13 2013-14 2014-15 2015-16 2016-17 2017-18
School Projected X X 81.6 82.6 83.6 84.6 85.6
School Actual
80.6 83.5
District Projected X X 78.4 79.4 80.4 81.4 82.4
District Actual
77.4 77.3
*Information in the above tables is subject to change. Projected performance and actual performance are dependent upon which state
standardized assessment is administered as South Carolina begins full implementation of common core standards in 2013-2014.*

35
PASS AVG. MATH
Student Achievement Teacher/Administrator Quality School Climate Other Priority
FIVE YEAR PERFORMANCE GOAL: By grade band (middle), meet the required annual measurable objectives (AMOs) in mathematics as measured
by the Palmetto Assessment of State Standards (PASS).
ANNUAL OBJECTIVE: Meet the required annual measurable objectives (AMOs) in mathematics as measured by the Palmetto Assessment of State
Standards (PASS).
DATA SOURCE(S): ESEA Federal Accountability and SDE School Report Card
Math – GMA Baseline 2011-12
Planning Year
2012-13 2013-14 2014-15 2015-16 2016-17 2017-18
Projected Performance 624 628 632 636 640 644 648
Actual Performance
All Students 664.4 664.0
Male 664 666.3
Female 664.8 661.7
White 681.2 678.6
African-American 636.2 639.7
Asian/Pacific Islander N/A N/A
Hispanic 626.2 636.8
American Indian/Alaskan N/A N/A
Disabled 579.1 598.8
Limited English Proficient 614.8 643.0
Subsidized Meals 620.9 641.0
36
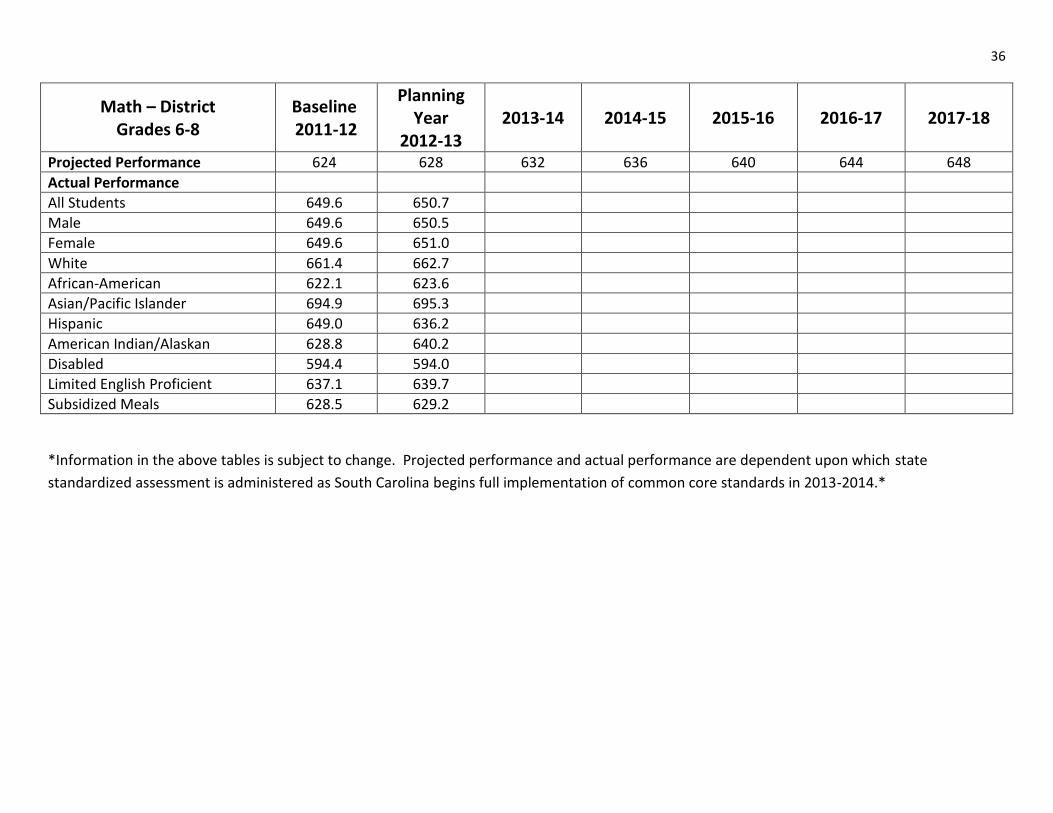
Math – District Grades 6-8
Baseline 2011-12
Planning Year
2012-13 2013-14 2014-15 2015-16 2016-17 2017-18
Projected Performance 624 628 632 636 640 644 648
Actual Performance
All Students 649.6 650.7
Male 649.6 650.5
Female 649.6 651.0
White 661.4 662.7
African-American 622.1 623.6
Asian/Pacific Islander 694.9 695.3
Hispanic 649.0 636.2
American Indian/Alaskan 628.8 640.2
Disabled 594.4 594.0
Limited English Proficient 637.1 639.7
Subsidized Meals 628.5 629.2
*Information in the above tables is subject to change. Projected performance and actual performance are dependent upon which state
standardized assessment is administered as South Carolina begins full implementation of common core standards in 2013-2014.*
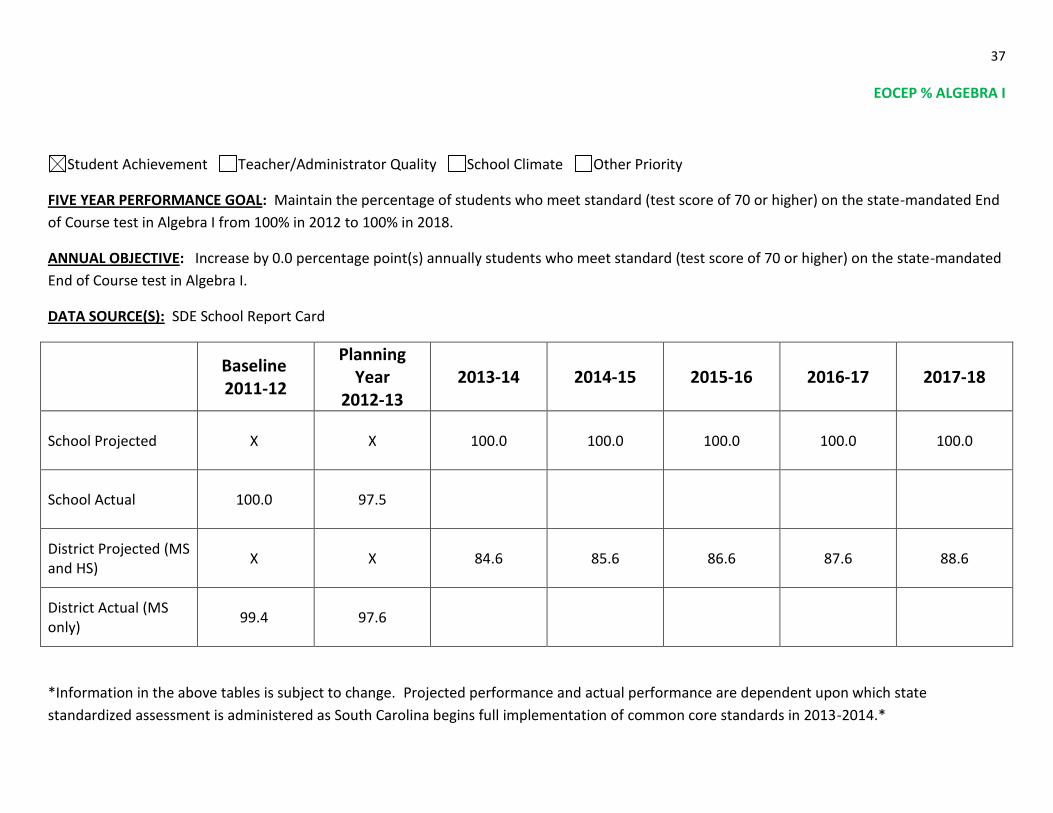
37
EOCEP % ALGEBRA I
Student Achievement Teacher/Administrator Quality School Climate Other Priority
FIVE YEAR PERFORMANCE GOAL: Maintain the percentage of students who meet standard (test score of 70 or higher) on the state-mandated End
of Course test in Algebra I from 100% in 2012 to 100% in 2018.
ANNUAL OBJECTIVE: Increase by 0.0 percentage point(s) annually students who meet standard (test score of 70 or higher) on the state-mandated
End of Course test in Algebra I.
DATA SOURCE(S): SDE School Report Card
Baseline 2011-12
Planning Year
2012-13 2013-14 2014-15 2015-16 2016-17 2017-18
School Projected X X 100.0 100.0 100.0 100.0 100.0
School Actual 100.0 97.5
District Projected (MS and HS)
X X 84.6 85.6 86.6 87.6 88.6
District Actual (MS only)
99.4 97.6
*Information in the above tables is subject to change. Projected performance and actual performance are dependent upon which state
standardized assessment is administered as South Carolina begins full implementation of common core standards in 2013-2014.*
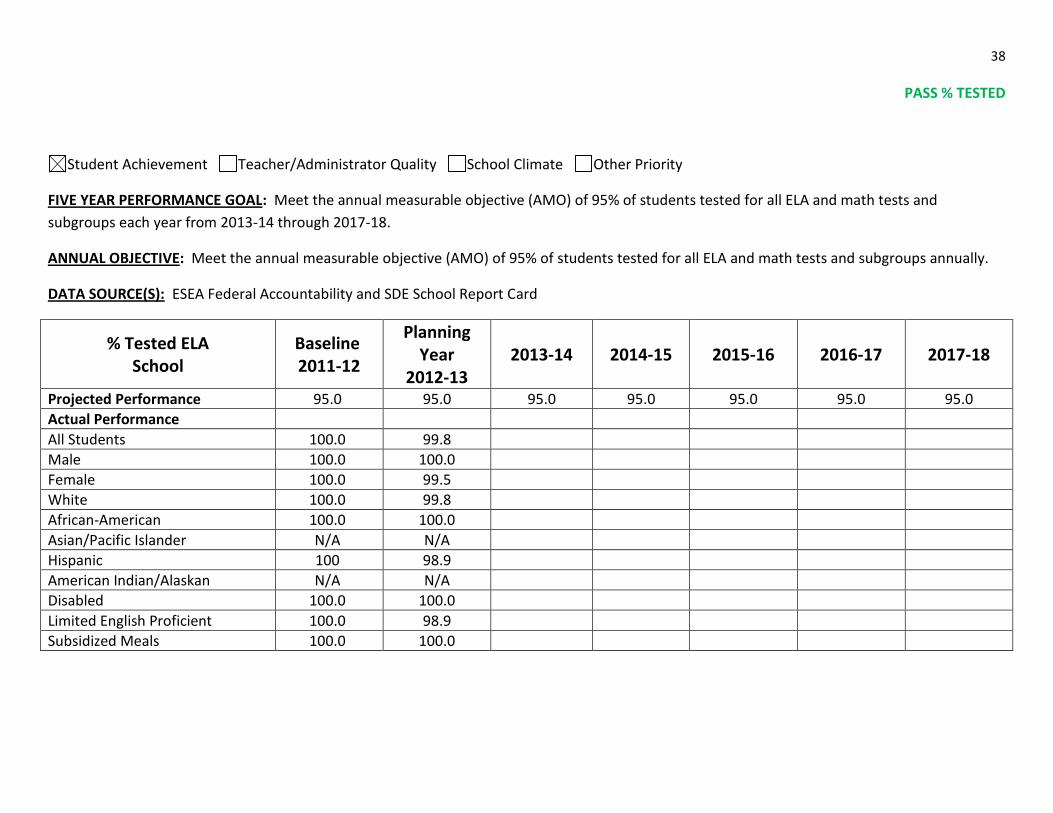
38
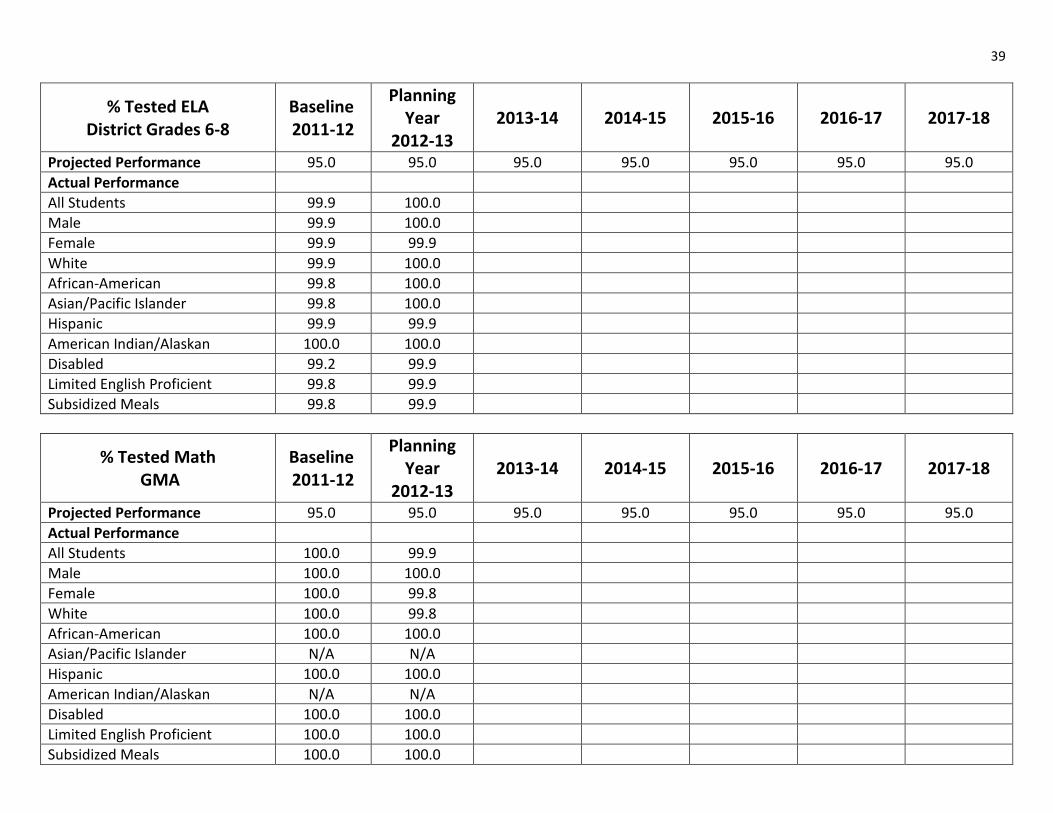
PASS % TESTED
Student Achievement Teacher/Administrator Quality School Climate Other Priority
FIVE YEAR PERFORMANCE GOAL: Meet the annual measurable objective (AMO) of 95% of students tested for all ELA and math tests and
subgroups each year from 2013-14 through 2017-18.
ANNUAL OBJECTIVE: Meet the annual measurable objective (AMO) of 95% of students tested for all ELA and math tests and subgroups annually.
DATA SOURCE(S): ESEA Federal Accountability and SDE School Report Card
% Tested ELA School
Baseline 2011-12
Planning Year
2012-13 2013-14 2014-15 2015-16 2016-17 2017-18
Projected Performance 95.0 95.0 95.0 95.0 95.0 95.0 95.0
Actual Performance
All Students 100.0 99.8
Male 100.0 100.0
Female 100.0 99.5
White 100.0 99.8
African-American 100.0 100.0
Asian/Pacific Islander N/A N/A
Hispanic 100 98.9
American Indian/Alaskan N/A N/A
Disabled 100.0 100.0
Limited English Proficient 100.0 98.9
Subsidized Meals 100.0 100.0
39
% Tested ELA District Grades 6-8
Baseline 2011-12
Planning Year
2012-13 2013-14 2014-15 2015-16 2016-17 2017-18
Projected Performance 95.0 95.0 95.0 95.0 95.0 95.0 95.0
Actual Performance
All Students 99.9 100.0
Male 99.9 100.0
Female 99.9 99.9
White 99.9 100.0
African-American 99.8 100.0
Asian/Pacific Islander 99.8 100.0
Hispanic 99.9 99.9
American Indian/Alaskan 100.0 100.0
Disabled 99.2 99.9
Limited English Proficient 99.8 99.9
Subsidized Meals 99.8 99.9
% Tested Math GMA
Baseline 2011-12
Planning Year
2012-13 2013-14 2014-15 2015-16 2016-17 2017-18
Projected Performance 95.0 95.0 95.0 95.0 95.0 95.0 95.0
Actual Performance
All Students 100.0 99.9
Male 100.0 100.0
Female 100.0 99.8
White 100.0 99.8
African-American 100.0 100.0
Asian/Pacific Islander N/A N/A
Hispanic 100.0 100.0
American Indian/Alaskan N/A N/A
Disabled 100.0 100.0
Limited English Proficient 100.0 100.0
Subsidized Meals 100.0 100.0
40
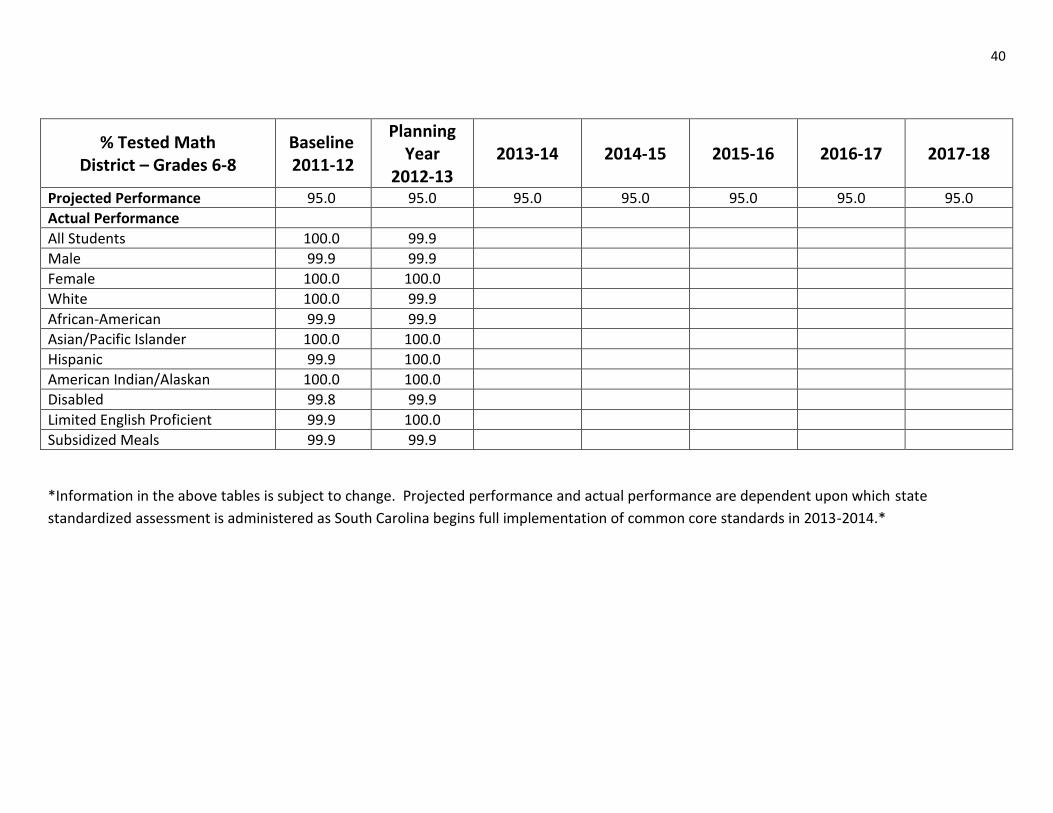
% Tested Math District – Grades 6-8
Baseline 2011-12
Planning Year
2012-13 2013-14 2014-15 2015-16 2016-17 2017-18
Projected Performance 95.0 95.0 95.0 95.0 95.0 95.0 95.0
Actual Performance
All Students 100.0 99.9
Male 99.9 99.9
Female 100.0 100.0
White 100.0 99.9
African-American 99.9 99.9
Asian/Pacific Islander 100.0 100.0
Hispanic 99.9 100.0
American Indian/Alaskan 100.0 100.0
Disabled 99.8 99.9
Limited English Proficient 99.9 100.0
Subsidized Meals 99.9 99.9
*Information in the above tables is subject to change. Projected performance and actual performance are dependent upon which state
standardized assessment is administered as South Carolina begins full implementation of common core standards in 2013-2014.*

41
PASS % SCIENCE
Student Achievement Teacher/Administrator Quality School Climate Other Priority
PERFORMANCE STATEMENT: Meet the state and federal accountability objectives for all students and subgroups in science each year.
FIVE YEAR PERFORMANCE GOAL: Increase the percentage of students meeting standard in science as measured by the Palmetto Assessment of
State Standards (PASS) from 81.8% in 2012 to 84.3% in 2018.
ANNUAL OBJECTIVE: Increase by 0.5 percentage point(s) annually students meeting standard in science as measured by the Palmetto Assessment
of State Standards (PASS).
DATA SOURCE(S): SDE School Report Card
Baseline 2011-12
Planning Year
2012-13 2013-14 2014-15 2015-16 2016-17 2017-18
School Projected X X 82.3 82.8 83.3 83.8 84.3
School Actual
81.8 82.8
District Projected X X 76.9 77.9 78.9 79.9 80.9
District Actual
75.9 77.0
*Information in the above tables is subject to change. Projected performance and actual performance are dependent upon which state
standardized assessment is administered as South Carolina begins full implementation of common core standards in 2013-2014.*
42
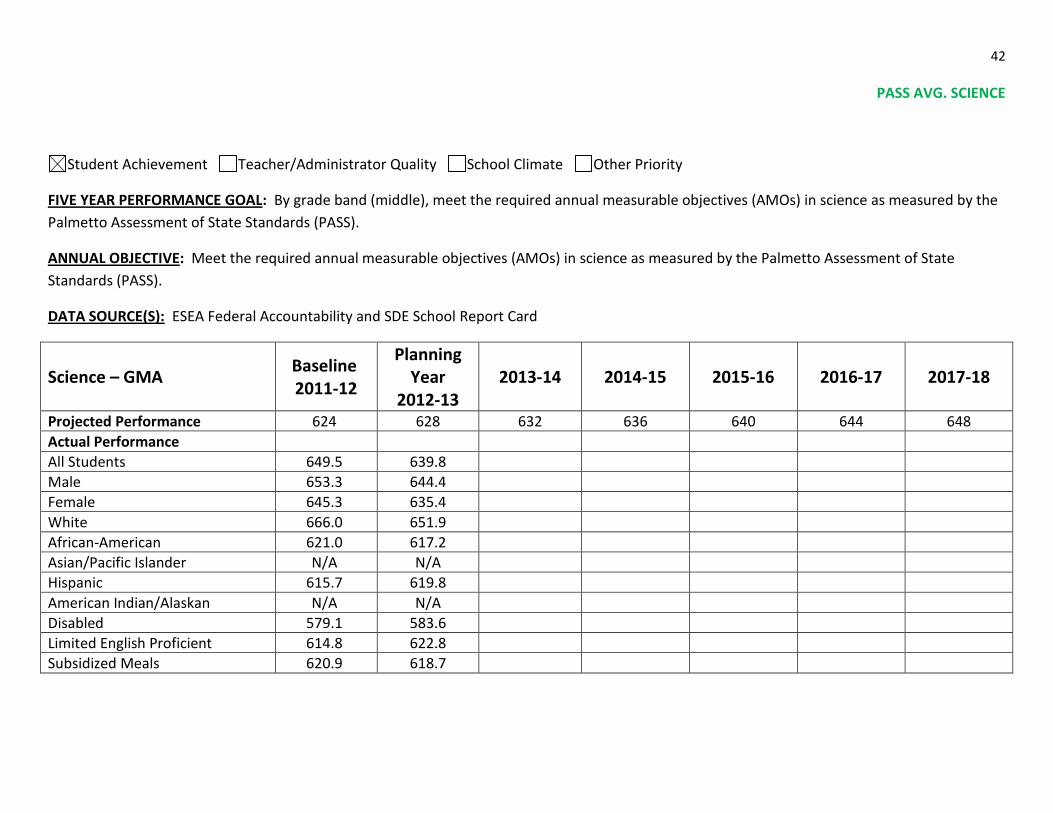
PASS AVG. SCIENCE
Student Achievement Teacher/Administrator Quality School Climate Other Priority
FIVE YEAR PERFORMANCE GOAL: By grade band (middle), meet the required annual measurable objectives (AMOs) in science as measured by the
Palmetto Assessment of State Standards (PASS).
ANNUAL OBJECTIVE: Meet the required annual measurable objectives (AMOs) in science as measured by the Palmetto Assessment of State
Standards (PASS).
DATA SOURCE(S): ESEA Federal Accountability and SDE School Report Card
Science – GMA Baseline 2011-12
Planning Year
2012-13 2013-14 2014-15 2015-16 2016-17 2017-18
Projected Performance 624 628 632 636 640 644 648
Actual Performance
All Students 649.5 639.8
Male 653.3 644.4
Female 645.3 635.4
White 666.0 651.9
African-American 621.0 617.2
Asian/Pacific Islander N/A N/A
Hispanic 615.7 619.8
American Indian/Alaskan N/A N/A
Disabled 579.1 583.6
Limited English Proficient 614.8 622.8
Subsidized Meals 620.9 618.7
43
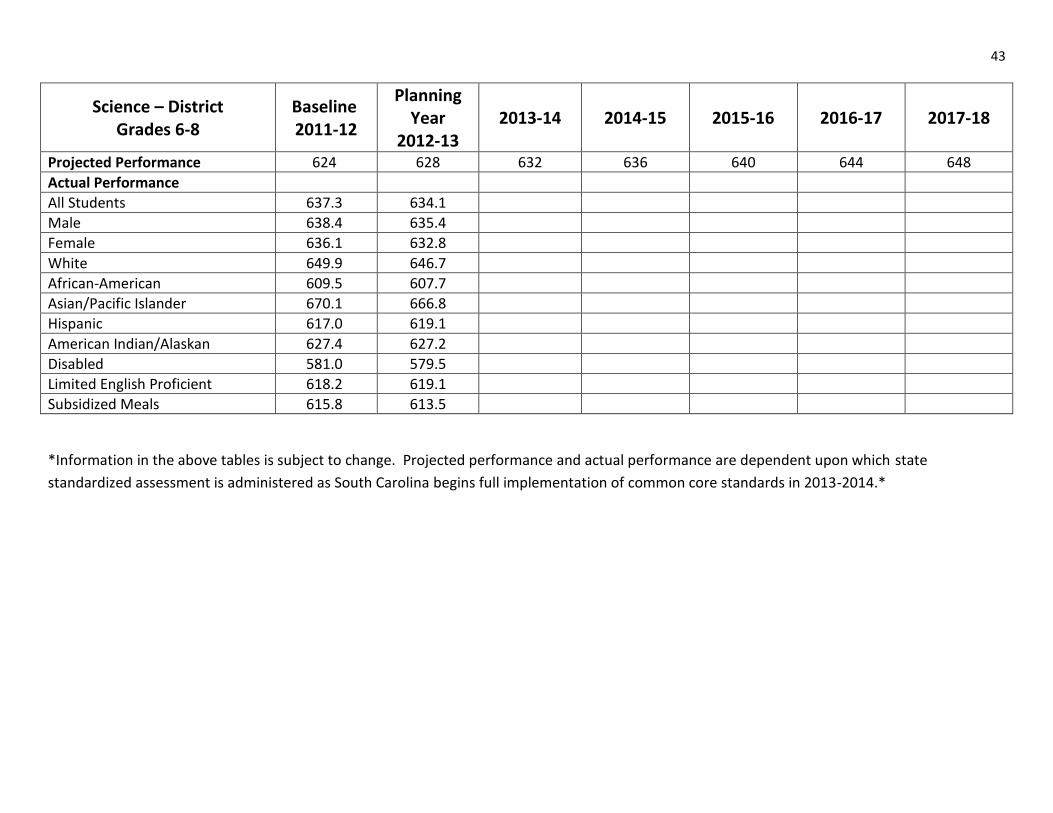
Science – District Grades 6-8
Baseline 2011-12
Planning Year
2012-13 2013-14 2014-15 2015-16 2016-17 2017-18
Projected Performance 624 628 632 636 640 644 648
Actual Performance
All Students 637.3 634.1
Male 638.4 635.4
Female 636.1 632.8
White 649.9 646.7
African-American 609.5 607.7
Asian/Pacific Islander 670.1 666.8
Hispanic 617.0 619.1
American Indian/Alaskan 627.4 627.2
Disabled 581.0 579.5
Limited English Proficient 618.2 619.1
Subsidized Meals 615.8 613.5
*Information in the above tables is subject to change. Projected performance and actual performance are dependent upon which state
standardized assessment is administered as South Carolina begins full implementation of common core standards in 2013-2014.*
44
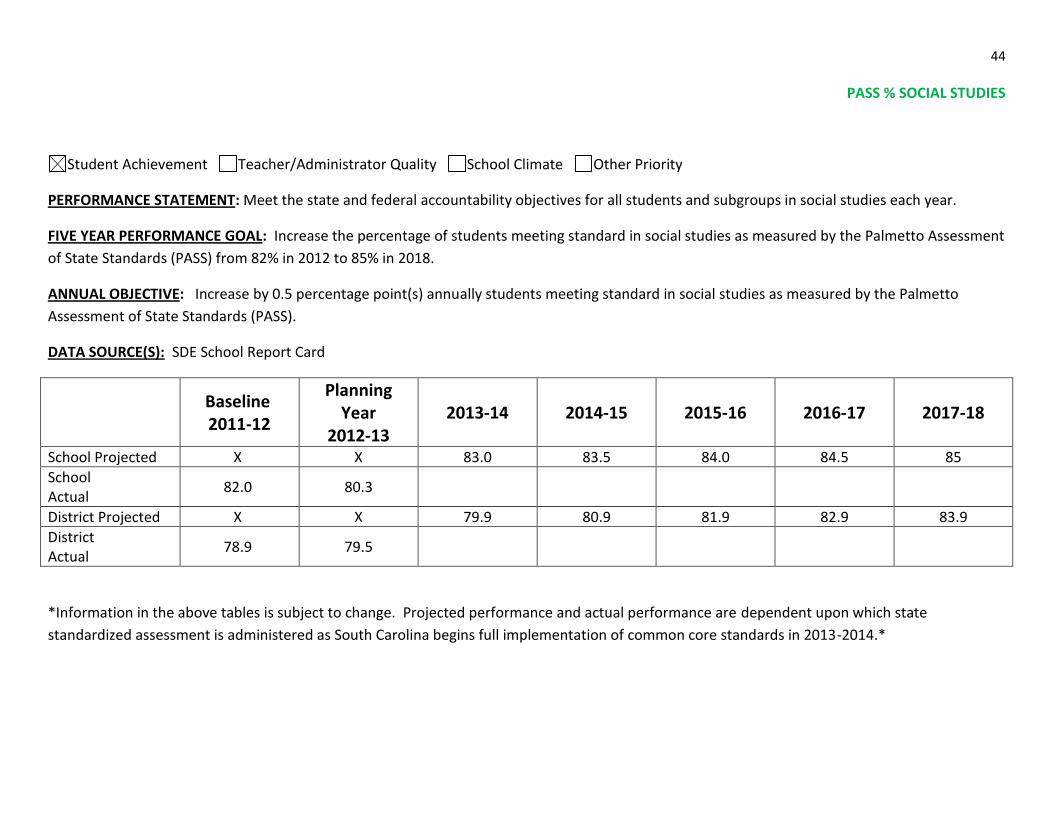
PASS % SOCIAL STUDIES
Student Achievement Teacher/Administrator Quality School Climate Other Priority
PERFORMANCE STATEMENT: Meet the state and federal accountability objectives for all students and subgroups in social studies each year.
FIVE YEAR PERFORMANCE GOAL: Increase the percentage of students meeting standard in social studies as measured by the Palmetto Assessment
of State Standards (PASS) from 82% in 2012 to 85% in 2018.
ANNUAL OBJECTIVE: Increase by 0.5 percentage point(s) annually students meeting standard in social studies as measured by the Palmetto
Assessment of State Standards (PASS).
DATA SOURCE(S): SDE School Report Card
Baseline 2011-12
Planning Year
2012-13 2013-14 2014-15 2015-16 2016-17 2017-18
School Projected X X 83.0 83.5 84.0 84.5 85
School Actual
82.0 80.3
District Projected X X 79.9 80.9 81.9 82.9 83.9
District Actual
78.9 79.5
*Information in the above tables is subject to change. Projected performance and actual performance are dependent upon which state
standardized assessment is administered as South Carolina begins full implementation of common core standards in 2013-2014.*
45
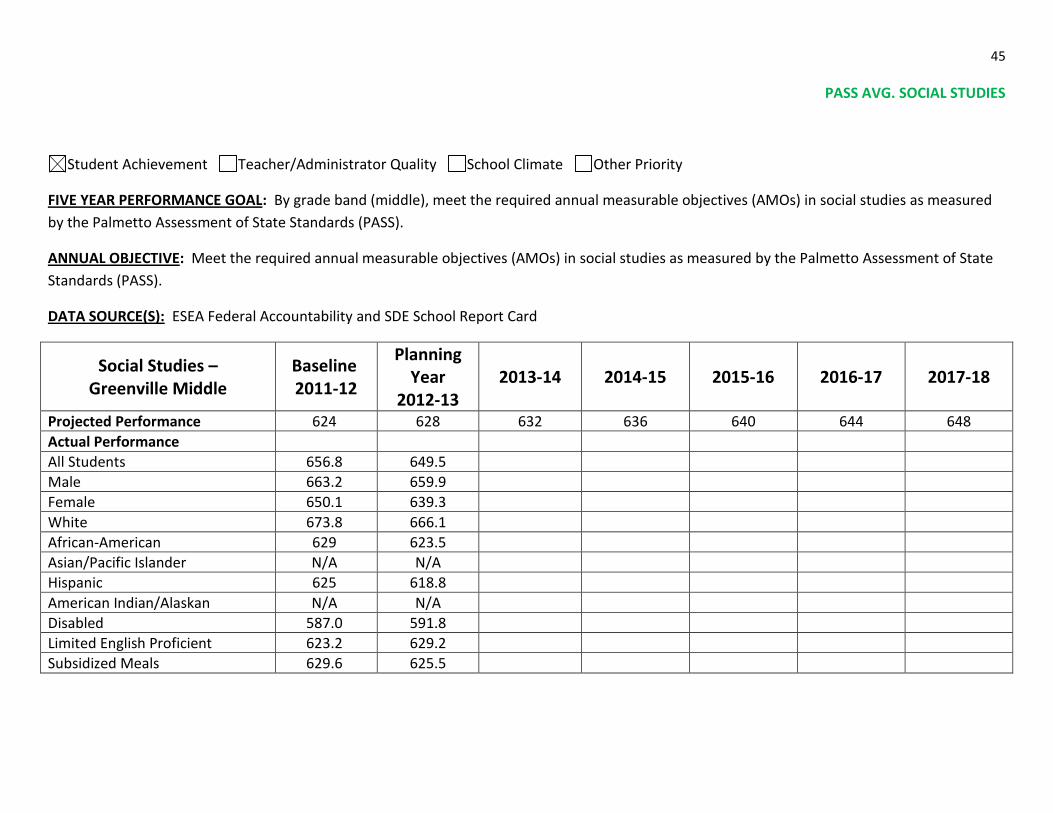
PASS AVG. SOCIAL STUDIES
Student Achievement Teacher/Administrator Quality School Climate Other Priority
FIVE YEAR PERFORMANCE GOAL: By grade band (middle), meet the required annual measurable objectives (AMOs) in social studies as measured
by the Palmetto Assessment of State Standards (PASS).
ANNUAL OBJECTIVE: Meet the required annual measurable objectives (AMOs) in social studies as measured by the Palmetto Assessment of State
Standards (PASS).
DATA SOURCE(S): ESEA Federal Accountability and SDE School Report Card
Social Studies – Greenville Middle
Baseline 2011-12
Planning Year
2012-13 2013-14 2014-15 2015-16 2016-17 2017-18
Projected Performance 624 628 632 636 640 644 648
Actual Performance
All Students 656.8 649.5
Male 663.2 659.9
Female 650.1 639.3
White 673.8 666.1
African-American 629 623.5
Asian/Pacific Islander N/A N/A
Hispanic 625 618.8
American Indian/Alaskan N/A N/A
Disabled 587.0 591.8
Limited English Proficient 623.2 629.2
Subsidized Meals 629.6 625.5
46
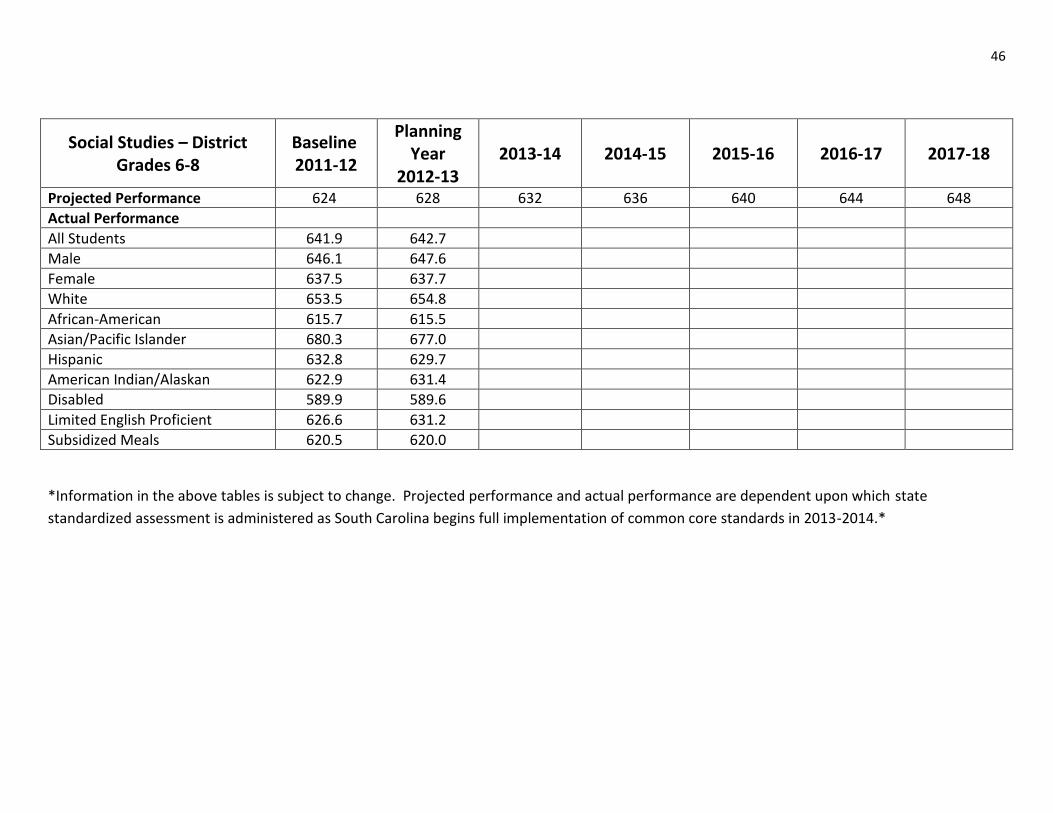
Social Studies – District Grades 6-8
Baseline 2011-12
Planning Year
2012-13 2013-14 2014-15 2015-16 2016-17 2017-18
Projected Performance 624 628 632 636 640 644 648
Actual Performance
All Students 641.9 642.7
Male 646.1 647.6
Female 637.5 637.7
White 653.5 654.8
African-American 615.7 615.5
Asian/Pacific Islander 680.3 677.0
Hispanic 632.8 629.7
American Indian/Alaskan 622.9 631.4
Disabled 589.9 589.6
Limited English Proficient 626.6 631.2
Subsidized Meals 620.5 620.0
*Information in the above tables is subject to change. Projected performance and actual performance are dependent upon which state
standardized assessment is administered as South Carolina begins full implementation of common core standards in 2013-2014.*
47
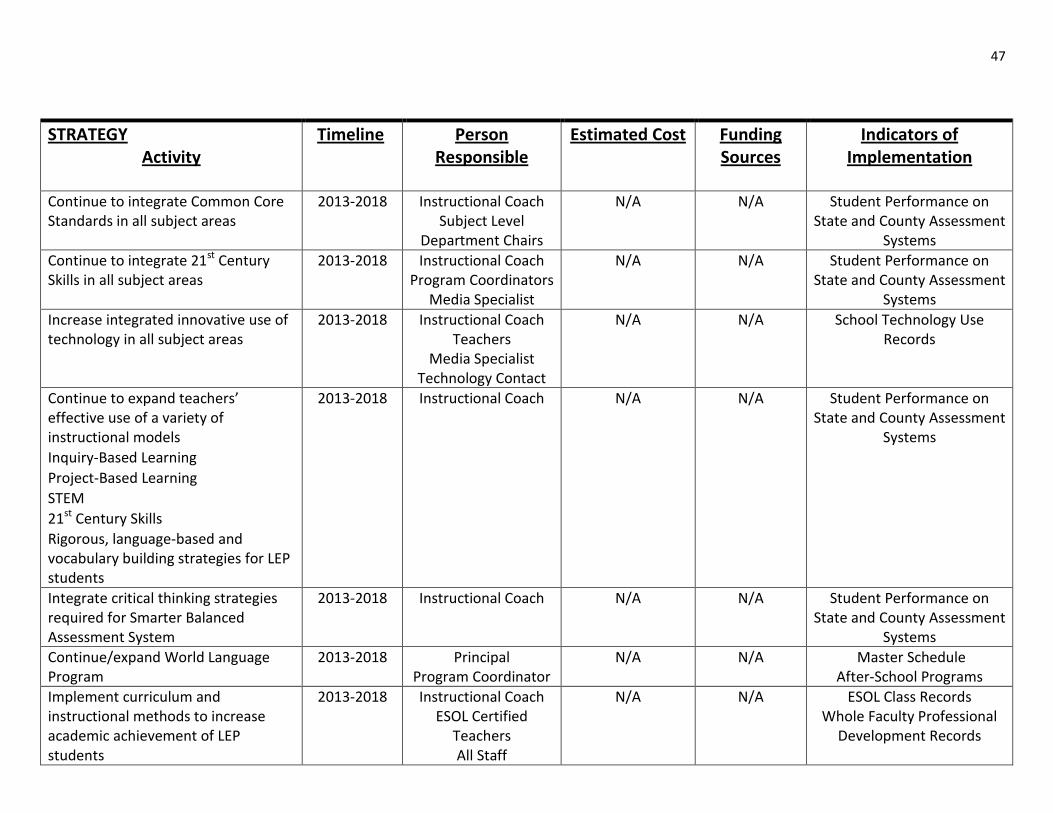
STRATEGY Activity
Timeline Person Responsible
Estimated Cost Funding Sources
Indicators of Implementation
Continue to integrate Common Core Standards in all subject areas
2013-2018 Instructional Coach Subject Level
Department Chairs
N/A N/A Student Performance on State and County Assessment
Systems
Continue to integrate 21st Century Skills in all subject areas
2013-2018 Instructional Coach Program Coordinators
Media Specialist
N/A N/A Student Performance on State and County Assessment
Systems
Increase integrated innovative use of technology in all subject areas
2013-2018 Instructional Coach Teachers
Media Specialist Technology Contact
N/A N/A School Technology Use Records
Continue to expand teachers’ effective use of a variety of instructional models
Inquiry-Based Learning
Project-Based Learning
STEM
21st Century Skills
Rigorous, language-based and vocabulary building strategies for LEP students
2013-2018 Instructional Coach
N/A N/A Student Performance on State and County Assessment
Systems
Integrate critical thinking strategies required for Smarter Balanced Assessment System
2013-2018 Instructional Coach N/A N/A Student Performance on State and County Assessment
Systems
Continue/expand World Language Program
2013-2018 Principal Program Coordinator
N/A N/A Master Schedule After-School Programs
Implement curriculum and instructional methods to increase academic achievement of LEP students
2013-2018 Instructional Coach ESOL Certified
Teachers All Staff
N/A N/A ESOL Class Records Whole Faculty Professional
Development Records
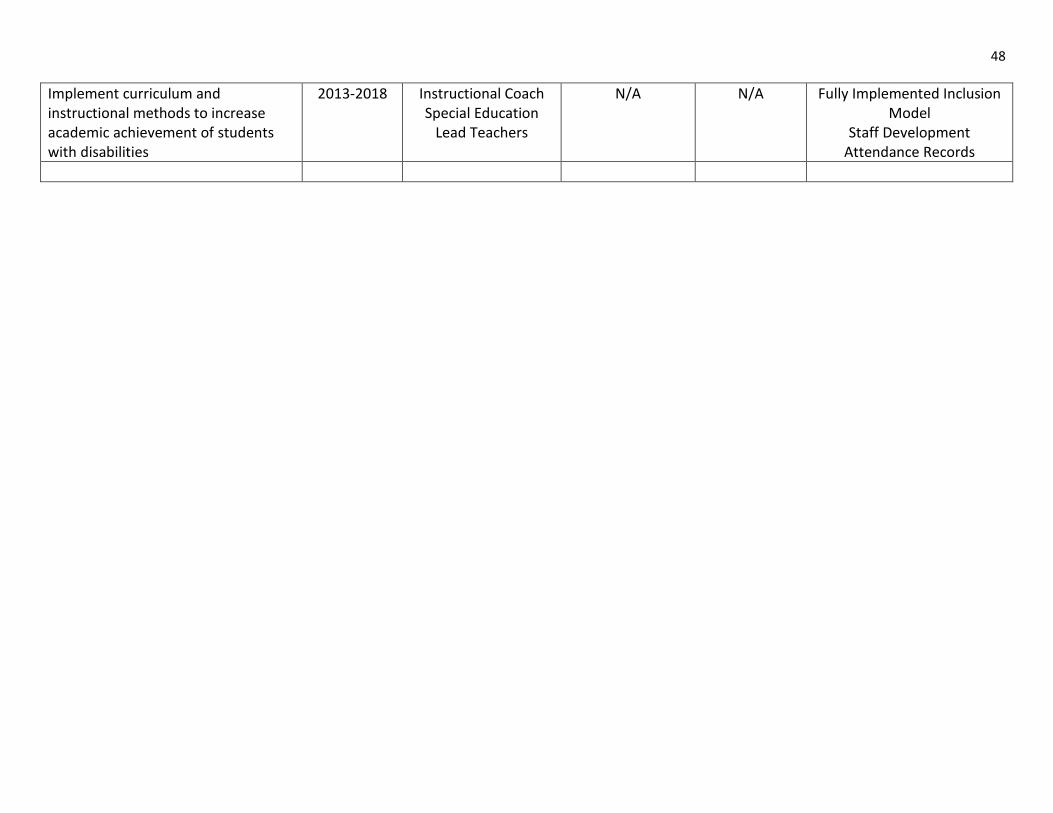
48
Implement curriculum and instructional methods to increase academic achievement of students with disabilities
2013-2018 Instructional Coach Special Education
Lead Teachers
N/A N/A Fully Implemented Inclusion Model
Staff Development Attendance Records
49
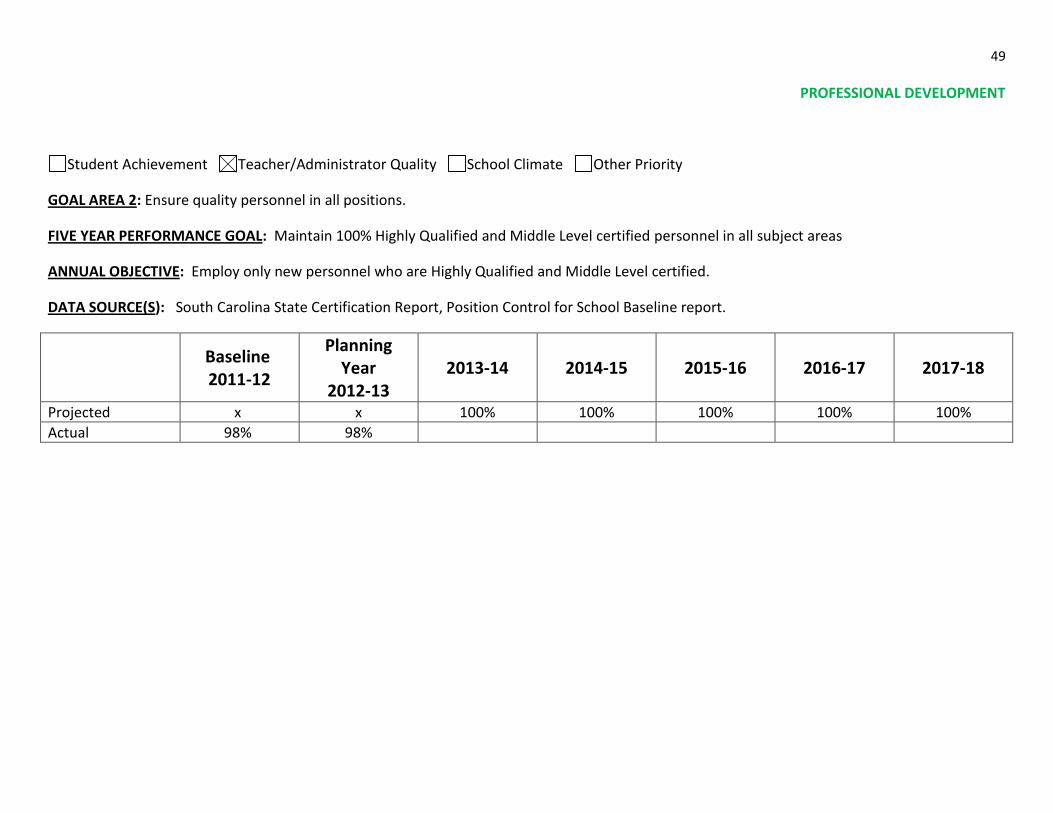
PROFESSIONAL DEVELOPMENT
Student Achievement Teacher/Administrator Quality School Climate Other Priority
GOAL AREA 2: Ensure quality personnel in all positions.
FIVE YEAR PERFORMANCE GOAL: Maintain 100% Highly Qualified and Middle Level certified personnel in all subject areas
ANNUAL OBJECTIVE: Employ only new personnel who are Highly Qualified and Middle Level certified.
DATA SOURCE(S): South Carolina State Certification Report, Position Control for School Baseline report.
Baseline 2011-12
Planning Year
2012-13 2013-14 2014-15 2015-16 2016-17 2017-18
Projected x x 100% 100% 100% 100% 100%
Actual 98% 98%
50
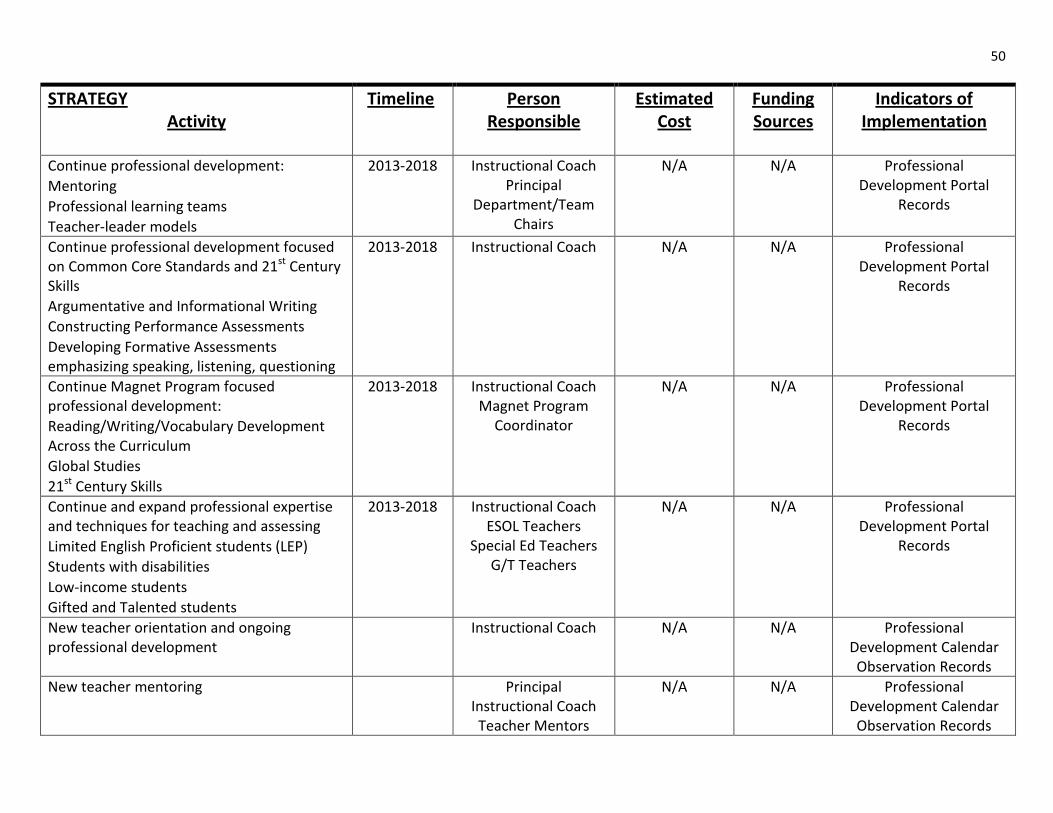
STRATEGY Activity
Timeline Person Responsible
Estimated Cost
Funding Sources
Indicators of Implementation
Continue professional development:
Mentoring
Professional learning teams
Teacher-leader models
2013-2018 Instructional Coach Principal
Department/Team Chairs
N/A N/A Professional Development Portal
Records
Continue professional development focused on Common Core Standards and 21st Century Skills
Argumentative and Informational Writing
Constructing Performance Assessments
Developing Formative Assessments emphasizing speaking, listening, questioning
2013-2018 Instructional Coach N/A N/A Professional Development Portal
Records
Continue Magnet Program focused professional development:
Reading/Writing/Vocabulary Development Across the Curriculum
Global Studies
21st Century Skills
2013-2018 Instructional Coach Magnet Program
Coordinator
N/A N/A Professional Development Portal
Records
Continue and expand professional expertise and techniques for teaching and assessing
Limited English Proficient students (LEP)
Students with disabilities
Low-income students
Gifted and Talented students
2013-2018 Instructional Coach ESOL Teachers
Special Ed Teachers G/T Teachers
N/A N/A Professional Development Portal
Records
New teacher orientation and ongoing professional development
Instructional Coach N/A N/A Professional Development Calendar Observation Records
New teacher mentoring Principal Instructional Coach Teacher Mentors
N/A N/A Professional Development Calendar Observation Records
51
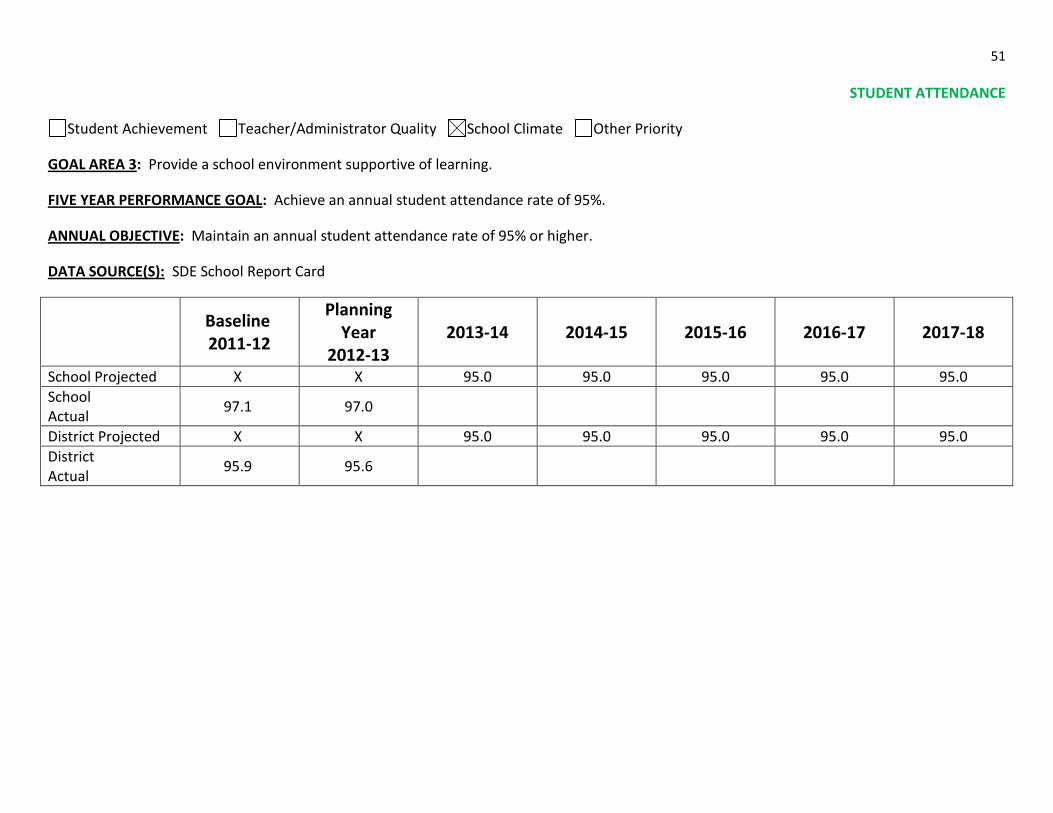
STUDENT ATTENDANCE
Student Achievement Teacher/Administrator Quality School Climate Other Priority
GOAL AREA 3: Provide a school environment supportive of learning.
FIVE YEAR PERFORMANCE GOAL: Achieve an annual student attendance rate of 95%.
ANNUAL OBJECTIVE: Maintain an annual student attendance rate of 95% or higher.
DATA SOURCE(S): SDE School Report Card
Baseline 2011-12
Planning Year
2012-13 2013-14 2014-15 2015-16 2016-17 2017-18
School Projected X X 95.0 95.0 95.0 95.0 95.0
School Actual
97.1 97.0
District Projected X X 95.0 95.0 95.0 95.0 95.0
District Actual
95.9 95.6
52
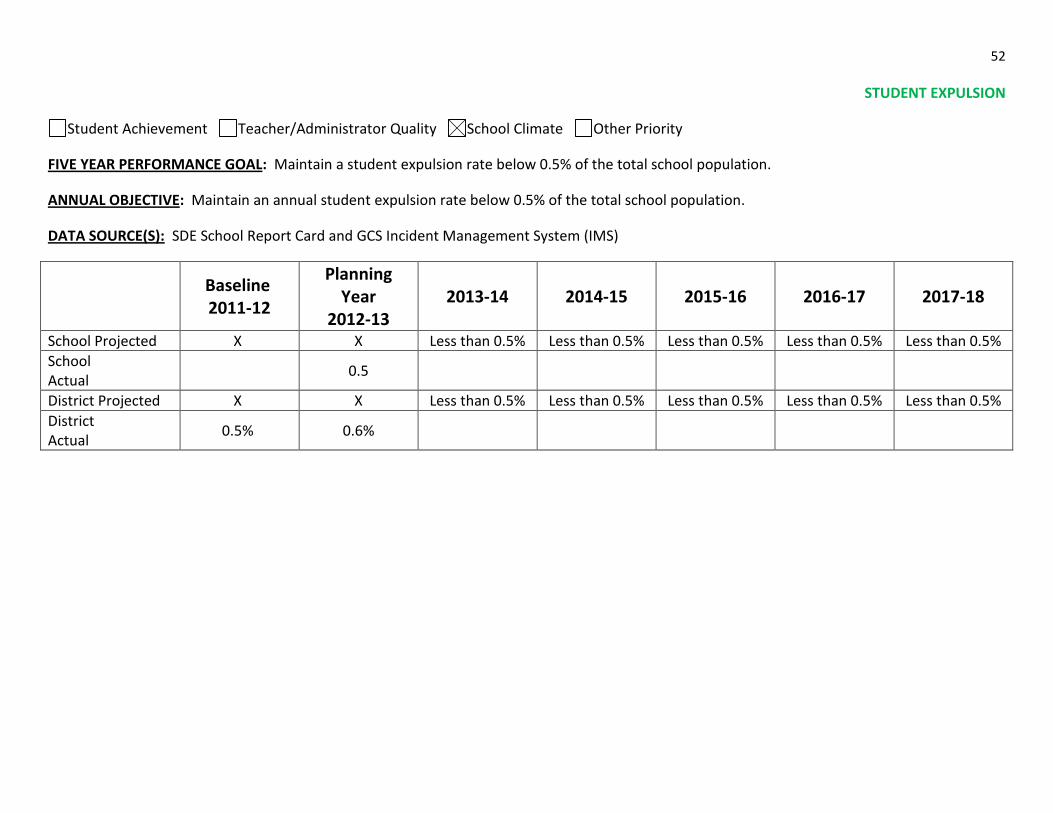
STUDENT EXPULSION
Student Achievement Teacher/Administrator Quality School Climate Other Priority
FIVE YEAR PERFORMANCE GOAL: Maintain a student expulsion rate below 0.5% of the total school population.
ANNUAL OBJECTIVE: Maintain an annual student expulsion rate below 0.5% of the total school population.
DATA SOURCE(S): SDE School Report Card and GCS Incident Management System (IMS)
Baseline 2011-12
Planning Year
2012-13 2013-14 2014-15 2015-16 2016-17 2017-18
School Projected X X Less than 0.5% Less than 0.5% Less than 0.5% Less than 0.5% Less than 0.5%
School Actual
0.5
District Projected X X Less than 0.5% Less than 0.5% Less than 0.5% Less than 0.5% Less than 0.5%
District Actual
0.5% 0.6%
53
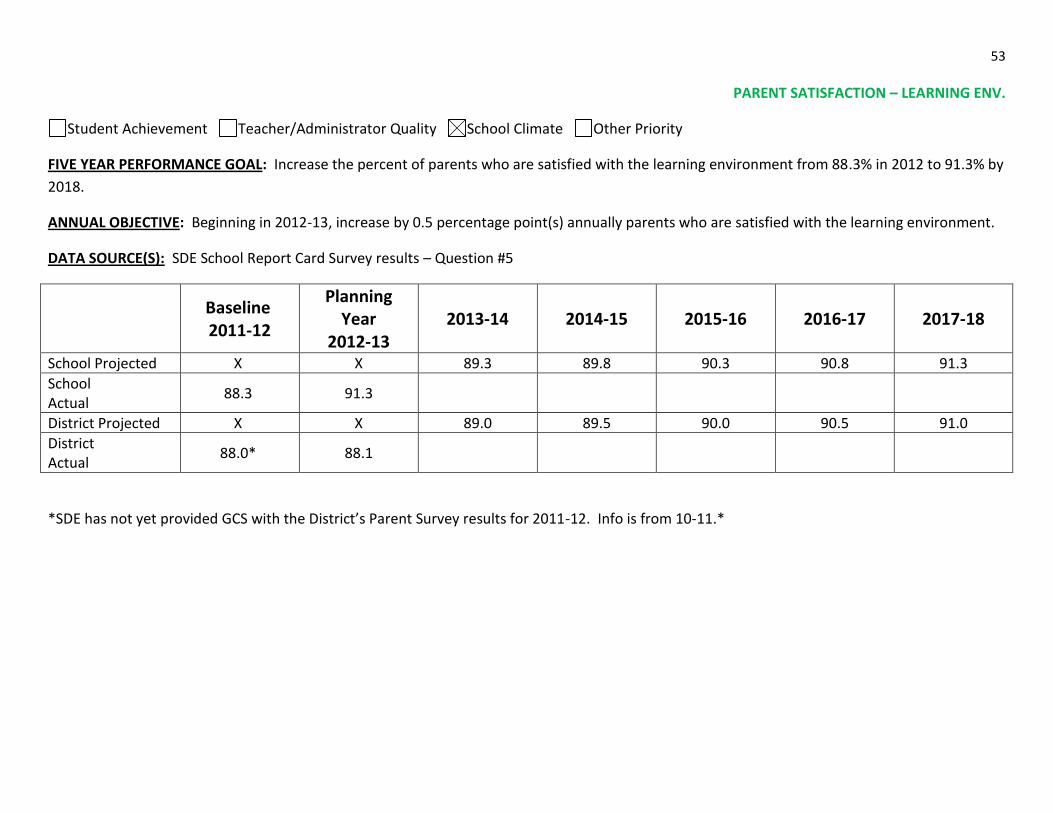
PARENT SATISFACTION – LEARNING ENV.
Student Achievement Teacher/Administrator Quality School Climate Other Priority
FIVE YEAR PERFORMANCE GOAL: Increase the percent of parents who are satisfied with the learning environment from 88.3% in 2012 to 91.3% by
2018.
ANNUAL OBJECTIVE: Beginning in 2012-13, increase by 0.5 percentage point(s) annually parents who are satisfied with the learning environment.
DATA SOURCE(S): SDE School Report Card Survey results – Question #5
Baseline 2011-12
Planning Year
2012-13 2013-14 2014-15 2015-16 2016-17 2017-18
School Projected X X 89.3 89.8 90.3 90.8 91.3
School Actual
88.3 91.3
District Projected X X 89.0 89.5 90.0 90.5 91.0
District Actual
88.0* 88.1
*SDE has not yet provided GCS with the District’s Parent Survey results for 2011-12. Info is from 10-11.*
54
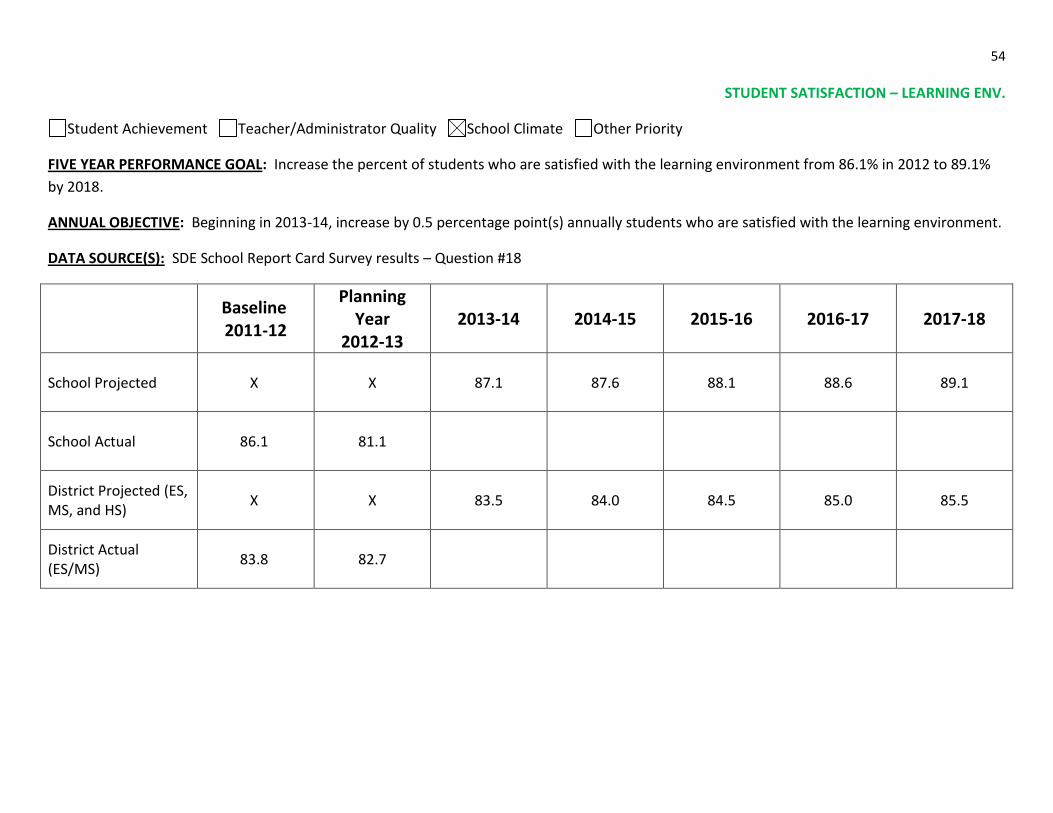
STUDENT SATISFACTION – LEARNING ENV.
Student Achievement Teacher/Administrator Quality School Climate Other Priority
FIVE YEAR PERFORMANCE GOAL: Increase the percent of students who are satisfied with the learning environment from 86.1% in 2012 to 89.1%
by 2018.
ANNUAL OBJECTIVE: Beginning in 2013-14, increase by 0.5 percentage point(s) annually students who are satisfied with the learning environment.
DATA SOURCE(S): SDE School Report Card Survey results – Question #18
Baseline 2011-12
Planning Year
2012-13 2013-14 2014-15 2015-16 2016-17 2017-18
School Projected X X 87.1 87.6 88.1 88.6 89.1
School Actual 86.1 81.1
District Projected (ES, MS, and HS)
X X 83.5 84.0 84.5 85.0 85.5
District Actual (ES/MS)
83.8 82.7
55
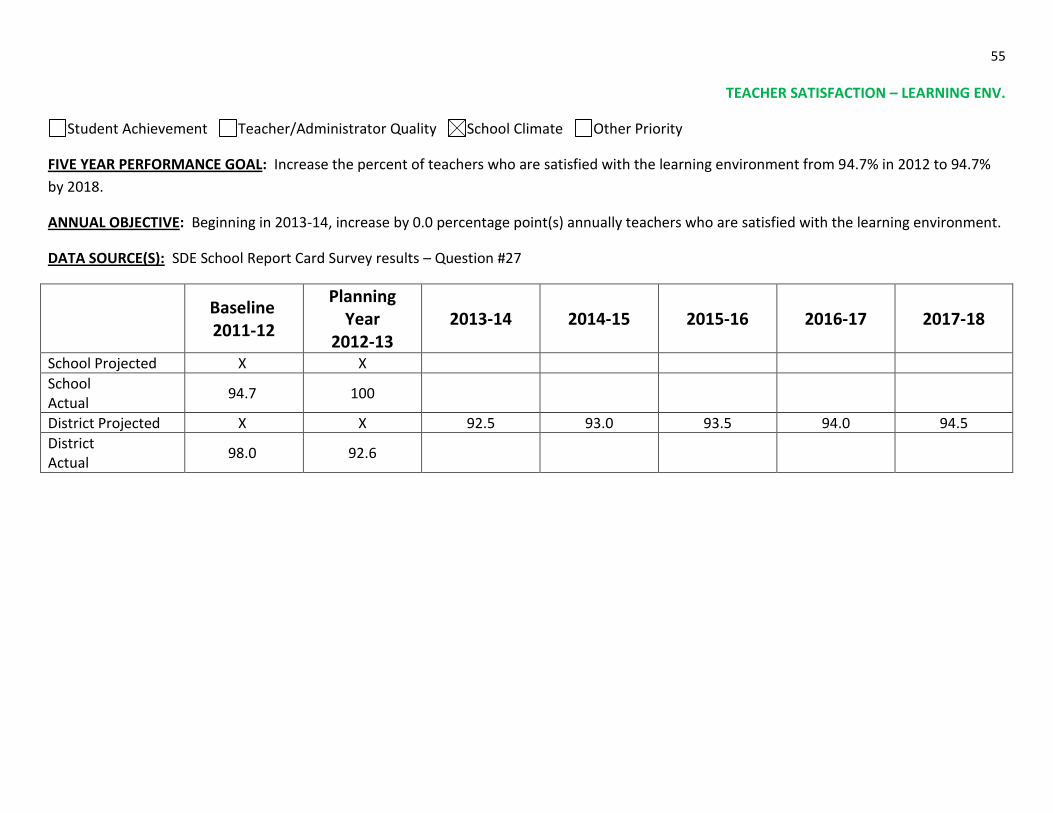
TEACHER SATISFACTION – LEARNING ENV.
Student Achievement Teacher/Administrator Quality School Climate Other Priority
FIVE YEAR PERFORMANCE GOAL: Increase the percent of teachers who are satisfied with the learning environment from 94.7% in 2012 to 94.7%
by 2018.
ANNUAL OBJECTIVE: Beginning in 2013-14, increase by 0.0 percentage point(s) annually teachers who are satisfied with the learning environment.
DATA SOURCE(S): SDE School Report Card Survey results – Question #27
Baseline 2011-12
Planning Year
2012-13 2013-14 2014-15 2015-16 2016-17 2017-18
School Projected X X
School Actual
94.7 100
District Projected X X 92.5 93.0 93.5 94.0 94.5
District Actual
98.0 92.6
56
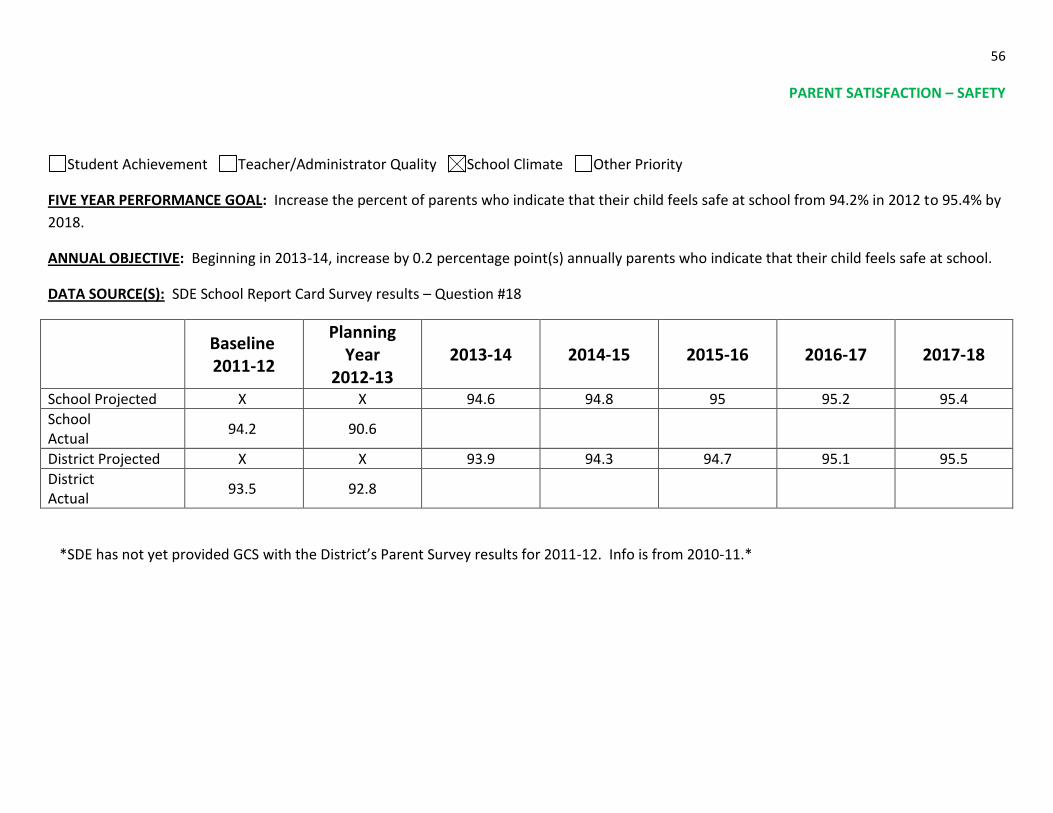
PARENT SATISFACTION – SAFETY
Student Achievement Teacher/Administrator Quality School Climate Other Priority
FIVE YEAR PERFORMANCE GOAL: Increase the percent of parents who indicate that their child feels safe at school from 94.2% in 2012 to 95.4% by
2018.
ANNUAL OBJECTIVE: Beginning in 2013-14, increase by 0.2 percentage point(s) annually parents who indicate that their child feels safe at school.
DATA SOURCE(S): SDE School Report Card Survey results – Question #18
Baseline 2011-12
Planning Year
2012-13 2013-14 2014-15 2015-16 2016-17 2017-18
School Projected X X 94.6 94.8 95 95.2 95.4
School Actual
94.2 90.6
District Projected X X 93.9 94.3 94.7 95.1 95.5
District Actual
93.5 92.8
*SDE has not yet provided GCS with the District’s Parent Survey results for 2011-12. Info is from 2010-11.*
57
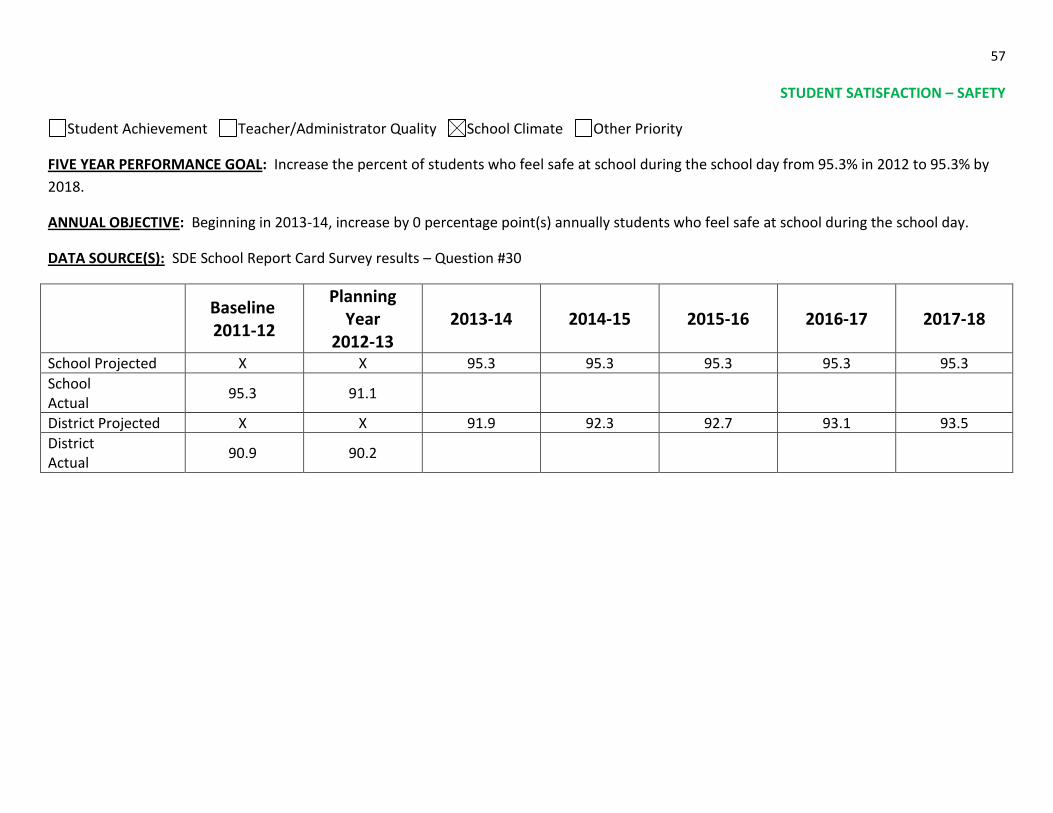
STUDENT SATISFACTION – SAFETY
Student Achievement Teacher/Administrator Quality School Climate Other Priority
FIVE YEAR PERFORMANCE GOAL: Increase the percent of students who feel safe at school during the school day from 95.3% in 2012 to 95.3% by
2018.
ANNUAL OBJECTIVE: Beginning in 2013-14, increase by 0 percentage point(s) annually students who feel safe at school during the school day.
DATA SOURCE(S): SDE School Report Card Survey results – Question #30
Baseline 2011-12
Planning Year
2012-13 2013-14 2014-15 2015-16 2016-17 2017-18
School Projected X X 95.3 95.3 95.3 95.3 95.3
School Actual
95.3 91.1
District Projected X X 91.9 92.3 92.7 93.1 93.5
District Actual
90.9 90.2
58
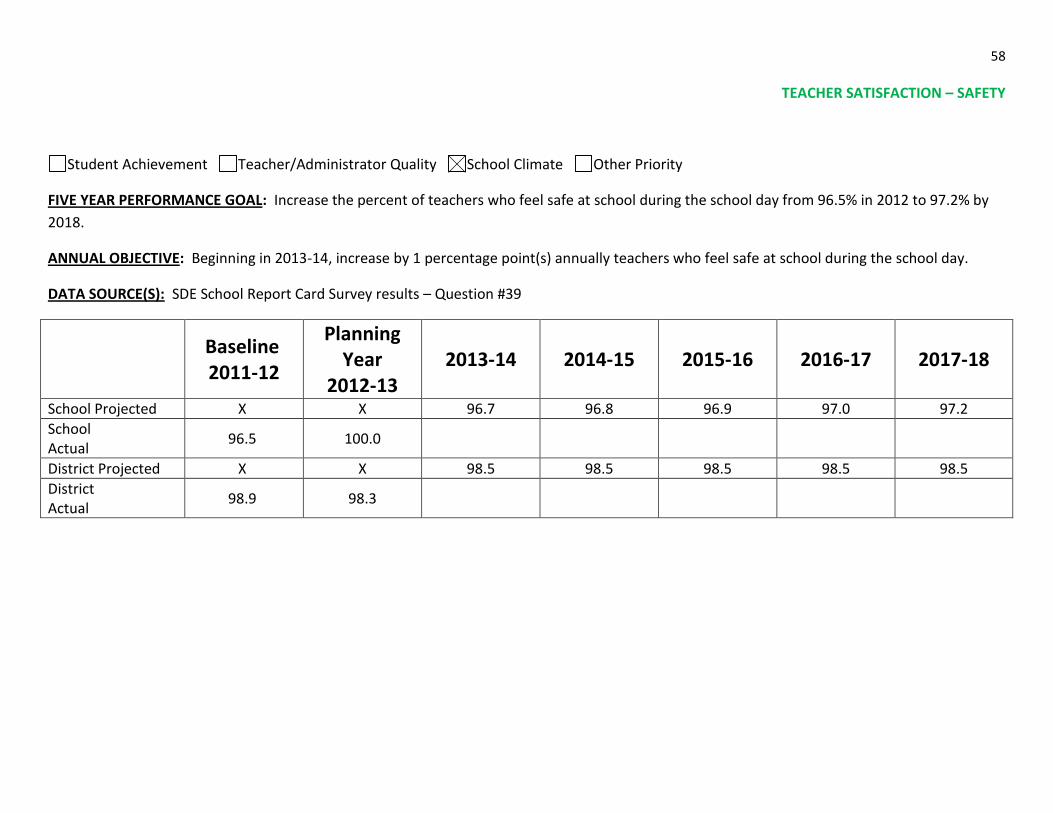
TEACHER SATISFACTION – SAFETY
Student Achievement Teacher/Administrator Quality School Climate Other Priority
FIVE YEAR PERFORMANCE GOAL: Increase the percent of teachers who feel safe at school during the school day from 96.5% in 2012 to 97.2% by
2018.
ANNUAL OBJECTIVE: Beginning in 2013-14, increase by 1 percentage point(s) annually teachers who feel safe at school during the school day.
DATA SOURCE(S): SDE School Report Card Survey results – Question #39
Baseline 2011-12
Planning Year
2012-13 2013-14 2014-15 2015-16 2016-17 2017-18
School Projected X X 96.7 96.8 96.9 97.0 97.2
School Actual
96.5 100.0
District Projected X X 98.5 98.5 98.5 98.5 98.5
District Actual
98.9 98.3
59
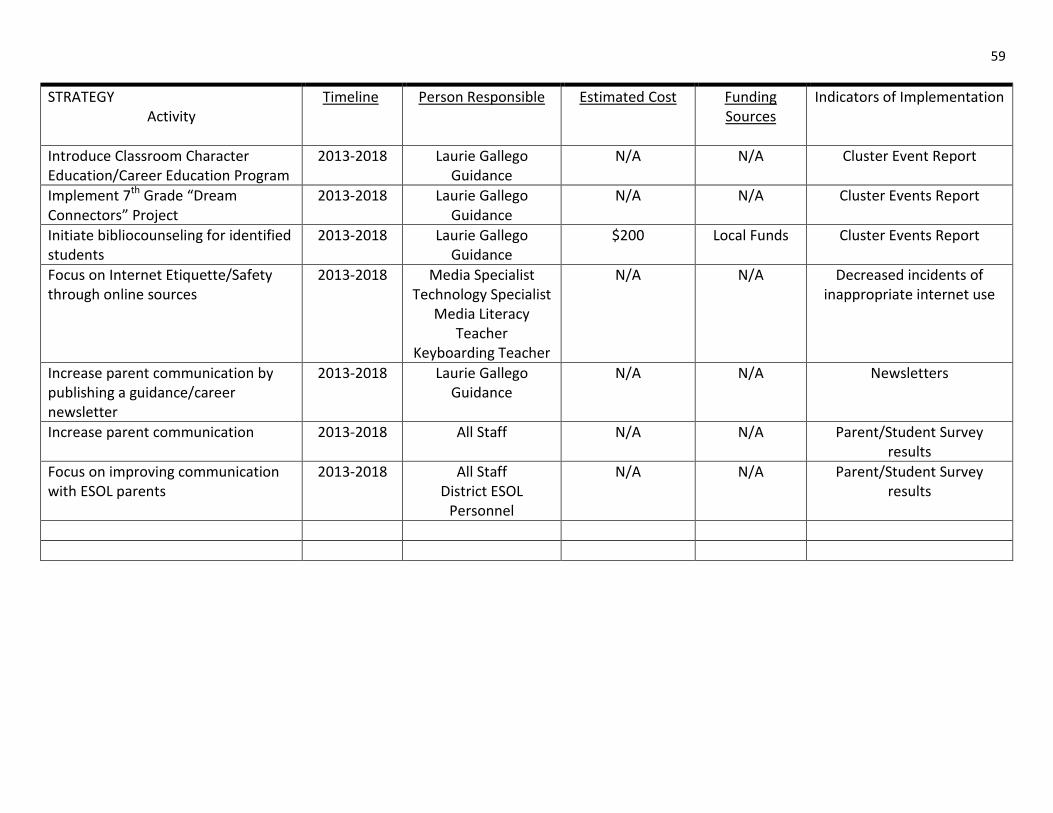
STRATEGY Activity
Timeline Person Responsible Estimated Cost Funding Sources
Indicators of Implementation
Introduce Classroom Character Education/Career Education Program
2013-2018 Laurie Gallego Guidance
N/A N/A Cluster Event Report
Implement 7th Grade “Dream Connectors” Project
2013-2018 Laurie Gallego Guidance
N/A N/A Cluster Events Report
Initiate bibliocounseling for identified students
2013-2018 Laurie Gallego Guidance
$200 Local Funds Cluster Events Report
Focus on Internet Etiquette/Safety through online sources
2013-2018 Media Specialist Technology Specialist
Media Literacy Teacher
Keyboarding Teacher
N/A N/A Decreased incidents of inappropriate internet use
Increase parent communication by publishing a guidance/career newsletter
2013-2018 Laurie Gallego Guidance
N/A N/A Newsletters
Increase parent communication 2013-2018 All Staff N/A N/A Parent/Student Survey results
Focus on improving communication with ESOL parents
2013-2018 All Staff District ESOL
Personnel
N/A N/A Parent/Student Survey results

60
http://www.ed.sc.gov/data/report-cards/2012/middle/c/m2301059.pdf
http://www.ed.sc.gov/data/esea/2012/school.cfm?SID=2301059
http://ed.sc.gov/data/report-cards/2013/district.cfm?ID=2301