Embed Size (px)
Citation preview

March 2015 – Confidential 0
STRATEGIC GUIDELINES
2017-2021
ROADSHOW
FRANKFURT - DUSSELDORF
16TH NOVEMBER 2016
March 2015 – Confidential 1
DISCLAIMER
This presentation has been prepared by BANZAI S.p.A. for information purposes only and for use in presentations of the Group’s results and strategies.For further details on the BANZAI Group, reference should be made to publicly available information.Statements contained in this presentation, particularly regarding any possible or assumed future performance of the Group, are or may be forward-looking statements based on BANZAI S.p.A.’s current expectations and projections about future events, and in this respect may involve some risks and uncertainties.Actual future results for any quarter or annual period may therefore differ materially from those expressed in or implied by these statements due to a number of different factors, many of which are beyond the ability of BANZAI S.p.A. to control or estimate precisely, including, but not limited to, the Group’s ability to manage the effects of the uncertain current local and global economic conditions on our business and to predict future economic conditions, the Group’s ability to achieve and manage growth, the degree to which BANZAI S.p.A. enters into, maintains and develops commercial and partnership agreements, the Group’s ability to successfully identify, develop and retain key employees, manage and maintain key customer relationships and maintain key supply sources, unfavourable development affecting consumer spending, the rate of growth of the Internet and online commerce, Italian advertising market, competition, fluctuations in exchange rates, any failure of information technology, inventory and other asset risk, credit risk on our accounts, regulatory developments and changes in tax laws.BANZAI S.p.A. does not undertake any obligation to publicly release any revisions to any forward-looking statements to reflect events or circumstances after the date of this presentation.Any reference to past performance of the BANZAI Group shall not be taken as an indication of future performance.This document does not constitute an offer or invitation to purchase or subscribe to any shares and no part of it shall form the basis of or be relied upon in connection with any contract or commitment whatsoever.By attending the presentation you agree to be bound by the foregoing terms.
March 2015 – Confidential 2
BANZAI: PRESENTING TODAY
• Joined Banzai in 2015
• CEO and GM of Italian listed publisher RCS MediaGroup in 2012-2015
• Microsoft’s CEO in Italy
• CFO of Internet Division in Matrix, Seat Group / Telecom Italia.
Pietro Scott JovaneCEO
Banzai
Micaela FerrutaHead of Investor Relations
and Strategic Planning
• Joined Banzai in 2015
• Previously: Head of Media & Telecommunications Coverage in Intermonte
• Worked in Infostrada
March 2015 – Confidential 3
TODAY’S AGENDA
• STRATEGIC GUIDELINES 2017-2021
• FINANCIAL TARGETS
• 9 MONTHS 2016 REPORTING & 2016 PRE-CLOSE GUIDANCE
• PEERS VALUATION
• COMPANY STRUCTURE & PAST TRANSACTIONS
4
STRATEGIC GUIDELINES2017-2021
“from e-Commerce to e-Service”
March 2015 – Confidential 5
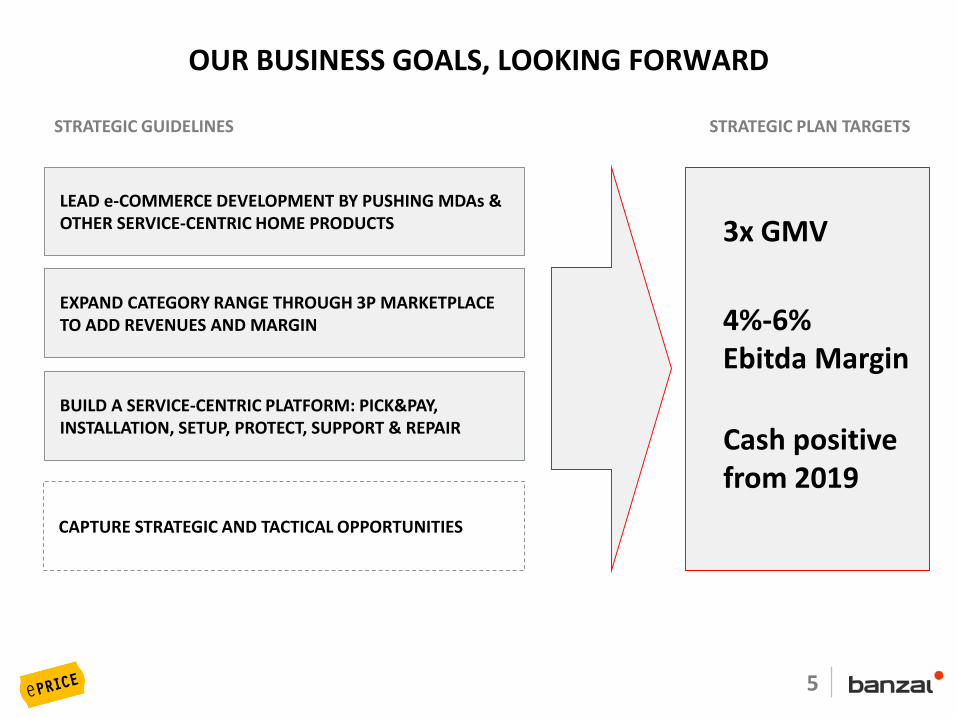
OUR BUSINESS GOALS, LOOKING FORWARD
LEAD e-COMMERCE DEVELOPMENT BY PUSHING MDAs & OTHER SERVICE-CENTRIC HOME PRODUCTS
EXPAND CATEGORY RANGE THROUGH 3P MARKETPLACE TO ADD REVENUES AND MARGIN
STRATEGIC PLAN TARGETS
BUILD A SERVICE-CENTRIC PLATFORM: PICK&PAY, INSTALLATION, SETUP, PROTECT, SUPPORT & REPAIR
CAPTURE STRATEGIC AND TACTICAL OPPORTUNITIES
STRATEGIC GUIDELINES
3x GMV
4%-6% Ebitda Margin
Cash positive from 2019
March 2015 – Confidential 6
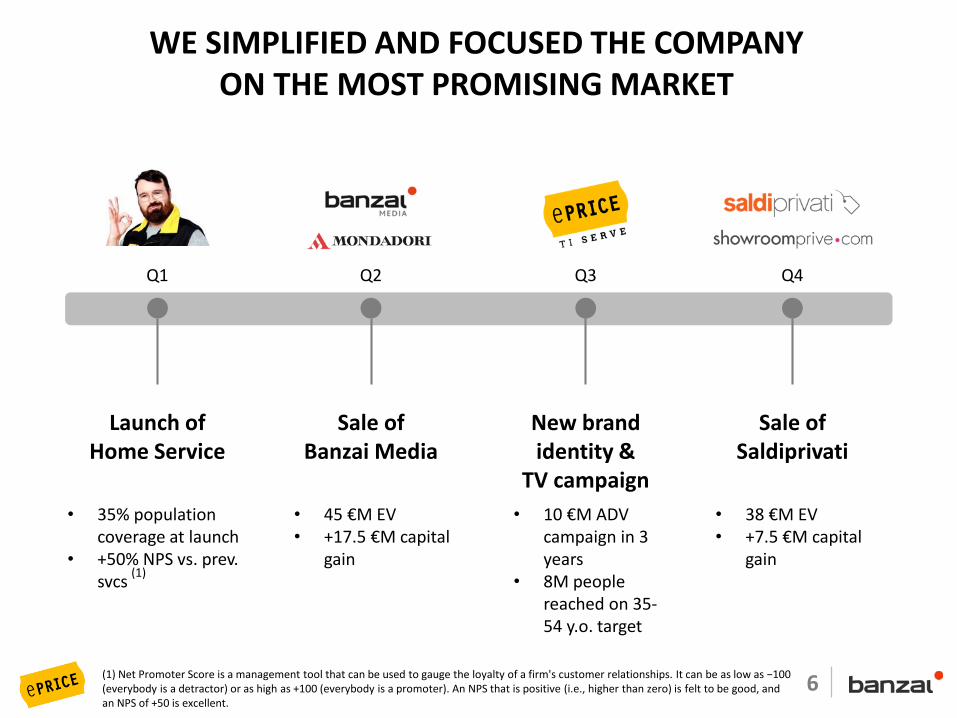
WE SIMPLIFIED AND FOCUSED THE COMPANYON THE MOST PROMISING MARKET
Q1
Launch ofHome Service
Q2
Sale ofBanzai Media
Q3
New brandidentity &
TV campaign
Q4
Sale ofSaldiprivati
• 45 €M EV• +17.5 €M capital
gain
• 10 €M ADV campaign in 3 years
• 8M people reached on 35-54 y.o. target
• 38 €M EV• +7.5 €M capital
gain
• 35% population coverage at launch
• +50% NPS vs. prev. svcs
(1) Net Promoter Score is a management tool that can be used to gauge the loyalty of a firm's customer relationships. It can be as low as −100 (everybody is a detractor) or as high as +100 (everybody is a promoter). An NPS that is positive (i.e., higher than zero) is felt to be good, and an NPS of +50 is excellent.
(1)
7
TODAY WE CHANGE NAME BANZAI BECOMES ePRICE
(Media)
Holding…
8
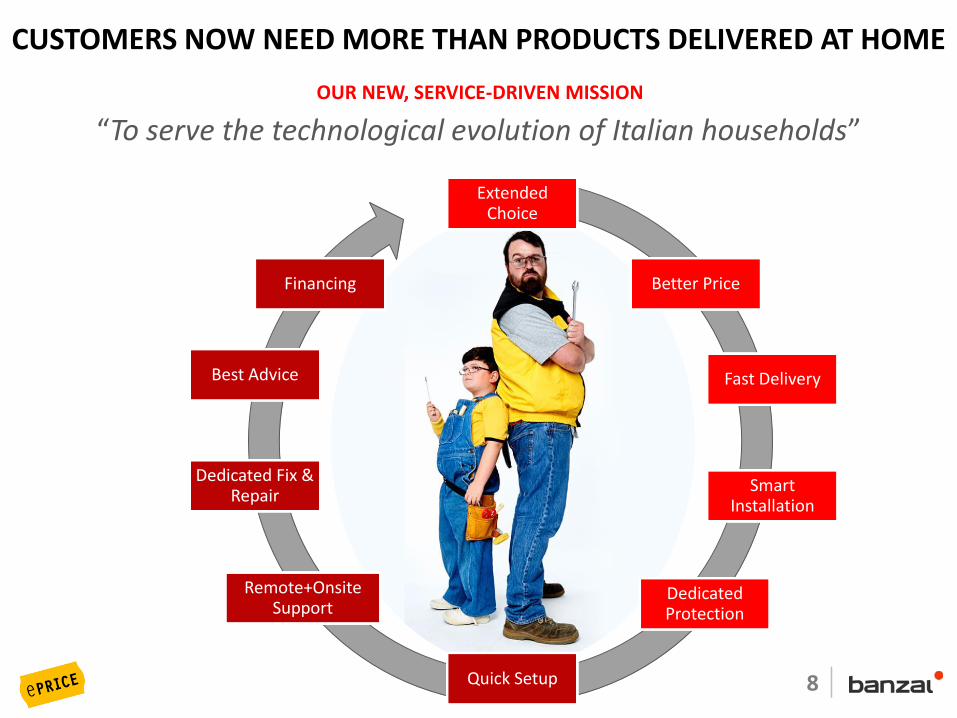
Extended Choice
Better Price
Fast Delivery
Smart Installation
Dedicated Protection
Quick Setup
Remote+OnsiteSupport
Dedicated Fix & Repair
Best Advice
Financing
“To serve the technological evolution of Italian households”
OUR NEW, SERVICE-DRIVEN MISSION
CUSTOMERS NOW NEED MORE THAN PRODUCTS DELIVERED AT HOME
9
-0.5%
0.0%
0.5%
1.0%
1.5%
2.0%
2.5%
3.0%
3.5%
2014 2015 2016 2017 2018 2019 2020 2021
34.4
41.2
48.3
48.2
55.3
64.4
14.6
19.226.6
42.1
48.254.4
10.0
20.0
30.0
40.0
50.0
60.0
70.0
2013 2016 2021
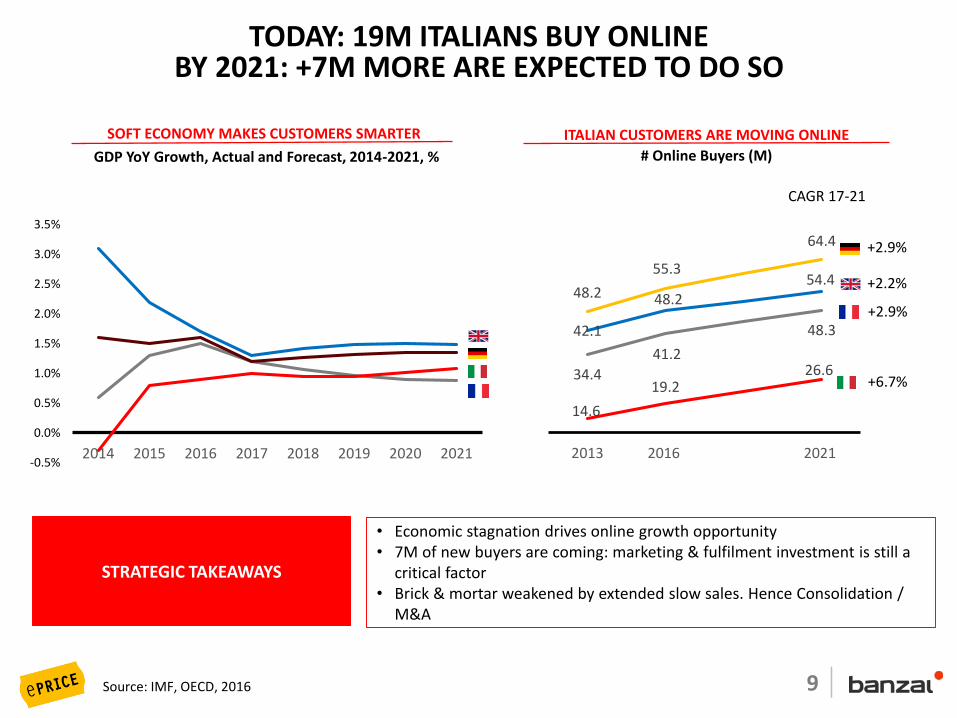
• Economic stagnation drives online growth opportunity• 7M of new buyers are coming: marketing & fulfilment investment is still a
critical factor• Brick & mortar weakened by extended slow sales. Hence Consolidation /
M&A
Source: IMF, OECD, 2016
STRATEGIC TAKEAWAYS
TODAY: 19M ITALIANS BUY ONLINEBY 2021: +7M MORE ARE EXPECTED TO DO SO
SOFT ECONOMY MAKES CUSTOMERS SMARTER
GDP YoY Growth, Actual and Forecast, 2014-2021, % # Online Buyers (M)
ITALIAN CUSTOMERS ARE MOVING ONLINE
+2.9%
+2.2%
+2.9%
+6.7%
CAGR 17-21
10
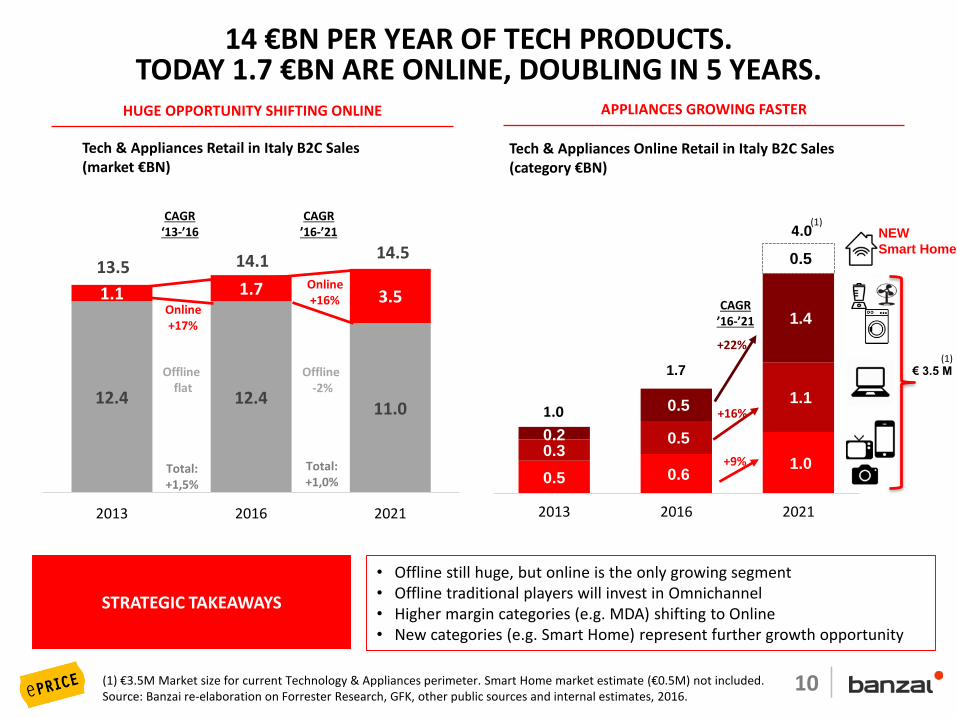
12.4 12.411.0
1.1 1.7 3.5
13.5 14.1 14.5
2013 2016 2021
Online+16%
Offline -2%
Online+17%
Offline flat
0.5 0.6 1.0
0.30.5
1.1
0.2
0.5
1.4
0.5
1.7
4.0
2013 2016 2021
HUGE OPPORTUNITY SHIFTING ONLINE
(1) €3.5M Market size for current Technology & Appliances perimeter. Smart Home market estimate (€0.5M) not included. Source: Banzai re-elaboration on Forrester Research, GFK, other public sources and internal estimates, 2016.
• Offline still huge, but online is the only growing segment• Offline traditional players will invest in Omnichannel• Higher margin categories (e.g. MDA) shifting to Online• New categories (e.g. Smart Home) represent further growth opportunity
STRATEGIC TAKEAWAYS
14 €BN PER YEAR OF TECH PRODUCTS.TODAY 1.7 €BN ARE ONLINE, DOUBLING IN 5 YEARS.
Tech & Appliances Retail in Italy B2C Sales (market €BN)
APPLIANCES GROWING FASTER
Tech & Appliances Online Retail in Italy B2C Sales (category €BN)
+9%
+22%
+16%
NEW
Smart Home
(1)
€ 3.5 M (1)
1.0
CAGR ’16-’21
CAGR ‘13-’16
Total: +1,5%
Total: +1,0%
CAGR ’16-’21
11
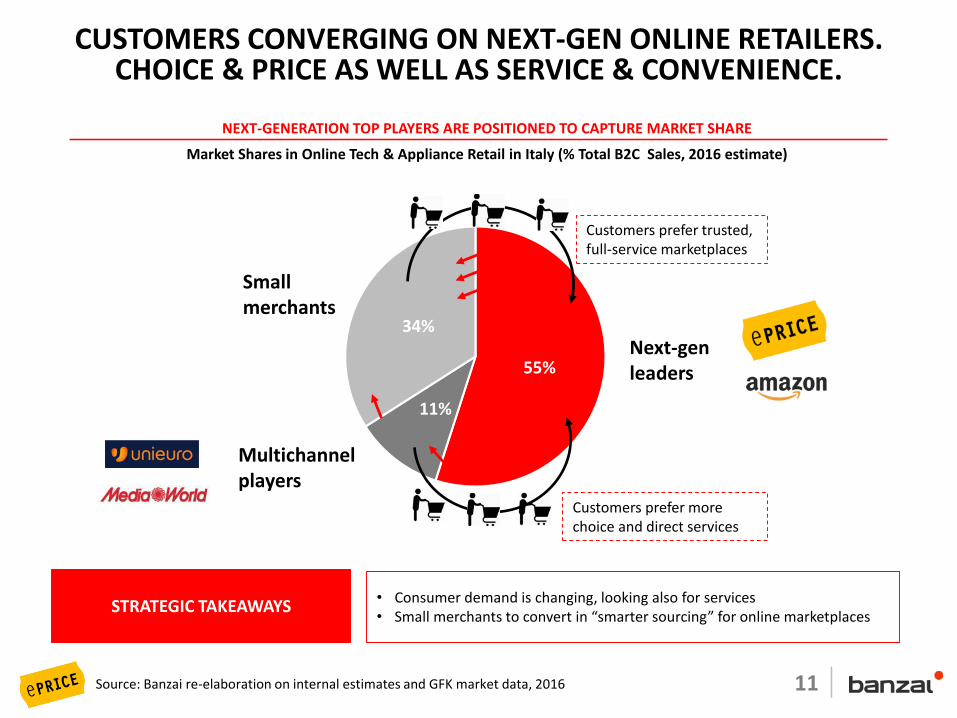
55%
11%
34%
Source: Banzai re-elaboration on internal estimates and GFK market data, 2016
• Consumer demand is changing, looking also for services• Small merchants to convert in “smarter sourcing” for online marketplaces
STRATEGIC TAKEAWAYS
CUSTOMERS CONVERGING ON NEXT-GEN ONLINE RETAILERS.CHOICE & PRICE AS WELL AS SERVICE & CONVENIENCE.
NEXT-GENERATION TOP PLAYERS ARE POSITIONED TO CAPTURE MARKET SHARE
Market Shares in Online Tech & Appliance Retail in Italy (% Total B2C Sales, 2016 estimate)
Small merchants
Multichannel players
Next-genleaders
Customers prefer trusted, full-service marketplaces
Customers prefer more choice and direct services
March 2015 – Confidential 12
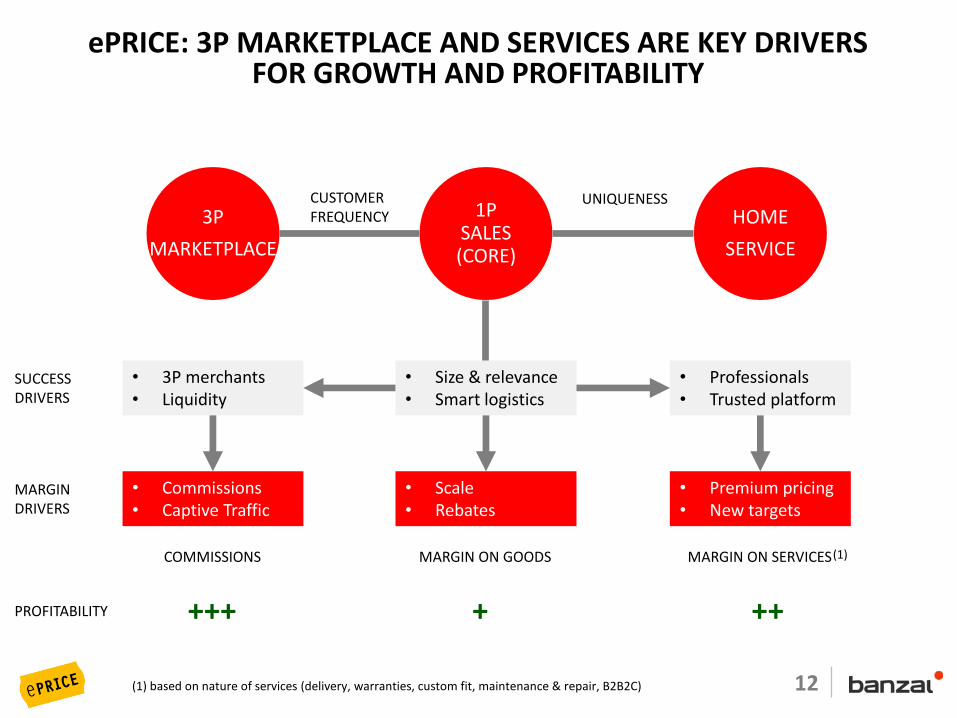
ePRICE: 3P MARKETPLACE AND SERVICES ARE KEY DRIVERSFOR GROWTH AND PROFITABILITY
1PSALES(CORE)
3P
MARKETPLACE
HOME
SERVICE
• 3P merchants• Liquidity
SUCCESSDRIVERS
MARGINDRIVERS
• Size & relevance• Smart logistics
• Professionals• Trusted platform
• Commissions• Captive Traffic
• Scale• Rebates
• Premium pricing• New targets
COMMISSIONS MARGIN ON GOODS MARGIN ON SERVICES
UNIQUENESSCUSTOMER FREQUENCY
PROFITABILITY
(1) based on nature of services (delivery, warranties, custom fit, maintenance & repair, B2B2C)
(1)
+++ + ++
March 2015 – Confidential 13
10.0%
20.0%
30.0%
40.0%
0
50
100
150
200
250
2013 2016 2021
MDA revenue Market Share MDA
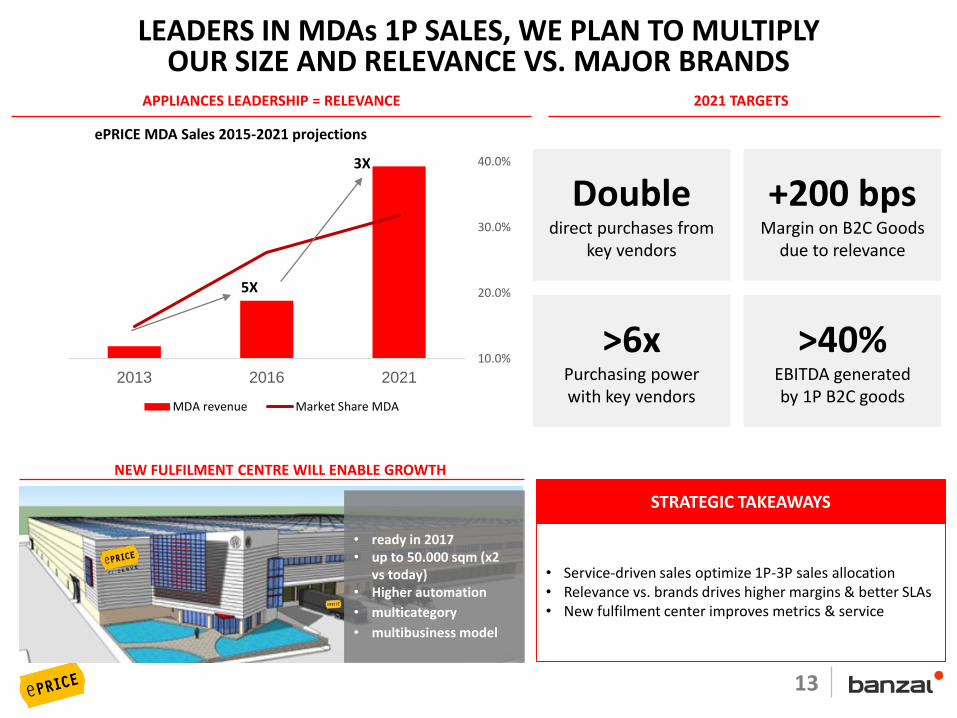
LEADERS IN MDAs 1P SALES, WE PLAN TO MULTIPLYOUR SIZE AND RELEVANCE VS. MAJOR BRANDS
ePRICE MDA Sales 2015-2021 projections
APPLIANCES LEADERSHIP = RELEVANCE
NEW FULFILMENT CENTRE WILL ENABLE GROWTH
2021 TARGETS
Doubledirect purchases from
key vendors
+200 bpsMargin on B2C Goods
due to relevance
>6xPurchasing powerwith key vendors
>40%EBITDA generatedby 1P B2C goods
• ready in 2017• up to 50.000 sqm (x2
vs today) • Higher automation
• multicategory
• multibusiness model
• Service-driven sales optimize 1P-3P sales allocation• Relevance vs. brands drives higher margins & better SLAs• New fulfilment center improves metrics & service
STRATEGIC TAKEAWAYS
3X
5X
March 2015 – Confidential 14
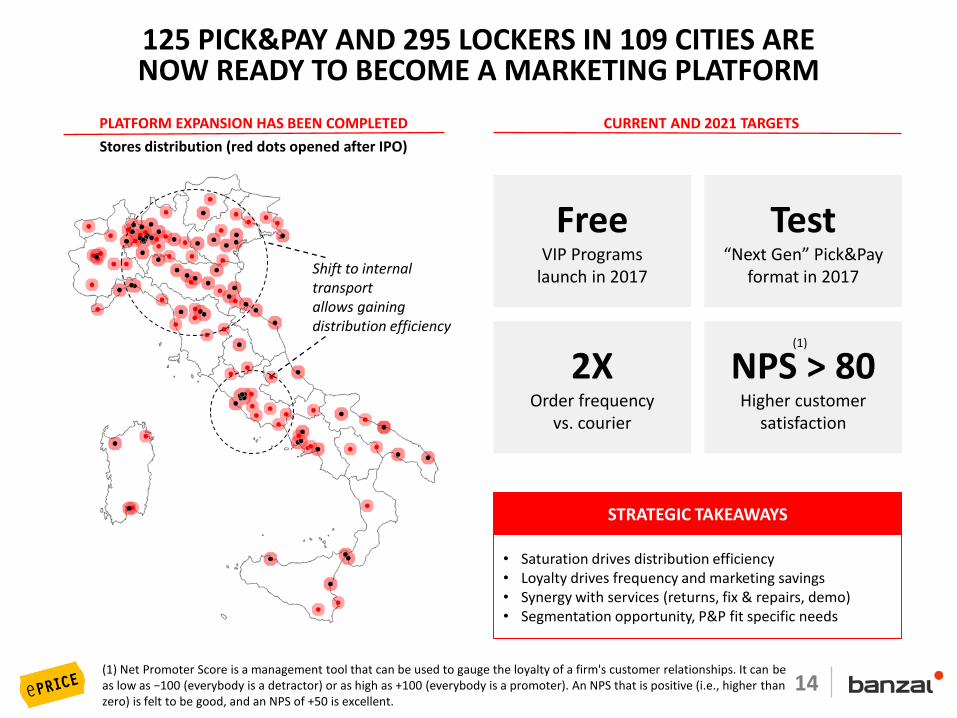
PLATFORM EXPANSION HAS BEEN COMPLETED
Stores distribution (red dots opened after IPO)
CURRENT AND 2021 TARGETS
Shift to internal transportallows gaining distribution efficiency
125 PICK&PAY AND 295 LOCKERS IN 109 CITIES ARENOW READY TO BECOME A MARKETING PLATFORM
FreeVIP Programs
launch in 2017
Test“Next Gen” Pick&Pay
format in 2017
2XOrder frequency
vs. courier
• Saturation drives distribution efficiency• Loyalty drives frequency and marketing savings• Synergy with services (returns, fix & repairs, demo)• Segmentation opportunity, P&P fit specific needs
STRATEGIC TAKEAWAYS
NPS > 80Higher customer
satisfaction
(1) Net Promoter Score is a management tool that can be used to gauge the loyalty of a firm's customer relationships. It can be as low as −100 (everybody is a detractor) or as high as +100 (everybody is a promoter). An NPS that is positive (i.e., higher than zero) is felt to be good, and an NPS of +50 is excellent.
(1)
March 2015 – Confidential 15
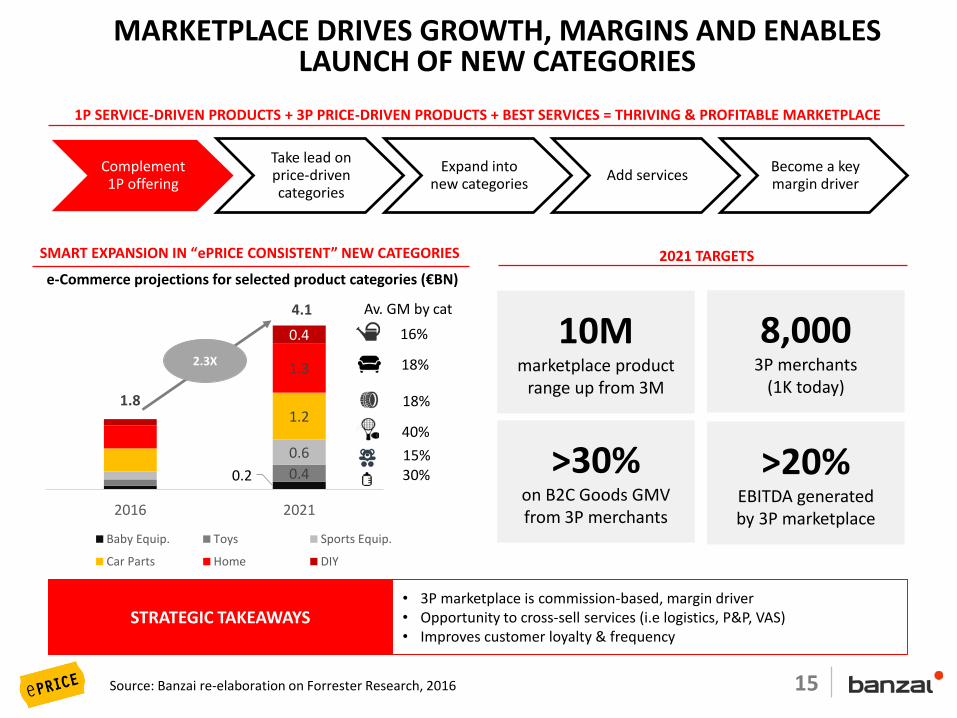
MARKETPLACE DRIVES GROWTH, MARGINS AND ENABLES LAUNCH OF NEW CATEGORIES
• 3P marketplace is commission-based, margin driver• Opportunity to cross-sell services (i.e logistics, P&P, VAS)• Improves customer loyalty & frequency
STRATEGIC TAKEAWAYS
Complement1P offering
Take lead onprice-driven categories
Expand into new categories
Add servicesBecome a key margin driver
1P SERVICE-DRIVEN PRODUCTS + 3P PRICE-DRIVEN PRODUCTS + BEST SERVICES = THRIVING & PROFITABLE MARKETPLACE
SMART EXPANSION IN “ePRICE CONSISTENT” NEW CATEGORIES
>30%on B2C Goods GMV from 3P merchants
8,0003P merchants
(1K today)
10Mmarketplace product
range up from 3M
>20%EBITDA generatedby 3P marketplace
2021 TARGETS
0.2 0.4
0.6
1.2
1.3
0.4
1.8
4.1
0.00.51.01.52.02.53.03.54.04.5
0.00.51.01.52.02.53.03.54.04.5
2016 2021
Baby Equip. Toys Sports Equip.
Car Parts Home DIY
Av. GM by cat
16%
18%
18%
40%
15%30%
2.3X
e-Commerce projections for selected product categories (€BN)
Source: Banzai re-elaboration on Forrester Research, 2016
16
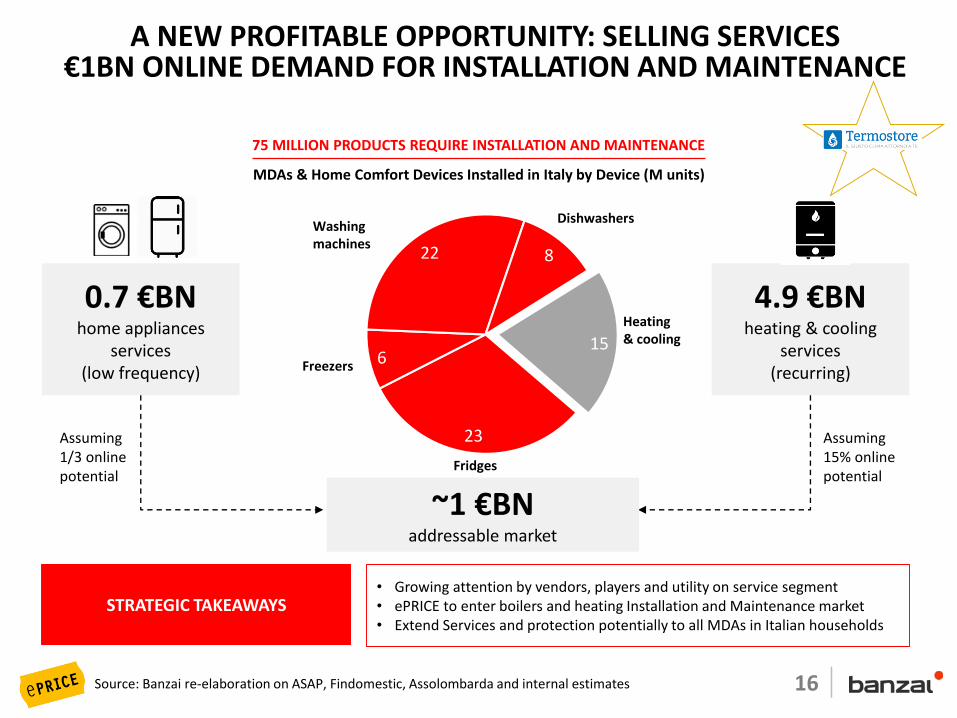
MDAs & Home Comfort Devices Installed in Italy by Device (M units)
75 MILLION PRODUCTS REQUIRE INSTALLATION AND MAINTENANCE
Source: Banzai re-elaboration on ASAP, Findomestic, Assolombarda and internal estimates
STRATEGIC TAKEAWAYS• Growing attention by vendors, players and utility on service segment• ePRICE to enter boilers and heating Installation and Maintenance market • Extend Services and protection potentially to all MDAs in Italian households
23
6
22 8
15
Fridges
DishwashersWashingmachines
Freezers
Heating& cooling
4.9 €BNheating & cooling
services (recurring)
0.7 €BNhome appliances
services (low frequency)
~1 €BN addressable market
Assuming15% onlinepotential
Assuming1/3 onlinepotential
A NEW PROFITABLE OPPORTUNITY: SELLING SERVICES€1BN ONLINE DEMAND FOR INSTALLATION AND MAINTENANCE
March 2015 – Confidential 17
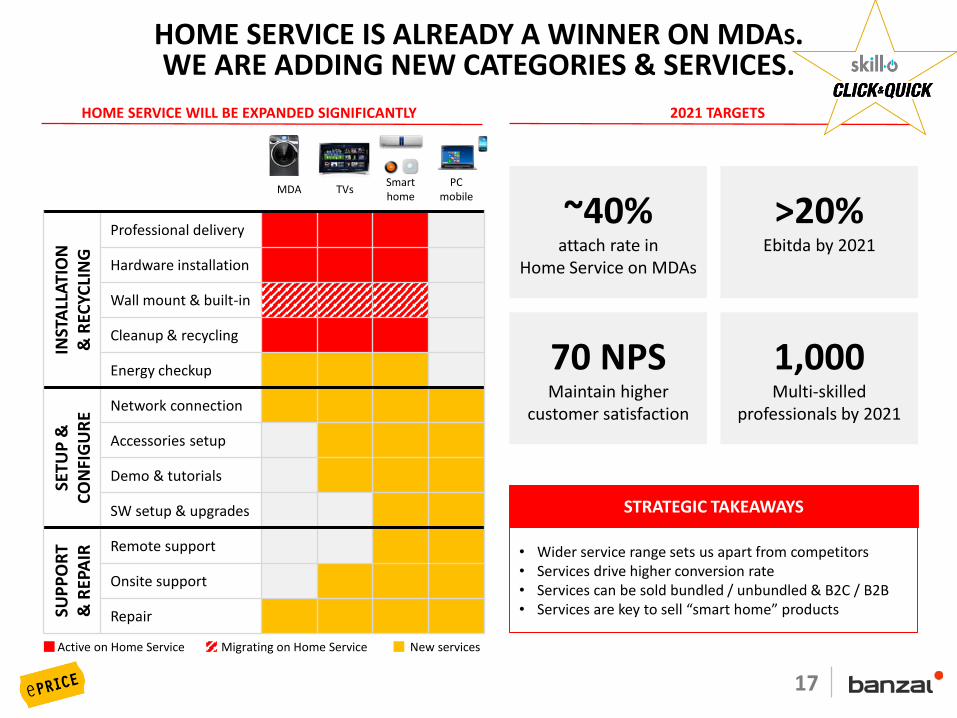
HOME SERVICE IS ALREADY A WINNER ON MDAS.WE ARE ADDING NEW CATEGORIES & SERVICES.
MDA TVsSmart home
PCmobile
INST
ALL
ATI
ON
& R
ECYC
LIN
G
Professional delivery
Hardware installation
Wall mount & built-in
Cleanup & recycling
Energy checkup
SETU
P &
C
ON
FIG
UR
E
Network connection
Accessories setup
Demo & tutorials
SW setup & upgrades
SUP
PO
RT
& R
EPA
IR Remote support
Onsite support
Repair
Active on Home Service Migrating on Home Service New services
~40%attach rate in
Home Service on MDAs
>20%Ebitda by 2021
70 NPSMaintain higher
customer satisfaction
1,000Multi-skilled
professionals by 2021
2021 TARGETS
STRATEGIC TAKEAWAYS
HOME SERVICE WILL BE EXPANDED SIGNIFICANTLY
• Wider service range sets us apart from competitors• Services drive higher conversion rate• Services can be sold bundled / unbundled & B2C / B2B• Services are key to sell “smart home” products
March 2015 – Confidential 18
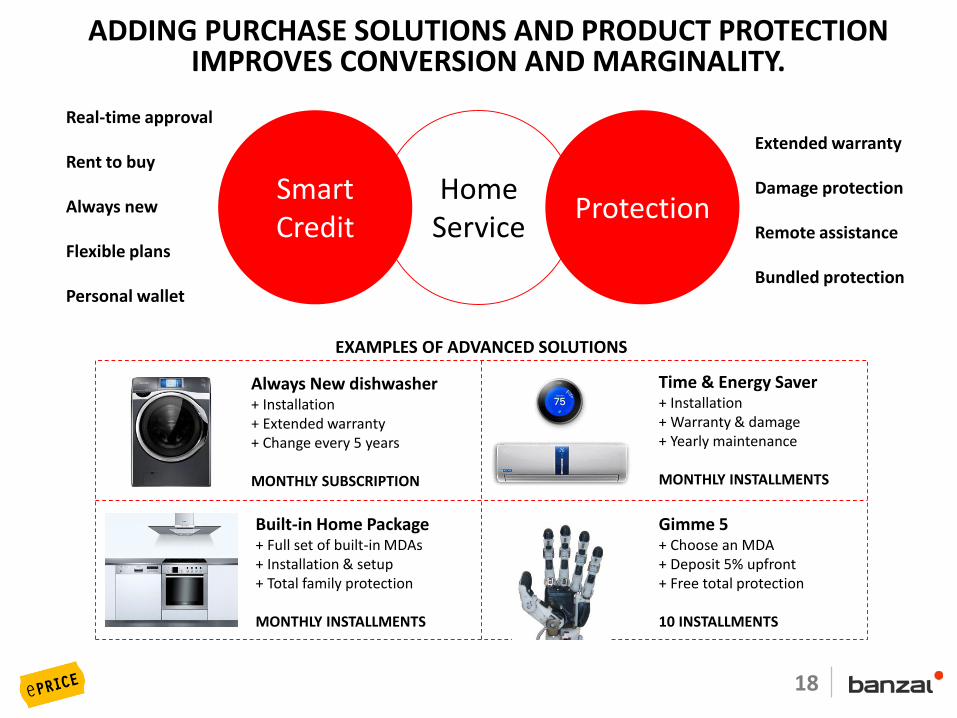
ADDING PURCHASE SOLUTIONS AND PRODUCT PROTECTION IMPROVES CONVERSION AND MARGINALITY.
HomeService
ProtectionSmartCredit
Real-time approval
Rent to buy
Always new
Flexible plans
Personal wallet
Extended warranty
Damage protection
Remote assistance
Bundled protection
Built-in Home Package+ Full set of built-in MDAs+ Installation & setup+ Total family protection
MONTHLY INSTALLMENTS
Always New dishwasher+ Installation+ Extended warranty+ Change every 5 years
MONTHLY SUBSCRIPTION
Time & Energy Saver+ Installation+ Warranty & damage+ Yearly maintenance
MONTHLY INSTALLMENTS
Gimme 5+ Choose an MDA+ Deposit 5% upfront+ Free total protection
10 INSTALLMENTS
EXAMPLES OF ADVANCED SOLUTIONS
March 2015 – Confidential 19
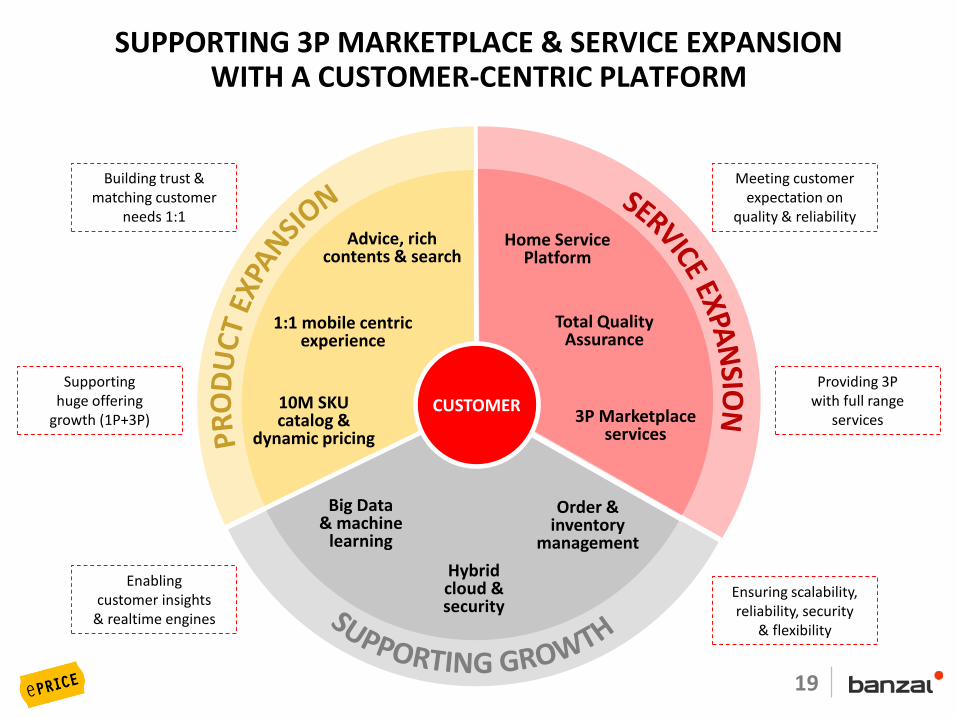
Order &inventory
management
Total Quality Assurance
Big Data& machine
learning
Home Service Platform
SUPPORTING 3P MARKETPLACE & SERVICE EXPANSIONWITH A CUSTOMER-CENTRIC PLATFORM
3P Marketplaceservices
Hybridcloud &security
Meeting customer expectation on
quality & reliability
Providing 3Pwith full range
services
Ensuring scalability,reliability, security
& flexibility
Enablingcustomer insights
& realtime engines
Supportinghuge offering
growth (1P+3P)
Building trust & matching customer
needs 1:1
CUSTOMER10M SKU catalog &
dynamic pricing
Advice, rich contents & search
1:1 mobile centric experience

20
FINANCIAL TARGETS
March 2015 – Confidential 21
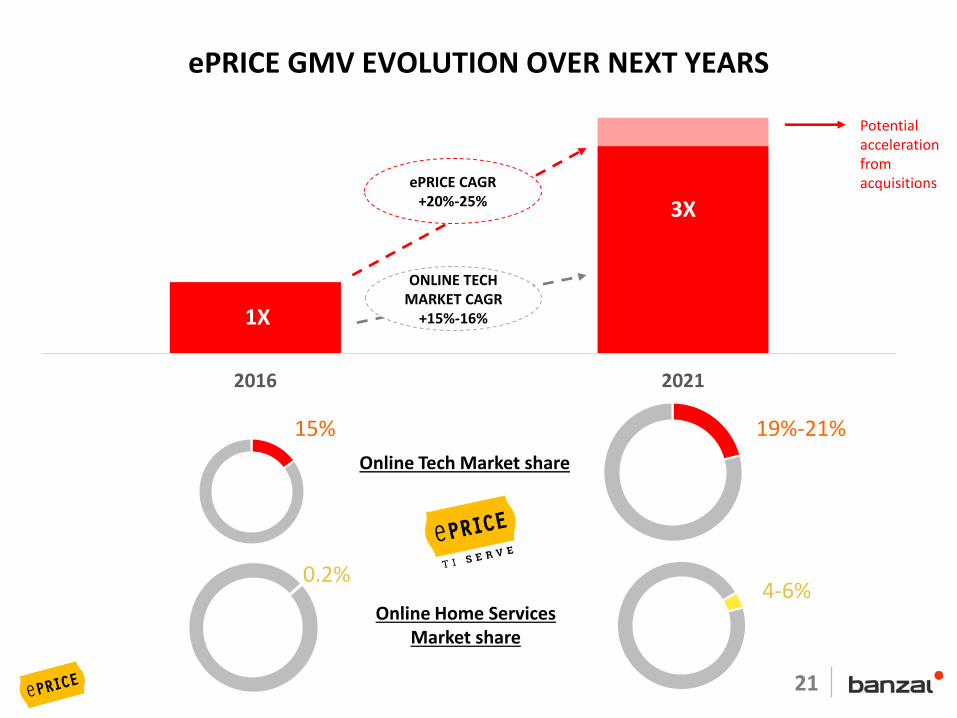
2016 2021
ePRICE GMV EVOLUTION OVER NEXT YEARS
ONLINE TECH MARKET CAGR
+15%-16%
ePRICE CAGR +20%-25%
Potential acceleration from acquisitions
3X
1X
15% 19%-21%
Online Tech Market share
4-6%Online Home Services
Market share
0.2%
March 2015 – Confidential 22
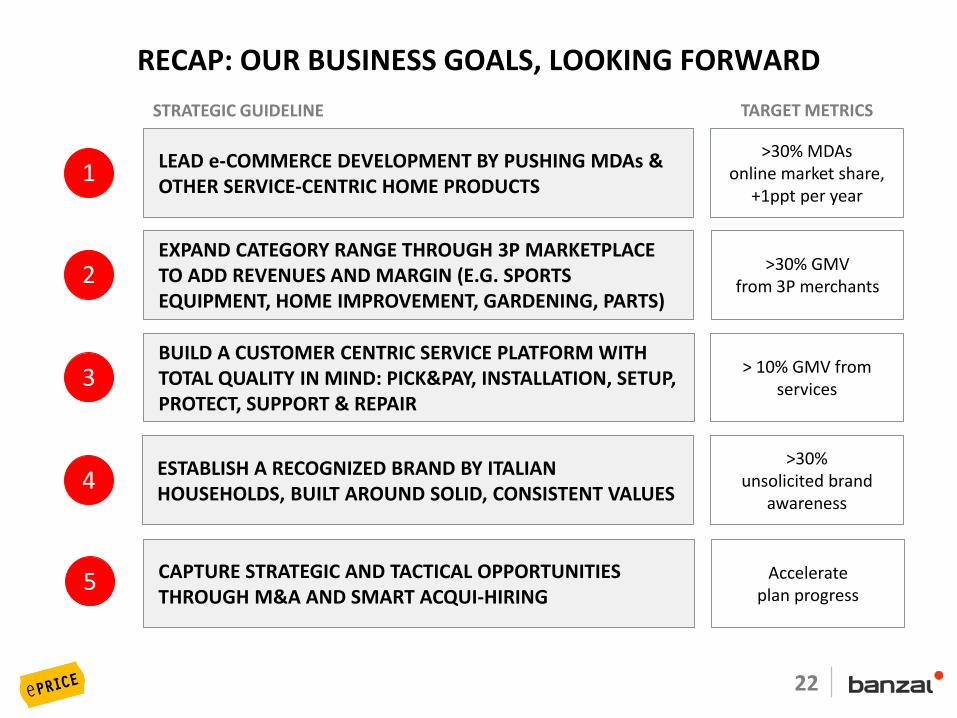
RECAP: OUR BUSINESS GOALS, LOOKING FORWARD
1LEAD e-COMMERCE DEVELOPMENT BY PUSHING MDAs & OTHER SERVICE-CENTRIC HOME PRODUCTS
3
EXPAND CATEGORY RANGE THROUGH 3P MARKETPLACE TO ADD REVENUES AND MARGIN (E.G. SPORTS EQUIPMENT, HOME IMPROVEMENT, GARDENING, PARTS)
>30% MDAsonline market share,
+1ppt per year
TARGET METRICS
>30% GMVfrom 3P merchants2
BUILD A CUSTOMER CENTRIC SERVICE PLATFORM WITH TOTAL QUALITY IN MIND: PICK&PAY, INSTALLATION, SETUP, PROTECT, SUPPORT & REPAIR
> 10% GMV from services
ESTABLISH A RECOGNIZED BRAND BY ITALIAN HOUSEHOLDS, BUILT AROUND SOLID, CONSISTENT VALUES
4>30%
unsolicited brand awareness
Accelerateplan progress
CAPTURE STRATEGIC AND TACTICAL OPPORTUNITIESTHROUGH M&A AND SMART ACQUI-HIRING
STRATEGIC GUIDELINE
5
March 2015 – Confidential 23
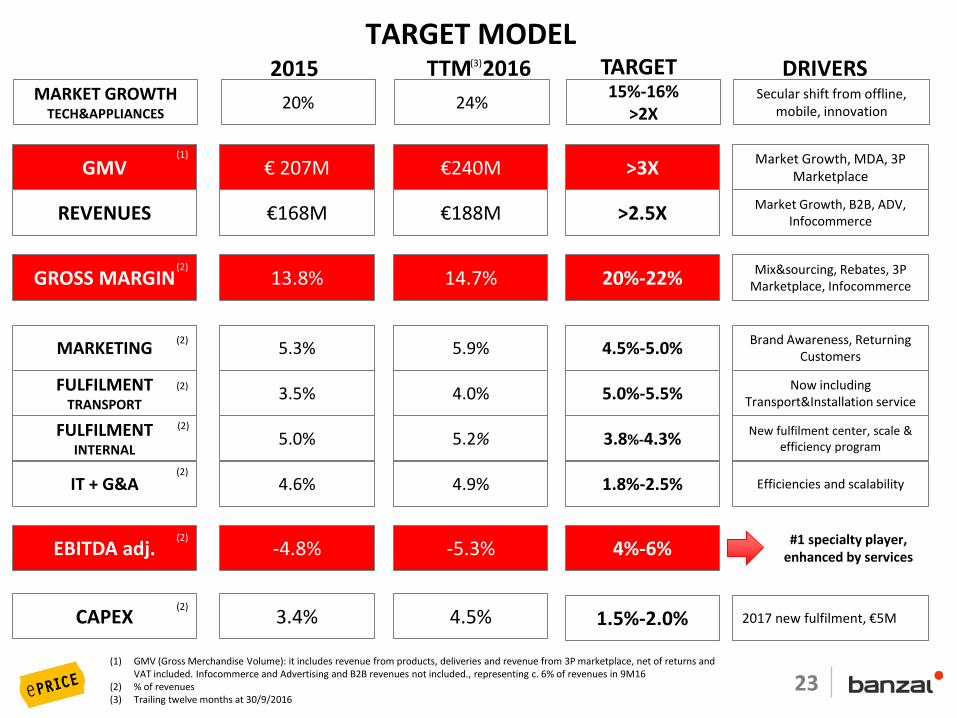
TARGET MODEL
GMV € 207M €240MMarket Growth, MDA, 3P
Marketplace
GROSS MARGIN 13.8% 14.7%Mix&sourcing, Rebates, 3P
Marketplace, Infocommerce
IT + G&A 4.6% 4.9% Efficiencies and scalability
EBITDA adj. -4.8% -5.3%#1 specialty player,
enhanced by services
CAPEX 3.4% 4.5% 2017 new fulfilment, €5M
2015 TTM 2016 DRIVERS
>3X
20%-22%
1.8%-2.5%
4%-6%
1.5%-2.0%
TARGET
FULFILMENT TRANSPORT
3.5% 4.0%Now including
Transport&Installation service5.0%-5.5%
REVENUES €168M €188MMarket Growth, B2B, ADV,
Infocommerce>2.5X
(1) GMV (Gross Merchandise Volume): it includes revenue from products, deliveries and revenue from 3P marketplace, net of returns and VAT included. Infocommerce and Advertising and B2B revenues not included., representing c. 6% of revenues in 9M16
(2) % of revenues(3) Trailing twelve months at 30/9/2016
MARKETING 5.3% 5.9%Brand Awareness, Returning
Customers4.5%-5.0%(2)
(2)
(2)
(2)
(2)
(2)
(3)
(1)
FULFILMENT INTERNAL
5.0% 5.2%New fulfilment center, scale &
efficiency program3.8%-4.3%(2)
MARKET GROWTHTECH&APPLIANCES
20% 24%Secular shift from offline,
mobile, innovation
15%-16%>2X
March 2015 – Confidential 24
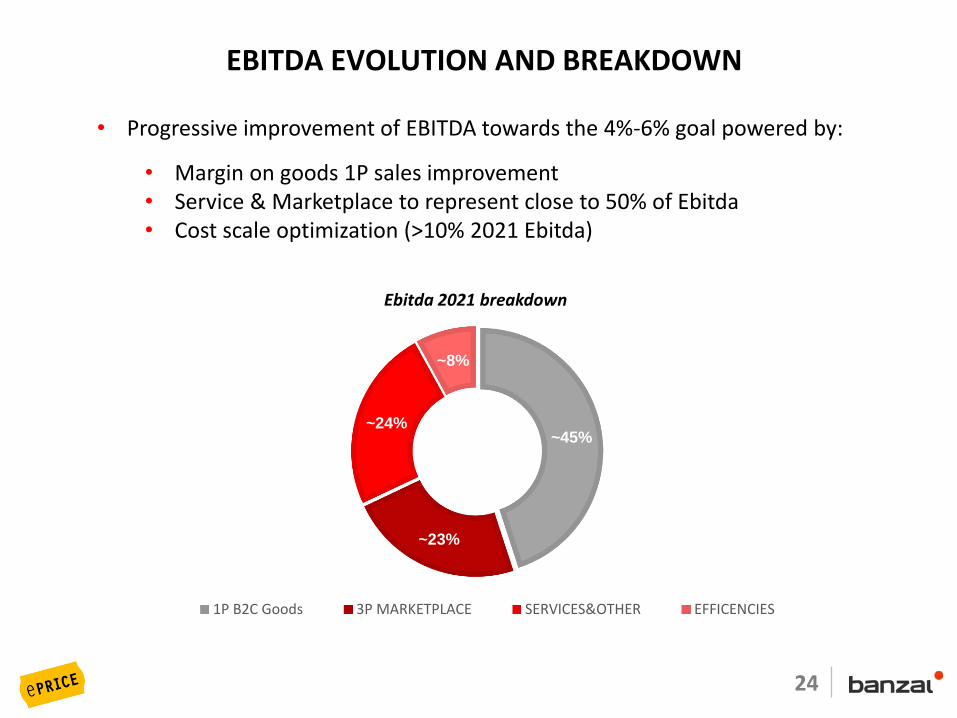
~45%
~23%
~24%
~8%
1P B2C Goods 3P MARKETPLACE SERVICES&OTHER EFFICENCIES
EBITDA EVOLUTION AND BREAKDOWN
• Progressive improvement of EBITDA towards the 4%-6% goal powered by:
• Margin on goods 1P sales improvement• Service & Marketplace to represent close to 50% of Ebitda • Cost scale optimization (>10% 2021 Ebitda)
Ebitda 2021 breakdown
March 2015 – Confidential 25
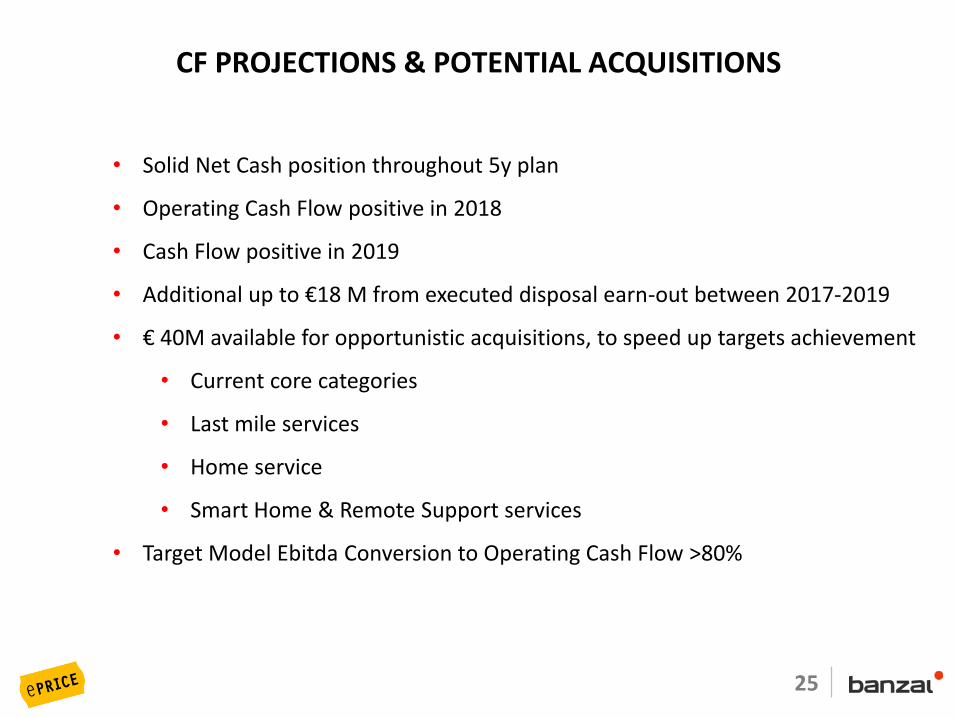
CF PROJECTIONS & POTENTIAL ACQUISITIONS
• Solid Net Cash position throughout 5y plan
• Operating Cash Flow positive in 2018
• Cash Flow positive in 2019
• Additional up to €18 M from executed disposal earn-out between 2017-2019
• € 40M available for opportunistic acquisitions, to speed up targets achievement
• Current core categories
• Last mile services
• Home service
• Smart Home & Remote Support services
• Target Model Ebitda Conversion to Operating Cash Flow >80%

26
REPORTING: 9M 2016
27
121.7
152.8
6.2
6.5
3.8
3.9
131.7
163.2
9M 15 9M 16
Electr&Appliances Other Services
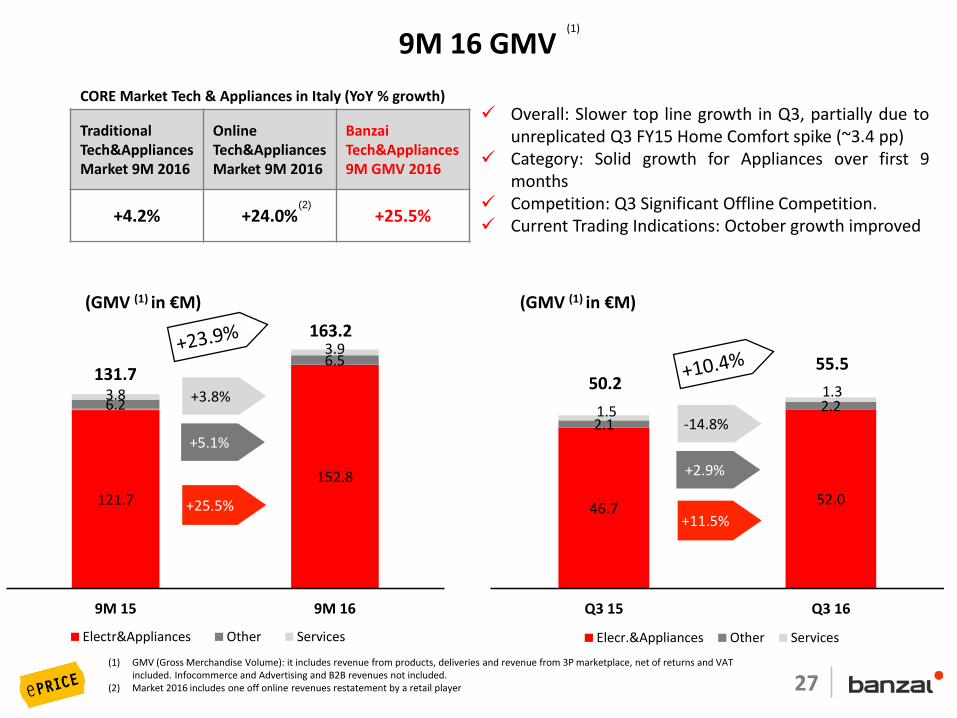
9M 16 GMV
(GMV (1) in €M)
(1) GMV (Gross Merchandise Volume): it includes revenue from products, deliveries and revenue from 3P marketplace, net of returns and VAT included. Infocommerce and Advertising and B2B revenues not included.
(2) Market 2016 includes one off online revenues restatement by a retail player
+25.5%
+5.1%
+3.8%
+11.5%
+2.9%
-14.8%
TraditionalTech&AppliancesMarket 9M 2016
Online Tech&AppliancesMarket 9M 2016
Banzai Tech&Appliances9M GMV 2016
+4.2% +24.0% +25.5%
CORE Market Tech & Appliances in Italy (YoY % growth)
(1)
Overall: Slower top line growth in Q3, partially due tounreplicated Q3 FY15 Home Comfort spike (~3.4 pp)
Category: Solid growth for Appliances over first 9months
Competition: Q3 Significant Offline Competition. Current Trading Indications: October growth improved
(GMV (1) in €M)
(2)
46.752.0
2.12.21.51.350.2
55.5
Q3 15 Q3 16
Elecr.&Appliances Other Services
28
36.1 38.2
1.6 1.62.4 3.740.2
43.5
Q3/15 Q3/16
Electr.& Appliances Other Services
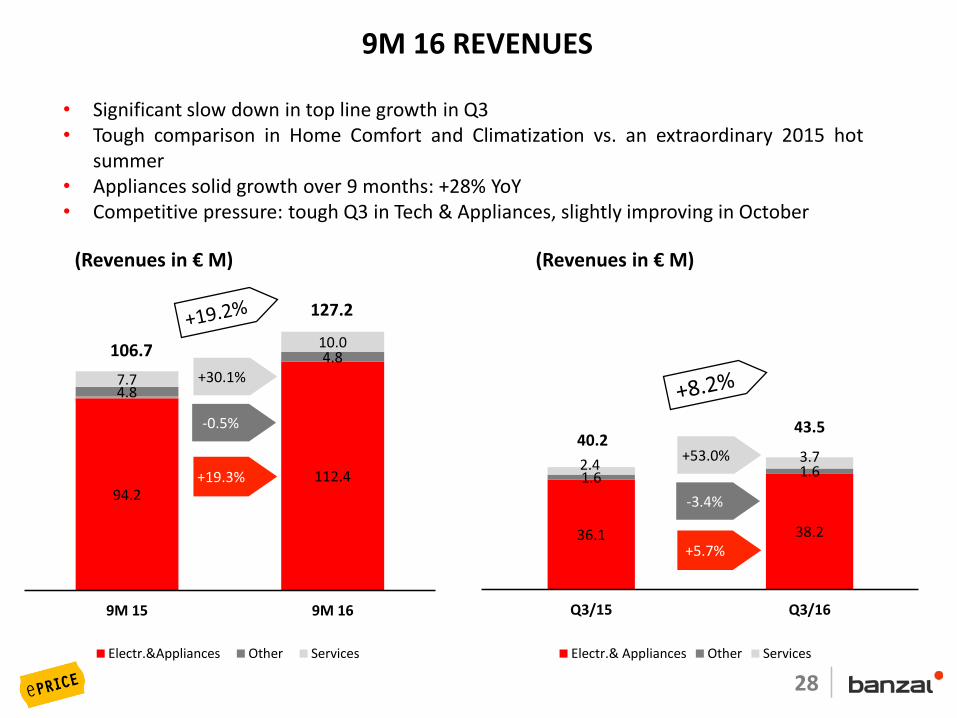
94.2112.4
4.8
4.8
7.7
10.0106.7
127.2
0.0
20.0
40.0
60.0
80.0
100.0
120.0
9M 15 9M 16
Electr.&Appliances Other Services
9M 16 REVENUES
(Revenues in € M)
+19.3%
-0.5%
• Significant slow down in top line growth in Q3• Tough comparison in Home Comfort and Climatization vs. an extraordinary 2015 hot
summer• Appliances solid growth over 9 months: +28% YoY• Competitive pressure: tough Q3 in Tech & Appliances, slightly improving in October
+30.1%
+5.7%
-3.4%
+53.0%
(Revenues in € M)
29
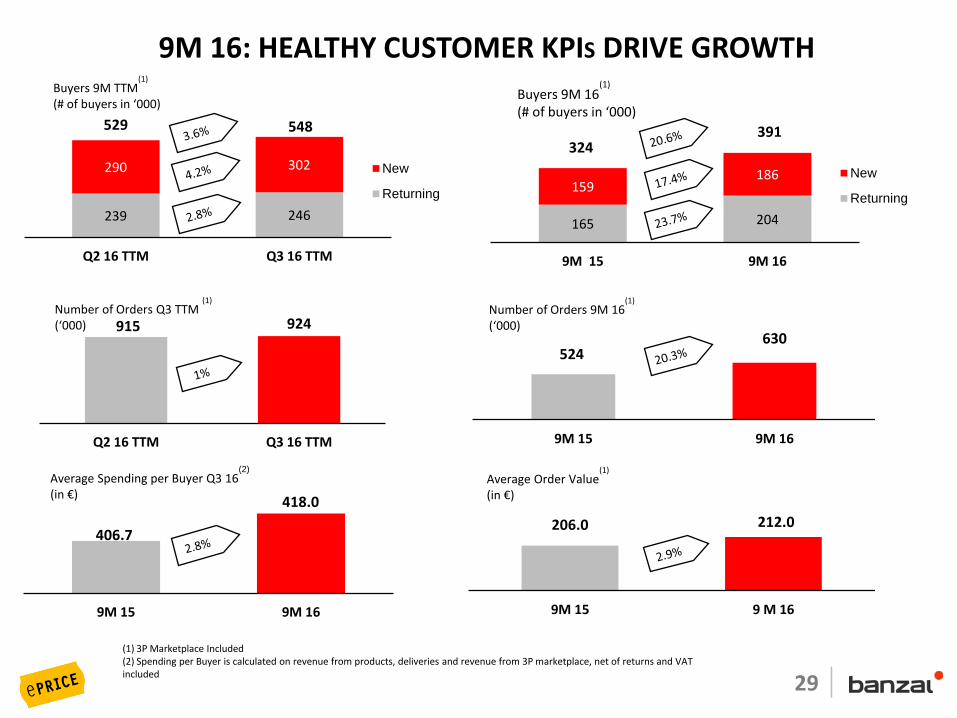
524630
9M 15 9M 16
915 924
Q2 16 TTM Q3 16 TTM
406.7
418.0
9M 15 9M 16
206.0 212.0
9M 15 9 M 16
Average Order Value(1)
(in €)
9M 16: HEALTHY CUSTOMER KPIS DRIVE GROWTH
(1) 3P Marketplace Included(2) Spending per Buyer is calculated on revenue from products, deliveries and revenue from 3P marketplace, net of returns and VAT included
Average Spending per Buyer Q3 16(2)
(in €)
Number of Orders Q3 TTM (1)
(‘000)
239 246
290 302
Q2 16 TTM Q3 16 TTM
New
Returning
529 548
Buyers 9M TTM(1)
(# of buyers in ‘000)
165 204
159186
9M 15 9M 16
New
Returning
324391
Buyers 9M 16(1)
(# of buyers in ‘000)
Number of Orders 9M 16(1)
(‘000)
March 2015 – Confidential 30
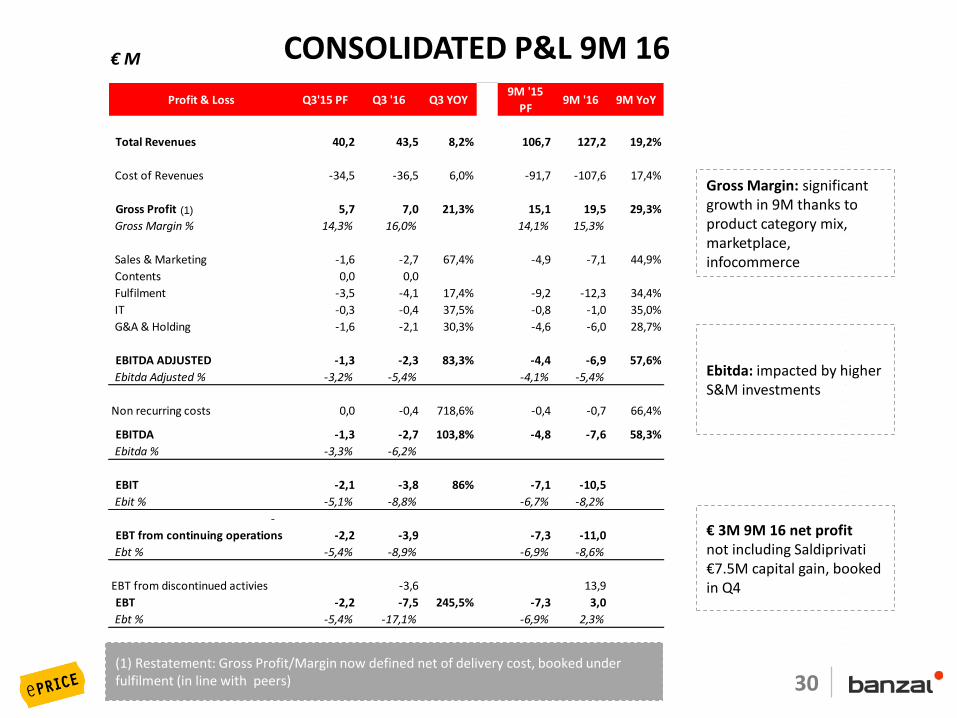
CONSOLIDATED P&L 9M 16€ M
Profit & Loss Q3'15 PF Q3 '16 Q3 YOY9M '15
PF9M '16 9M YoY
Total Revenues 40,2 43,5 8,2% 106,7 127,2 19,2%
Cost of Revenues -34,5 -36,5 6,0% -91,7 -107,6 17,4%
Gross Profit 5,7 7,0 21,3% 15,1 19,5 29,3%
Gross Margin % 14,3% 16,0% 14,1% 15,3%
Sales & Marketing -1,6 -2,7 67,4% -4,9 -7,1 44,9%
Contents 0,0 0,0
Fulfilment -3,5 -4,1 17,4% -9,2 -12,3 34,4%
IT -0,3 -0,4 37,5% -0,8 -1,0 35,0%
G&A & Holding -1,6 -2,1 30,3% -4,6 -6,0 28,7%
EBITDA ADJUSTED -1,3 -2,3 83,3% -4,4 -6,9 57,6%
Ebitda Adjusted % -3,2% -5,4% -4,1% -5,4%
Non recurring costs 0,0 -0,4 718,6% -0,4 -0,7 66,4%
EBITDA -1,3 -2,7 103,8% -4,8 -7,6 58,3%
Ebitda % -3,3% -6,2%
EBIT -2,1 -3,8 86% -7,1 -10,5
Ebit % -5,1% -8,8% -6,7% -8,2%
-
EBT from continuing operations -2,2 -3,9 -7,3 -11,0
Ebt % -5,4% -8,9% -6,9% -8,6%
EBT from discontinued activies -3,6 13,9
EBT -2,2 -7,5 245,5% -7,3 3,0
Ebt % -5,4% -17,1% -6,9% 2,3%
(1) Restatement: Gross Profit/Margin now defined net of delivery cost, booked under fulfilment (in line with peers)
Ebitda: impacted by higher S&M investments
€ 3M 9M 16 net profit not including Saldiprivati€7.5M capital gain, booked in Q4
Gross Margin: significant growth in 9M thanks to product category mix, marketplace, infocommerce
(1)
March 2015 – Confidential 31
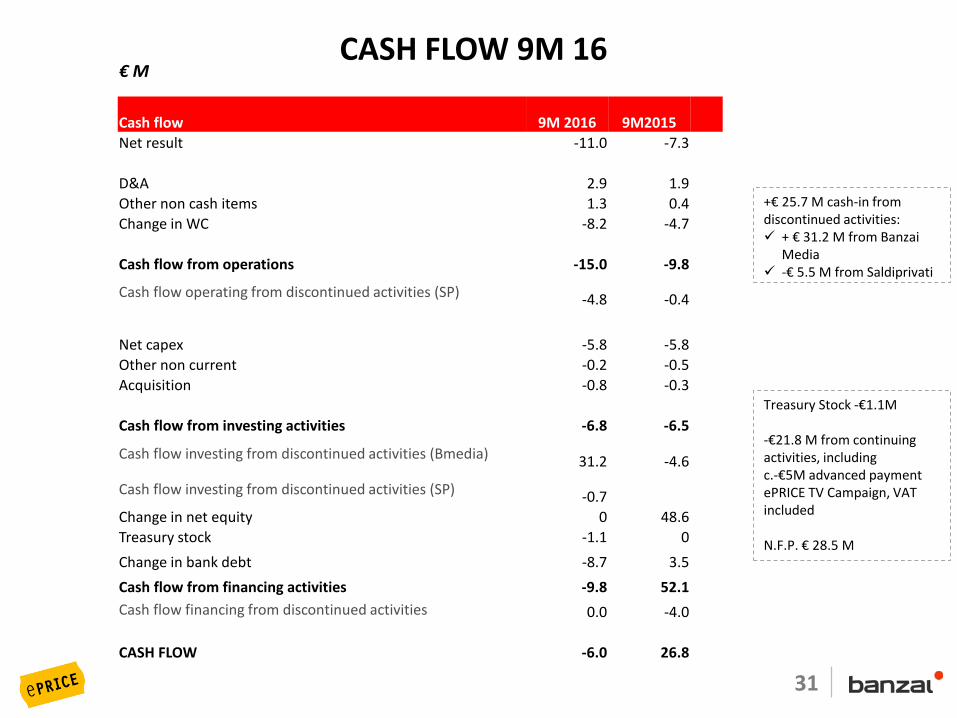
CASH FLOW 9M 16€ M
Cash flow 9M 2016 9M2015
Net result -11.0 -7.3
D&A 2.9 1.9
Other non cash items 1.3 0.4
Change in WC -8.2 -4.7
Cash flow from operations -15.0 -9.8
Cash flow operating from discontinued activities (SP) -4.8 -0.4
Net capex -5.8 -5.8
Other non current -0.2 -0.5
Acquisition -0.8 -0.3
Cash flow from investing activities -6.8 -6.5
Cash flow investing from discontinued activities (Bmedia) 31.2 -4.6
Cash flow investing from discontinued activities (SP) -0.7
Change in net equity 0 48.6
Treasury stock -1.1 0
Change in bank debt -8.7 3.5
Cash flow from financing activities -9.8 52.1
Cash flow financing from discontinued activities 0.0 -4.0
CASH FLOW -6.0 26.8
+€ 25.7 M cash-in from discontinued activities: + € 31.2 M from Banzai
Media -€ 5.5 M from Saldiprivati
Treasury Stock -€1.1M
-€21.8 M from continuing activities, including c.-€5M advanced payment ePRICE TV Campaign, VAT included
N.F.P. € 28.5 M
32
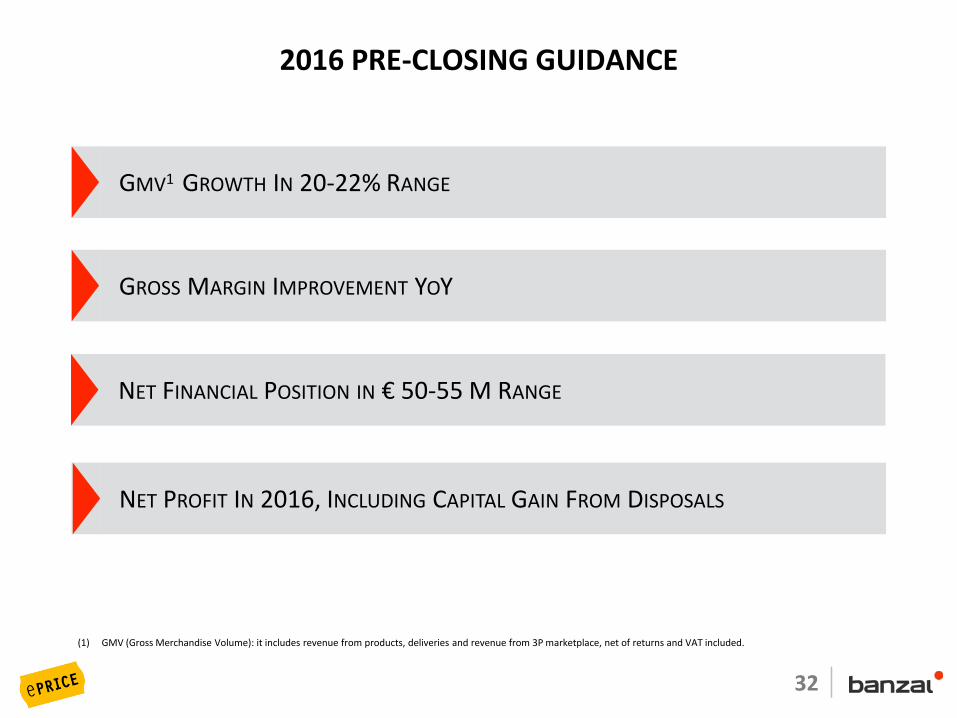
2016 PRE-CLOSING GUIDANCE
GMV1 GROWTH IN 20-22% RANGE
GROSS MARGIN IMPROVEMENT YOY
NET FINANCIAL POSITION IN € 50-55 M RANGE
(1) GMV (Gross Merchandise Volume): it includes revenue from products, deliveries and revenue from 3P marketplace, net of returns and VAT included.
NET PROFIT IN 2016, INCLUDING CAPITAL GAIN FROM DISPOSALS

33
PEER GROUP
March 2015 – Confidential 34
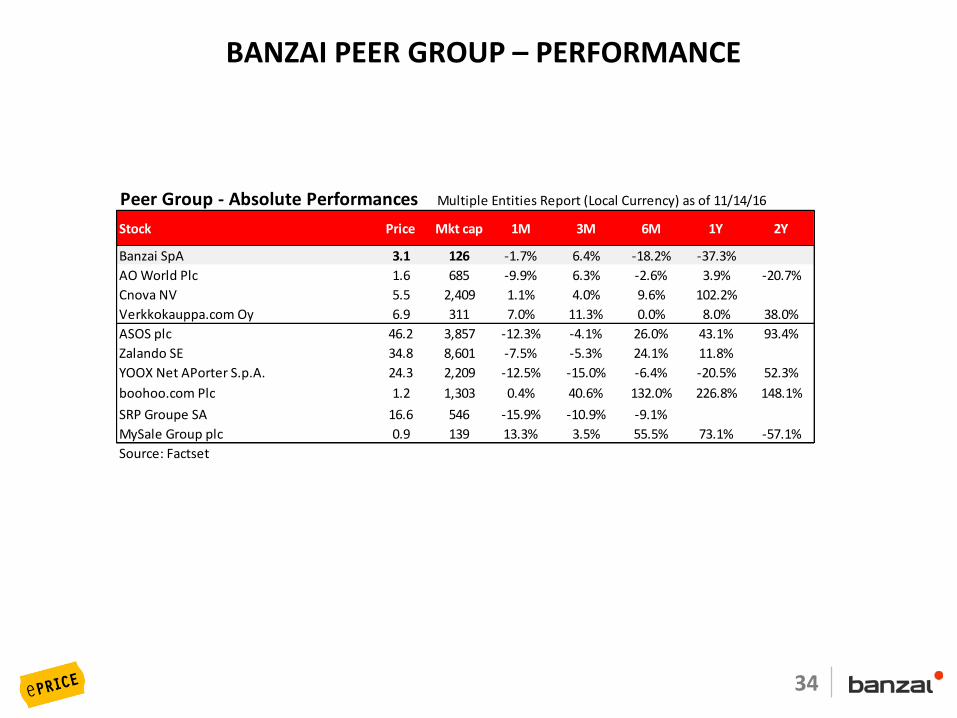
BANZAI PEER GROUP – PERFORMANCE
Peer Group - Absolute Performances Multiple Entities Report (Local Currency) as of 11/14/16
Stock Price Mkt cap 1M 3M 6M 1Y 2Y
Banzai SpA 3.1 126 -1.7% 6.4% -18.2% -37.3%
AO World Plc 1.6 685 -9.9% 6.3% -2.6% 3.9% -20.7%
Cnova NV 5.5 2,409 1.1% 4.0% 9.6% 102.2%
Verkkokauppa.com Oy 6.9 311 7.0% 11.3% 0.0% 8.0% 38.0%
ASOS plc 46.2 3,857 -12.3% -4.1% 26.0% 43.1% 93.4%
Zalando SE 34.8 8,601 -7.5% -5.3% 24.1% 11.8%
YOOX Net APorter S.p.A. 24.3 2,209 -12.5% -15.0% -6.4% -20.5% 52.3%
boohoo.com Plc 1.2 1,303 0.4% 40.6% 132.0% 226.8% 148.1%
SRP Groupe SA 16.6 546 -15.9% -10.9% -9.1%
MySale Group plc 0.9 139 13.3% 3.5% 55.5% 73.1% -57.1%
Source: Factset
March 2015 – Confidential 35
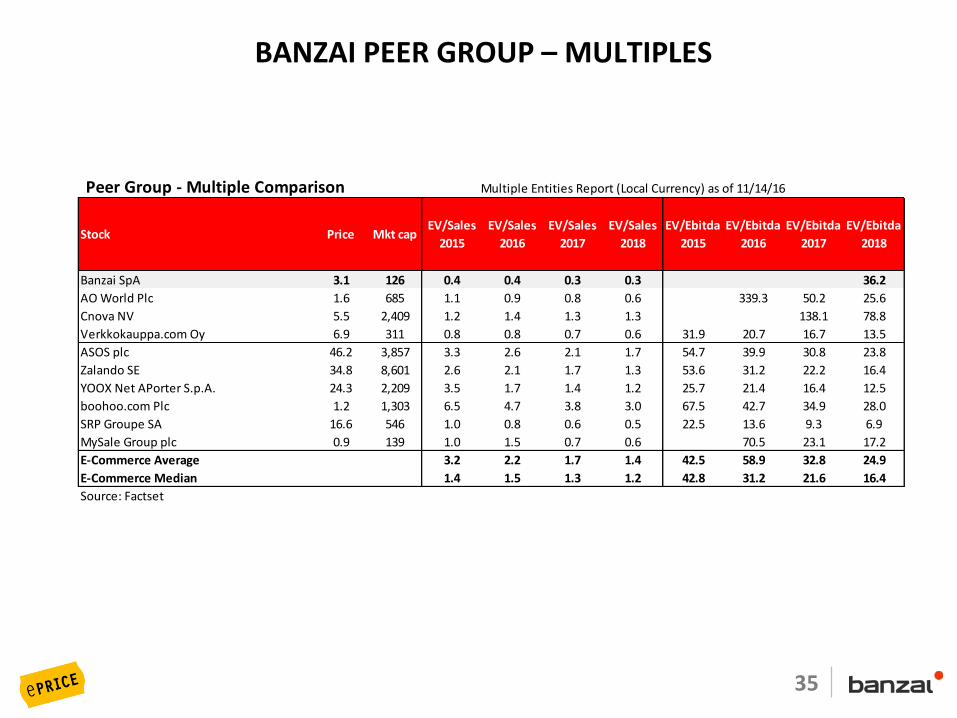
BANZAI PEER GROUP – MULTIPLES
Peer Group - Multiple Comparison Multiple Entities Report (Local Currency) as of 11/14/16
Stock Price Mkt capEV/Sales
2015
EV/Sales
2016
EV/Sales
2017
EV/Sales
2018
EV/Ebitda
2015
EV/Ebitda
2016
EV/Ebitda
2017
EV/Ebitda
2018
Banzai SpA 3.1 126 0.4 0.4 0.3 0.3 36.2
AO World Plc 1.6 685 1.1 0.9 0.8 0.6 339.3 50.2 25.6
Cnova NV 5.5 2,409 1.2 1.4 1.3 1.3 138.1 78.8
Verkkokauppa.com Oy 6.9 311 0.8 0.8 0.7 0.6 31.9 20.7 16.7 13.5
ASOS plc 46.2 3,857 3.3 2.6 2.1 1.7 54.7 39.9 30.8 23.8
Zalando SE 34.8 8,601 2.6 2.1 1.7 1.3 53.6 31.2 22.2 16.4
YOOX Net APorter S.p.A. 24.3 2,209 3.5 1.7 1.4 1.2 25.7 21.4 16.4 12.5
boohoo.com Plc 1.2 1,303 6.5 4.7 3.8 3.0 67.5 42.7 34.9 28.0
SRP Groupe SA 16.6 546 1.0 0.8 0.6 0.5 22.5 13.6 9.3 6.9
MySale Group plc 0.9 139 1.0 1.5 0.7 0.6 70.5 23.1 17.2
E-Commerce Average 3.2 2.2 1.7 1.4 42.5 58.9 32.8 24.9
E-Commerce Median 1.4 1.5 1.3 1.2 42.8 31.2 21.6 16.4
Source: Factset

36
BACK-UP
37
DEFINITIONS
• GMV: Gross Merchandise Volume, it includes revenue from products, deliveriesand revenue from 3P marketplace, net of returns and VAT included. Infocommerceand Advertising and B2B revenues not included.
• Net Promoter Score: is a management tool that can be used to gauge the loyalty of a firm's customer relationships
• TTM GMV/Revenues: Trailing/Last Twelve Months Results
• Gross Margin: since 30.9.2016 Gross Profit/Margin has been restated and is now net of delivery cost, booked under fulfilment (in line with peers)
• Fulfilment Transport Cost: delivery cost (courier, premium)
• Fulfilment Internal Cost: all other fulfilment
• G&A: also includes costs previously booked as “holding”
March 2015 – Confidential 38
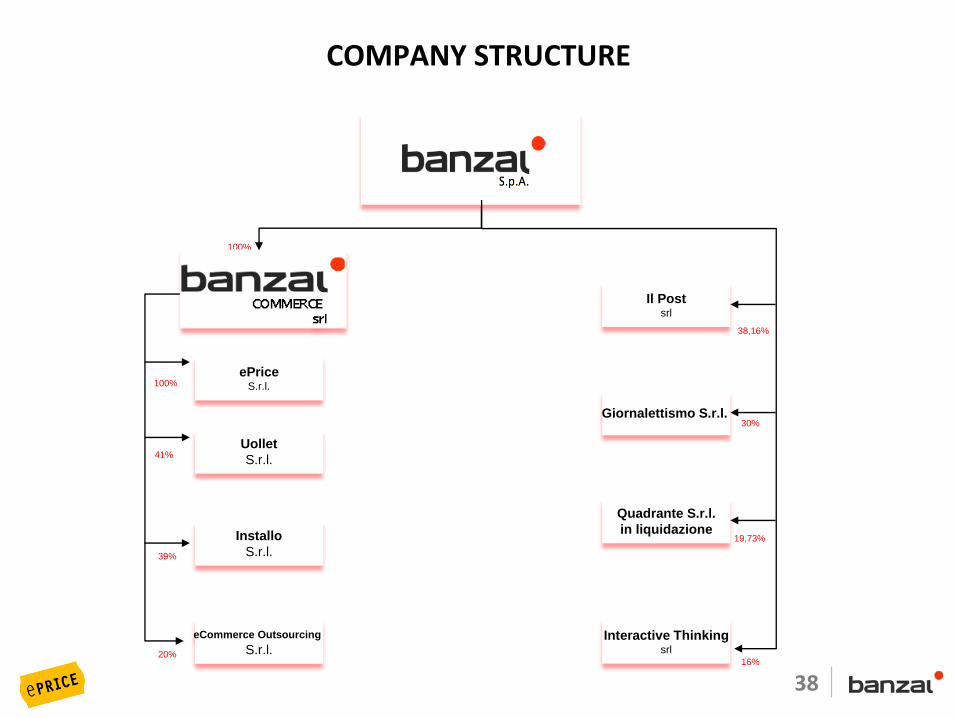
COMPANY STRUCTURE
41%
100%
100%
39%
Il Postsrl
38,16%
20%
Giornalettismo S.r.l.
Quadrante S.r.l.
in liquidazione19,73%
16%
Uollet
S.r.l.
ePriceS.r.l.
Installo
S.r.l.
eCommerce Outsourcing
S.r.l.Interactive Thinking
srl
30%
March 2015 – Confidential 39
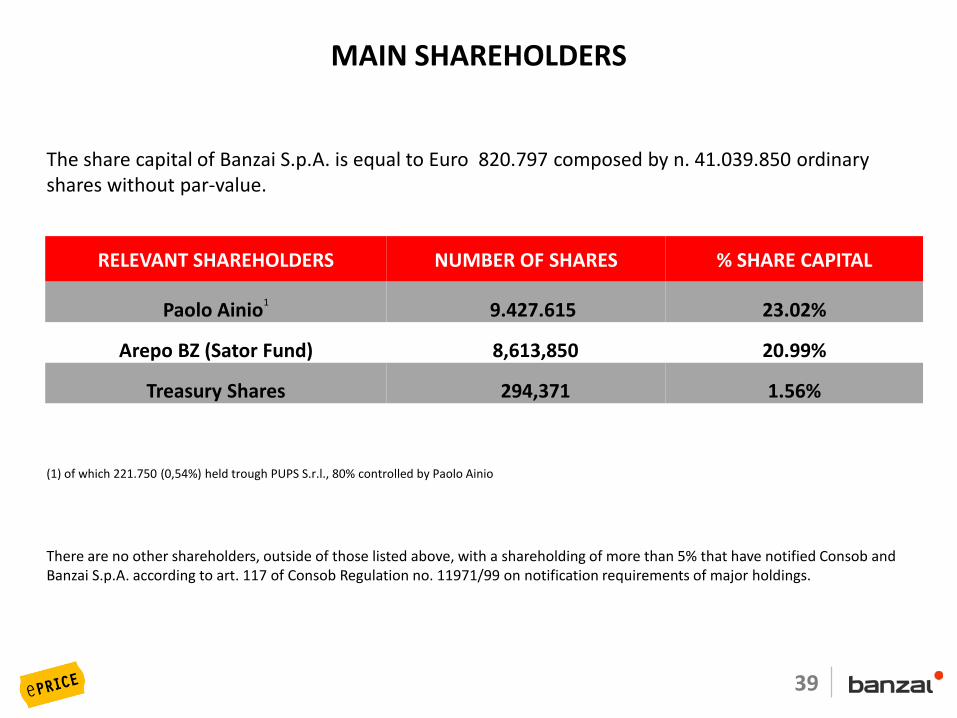
The share capital of Banzai S.p.A. is equal to Euro 820.797 composed by n. 41.039.850 ordinaryshares without par-value.
RELEVANT SHAREHOLDERS NUMBER OF SHARES % SHARE CAPITAL
Paolo Ainio1
9.427.615 23.02%
Arepo BZ (Sator Fund) 8,613,850 20.99%
Treasury Shares 294,371 1.56%
(1) of which 221.750 (0,54%) held trough PUPS S.r.l., 80% controlled by Paolo Ainio
There are no other shareholders, outside of those listed above, with a shareholding of more than 5% that have notified Consob and Banzai S.p.A. according to art. 117 of Consob Regulation no. 11971/99 on notification requirements of major holdings.
MAIN SHAREHOLDERS
40
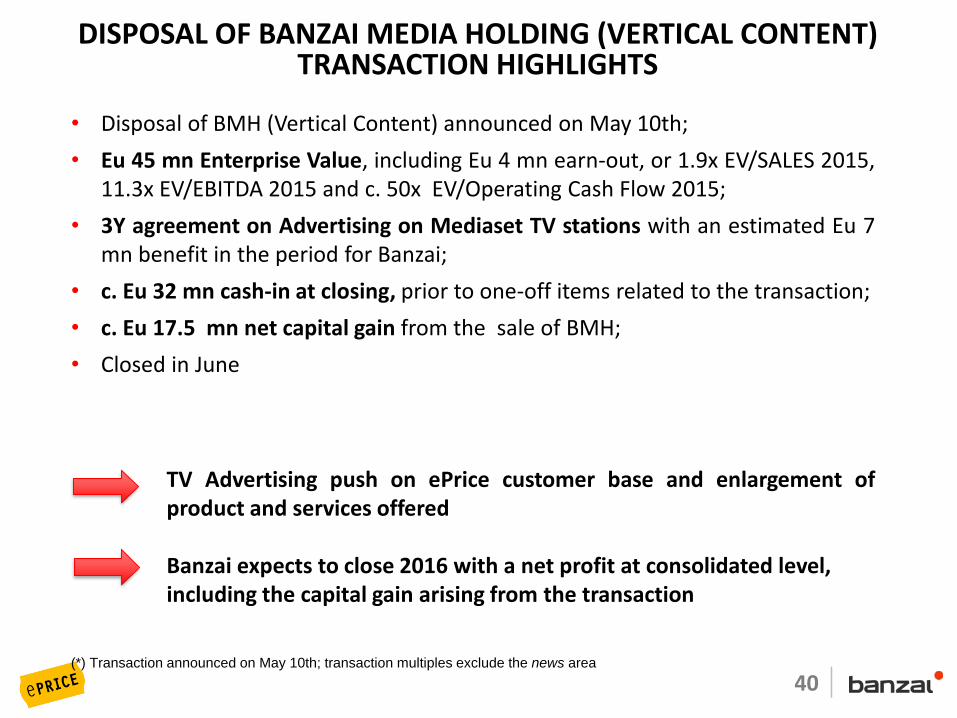
DISPOSAL OF BANZAI MEDIA HOLDING (VERTICAL CONTENT)TRANSACTION HIGHLIGHTS
• Disposal of BMH (Vertical Content) announced on May 10th;
• Eu 45 mn Enterprise Value, including Eu 4 mn earn-out, or 1.9x EV/SALES 2015,11.3x EV/EBITDA 2015 and c. 50x EV/Operating Cash Flow 2015;
• 3Y agreement on Advertising on Mediaset TV stations with an estimated Eu 7mn benefit in the period for Banzai;
• c. Eu 32 mn cash-in at closing, prior to one-off items related to the transaction;
• c. Eu 17.5 mn net capital gain from the sale of BMH;
• Closed in June
TV Advertising push on ePrice customer base and enlargement ofproduct and services offered
Banzai expects to close 2016 with a net profit at consolidated level,including the capital gain arising from the transaction
(*) Transaction announced on May 10th; transaction multiples exclude the news area
March 2015 – Confidential 41
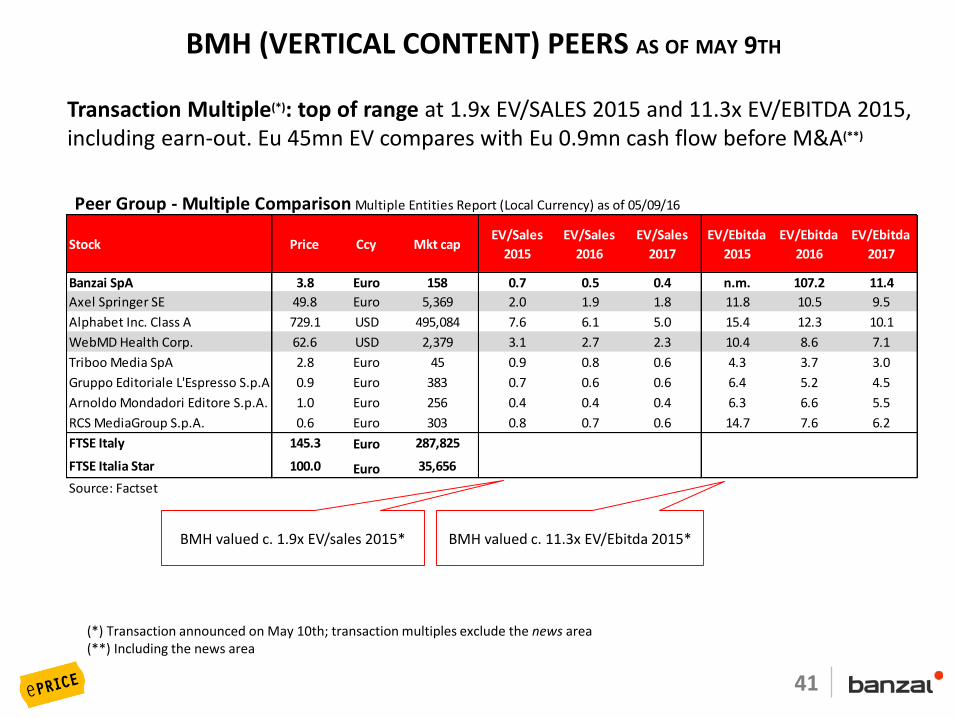
Peer Group - Multiple Comparison Multiple Entities Report (Local Currency) as of 05/09/16
Stock Price Ccy Mkt capEV/Sales
2015
EV/Sales
2016
EV/Sales
2017
EV/Ebitda
2015
EV/Ebitda
2016
EV/Ebitda
2017
Banzai SpA 3.8 Euro 158 0.7 0.5 0.4 n.m. 107.2 11.4
Axel Springer SE 49.8 Euro 5,369 2.0 1.9 1.8 11.8 10.5 9.5
Alphabet Inc. Class A 729.1 USD 495,084 7.6 6.1 5.0 15.4 12.3 10.1
WebMD Health Corp. 62.6 USD 2,379 3.1 2.7 2.3 10.4 8.6 7.1
Triboo Media SpA 2.8 Euro 45 0.9 0.8 0.6 4.3 3.7 3.0
Gruppo Editoriale L'Espresso S.p.A. 0.9 Euro 383 0.7 0.6 0.6 6.4 5.2 4.5
Arnoldo Mondadori Editore S.p.A. 1.0 Euro 256 0.4 0.4 0.4 6.3 6.6 5.5
RCS MediaGroup S.p.A. 0.6 Euro 303 0.8 0.7 0.6 14.7 7.6 6.2
FTSE Italy 145.3 Euro 287,825
FTSE Italia Star 100.0 Euro 35,656
Source: Factset
BMH (VERTICAL CONTENT) PEERS AS OF MAY 9TH
BMH valued c. 1.9x EV/sales 2015* BMH valued c. 11.3x EV/Ebitda 2015*
(*) Transaction announced on May 10th; transaction multiples exclude the news area(**) Including the news area
Transaction Multiple(*): top of range at 1.9x EV/SALES 2015 and 11.3x EV/EBITDA 2015,including earn-out. Eu 45mn EV compares with Eu 0.9mn cash flow before M&A(**)
42
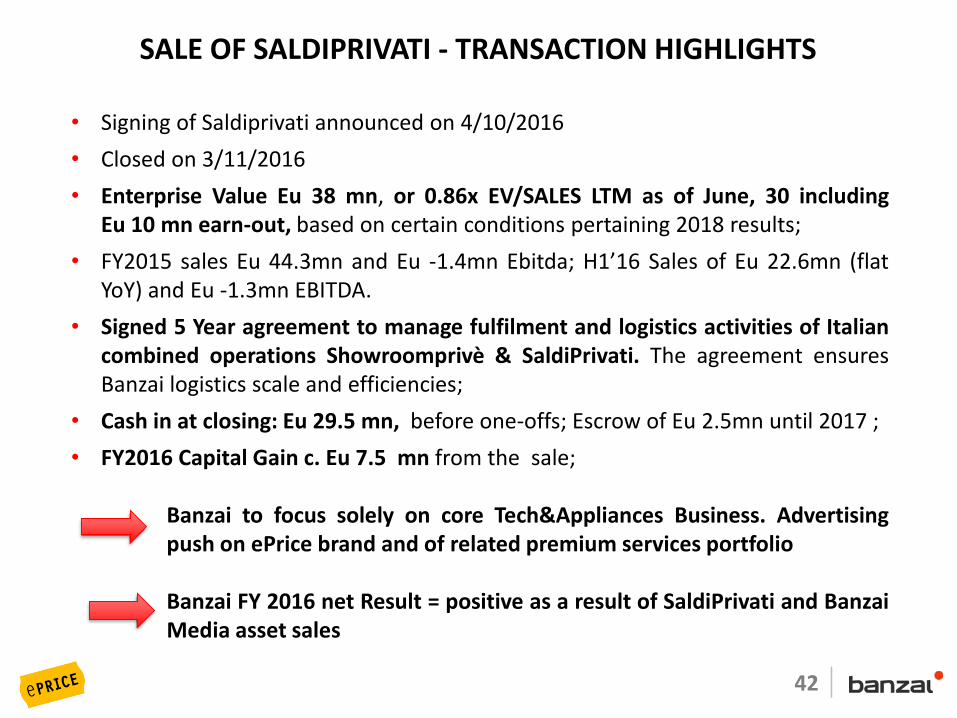
SALE OF SALDIPRIVATI - TRANSACTION HIGHLIGHTS
• Signing of Saldiprivati announced on 4/10/2016
• Closed on 3/11/2016
• Enterprise Value Eu 38 mn, or 0.86x EV/SALES LTM as of June, 30 includingEu 10 mn earn-out, based on certain conditions pertaining 2018 results;
• FY2015 sales Eu 44.3mn and Eu -1.4mn Ebitda; H1’16 Sales of Eu 22.6mn (flatYoY) and Eu -1.3mn EBITDA.
• Signed 5 Year agreement to manage fulfilment and logistics activities of Italiancombined operations Showroomprivè & SaldiPrivati. The agreement ensuresBanzai logistics scale and efficiencies;
• Cash in at closing: Eu 29.5 mn, before one-offs; Escrow of Eu 2.5mn until 2017 ;
• FY2016 Capital Gain c. Eu 7.5 mn from the sale;
Banzai to focus solely on core Tech&Appliances Business. Advertisingpush on ePrice brand and of related premium services portfolio
Banzai FY 2016 net Result = positive as a result of SaldiPrivati and BanzaiMedia asset sales
March 2015 – Confidential 43
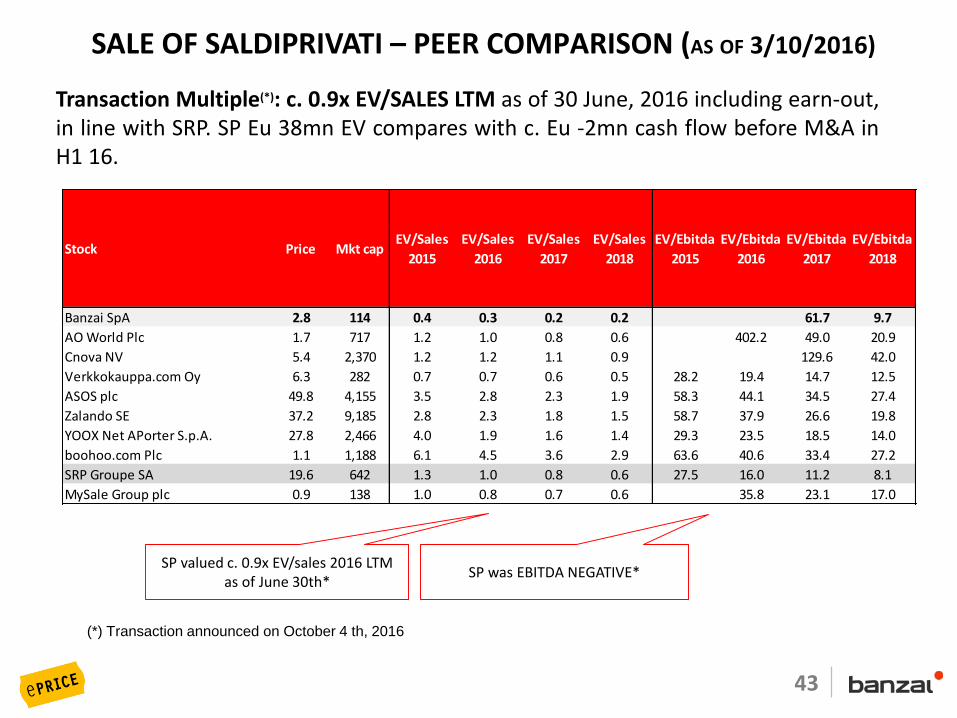
SALE OF SALDIPRIVATI – PEER COMPARISON (AS OF 3/10/2016)
SP valued c. 0.9x EV/sales 2016 LTM as of June 30th*
SP was EBITDA NEGATIVE*
(*) Transaction announced on October 4 th, 2016
Transaction Multiple(*): c. 0.9x EV/SALES LTM as of 30 June, 2016 including earn-out,in line with SRP. SP Eu 38mn EV compares with c. Eu -2mn cash flow before M&A inH1 16.
Stock Price Mkt capEV/Sales
2015
EV/Sales
2016
EV/Sales
2017
EV/Sales
2018
EV/Ebitda
2015
EV/Ebitda
2016
EV/Ebitda
2017
EV/Ebitda
2018
Banzai SpA 2.8 114 0.4 0.3 0.2 0.2 61.7 9.7
AO World Plc 1.7 717 1.2 1.0 0.8 0.6 402.2 49.0 20.9
Cnova NV 5.4 2,370 1.2 1.2 1.1 0.9 129.6 42.0
Verkkokauppa.com Oy 6.3 282 0.7 0.7 0.6 0.5 28.2 19.4 14.7 12.5
ASOS plc 49.8 4,155 3.5 2.8 2.3 1.9 58.3 44.1 34.5 27.4
Zalando SE 37.2 9,185 2.8 2.3 1.8 1.5 58.7 37.9 26.6 19.8
YOOX Net APorter S.p.A. 27.8 2,466 4.0 1.9 1.6 1.4 29.3 23.5 18.5 14.0
boohoo.com Plc 1.1 1,188 6.1 4.5 3.6 2.9 63.6 40.6 33.4 27.2
SRP Groupe SA 19.6 642 1.3 1.0 0.8 0.6 27.5 16.0 11.2 8.1
MySale Group plc 0.9 138 1.0 0.8 0.7 0.6 35.8 23.1 17.0