Embed Size (px)
Citation preview
gva.co.uk
Report Report
GVA 81 Fountain Street Manchester M2 2EE
Strategic Housing Market Needs Assessment (SHMNA) Appendix 4 – South Hams SHMNA Overview Report October 2013
Report

South Hams, Plymouth, Cornwall, West Devon & Dartmoor NP SHMNA Appendix 4 – South Hams Overview Report
October 2013 I gva.co.uk
Contents
Executive Summary ............................................................................................................. 1
1. Introduction to the South Hams SHMNA Overview Report .................................. 6
2. The Current Housing Market ................................................................................ 10
3. The Future Housing Market ................................................................................... 49
4. Conclusion – Bringing the Evidence Together ................................................... 67
Prepared By . Paul McColgan ............... Status. Senior Consultant .. Date October 2013 ................. and ....................... Helen Clarkson ................ Status. Graduate Planner. Date October 2012 Reviewed By Nicola Rigby ................... Status . Associate ............... Date October 2013 ................. For and on behalf of GVA Grimley Ltd
South Hams, Plymouth, Cornwall, West Devon & Dartmoor NP SHMNA Appendix 4 – South Hams Overview Report
October 2013 I gva.co.uk 1
Executive Summary
This Executive Summary is intended to be read in conjunction with the remainder of this
Overview Report and the Strategic Housing Market Needs Assessment (SHMNA) Main Report.
This evidence base has been developed to support the development of the preparation of a
new Local Plan with West Devon. Initial public consultation on the new Local Plan is currently
scheduled for Winter 2013/14.
In presenting the findings, the Executive Summary is structured around four separate themes
which reflect the requirements of the NPPF and are intended to provide a clear read-across
to future published policy and strategy.
The study has included the analysis of a range of datasets, including travel to work, house
price, household characteristic, income and migration, to assess the market linkages within
and between the Plymouth, Cornwall, South Hams, West Devon and Dartmoor National Park
sub-regional area.
This analysis has looked at both strategic market geographies and local market geographies.
The former represents an important consideration in the development of policies which align
with the ethos of the NPPF, which encourages strategic planning across local boundaries.
This Executive Summary uses a similar structure to the Main SHMNA Report with the analysis
presented under two sections:
The Current Housing Market
The Future Housing Market
South Hams District has 6 distinct sub-market areas, which are based on the main towns and
surrounding rural areas which relate to them. The Dartmoor Fringe sub-market area lies within
the Dartmoor National Park and there is a recognised importance to disaggregate the
Dartmoor National Park from the remainder of the authority, particularly in relation to the
separate role of the National Park authority.
South Hams, Plymouth, Cornwall, West Devon & Dartmoor NP SHMNA Appendix 4 – South Hams Overview Report
October 2013 I gva.co.uk 2
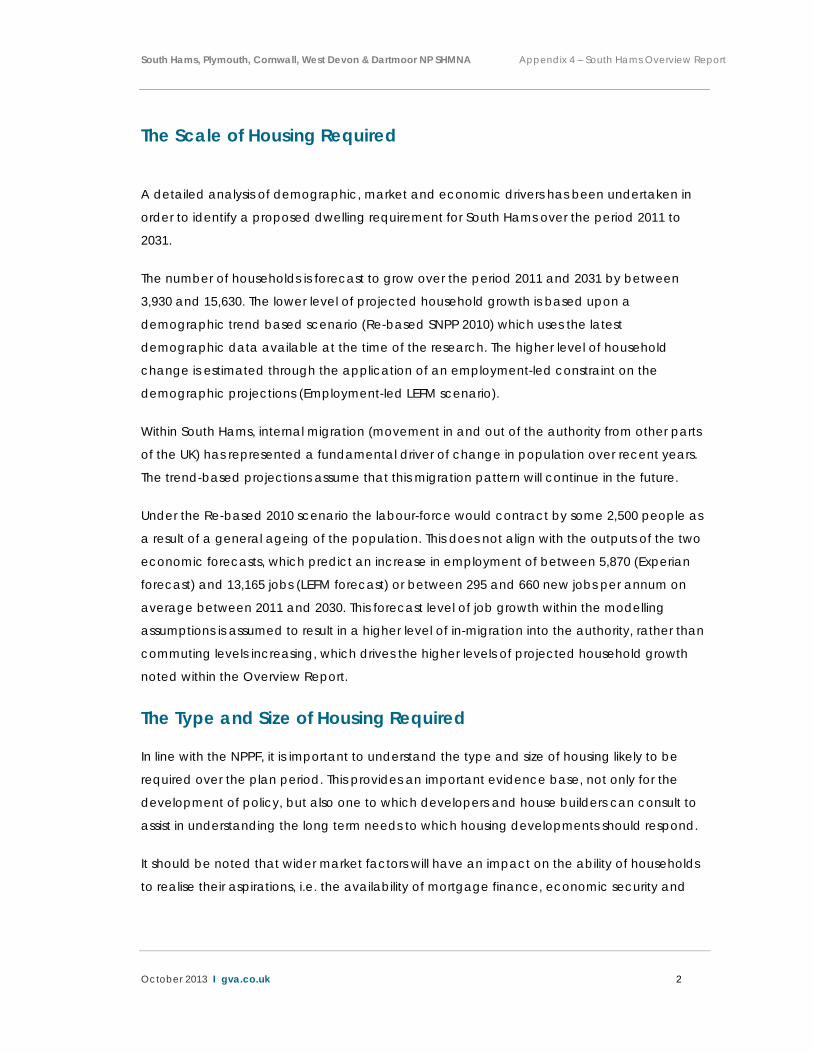
The Scale of Housing Required
A detailed analysis of demographic, market and economic drivers has been undertaken in
order to identify a proposed dwelling requirement for South Hams over the period 2011 to
2031.
The number of households is forecast to grow over the period 2011 and 2031 by between
3,930 and 15,630. The lower level of projected household growth is based upon a
demographic trend based scenario (Re-based SNPP 2010) which uses the latest
demographic data available at the time of the research. The higher level of household
change is estimated through the application of an employment-led constraint on the
demographic projections (Employment-led LEFM scenario).
Within South Hams, internal migration (movement in and out of the authority from other parts
of the UK) has represented a fundamental driver of change in population over recent years.
The trend-based projections assume that this migration pattern will continue in the future.
Under the Re-based 2010 scenario the labour-force would contract by some 2,500 people as
a result of a general ageing of the population. This does not align with the outputs of the two
economic forecasts, which predict an increase in employment of between 5,870 (Experian
forecast) and 13,165 jobs (LEFM forecast) or between 295 and 660 new jobs per annum on
average between 2011 and 2030. This forecast level of job growth within the modelling
assumptions is assumed to result in a higher level of in-migration into the authority, rather than
commuting levels increasing, which drives the higher levels of projected household growth
noted within the Overview Report.
The Type and Size of Housing Required
In line with the NPPF, it is important to understand the type and size of housing likely to be
required over the plan period. This provides an important evidence base, not only for the
development of policy, but also one to which developers and house builders can consult to
assist in understanding the long term needs to which housing developments should respond.
It should be noted that wider market factors will have an impact on the ability of households
to realise their aspirations, i.e. the availability of mortgage finance, economic security and
South Hams, Plymouth, Cornwall, West Devon & Dartmoor NP SHMNA Appendix 4 – South Hams Overview Report
October 2013 I gva.co.uk 3
wider changes to linked financial factors, such as the cost of energy and Council Tax
variations.
Whilst the uncertainties around these factors highlights the importance of allowing a degree
of flexibility in the housing market, in terms of the mix of housing required, it is important to
consider the implications of the long-term projections in a strategic sense, in particular set
against the current stock profile. The following are therefore important considerations:
The types of household are projected to change, with the ageing population noted as one
influencing factor. Primarily, the projections show a notable uplift in single person and couple
households with this driven in significant part by the increasing number of older person
households.
The analysis suggests that there may be a high demand for smaller properties suitable for
meeting the needs of older person households within the authority. Under the Employment-
led scenario the growth in family households, aged 35 – 44 in particular is relatively significant,
suggested a sustained demand under this scenario for traditional family housing (3 and 4
bedroom), recognising that moderate and larger properties represent the aspirations for
many households of different ages.
Households in Housing Need
The analysis has also included an assessment of the breakdown of future needs for different
tenures of housing. The emphasis within the DCLG Guidance is on understanding these tenure
requirements over a shorter time frame of 5 years.
There is a recognition that the balance of tenures across the authority has not to date fully
met the housing needs of households. The market position summarised in the South Hams
Current Market section highlighted the affordability issues facing many households, in
particular newly forming households.
The analysis of the current need for affordable housing in the authority over the next five years indicates a high demand for this tenure. An annual need of 242 affordable properties is calculated as being required to meet the future needs over the next five years and the existing backlog (with 22 of these required within the Dartmoor Fringe sub-market in the Dartmoor National Park). This reflects the
South Hams, Plymouth, Cornwall, West Devon & Dartmoor NP SHMNA Appendix 4 – South Hams Overview Report
October 2013 I gva.co.uk 4
impact of rising house prices over the first half of the last decade and the continued pressures on wages as well as the availability of mortgage finance. It also reflects the fact that affordable housing makes up a relatively low proportion of the overall stock in South Hams currently, approximately 11%, a proportion which is considerably below the national average of 17%.
Overall the number of older persons is projected to increase significantly, indeed the projections suggest that those aged over 75 will make up approximately between 14% and 17% of the total population by 2031 (depending on the scenario considered) compared to just over 11% now.
In addition to older person households, the projections also indicate that in order to maintain a level of working age population to match employment opportunities that there will be a sustained need for family housing within the authority.
Specifically in terms of affordable housing the analysis indicates that there will be a high demand for smaller properties, 1 – 2 bed, with need for this size of property making up 78% of total need (in the sub-markets excluding the Dartmoor National Park). Importantly, however, the lower levels of turnover in larger properties also suggests that in order to address future need and the current backlog new larger affordable properties will also be required.
The impact of current housing market conditions
The following recommendations need to be considered in the setting of policy:
Reduction in the availability of grant monies to aid in the delivery of affordable housing places greater pressure on delivering affordable housing tenures through traditional Planning Obligation approaches. This requires a pro-active and responsive approach to enabling more viable housing sites to come forward earlier in the plan period. A pro-active approach in encouraging the delivery of more viable housing sites will be important in addressing the wider demand for all tenures of housing and assist in ensuring that the ability of households to purchase housing is not further worsened through a continued lack of supply, which is likely to continue to drive up house prices.
A careful balance is required in terms of other competing requirements through Planning Obligations if the delivery of affordable housing is to be prioritised. This includes the future setting of CIL targets and the balancing of aspirations to deliver other linked improvements for example green space or off-site community benefits.

South Hams, Plymouth, Cornwall, West Devon & Dartmoor NP SHMNA Appendix 4 – South Hams Overview Report
October 2013 I gva.co.uk 5
The recognition that the needs of households will need to be met through a spectrum of different affordable housing products. The SHMNA analysis has indicated that whilst a notable proportion of households in need will require social housing other affordable products including Intermediate tenure properties will be able to address the needs of some households and should therefore form part of any new provision delivered across South Hams.
South Hams, Plymouth, Cornwall, West Devon & Dartmoor NP SHMNA Appendix 4 – South Hams Overview Report
October 2013 I gva.co.uk 6
Introduction to the South Hams SHMNA Overview Report This appendix document should be read in conjunction with the Strategic Housing Market Needs Assessment (SHMNA) Main Report. It should be noted that this is an evidence based report and does not constitute policy.
The Main SHMNA Report presents the analysis and results for each of the five study area authorities and should be used as the principal document to inform the development of policy and strategy. The analysis presented within this Appendix document serves to complement the Main SHMNA Report providing additional analysis at a sub-market level against a number of core outputs. The definition and rationale for the sub-markets used within this Overview Report are included at the end of this section. The full details of the modelling and research methodologies used to arrive at the conclusions presented within this Overview Report are documented in full within the Main SHMNA Report.
This Overview Report uses a similar structure to the Main SHMNA Report with the analysis presented under two sections:
Section 2: The Current Housing Market
Section 3: The Future Housing Market
Within this structure the findings are presented under the headings of the Core Outputs as set out within the DCLG SHMA Guidance (August 2007).
This Overview Report does not include a separate detailed analysis of the housing requirements of specific groups. The analysis within the Future Housing Market section provides analysis of the different types and ages of households which complements the analysis presented in section 8 of the main SHMNA Report.
This Overview Report concludes with a ‘Bringing the Evidence Together’ section. This draws together the conclusions for the local authority and incorporates a section examining the implications for future policy and strategy development.
Introducing South Hams
The South Hams is a predominantly rural district located on the south coast of Devon. The South Hams is characterised by market towns and their rural hinterlands. Approximately a third of the population lives in the districts four main towns. Elsewhere there is a fragmented

South Hams, Plymouth, Cornwall, West Devon & Dartmoor NP SHMNA Appendix 4 – South Hams Overview Report
October 2013 I gva.co.uk 7
settlement pattern comprising many villages, hamlets and more isolated farmsteads and dwellings.
The South Hams is renowned for its beautiful, varied and distinctive environment, which is one of its principal assets. About one third of the district is nationally designated as an Area of Outstanding Natural Beauty and the northern part of the district lies within the Dartmoor National Park (where the Park Authority is responsible for planning matters).
The South Hams has a mixed economy in which service and manufacturing industries and tourism all play a significant part, but agriculture is in decline. There is over-dependence, especially in the rural areas, on low income employment sectors. The A38 corridor and Totnes are a focus for demand for employment sites and premises.
The Policy Context
South Hams District Council adopted its Core Strategy document in 2006. The Core Strategy sets out the key elements of the planning framework for the district, and sets out the long-term spatial vision for South Hams and the strategic policies to deliver that vision.
The Core Strategy excludes the area that lies within the Dartmoor National Park, which is included within the Dartmoor National Park Local Development Framework (LDF).
The Core Strategy sets out a housing target for South Hams to deliver 6,000 new homes by 2016.
The Local Authority is currently in the early stages of preparing a new Local Plan which will be undertaken jointly with West Devon. The intention is for this new Local Plan to refresh the vision and strategy for the area and create policies fit for the future. It will:
Make provision for new homes, jobs and community facilities.
Consider what types of development constitute sustainable development and how this can be achieved.
Contain policies for how we manage all types of development.
Initial public consultation on the new Local Plan is currently scheduled for Winter 2013/14.
South Hams, Plymouth, Cornwall, West Devon & Dartmoor NP SHMNA Appendix 4 – South Hams Overview Report
October 2013 I gva.co.uk 8
South Hams – Sub-market Geographies
Introducing the Sub-markets
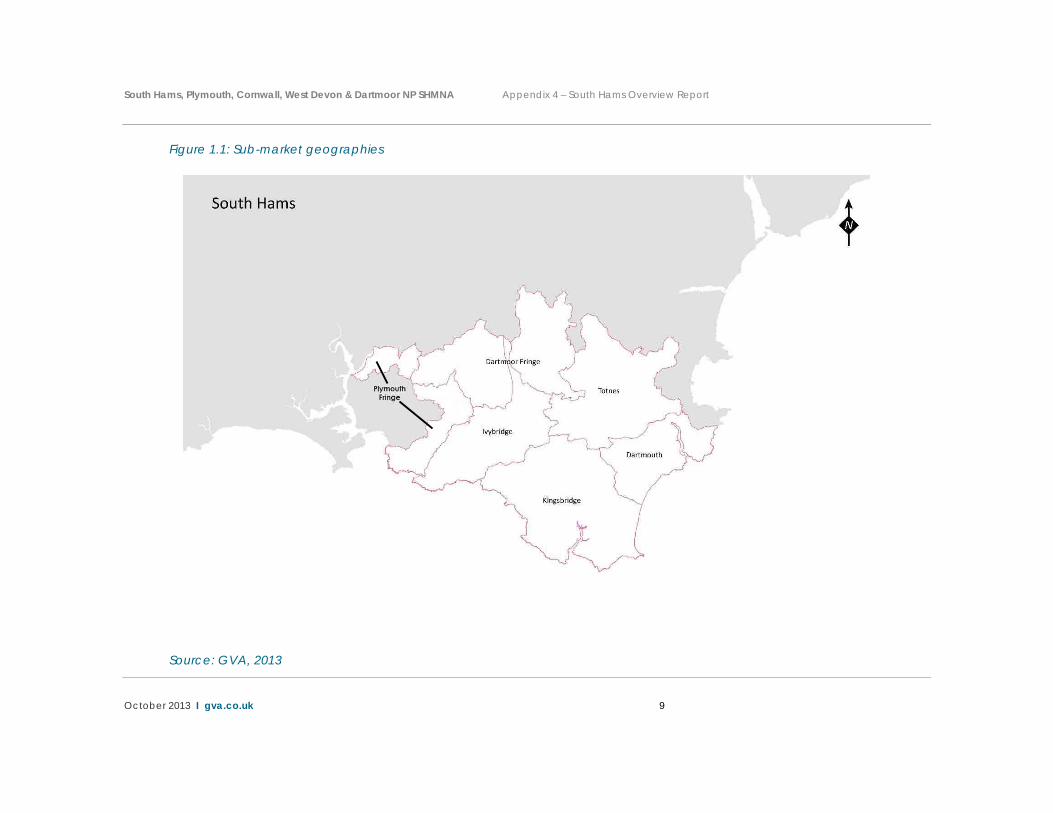
South Hams District Council has sub-divided the housing market within the authority into 6 sub-market areas (sub-markets), which are built up from parishes, and are based on the main towns and surrounding rural areas which relate to them, as well as the functional relationship with the city of Plymouth in the west of the district.
The 6 sub-markets areas are:
Dartmoor Fringe
Dartmouth
Ivybridge
Kingsbridge
Plymouth Fringe
Totnes
Importantly, the Dartmoor Fringe sub-market lies within the Dartmoor National Park1. The ability to disaggregate the Dartmoor National Park is important. For, consideration of planning matters within this area falls within the remit of the Dartmoor National Park Authority.
The sub-market areas have been used within the SHMNA to provide a greater understanding of the operation of the South Hams housing market below the local authority scale. The sub-market areas are presented spatially in Figure 1.1 overleaf.
1 This is a ‘best fit’ approach utilising Parish boundaries.
South Hams, Plymouth, Cornwall, West Devon & Dartmoor NP SHMNA Appendix 4 – South Hams Overview Report
October 2013 I gva.co.uk 9
Figure 1.1: Sub-market geographies
Source: GVA, 2013
South Hams, Plymouth, Cornwall, West Devon & Dartmoor NP SHMNA Appendix 4 – South Hams Overview Report
October 2013 I gva.co.uk 10
The Current Housing Market This section summarises the SHMNA analysis of the current housing market for South Hams. The section is structured around the DCLG core outputs 1and 2.
The section provides a more locally tailored narrative of the ‘housing stock’ position, the ‘active market’ and the ‘key drivers of the housing market’. Wherever possible data has been mapped to provide a greater understanding of variance and relative performance at a sub-local authority level.
The key findings for South Hams are included up front for each DCLG Output for easy reference.
DCLG Output 1 – Estimates of current dwellings in terms of size, type, condition, tenure
A synopsis of the authority’s current stock position is summarised through the following:
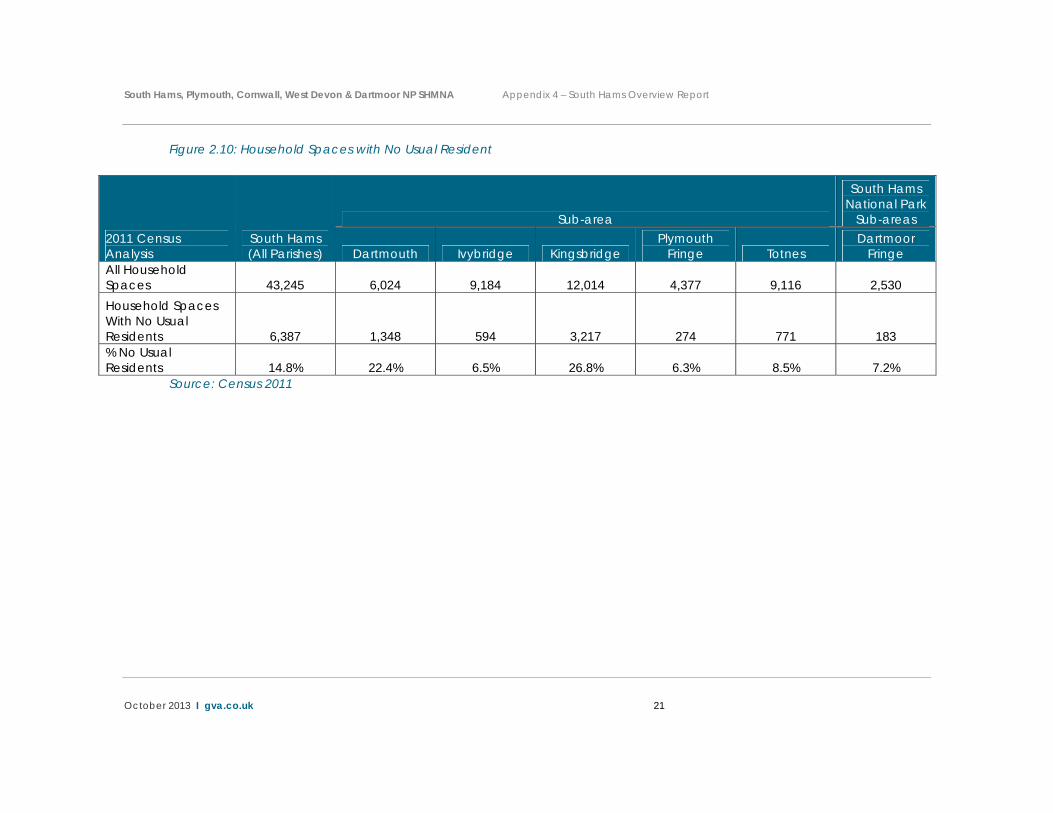
South Hams has a total of 43,245 dwellings, 6,387 of these are currently classified as properties with no usual residents2, equating to 14.8% of total stock3;
A total of 2,420 dwellings were been built within the South Hams during the 11 year period 2001/02 – 2011/12 4. This represents an average of 220 per annum. Despite the recession and housing market downturn from 2008, delivery levels in South Hams have remained relatively stable over the period.
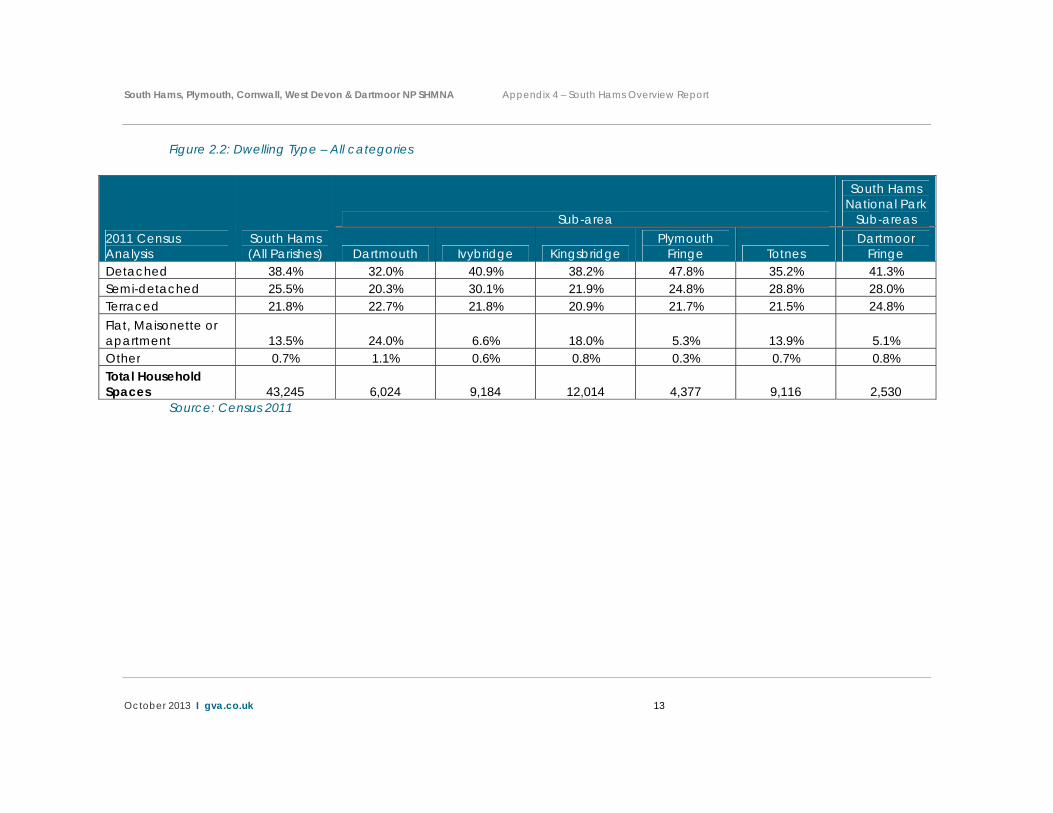
The profile of the housing by type shows that around 38% of homes are detached, 26% are semi-detached, 22% are terraced, 14% are flats with the remainder being classified as other5. This profile is reflected in the size of properties, with the average number of rooms per household in 2011 being 5.8 and the average number of bedrooms being 2.9.
2 A household space is the accommodation used or available for use by an individual household. A household space with no usual residents may still be used by short-term residents, visitors who were present on census night or a combination of short-term residents and visitors. Vacant household spaces and household spaces that are used as second addresses are also classified in census results as household spaces with no usual residents. 3 Source: Census 2011
4 Source: South Hams District Council
5 Other includes people living in an ‘unshared dwelling caravan or other mobile or temporary structure’ or a ‘shared dwelling’
South Hams, Plymouth, Cornwall, West Devon & Dartmoor NP SHMNA Appendix 4 – South Hams Overview Report
October 2013 I gva.co.uk 11
The latest stock condition data for the South West region, compiled in 2009, shows variable stock decency across the local authority area. Devon exhibited 32.8% of the private stock classified as non-decent6 with issues such as thermal comfort being a major contributor to non decency;
According to the 2011 Census 1.7% of households are classified as living in overcrowded conditions; and
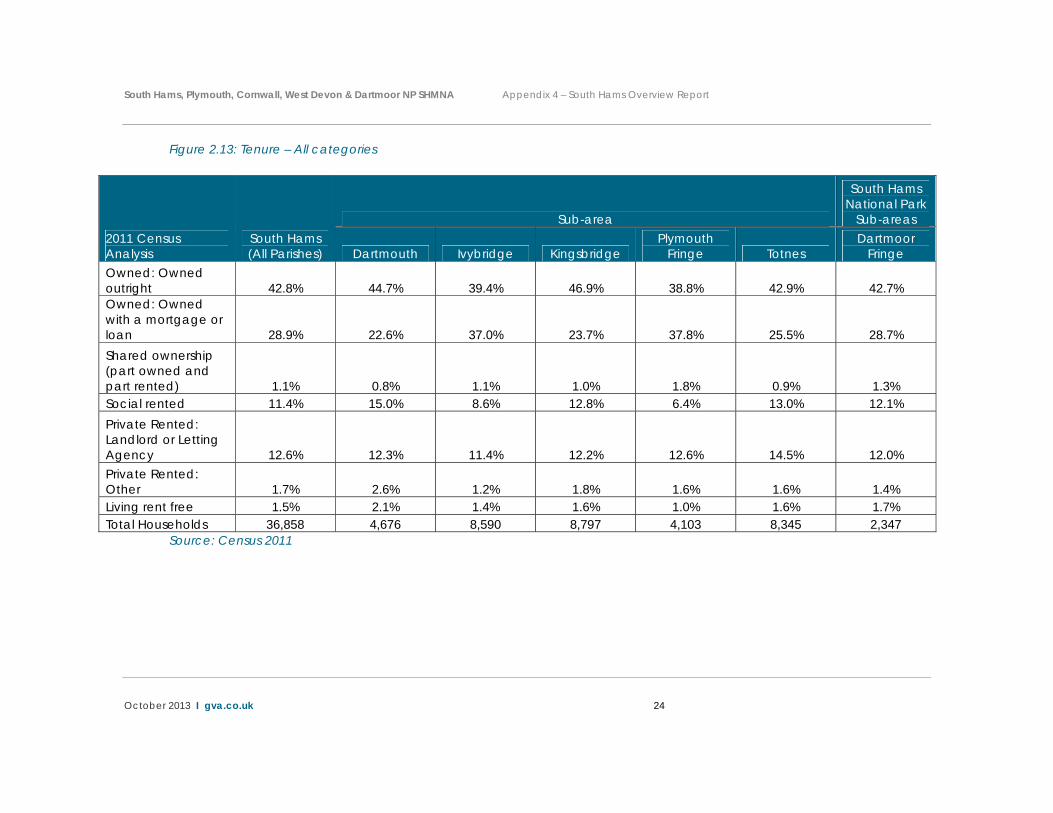
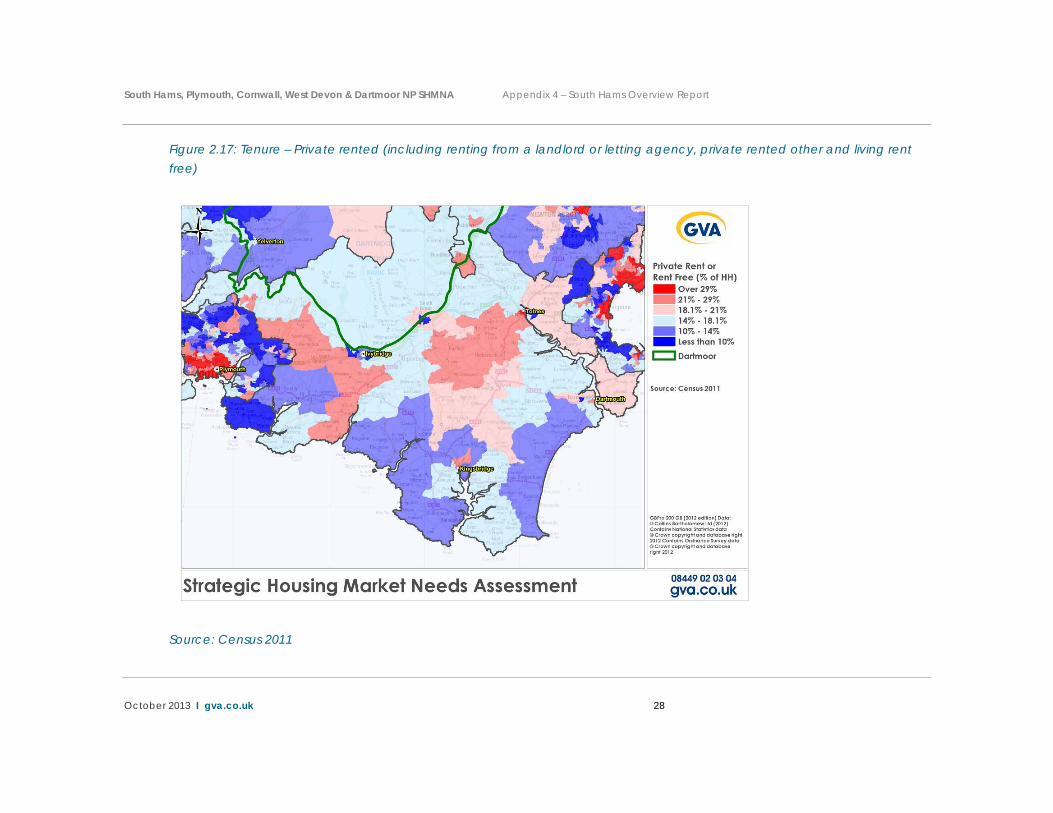
In terms of the tenure of housing the 2011 Census shows that 43% of households in South Hams own their own property outright, 29% own their property with a mortgage, 11% live in social housing (registered social housing provider rental property), 1% live in shared ownership housing, and 13% live in the private rented sector (landlord or letting agency) with a further 4% living in other tenures (2% private rented other and 2% living rent free).
Over the following pages detailed local level mapping from the 2011 Census is included focusing on housing stock indicators. These maps reveal the spatial distinctiveness of the housing market across the authority. The key in each plan uses the England and Wales average proportion as the mid-point to indicate if spatial areas record proportions above or below in each indicator. The mapping is complemented through analysis of tabulated data at the sub-market level. The following key spatial findings emerge in relation to the stock profile of different parts of the authority:
Concentrations of detached property within the Plymouth Fringe and Kingsbridge sub market areas.
Smaller concentrations of semi detached properties in the Ivybridge, Plymouth Fringe, Dartmouth and Totnes sub market areas.
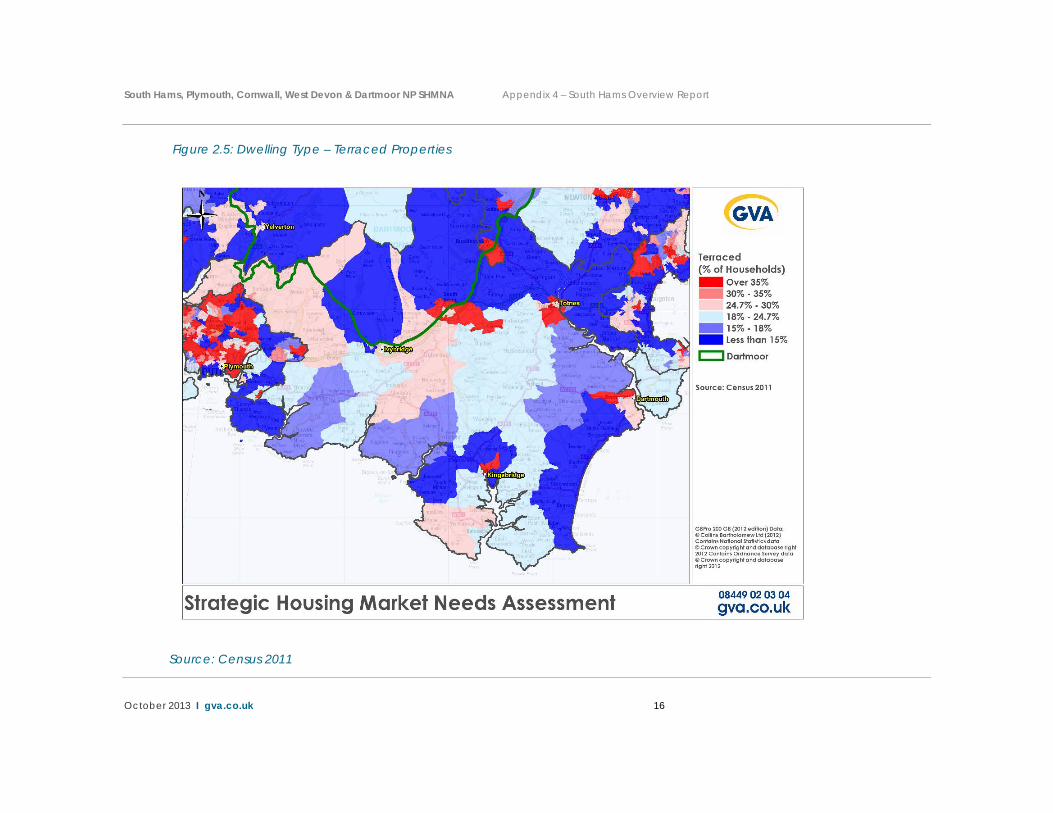
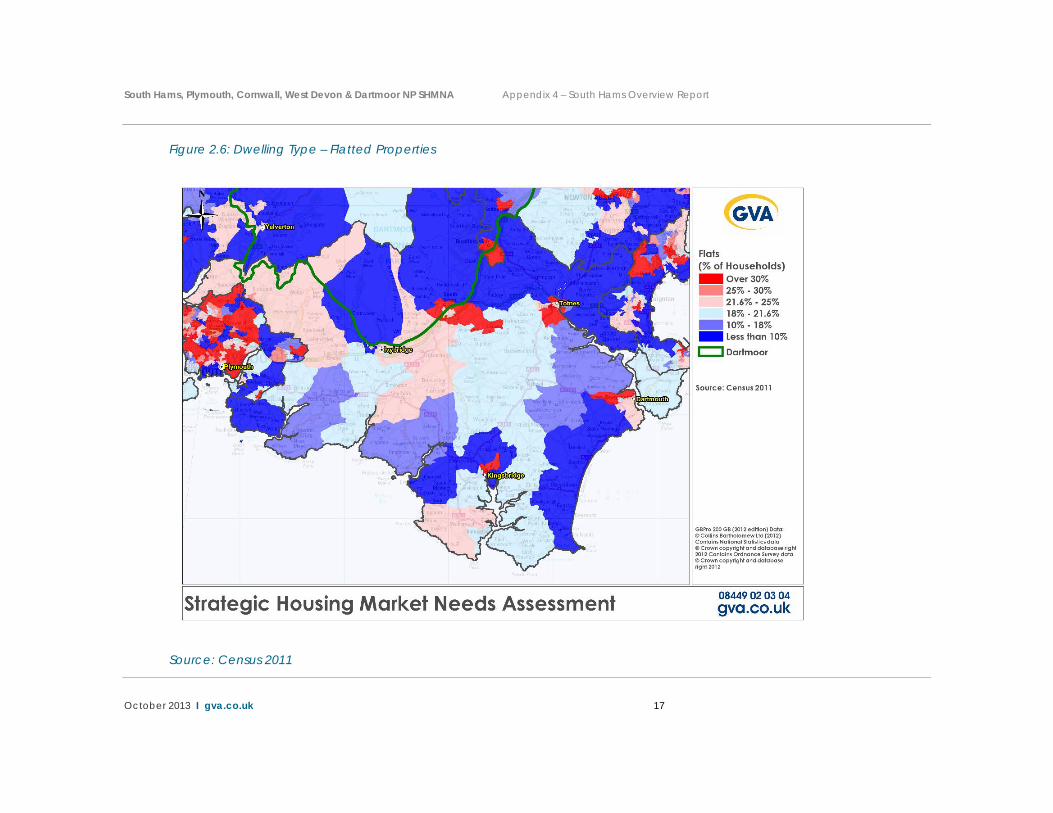
Relatively small concentrations of terraced property in evidence in Kingsbridge, Totnes and Dartmouth. Flatted properties are concentrated in Dartmouth, Totnes and Kingsbridge sub market areas.
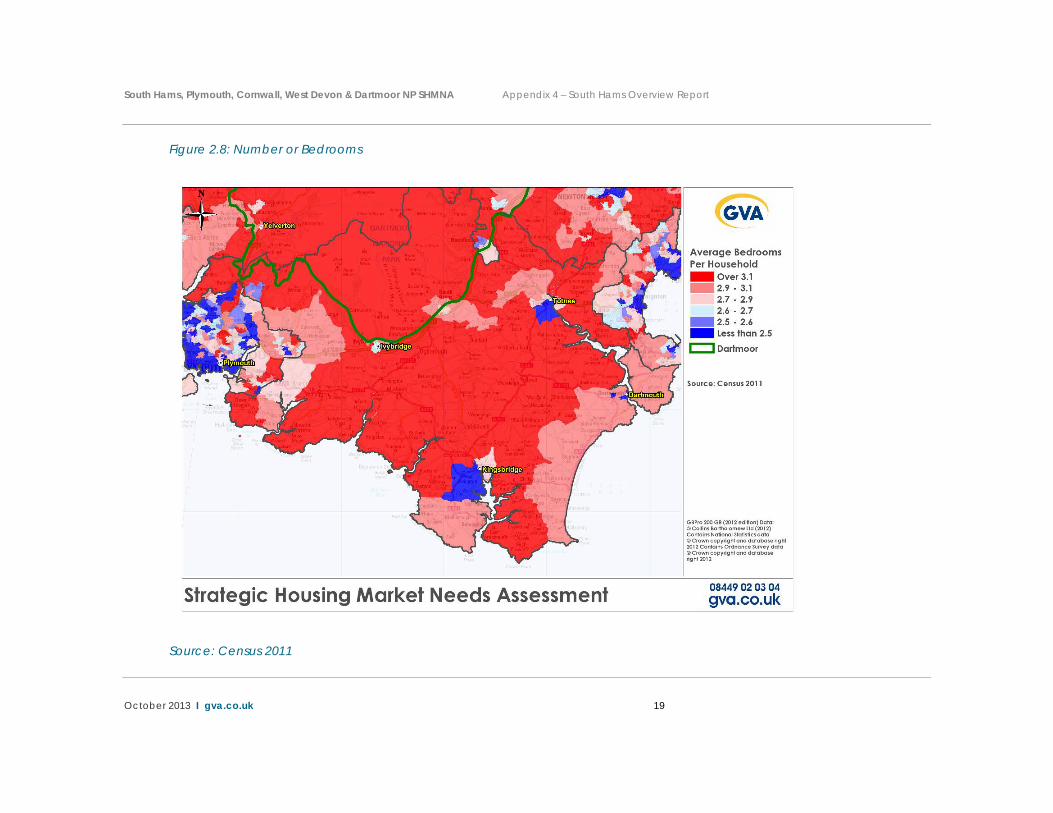
A large proportion of the South Hams local authority area is characterised by properties with relatively high numbers of bedrooms (above 3 per property). Notable exceptions, and evidence of smaller property sizes exist in parts of the Kingsbridge, Totnes and Dartmouth sub market areas.
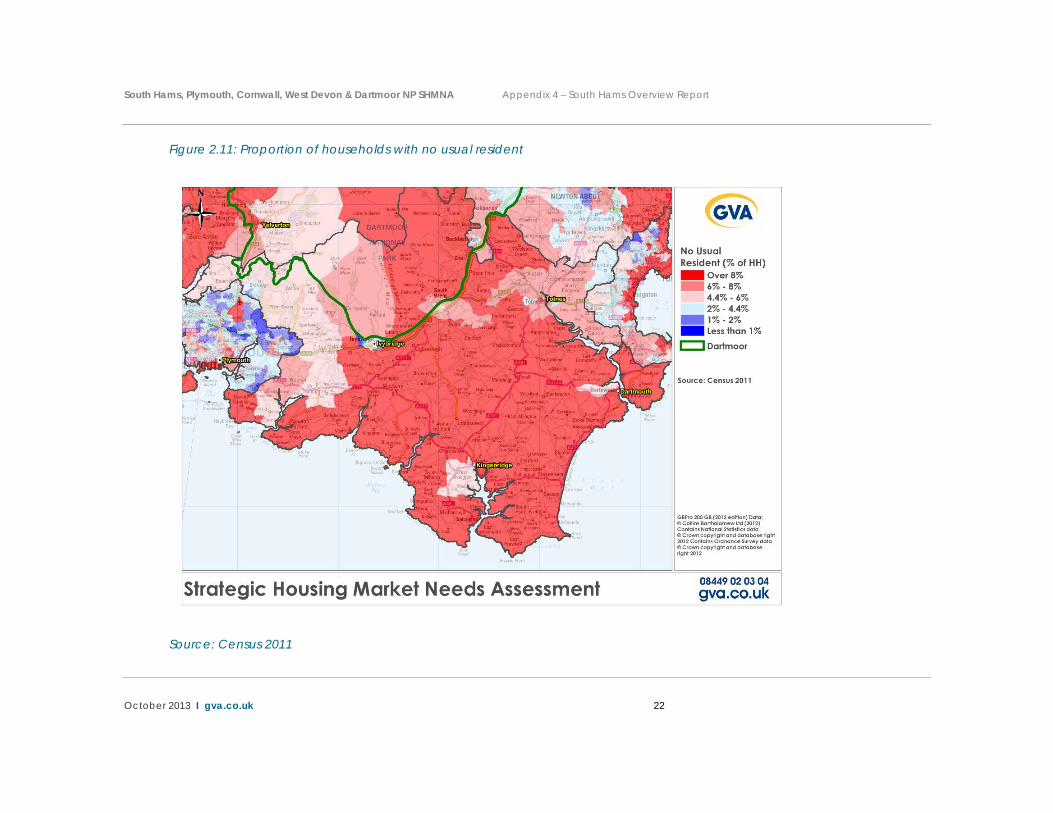
There is a relatively universal pattern of high levels of household spaces with no usual residents. This phenomenon is closely associated with second home
6 Source: The Condition of Private Sector Housing in the South West Region – South West Regional Assembly, March 2009

South Hams, Plymouth, Cornwall, West Devon & Dartmoor NP SHMNA Appendix 4 – South Hams Overview Report
October 2013 I gva.co.uk 12
ownership across a large area of South Hams. Relatively lower levels of household spaces with no usual resident are in evidence in the Plymouth Fringe sub-market area and parts of the Totnes sub market area.
Outright ownership of property is most prevalent in the Dartmouth and Kingsbridge sub market areas with a spatial concentration in coastal areas. Ownership with a mortgage exhibits concentrations in the Totnes and Kingsbridge sub market areas.
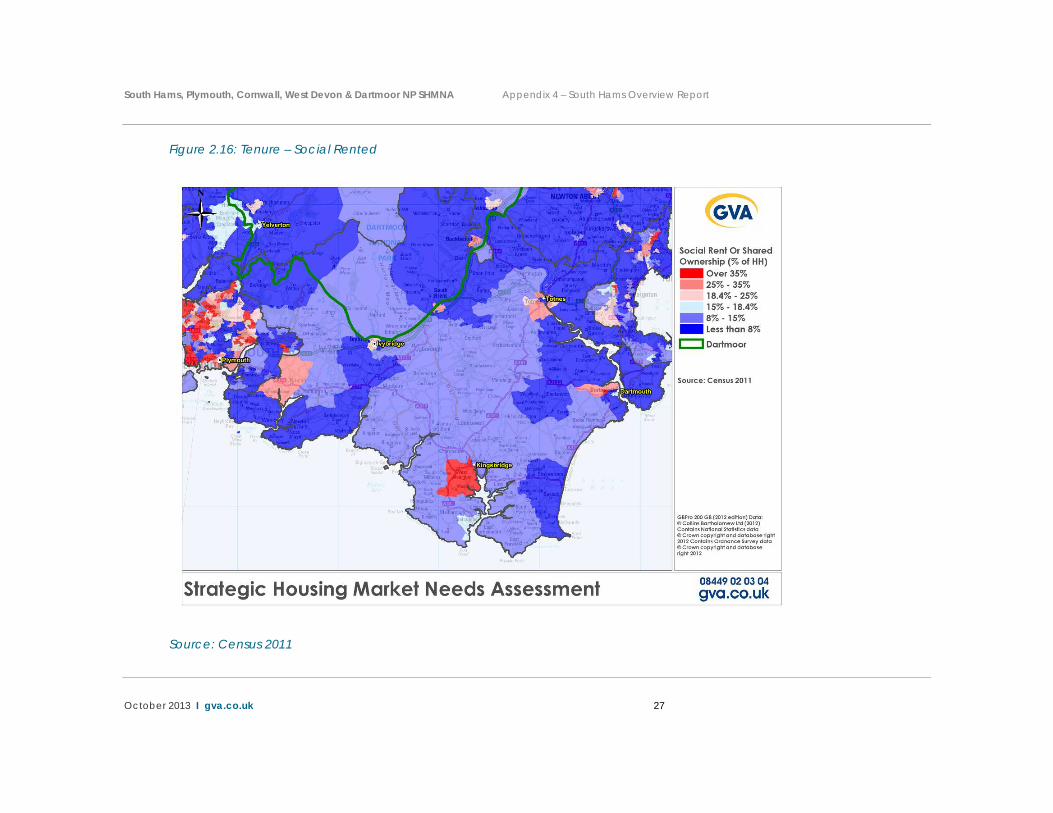
There are smaller, more isolated pockets of social rented and shared ownership property in the Dartmouth, Kingsbridge and Totnes sub market areas. There is a notable concentration of private rented sector property in the Plymouth fringe sub market area.
South Hams, Plymouth, Cornwall, West Devon & Dartmoor NP SHMNA Appendix 4 – South Hams Overview Report
October 2013 I gva.co.uk 13
Figure 2.2: Dwelling Type – All categories
2011 Census Analysis
South Hams (All Parishes)
Sub-area
South Hams National Park
Sub-areas
Dartmouth Ivybridge Kingsbridge Plymouth
Fringe Totnes Dartmoor
Fringe Detached 38.4% 32.0% 40.9% 38.2% 47.8% 35.2% 41.3% Semi-detached 25.5% 20.3% 30.1% 21.9% 24.8% 28.8% 28.0% Terraced 21.8% 22.7% 21.8% 20.9% 21.7% 21.5% 24.8% Flat, Maisonette or apartment 13.5% 24.0% 6.6% 18.0% 5.3% 13.9% 5.1% Other 0.7% 1.1% 0.6% 0.8% 0.3% 0.7% 0.8% Total Household Spaces 43,245 6,024 9,184 12,014 4,377 9,116 2,530
Source: Census 2011

South Hams, Plymouth, Cornwall, West Devon & Dartmoor NP SHMNA Appendix 4 – South Hams Overview Report
October 2013 I gva.co.uk 14
Figure 2.3: Dwelling Type – Detached Properties
Source: Census 2011

South Hams, Plymouth, Cornwall, West Devon & Dartmoor NP SHMNA Appendix 4 – South Hams Overview Report
October 2013 I gva.co.uk 15
Figure 2.4: Dwelling Type – Semi-Detached Properties
Source: Census 2011
South Hams, Plymouth, Cornwall, West Devon & Dartmoor NP SHMNA Appendix 4 – South Hams Overview Report
October 2013 I gva.co.uk 16
Figure 2.5: Dwelling Type – Terraced Properties
Source: Census 2011
South Hams, Plymouth, Cornwall, West Devon & Dartmoor NP SHMNA Appendix 4 – South Hams Overview Report
October 2013 I gva.co.uk 17
Figure 2.6: Dwelling Type – Flatted Properties
Source: Census 2011
South Hams, Plymouth, Cornwall, West Devon & Dartmoor NP SHMNA Appendix 4 – South Hams Overview Report
October 2013 I gva.co.uk 18
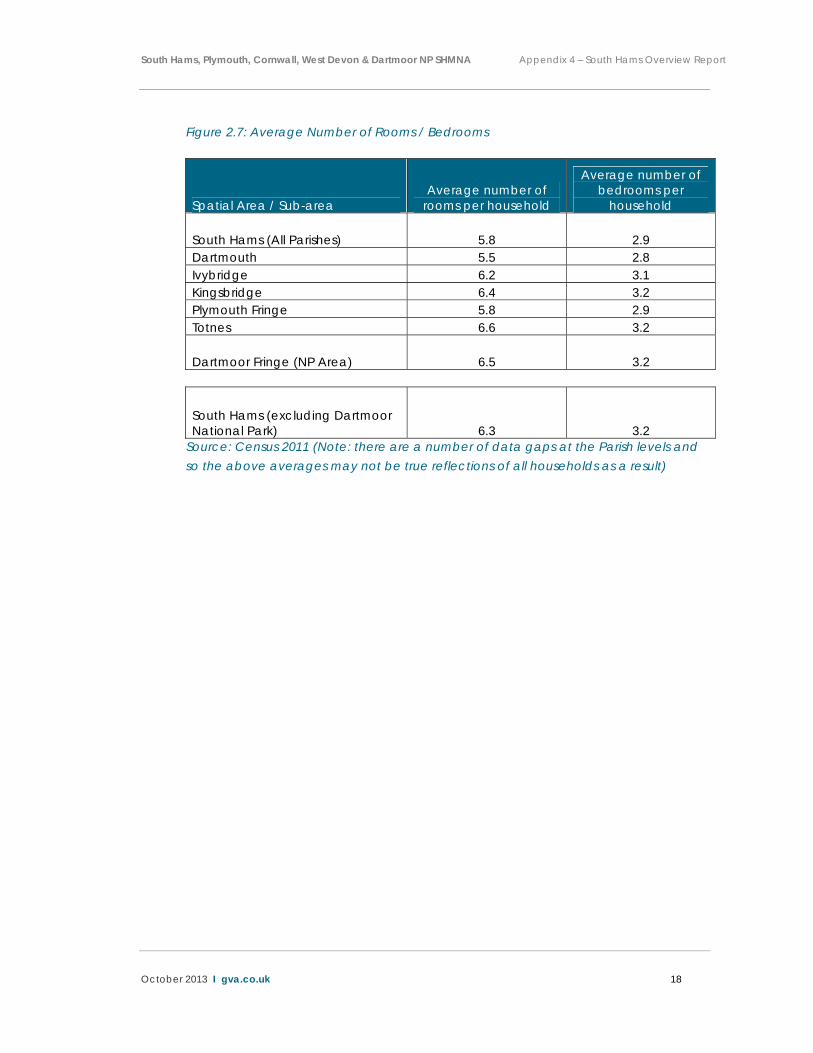
Figure 2.7: Average Number of Rooms / Bedrooms
Spatial Area / Sub-area Average number of
rooms per household
Average number of bedrooms per
household
South Hams (All Parishes) 5.8 2.9 Dartmouth 5.5 2.8 Ivybridge 6.2 3.1 Kingsbridge 6.4 3.2 Plymouth Fringe 5.8 2.9 Totnes 6.6 3.2
Dartmoor Fringe (NP Area) 6.5 3.2
South Hams (excluding Dartmoor National Park) 6.3 3.2
Source: Census 2011 (Note: there are a number of data gaps at the Parish levels and so the above averages may not be true reflections of all households as a result)
South Hams, Plymouth, Cornwall, West Devon & Dartmoor NP SHMNA Appendix 4 – South Hams Overview Report
October 2013 I gva.co.uk 19
Figure 2.8: Number or Bedrooms
Source: Census 2011

South Hams, Plymouth, Cornwall, West Devon & Dartmoor NP SHMNA Appendix 4 – South Hams Overview Report
October 2013 I gva.co.uk 20
Figure 2.9: Number of Rooms
Source: Census 2011
South Hams, Plymouth, Cornwall, West Devon & Dartmoor NP SHMNA Appendix 4 – South Hams Overview Report
October 2013 I gva.co.uk 21
Figure 2.10: Household Spaces with No Usual Resident
2011 Census Analysis
South Hams (All Parishes)
Sub-area
South Hams National Park
Sub-areas
Dartmouth Ivybridge Kingsbridge Plymouth
Fringe Totnes Dartmoor
Fringe All Household Spaces 43,245 6,024 9,184 12,014 4,377 9,116 2,530 Household Spaces With No Usual Residents 6,387 1,348 594 3,217 274 771 183 % No Usual Residents 14.8% 22.4% 6.5% 26.8% 6.3% 8.5% 7.2%
Source: Census 2011
South Hams, Plymouth, Cornwall, West Devon & Dartmoor NP SHMNA Appendix 4 – South Hams Overview Report
October 2013 I gva.co.uk 22
Figure 2.11: Proportion of households with no usual resident
Source: Census 2011

South Hams, Plymouth, Cornwall, West Devon & Dartmoor NP SHMNA Appendix 4 – South Hams Overview Report
October 2013 I gva.co.uk 23
Figure 2.12: Overcrowding
Spatial Area / Sub area
Proportion of Overcrowded
Households (Occupancy rating of -
1 or less) Bedrooms
Average number of bedrooms per
household
South Hams (All Parishes) 1.7% 2.9 Dartmouth 1.5% 2.8 Ivybridge 1.7% 3.1 Kingsbridge 1.6% 3.2 Plymouth Fringe 1.2% 2.9 Totnes 2.1% 3.2
Dartmoor Fringe (NP Area) 2.1% 3.2
South Hams excluding NP 1.7% 3.0 Source: Census 2011
South Hams, Plymouth, Cornwall, West Devon & Dartmoor NP SHMNA Appendix 4 – South Hams Overview Report
October 2013 I gva.co.uk 24
Figure 2.13: Tenure – All categories
2011 Census Analysis
South Hams (All Parishes)
Sub-area
South Hams National Park
Sub-areas
Dartmouth Ivybridge Kingsbridge Plymouth
Fringe Totnes Dartmoor
Fringe Owned: Owned outright 42.8% 44.7% 39.4% 46.9% 38.8% 42.9% 42.7% Owned: Owned with a mortgage or loan 28.9% 22.6% 37.0% 23.7% 37.8% 25.5% 28.7% Shared ownership (part owned and part rented) 1.1% 0.8% 1.1% 1.0% 1.8% 0.9% 1.3% Social rented 11.4% 15.0% 8.6% 12.8% 6.4% 13.0% 12.1% Private Rented: Landlord or Letting Agency 12.6% 12.3% 11.4% 12.2% 12.6% 14.5% 12.0% Private Rented: Other 1.7% 2.6% 1.2% 1.8% 1.6% 1.6% 1.4% Living rent free 1.5% 2.1% 1.4% 1.6% 1.0% 1.6% 1.7% Total Households 36,858 4,676 8,590 8,797 4,103 8,345 2,347
Source: Census 2011

South Hams, Plymouth, Cornwall, West Devon & Dartmoor NP SHMNA Appendix 4 – South Hams Overview Report
October 2013 I gva.co.uk 25
Figure 2.14: Tenure – Owned Outright
Source: Census 2011

South Hams, Plymouth, Cornwall, West Devon & Dartmoor NP SHMNA Appendix 4 – South Hams Overview Report
October 2013 I gva.co.uk 26
Figure 2.15: Tenure – Owned with a mortgage
Source: Census 2011
South Hams, Plymouth, Cornwall, West Devon & Dartmoor NP SHMNA Appendix 4 – South Hams Overview Report
October 2013 I gva.co.uk 27
Figure 2.16: Tenure – Social Rented
Source: Census 2011
South Hams, Plymouth, Cornwall, West Devon & Dartmoor NP SHMNA Appendix 4 – South Hams Overview Report
October 2013 I gva.co.uk 28
Figure 2.17: Tenure – Private rented (including renting from a landlord or letting agency, private rented other and living rent free)
Source: Census 2011

South Hams, Plymouth, Cornwall, West Devon & Dartmoor NP SHMNA Appendix 4 – South Hams Overview Report
October 2013 I gva.co.uk 29
DCLG Output 2 – Analysis of past and current housing market trends and understanding of key drivers underpinning the housing market
The analysis addressing this output can be split under two separate areas, socio-economic drivers which have an important bearing on the operation of the housing market and the active market which incorporates, for example, market fluctuations in price and responds to the longer-term drivers of change (for example population change and the relative health of the economy).
Demographic Drivers
The Main SHMNA Report identified a number of important characteristics of the current population of the authority and the drivers which have influenced the profile of the population and households over recent years. A summary of the demographic trends influencing the operation of the housing market in the authority are set out below:
Comparing the 2001 and 2011 Census shows that the population of South Hams has grown by only 1,700 people over these ten years. This represents a growth of only 2.1% which is the lowest across the five authorities in the study area;
The examination of the changing age profile of the population of the authority over this period showed that compared to the England and Wales profile South Ham’s population profile has a notably high proportion of older persons, those aged 60+. In particular comparing the pyramids of the two Census years shows a notable increase in the proportion of people aged 60 – 70 between 2001 and 2011 in the authority. South Hams population profile also shows a sustained low proportion of people aged 20 to 30. This has been consistent historically with this low proportion of this age group in 2001 moving through to result in a notable decline in the proportion aged 30 – 40 between 2001 and 2011. The contraction of people aged 30 – 50 over the last ten years as a proportion of the population as a whole has also resulted in a reduction in the proportion of children in the authority;
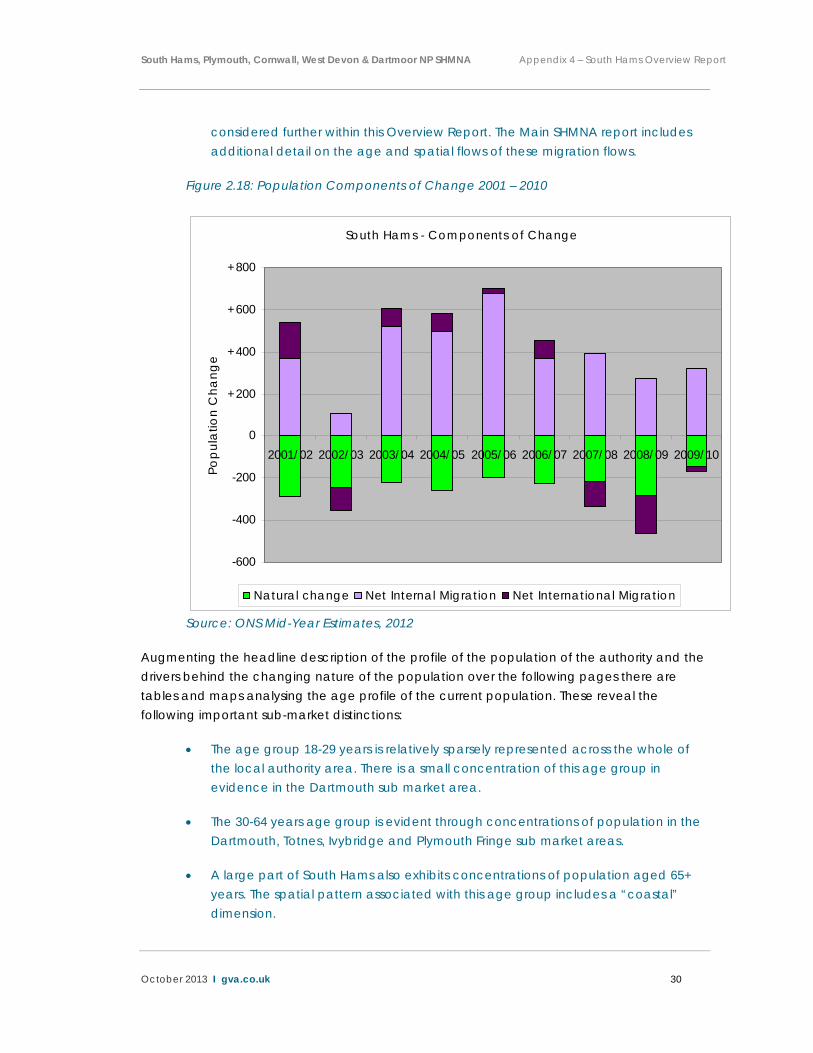
Using ONS published data and the POPGROUP model the following chart shows the components of change which have driven the growth in the population noted above. It is evident from this chart that internal migration (movement in and out of people between South Hams and other authorities in the UK) has been the main driver of population change. Interestingly the size of the net flow has reduced over recent years, with this potentially linked to the availability of new employment opportunities and affordability challenges, issues which are
South Hams, Plymouth, Cornwall, West Devon & Dartmoor NP SHMNA Appendix 4 – South Hams Overview Report
October 2013 I gva.co.uk 30
considered further within this Overview Report. The Main SHMNA report includes additional detail on the age and spatial flows of these migration flows.
Figure 2.18: Population Components of Change 2001 – 2010
South Hams - Components of Change
-600
-400
-200
0
+200
+400
+600
+800
2001/02 2002/03 2003/04 2004/05 2005/06 2006/07 2007/08 2008/09 2009/10
Pop
ula
tion
Cha
nge
Natural change Net Internal Migration Net International Migration
Source: ONS Mid-Year Estimates, 2012
Augmenting the headline description of the profile of the population of the authority and the drivers behind the changing nature of the population over the following pages there are tables and maps analysing the age profile of the current population. These reveal the following important sub-market distinctions:
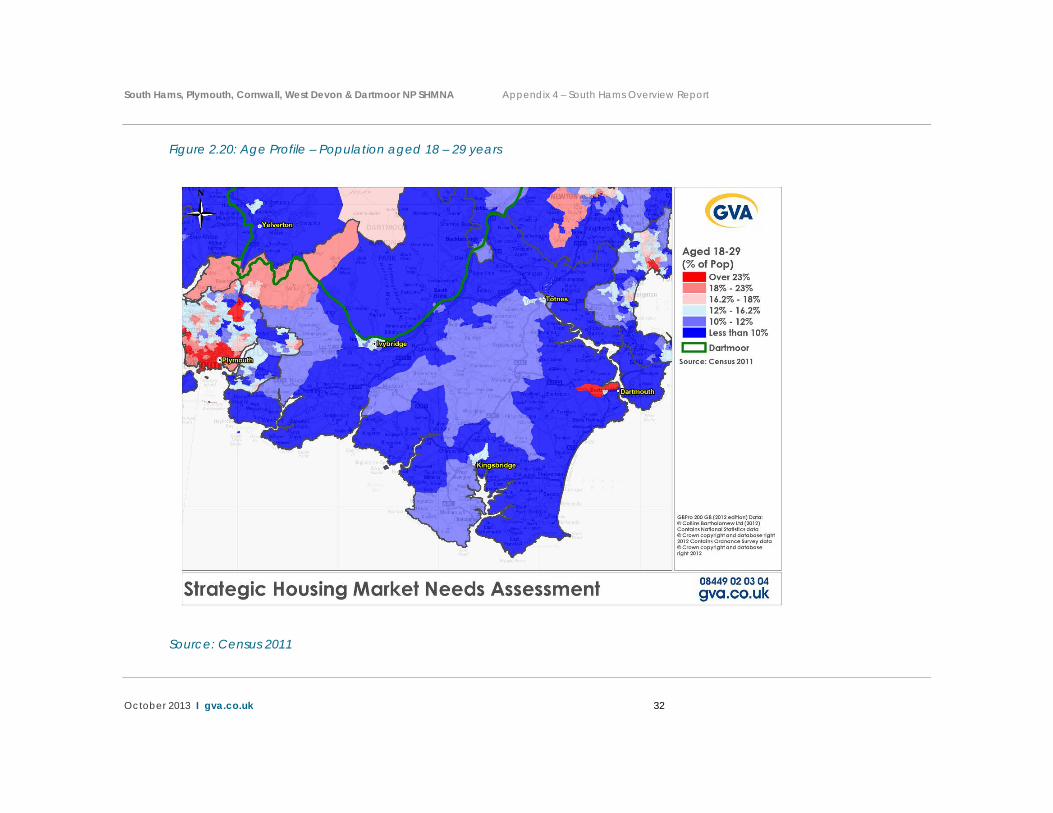
The age group 18-29 years is relatively sparsely represented across the whole of the local authority area. There is a small concentration of this age group in evidence in the Dartmouth sub market area.
The 30-64 years age group is evident through concentrations of population in the Dartmouth, Totnes, Ivybridge and Plymouth Fringe sub market areas.
A large part of South Hams also exhibits concentrations of population aged 65+ years. The spatial pattern associated with this age group includes a “coastal” dimension.
South Hams, Plymouth, Cornwall, West Devon & Dartmoor NP SHMNA Appendix 4 – South Hams Overview Report
October 2013 I gva.co.uk 31
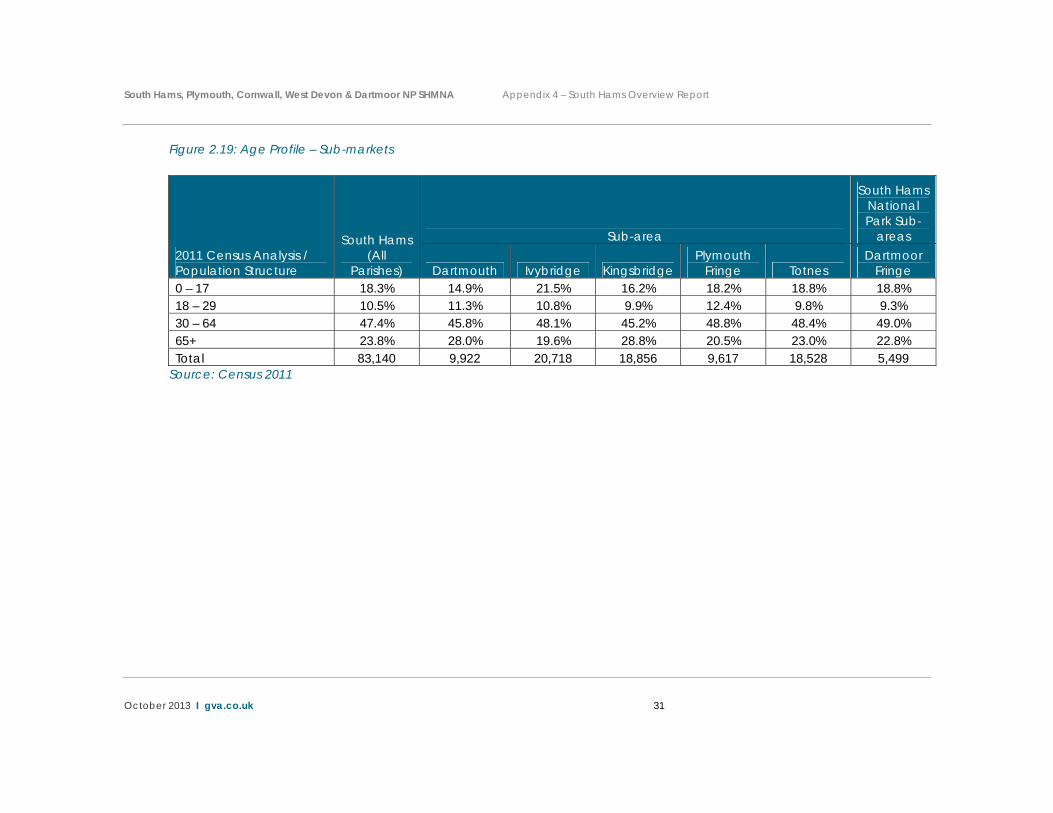
Figure 2.19: Age Profile – Sub-markets
2011 Census Analysis / Population Structure
South Hams (All
Parishes)
Sub-area
South Hams National Park Sub-
areas
Dartmouth Ivybridge Kingsbridge Plymouth
Fringe Totnes Dartmoor
Fringe 0 – 17 18.3% 14.9% 21.5% 16.2% 18.2% 18.8% 18.8% 18 – 29 10.5% 11.3% 10.8% 9.9% 12.4% 9.8% 9.3% 30 – 64 47.4% 45.8% 48.1% 45.2% 48.8% 48.4% 49.0% 65+ 23.8% 28.0% 19.6% 28.8% 20.5% 23.0% 22.8% Total 83,140 9,922 20,718 18,856 9,617 18,528 5,499
Source: Census 2011
South Hams, Plymouth, Cornwall, West Devon & Dartmoor NP SHMNA Appendix 4 – South Hams Overview Report
October 2013 I gva.co.uk 32
Figure 2.20: Age Profile – Population aged 18 – 29 years
Source: Census 2011

South Hams, Plymouth, Cornwall, West Devon & Dartmoor NP SHMNA Appendix 4 – South Hams Overview Report
October 2013 I gva.co.uk 33
Figure 2.21: Age Profile – Population aged 30 – 64 years
Source: Census 2011

South Hams, Plymouth, Cornwall, West Devon & Dartmoor NP SHMNA Appendix 4 – South Hams Overview Report
October 2013 I gva.co.uk 34
Figure 2.22: Age Profile – Population aged over 65 years
Source: Census 2011
South Hams, Plymouth, Cornwall, West Devon & Dartmoor NP SHMNA Appendix 4 – South Hams Overview Report
October 2013 I gva.co.uk 35
As well as the age profile of the population the Census 2011 also provides a useful indication of the average size of households (number of persons per household). The SHMNA identified that in South Hams the average household size had changed from 2.29 in 2001 to 2.21 2011.
This stability in average household size needs to be understood in the context of prevailing market and economic conditions, particularly in the four years preceding the Census 2011 date. This period has been generally characterised by a deep period of recession, sluggish income growth and limited net new employment opportunities. On the housing supply side, the same period has been characterised by low levels of private completions and a reduction in affordable housing funding and ergo new supply. The combination of these trends has meant that many households have been unable to form during this period for reasons of affordability and confidence, with a resultant concealment trend a likely contributor to stable average household sizes. Caution therefore needs to be applied in the interpretation household sizes on their own as a leading indicator for housing demand, as these data do not provide an indication of the propensity or likeliness of households to form in the future and in the context of improved economic and supply side conditions.
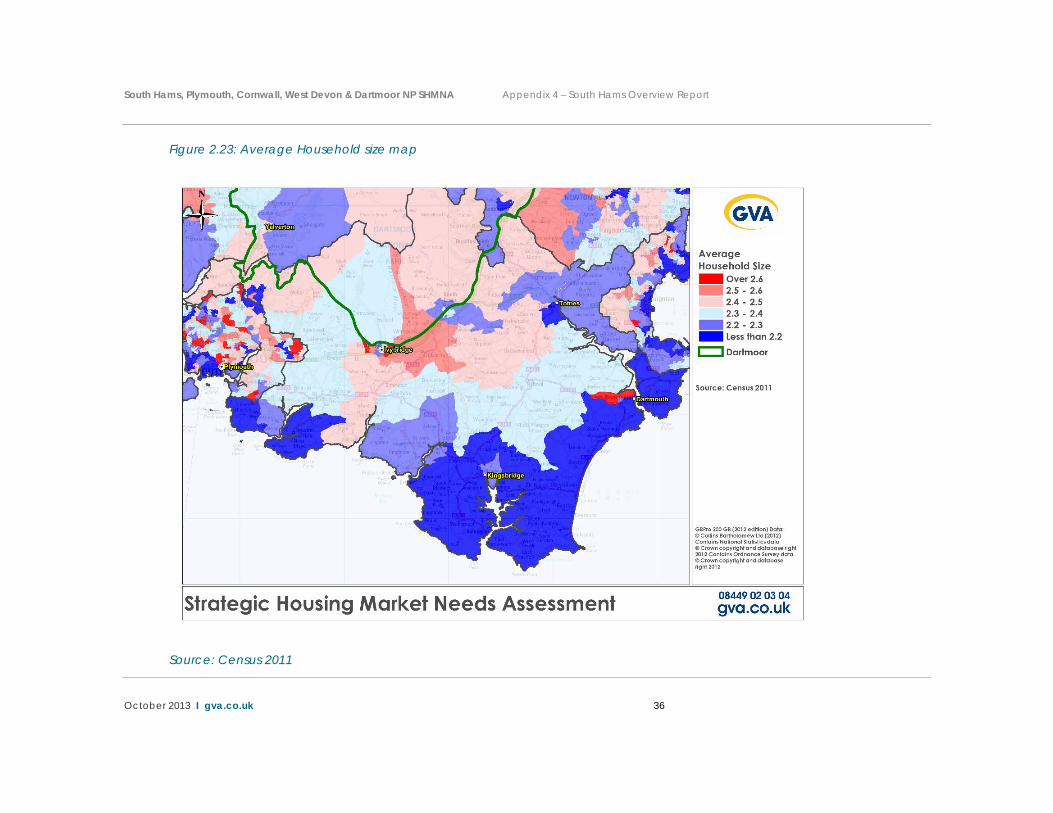
The following plan shows the spatial differences in the average size of household across the authority.
South Hams, Plymouth, Cornwall, West Devon & Dartmoor NP SHMNA Appendix 4 – South Hams Overview Report
October 2013 I gva.co.uk 36
Figure 2.23: Average Household size map
Source: Census 2011
South Hams, Plymouth, Cornwall, West Devon & Dartmoor NP SHMNA Appendix 4 – South Hams Overview Report
October 2013 I gva.co.uk 37
Economic Drivers
The Main SHMNA report identified a number of important characteristics around the current and future profile of the economy of the authority. This included:
Between 2001 and 2010 the authority saw an increase of just under 3,000 jobs or approximately 330 per annum on average. Between 2007 and 2010 the authority lost just under 2,500 jobs;
A range of economic forecasts are presented within the Main SHMNA Report. These show a range in levels of job forecast with the two latest forecasts suggesting that total employment within the authority will grow by between 5,870 jobs (Experian, 2013) and 13,165 jobs (LEFM, 2012);
The authority has a relatively low level of unemployment with analysis of available data between 2007 and 2011 showing an average unemployment rate of 3.2%;
The authority in 2001 was a net importer of labour although the commuting ratio of 0.97 shows a relatively balanced labour-market (Census 2001). This is based on the Census recording 37,390 workers living in South Hams and 38,599 jobs in South Hams;
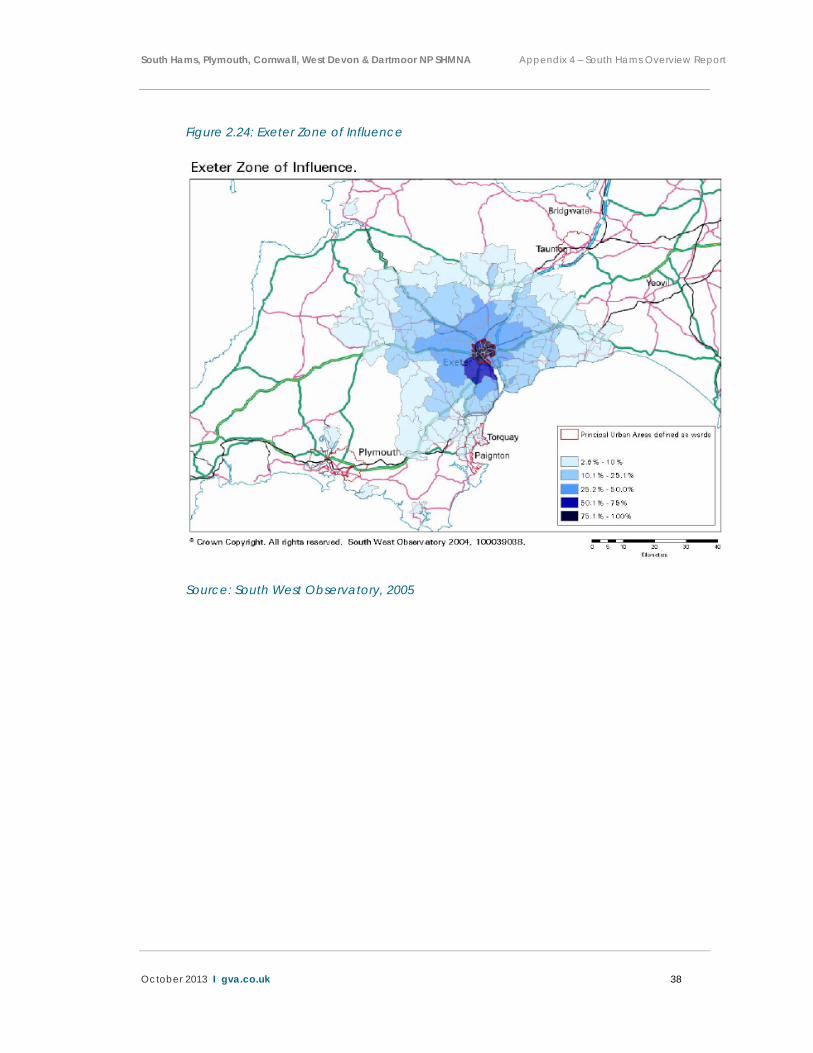
Examining travel to work data illustrates strong commuting relationships with Plymouth, with approximately 20% of South Hams workers commuting into Plymouth. This analysis also shows lesser scale flows into Torbay and Exeter. Work undertaken by the South West Observatory in 2005 considered local level commuting flows in more detail. This illustrated the overlapping of zones of travel to work influence from the Torbay area and Exeter into the authority. This is illustrated by the plans replicated below from this report.
South Hams, Plymouth, Cornwall, West Devon & Dartmoor NP SHMNA Appendix 4 – South Hams Overview Report
October 2013 I gva.co.uk 38
Figure 2.24: Exeter Zone of Influence
Source: South West Observatory, 2005

South Hams, Plymouth, Cornwall, West Devon & Dartmoor NP SHMNA Appendix 4 – South Hams Overview Report
October 2013 I gva.co.uk 39
Figure 2.25: Torbay Zone of Influence
Source: South West Observatory, 2005
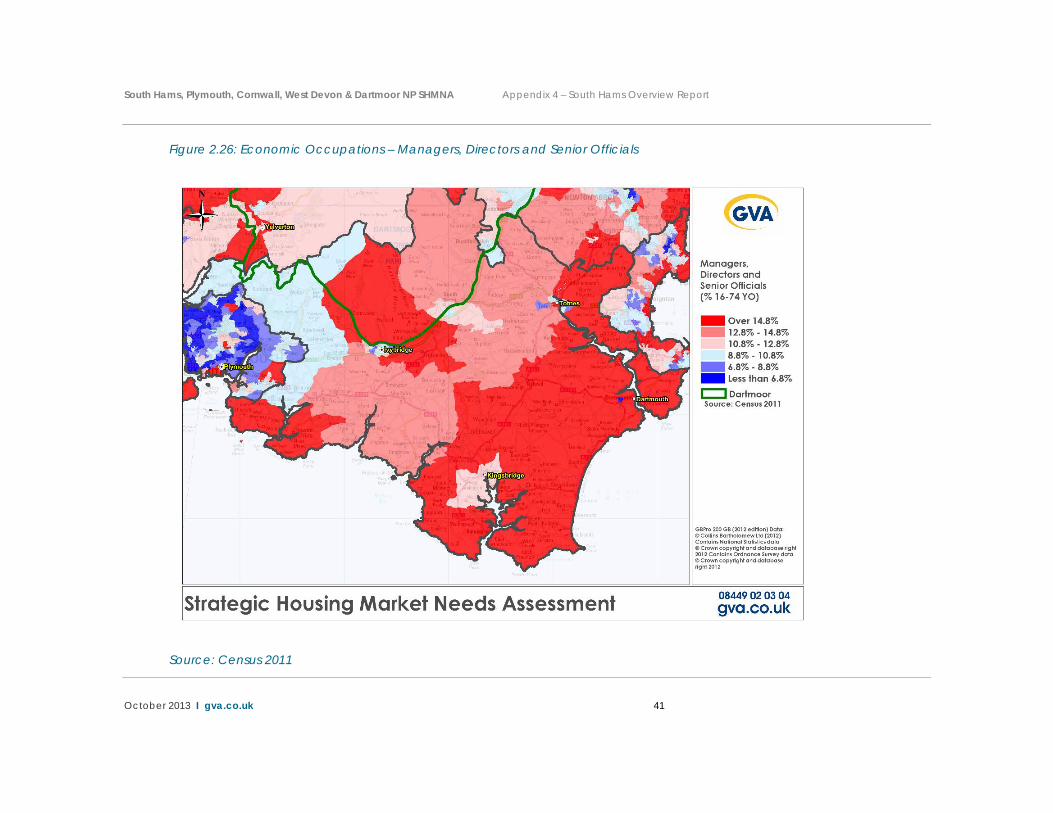
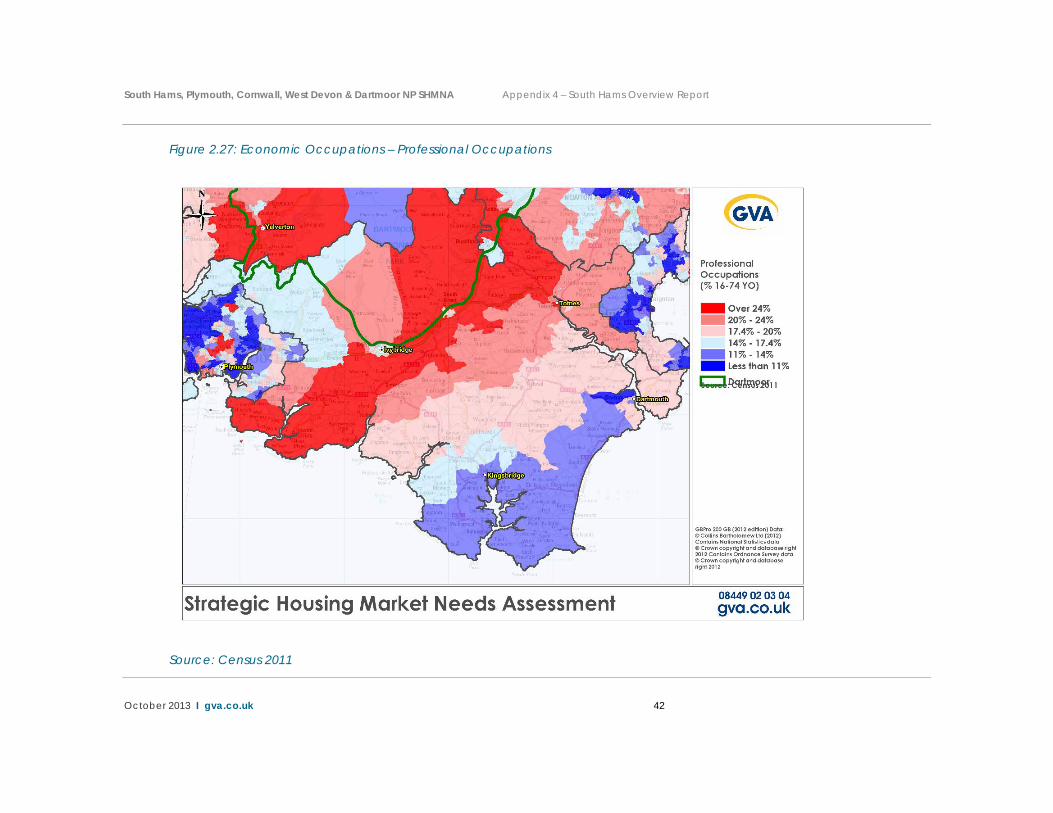
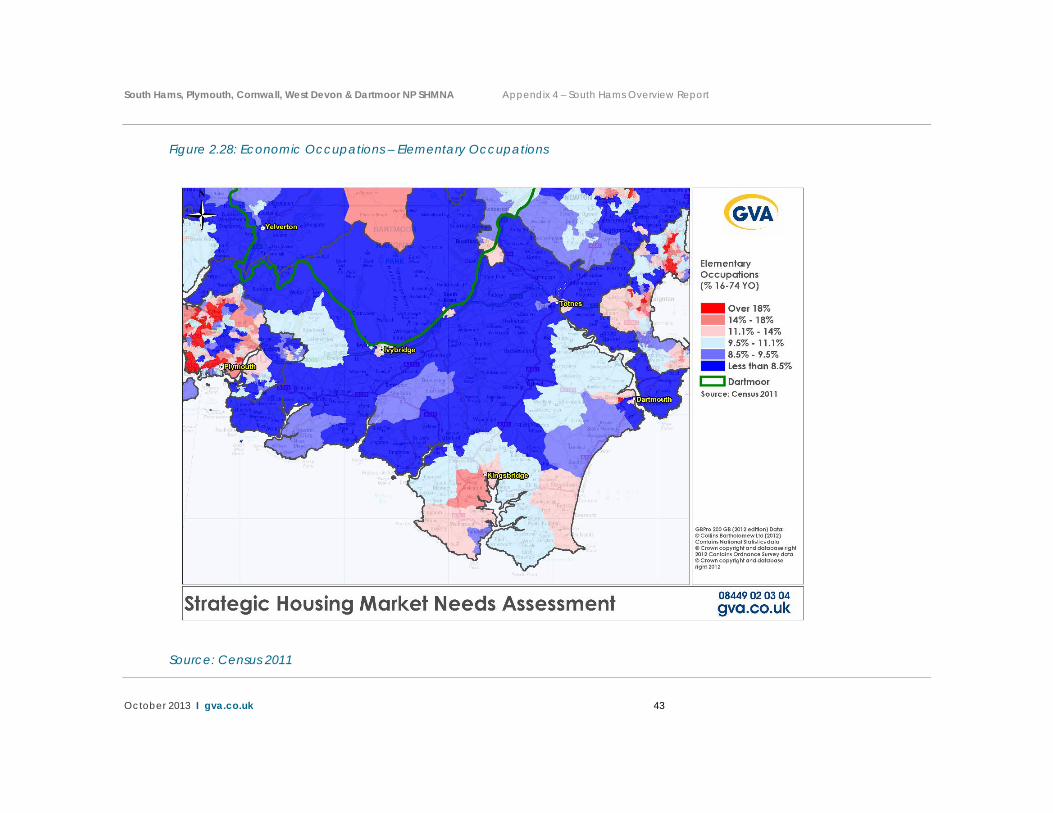
The 2011 Census also provides an indication of the spatial distribution of the different economic occupations of the labour-force. Three plans are presented over the following pages looking at the distribution of three occupational classifications, with these considered to represent a good spectrum of the overall profile, these are:
Managers, Directors and Senior Officials
Professional Occupations
Elementary Occupations
These reveal a number of spatial distinctions:
Managerial, director and senior official groups are spatially concentrated in a “swathe” running through the Kingsbridge, Dartmouth and Totnes sub market areas.
Professional groups, by way of contrast are spatially concentrated towards the west of South Hams, potentially showing the economic influence of the Plymouth

South Hams, Plymouth, Cornwall, West Devon & Dartmoor NP SHMNA Appendix 4 – South Hams Overview Report
October 2013 I gva.co.uk 40
travel to work area on the Plymouth Fringe, Ivybridge and parts of Totnes sub market areas.
Concentrations of elementary occupations are notable by their general absence, although a small concentration is in evidence in Dartmouth.
South Hams, Plymouth, Cornwall, West Devon & Dartmoor NP SHMNA Appendix 4 – South Hams Overview Report
October 2013 I gva.co.uk 41
Figure 2.26: Economic Occupations – Managers, Directors and Senior Officials
Source: Census 2011
South Hams, Plymouth, Cornwall, West Devon & Dartmoor NP SHMNA Appendix 4 – South Hams Overview Report
October 2013 I gva.co.uk 42
Figure 2.27: Economic Occupations – Professional Occupations
Source: Census 2011
South Hams, Plymouth, Cornwall, West Devon & Dartmoor NP SHMNA Appendix 4 – South Hams Overview Report
October 2013 I gva.co.uk 43
Figure 2.28: Economic Occupations – Elementary Occupations
Source: Census 2011
South Hams, Plymouth, Cornwall, West Devon & Dartmoor NP SHMNA Appendix 4 – South Hams Overview Report
October 2013 I gva.co.uk 44
The distribution of economic occupations is also a useful indicator as to the level of incomes households are likely to command. The Main SHMNA report included analysis of incomes at an authority level.
The Active Market – Past and Current Housing Market Trends
The following observations summarise the operation of the active market in South Hams. The analysis illustrates the way in which the housing market has changed over recent years:
The UK had enjoyed varying rates of consistently positive house price growth since 1996, lasting until 2008 where house prices declined rapidly as a result of the ‘credit crunch’ and subsequent recessionary economic climate. House price growth rebounded in 2011, and has since stabilised. South Hams demonstrates average house prices that have consistently and significantly exceeded the national average – recorded at £245,000 in Q3 2012 compared to £190,000 for England as a whole.
Although house prices have not considerably declined, in spite of the ‘credit crunch’ and recession in the late 2000’s, the volume of residential dwelling transactions has contracted significantly since 2008. The volume of transactions in the market reached its lowest point since 1996 in 2008, having rebounded slightly by 2011. Albeit, the market remains ‘thin’, with transactions some 20-30% lower than in 1996, and some 50-60% below the peak in transaction volumes seen in 2006 and 2007. Notably, South Hams has closely mirrored the national trend in transaction volumes.
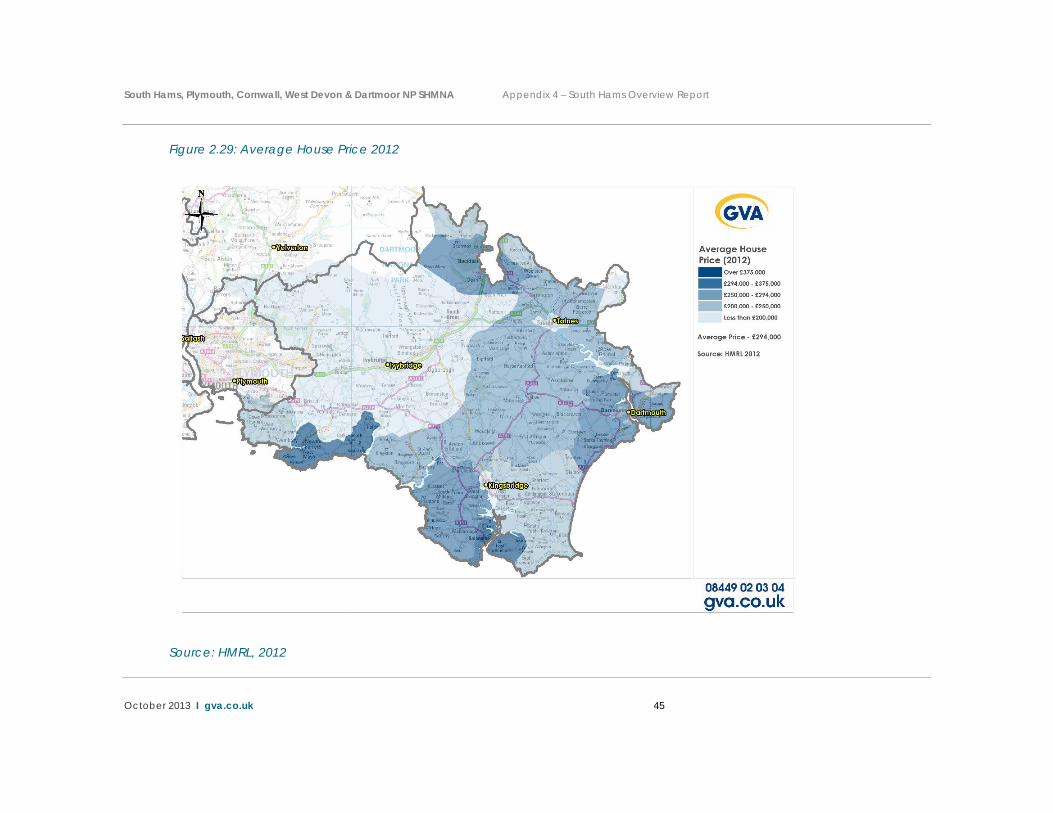
The map on the following page shows the spatial distribution of house prices at a local level. This shows a broad spatial pricing trend of higher average prices in the south and east of the district (incorporating Kingsbridge and Dartmouth sub market areas) and relatively lower average house prices in the north and west of the district.
South Hams, Plymouth, Cornwall, West Devon & Dartmoor NP SHMNA Appendix 4 – South Hams Overview Report
October 2013 I gva.co.uk 45
Figure 2.29: Average House Price 2012
Source: HMRL, 2012

South Hams, Plymouth, Cornwall, West Devon & Dartmoor NP SHMNA Appendix 4 – South Hams Overview Report
October 2013 I gva.co.uk 46
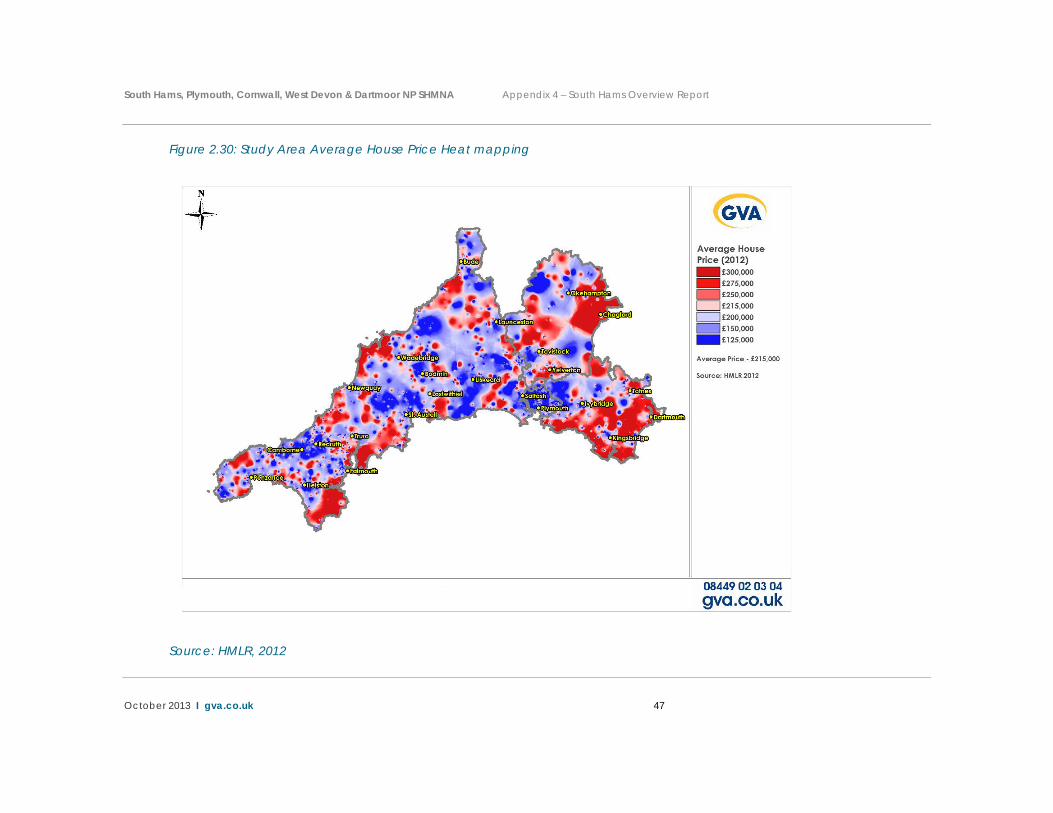
The Main SHMNA Report included mapping of average house prices across the study area. This is shown on the plan included on the following page. This shows the overlapping price based markets between South Hams and surrounding authorities. This includes, importantly a clear area of shared house price characteristics surrounding Plymouth, with these areas showing considerably lower house prices than the majority of the other parts of South Hams. This area is largely represented by the sub-market the ‘Plymouth Fringe’. House prices are comparatively high in, and surrounding, Totnes, Dartmouth and to the south of Ivybridge.
South Hams, Plymouth, Cornwall, West Devon & Dartmoor NP SHMNA Appendix 4 – South Hams Overview Report
October 2013 I gva.co.uk 47
Figure 2.30: Study Area Average House Price Heat mapping
Source: HMLR, 2012
South Hams, Plymouth, Cornwall, West Devon & Dartmoor NP SHMNA Appendix 4 – South Hams Overview Report
October 2013 I gva.co.uk 48
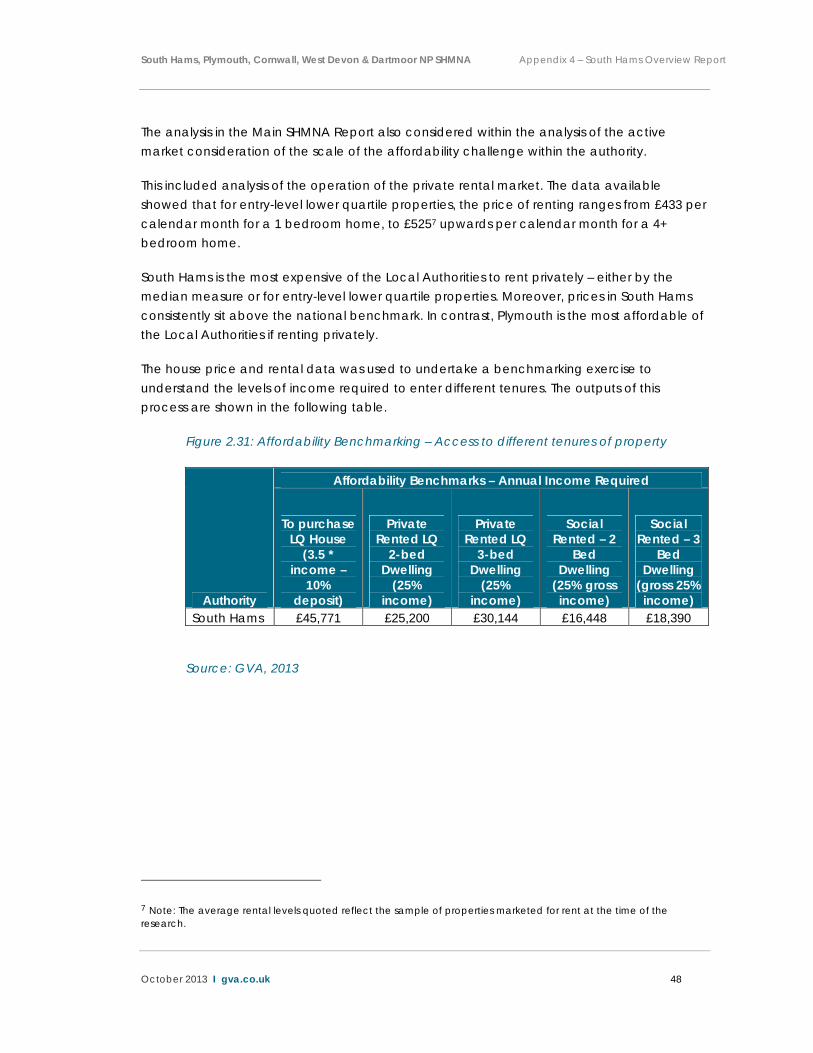
The analysis in the Main SHMNA Report also considered within the analysis of the active market consideration of the scale of the affordability challenge within the authority.
This included analysis of the operation of the private rental market. The data available showed that for entry-level lower quartile properties, the price of renting ranges from £433 per calendar month for a 1 bedroom home, to £5257 upwards per calendar month for a 4+ bedroom home.
South Hams is the most expensive of the Local Authorities to rent privately – either by the median measure or for entry-level lower quartile properties. Moreover, prices in South Hams consistently sit above the national benchmark. In contrast, Plymouth is the most affordable of the Local Authorities if renting privately.
The house price and rental data was used to undertake a benchmarking exercise to understand the levels of income required to enter different tenures. The outputs of this process are shown in the following table.
Figure 2.31: Affordability Benchmarking – Access to different tenures of property
Authority
Affordability Benchmarks – Annual Income Required
To purchase LQ House
(3.5 * income –
10% deposit)
Private Rented LQ
2-bed Dwelling
(25% income)
Private Rented LQ
3-bed Dwelling
(25% income)
Social Rented – 2
Bed Dwelling
(25% gross income)
Social Rented – 3
Bed Dwelling
(gross 25% income)
South Hams £45,771 £25,200 £30,144 £16,448 £18,390
Source: GVA, 2013
7 Note: The average rental levels quoted reflect the sample of properties marketed for rent at the time of the research.
South Hams, Plymouth, Cornwall, West Devon & Dartmoor NP SHMNA Appendix 4 – South Hams Overview Report
October 2013 I gva.co.uk 49
The Future Housing Market Understanding how the operation of the housing market will change in the future represents an important part of the Main SHMNA Report. A number of models are utilised within the Main SHMNA Report to project forward future demand.
This includes examining the long-term pressures for new housing resulting from a growing population and household base, and the impact this will have on the types of housing that new and existing households will require over the plan period.
It also includes an assessment of the current and short-term future need for affordable housing, again with a breakdown by size of property and affordable tenures. The results of these modelling processes are summarised within this section. Sections 6 and 7 of the main SHMNA Report include a detailed methodology for each of the modelling processes which are not replicated in this Overview Report but which should be cross referred to.
DCLG Output 3 - Estimate of total future number of households, broken down by age and type where possible
The Main SHMNA Report incorporates modelling and analysis to determine the most likely range of future population levels based on scenario built projections.
These projections take account of demographic, economic, market and supply factors to arrive at a series of conclusions around how the population and number of households could change and what this means in terms of both the age and type of households.
For South Hams the following conclusions are reached:
The number of households is forecast to grow over the period 2011 and 2031 by between 3,930 and 15,630. The lower level of projected household growth is based upon a demographic trend based scenario (Re-based SNPP 2010) which uses the latest demographic data available at the time of the research. The higher level of household change is estimated through the application of an employment-led constraint on the demographic projections (Employment-led LEFM scenario). Under this scenario the labour-force in the authority is balanced against the projected total number of jobs and therefore identifies the levels of household change required to create a better balance between the population, the labour force and the number of jobs that are forecast to be created in South Hams over the Local Plan period.

South Hams, Plymouth, Cornwall, West Devon & Dartmoor NP SHMNA Appendix 4 – South Hams Overview Report
October 2013 I gva.co.uk 50
Within South Hams internal migration (movement in and out of the authority from other parts of the UK) has represented a fundamental driver of change in population over recent years. The trend-based projections assume that this migration will continue in the future as shown within the following chart which shows the projected components of change under the Re-based 2010 SNPP scenario.
Figure 3.1: Components of Change Rebased 2010 SNPP
South Hams - Rebased 2010 SNPP Projected Components of Change
-800
-600
-400
-200
0
+200
+400
+600
+800
+1,000
2011
/12
2013
/14
2015
/16
2017
/18
2019
/20
2021
/22
2023
/24
2025
/26
2027
/28
2029
/2030
Pop
ula
tion
Cha
nge
Natural change Net Internal Migration Net International Migration
Source: Edge Analytics, 2013
The analysis in the SHMNA highlighted that this inflow of migrants historically has, at least in part, followed a similar trajectory of increased employment opportunities with the authority seeing an increase in total employment of 2,940 jobs between 2001 and 2010 or approximately 327 per annum. This overall increase masks the fact that in 2007 the authority had almost 41,600 total jobs with this falling by 2010 by some 2,400. Evidently the increase in employment levels over the projection period is likely, therefore, to have a bearing on future levels of migration. Under the Re-based 2010 scenario the labour-force would contract by some 2,500 people as a result of a general ageing of the population. This does not align with the outputs of the two economic forecasts presented within section 4 of the
South Hams, Plymouth, Cornwall, West Devon & Dartmoor NP SHMNA Appendix 4 – South Hams Overview Report
October 2013 I gva.co.uk 51
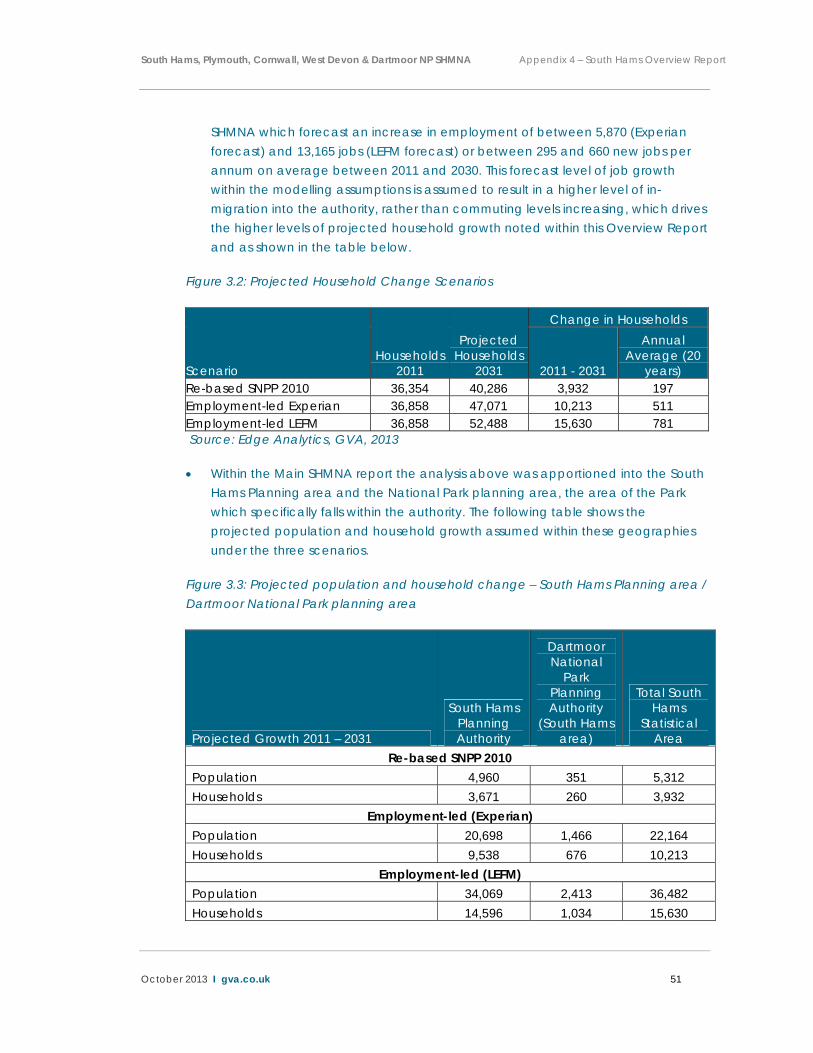
SHMNA which forecast an increase in employment of between 5,870 (Experian forecast) and 13,165 jobs (LEFM forecast) or between 295 and 660 new jobs per annum on average between 2011 and 2030. This forecast level of job growth within the modelling assumptions is assumed to result in a higher level of in-migration into the authority, rather than commuting levels increasing, which drives the higher levels of projected household growth noted within this Overview Report and as shown in the table below.
Figure 3.2: Projected Household Change Scenarios
Scenario Households
2011
Projected Households
2031
Change in Households
2011 - 2031
Annual Average (20
years) Re-based SNPP 2010 36,354 40,286 3,932 197 Employment-led Experian 36,858 47,071 10,213 511 Employment-led LEFM 36,858 52,488 15,630 781 Source: Edge Analytics, GVA, 2013
Within the Main SHMNA report the analysis above was apportioned into the South Hams Planning area and the National Park planning area, the area of the Park which specifically falls within the authority. The following table shows the projected population and household growth assumed within these geographies under the three scenarios.
Figure 3.3: Projected population and household change – South Hams Planning area / Dartmoor National Park planning area
Projected Growth 2011 – 2031
South Hams Planning Authority
Dartmoor National
Park Planning Authority
(South Hams area)
Total South Hams
Statistical Area
Re-based SNPP 2010 Population 4,960 351 5,312 Households 3,671 260 3,932
Employment-led (Experian) Population 20,698 1,466 22,164 Households 9,538 676 10,213
Employment-led (LEFM) Population 34,069 2,413 36,482 Households 14,596 1,034 15,630

South Hams, Plymouth, Cornwall, West Devon & Dartmoor NP SHMNA Appendix 4 – South Hams Overview Report
October 2013 I gva.co.uk 52
Source: GVA, Edge Analytics, 2013
It is evident that the South Hams planning area is projected to see an increase in households of between 3,670 and 14,600. This translates into a per annum requirement (on average) of between 183 and 730 households per annum.
Under all of the scenarios the population of the authority is projected to age. The following table shows the projected change in the age profile of the population under each of the modelled scenarios (note this relates to the full authority and not the planning authority area). This shows that under the Re-based SNPP 2010 scenario the number of persons aged 18 – 74 would decrease within the authority with this corresponding to a very small increase in the number of children. Under the employment-led scenarios this position is different as there is an assumption that working-age persons migrate into the authority. Significantly the table clearly shows that under all of the scenarios the number of older persons (those aged over 74) increases significantly. Under the Re-based SNPP 2010 scenario this age group makes up only 10.9% of the total population in 2011but by 2031 this is projected to increase to 17.3% of the population (between 14.3% and 15.7% of the population under the employment-led scenarios).
Figure 3.4: Projected change in the age profile of the population 2011 – 2031 – South Hams
Scenario
Projected Change in Population 2011 - 2031
0 - 17 18 - 74 74+ Re-based SNPP 2010 730 -1,688 6,269 Employment-led Experian 6,446 8,454 7,265 Employment-led LEFM 10,992 17,657 7,833
Source: Edge Analytics, GVA, 2013
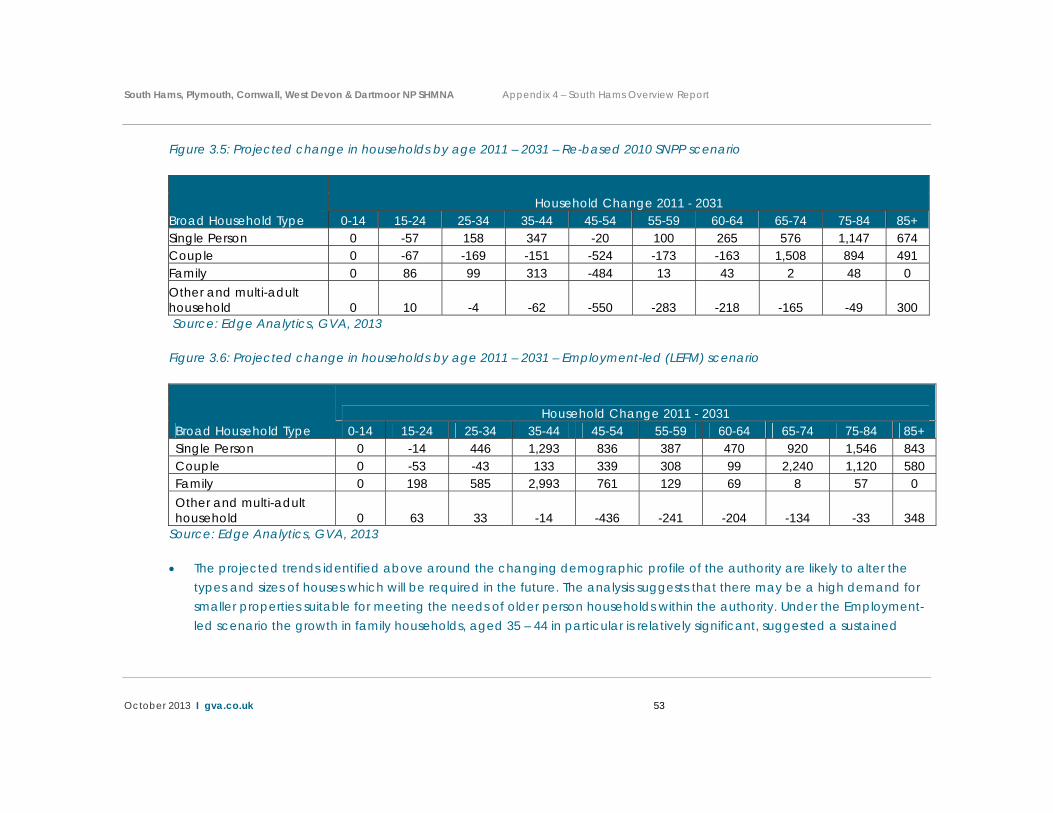
The types of household are also projected to change, with the ageing population noted above one influencing factor. Primarily, the projections show a notable uplift in single person and couple households with this driven in significant part by the increasing number of older person households. The following tables show the projected change in households by age group under the Re-based 2010 SNPP scenario and the Employment-led (LEFM) scenario. These scenarios are selected as they represent the full range in terms of the projected total scale in the increase in population and households.
South Hams, Plymouth, Cornwall, West Devon & Dartmoor NP SHMNA Appendix 4 – South Hams Overview Report
October 2013 I gva.co.uk 53
Figure 3.5: Projected change in households by age 2011 – 2031 – Re-based 2010 SNPP scenario
Broad Household Type Household Change 2011 - 2031
0-14 15-24 25-34 35-44 45-54 55-59 60-64 65-74 75-84 85+ Single Person 0 -57 158 347 -20 100 265 576 1,147 674 Couple 0 -67 -169 -151 -524 -173 -163 1,508 894 491 Family 0 86 99 313 -484 13 43 2 48 0 Other and multi-adult household 0 10 -4 -62 -550 -283 -218 -165 -49 300 Source: Edge Analytics, GVA, 2013
Figure 3.6: Projected change in households by age 2011 – 2031 – Employment-led (LEFM) scenario
Broad Household Type Household Change 2011 - 2031
0-14 15-24 25-34 35-44 45-54 55-59 60-64 65-74 75-84 85+ Single Person 0 -14 446 1,293 836 387 470 920 1,546 843 Couple 0 -53 -43 133 339 308 99 2,240 1,120 580 Family 0 198 585 2,993 761 129 69 8 57 0 Other and multi-adult household 0 63 33 -14 -436 -241 -204 -134 -33 348
Source: Edge Analytics, GVA, 2013
The projected trends identified above around the changing demographic profile of the authority are likely to alter the types and sizes of houses which will be required in the future. The analysis suggests that there may be a high demand for smaller properties suitable for meeting the needs of older person households within the authority. Under the Employment-led scenario the growth in family households, aged 35 – 44 in particular is relatively significant, suggested a sustained
South Hams, Plymouth, Cornwall, West Devon & Dartmoor NP SHMNA Appendix 4 – South Hams Overview Report
October 2013 I gva.co.uk 54
demand under this scenario for traditional family housing (3 and 4 bedroom), recognising that moderate and larger properties represent the aspirations for many households of different ages.

South Hams, Plymouth, Cornwall, West Devon & Dartmoor NP SHMNA Appendix 4 – South Hams Overview Report
October 2013 I gva.co.uk 55
DCLG Outputs 4, 5 and 6
The analysis of DCLG Outputs 4, 5 and 6 are interlinked. They involve the assessment of the breakdown of future needs for different tenures of housing. The emphasis within the DCLG Guidance is on understanding these tenure requirements over a shorter time frame.
Output 4 – Estimate of current number of households in housing need
There is a recognition that the balance of tenures across the authority has not to date fully met the housing needs of households. The market position summarised in the Current Market section highlighted the affordability issues facing many households, in particular newly forming households.
Analysis of waiting list data has been used to understand the current backlog of unmet need for affordable housing within South Hams. This has identified that:
There are 10 households currently classified as statutorily homeless and/or in temporary accommodation within South Hams, of which 1 household is within the Dartmoor National Park (Dartmoor Fringe sub-market);
In addition there are, based on the analysis of Bands A to D of the waiting list, 637 households classified as in significant need in South Hams (44 of which are in Dartmoor Fringe), 182 of which are currently living in social rented accommodation (11 of which are in Dartmoor Fringe). If those already living within social housing are removed - on the basis that there needs being met by another social house will free up their own property and therefore result in a zero gain supply / demand position – then this leaves a total of 465 (=10+637-182) households classified as in need currently within the authority (or 431 if the Dartmoor Fringe sub-market is excluded).
This clearly represents a relatively high level of unmet need for affordable housing which remains an important priority for the authority to address.
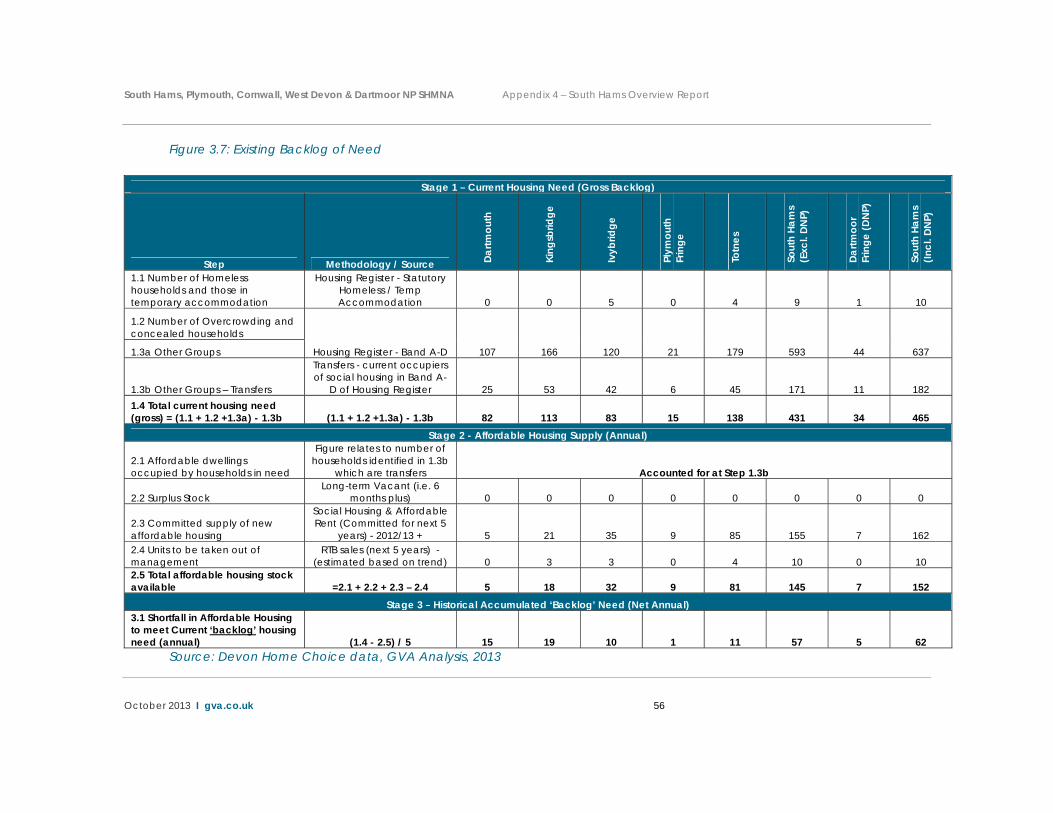
This existing backlog of need is not distributed evenly across the authority. The table over the page shows the sub-market breakdown of the backlog of houses classified as in need. This shows a shortfall in Affordable Housing to meet current ‘backlog’ housing need of 57 dwellings per annum excluding the Dartmoor National Park. A need for a further 5 dwellings per annum is identified as being associated with the National Park area, totalling 62 dwellings per annum for the whole local authority area.
South Hams, Plymouth, Cornwall, West Devon & Dartmoor NP SHMNA Appendix 4 – South Hams Overview Report
October 2013 I gva.co.uk 56
Figure 3.7: Existing Backlog of Need
Stage 1 – Current Housing Need (Gross Backlog)
Step Methodology / Source Dartm
outh
King
sbrid
ge
Ivyb
ridge
Plym
outh
Fr
inge
Totn
es
Sout
h Ha
ms
(Exc
l. DN
P)
Dartm
oor
Frin
ge (D
NP)
Sout
h Ha
ms
(Incl
. DN
P)
1.1 Number of Homeless households and those in temporary accommodation
Housing Register - Statutory Homeless / Temp Accommodation 0 0 5 0 4 9 1 10
1.2 Number of Overcrowding and concealed households
Housing Register - Band A-D 107 166 120 21 179 593 44 637 1.3a Other Groups
1.3b Other Groups – Transfers
Transfers - current occupiers of social housing in Band A-
D of Housing Register 25 53 42 6 45 171 11 182 1.4 Total current housing need (gross) = (1.1 + 1.2 +1.3a) - 1.3b (1.1 + 1.2 +1.3a) - 1.3b 82 113 83 15 138 431 34 465
Stage 2 - Affordable Housing Supply (Annual)
2.1 Affordable dwellings occupied by households in need
Figure relates to number of households identified in 1.3b
which are transfers Accounted for at Step 1.3b
2.2 Surplus Stock Long-term Vacant (i.e. 6
months plus) 0 0 0 0 0 0 0 0
2.3 Committed supply of new affordable housing
Social Housing & Affordable Rent (Committed for next 5
years) - 2012/13 + 5 21 35 9 85 155 7 162 2.4 Units to be taken out of management
RTB sales (next 5 years) - (estimated based on trend) 0 3 3 0 4 10 0 10
2.5 Total affordable housing stock available =2.1 + 2.2 + 2.3 – 2.4 5 18 32 9 81 145 7 152
Stage 3 – Historical Accumulated ‘Backlog’ Need (Net Annual) 3.1 Shortfall in Affordable Housing to meet Current ‘backlog’ housing need (annual) (1.4 - 2.5) / 5 15 19 10 1 11 57 5 62
Source: Devon Home Choice data, GVA Analysis, 2013
South Hams, Plymouth, Cornwall, West Devon & Dartmoor NP SHMNA Appendix 4 – South Hams Overview Report
October 2013 I gva.co.uk 57
Output 5 – Estimate of future households that will require affordable housing
The overall calculation of the amount of households requiring affordable housing is undertaken using the DCLG model set out within the SHMA Guidance note.
The model takes account of the backlog of current need identified under the previous DCLG Output, however, it also factors in the estimated annual future arising need to arrive at an overall net number of households requiring an affordable dwelling over the next five years. Prior to presenting the overall net annual need consideration is given first to calculating the annual net new need for affordable housing.
Calculating the Annual Net New Need for Affordable Housing
Calculating the annual net level of new affordable housing need enables the establishment of the annual ‘delivery gap’ of new affordable housing required to meet newly emerging affordable housing need over the next 5 years.
This therefore forms a separate element of the calculation to that presented for addressing the existing ‘backlog’. Instead, this element of the calculation evaluates the volume of households projected to form annually over the next 5 years alongside the volume of existing households expected to ‘fall into’ affordable housing need, and tests these elements against the number of affordable (social) lettings available to meet this need on an annual basis.
If there is a deficit of social lettings available to meet the annual level of new affordable housing need arising annually, this presents the annual ‘delivery gap’ of new affordable housing required over the next 5 years.
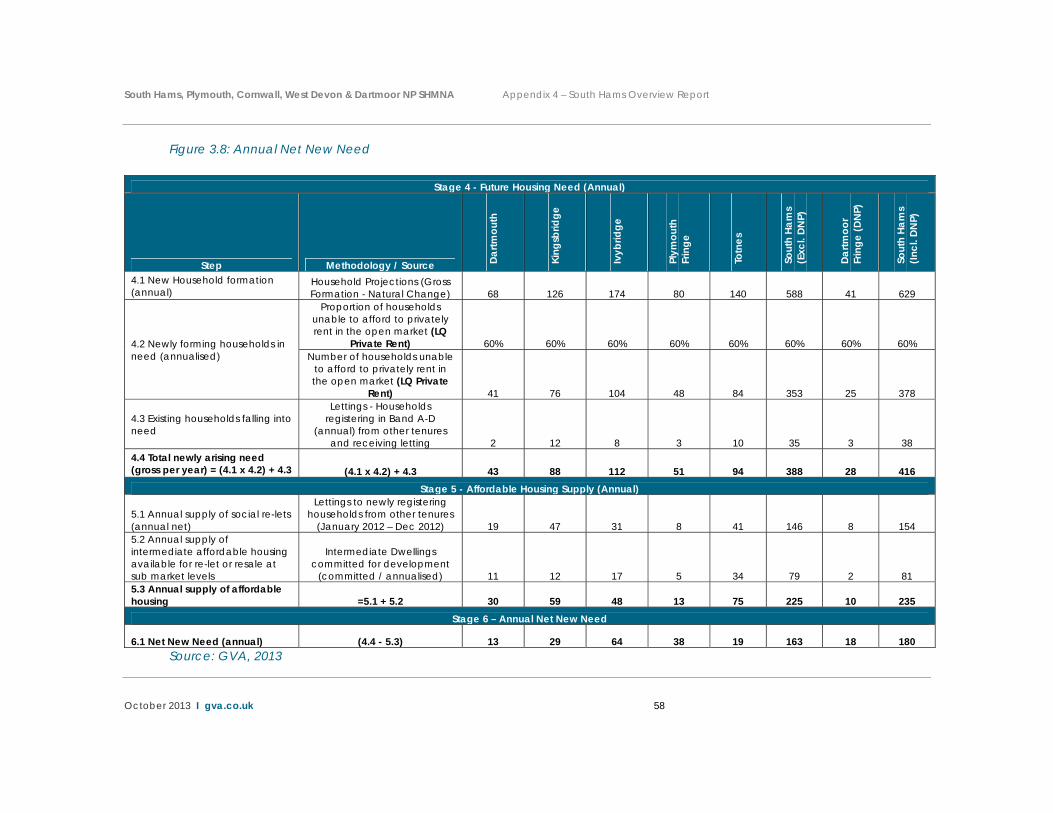
Figure 3.8 demonstrates that there is an annual deficit of 180 affordable homes available over the next 5 years to meet the level of newly arising affordable housing need arising annually in South Hams (of which 18 are situated within the Dartmoor Fringe). It should be noted that the figure presented excludes backlog of housing need which is dealt with separately above.
South Hams, Plymouth, Cornwall, West Devon & Dartmoor NP SHMNA Appendix 4 – South Hams Overview Report
October 2013 I gva.co.uk 58
Figure 3.8: Annual Net New Need
Stage 4 - Future Housing Need (Annual)
Step Methodology / Source Dartm
outh
King
sbrid
ge
Ivyb
ridge
Plym
outh
Fr
inge
Totn
es
Sout
h Ha
ms
(Exc
l. DN
P)
Dartm
oor
Frin
ge (D
NP)
Sout
h Ha
ms
(Incl
. DN
P)
4.1 New Household formation (annual)
Household Projections (Gross Formation - Natural Change) 68 126 174 80 140 588 41 629
4.2 Newly forming households in need (annualised)
Proportion of households unable to afford to privately rent in the open market (LQ
Private Rent) 60% 60% 60% 60% 60% 60% 60% 60% Number of households unable
to afford to privately rent in the open market (LQ Private
Rent) 41 76 104 48 84 353 25 378
4.3 Existing households falling into need
Lettings - Households registering in Band A-D
(annual) from other tenures and receiving letting 2 12 8 3 10 35 3 38
4.4 Total newly arising need (gross per year) = (4.1 x 4.2) + 4.3 (4.1 x 4.2) + 4.3 43 88 112 51 94 388 28 416
Stage 5 - Affordable Housing Supply (Annual)
5.1 Annual supply of social re-lets (annual net)
Lettings to newly registering households from other tenures
(January 2012 – Dec 2012) 19 47 31 8 41 146 8 154 5.2 Annual supply of intermediate affordable housing available for re-let or resale at sub market levels
Intermediate Dwellings committed for development
(committed / annualised) 11 12 17 5 34 79 2 81 5.3 Annual supply of affordable housing =5.1 + 5.2 30 59 48 13 75 225 10 235
Stage 6 – Annual Net New Need
6.1 Net New Need (annual) (4.4 - 5.3) 13 29 64 38 19 163 18 180 Source: GVA, 2013
South Hams, Plymouth, Cornwall, West Devon & Dartmoor NP SHMNA Appendix 4 – South Hams Overview Report
October 2013 I gva.co.uk 59
Net Annual Need for Affordable Housing
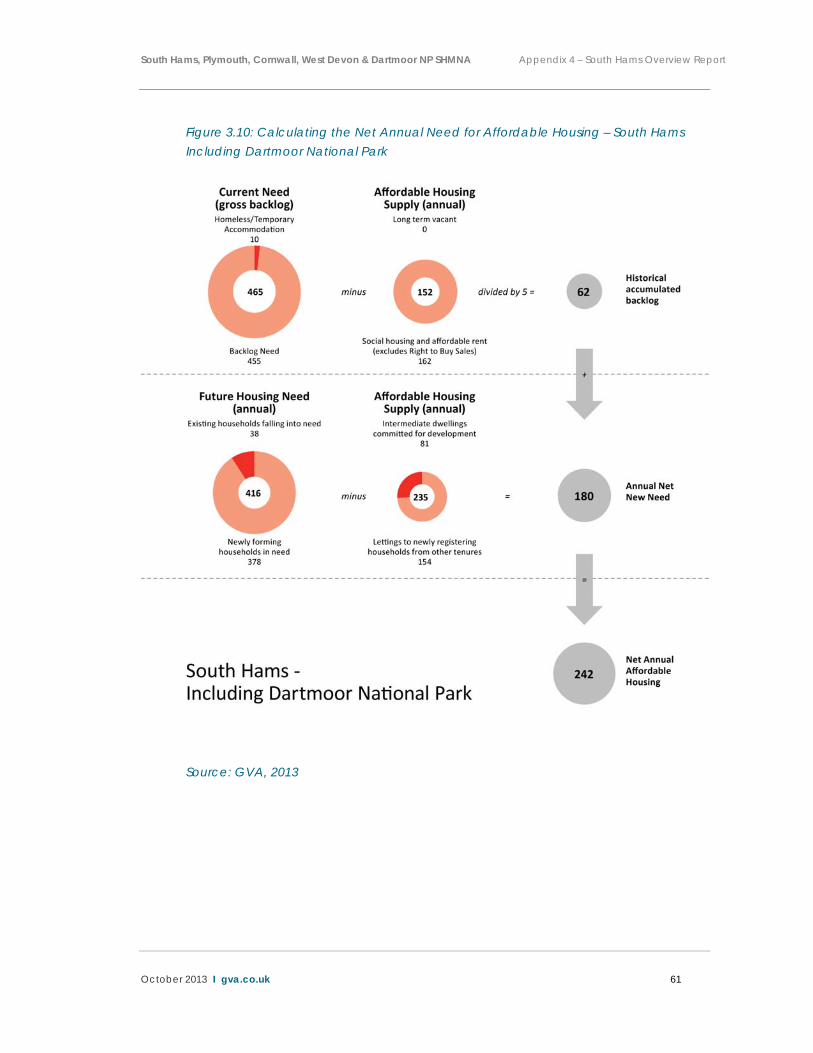
As described above the DCLG Guidance requires the calculation of an annual net need for affordable housing which brings together the amount of housing required to address the existing backlog as well as the estimated level of new need generated each year.
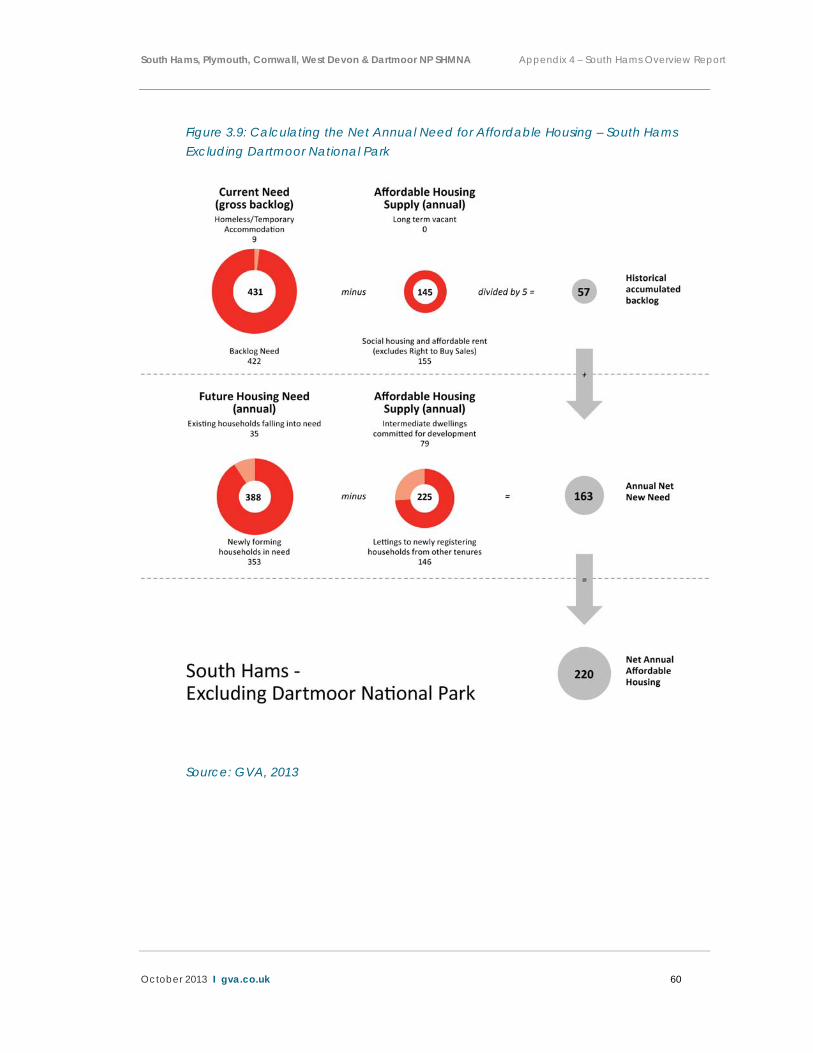
The overall calculation process and the input values, introduced in the analysis presented above, is illustrated in the following diagram. This shows that within South Hams there is a net annual need for affordable housing over the next five years of 242 affordable dwellings per annum (of which a need for 22 affordable dwellings per annum are situated within the Dartmoor Fringe). This combines both backlog need and newly arising need (ie. 62 units plus 180 units).
Figure 3.9 presents the breakdown by sub-market area.
South Hams, Plymouth, Cornwall, West Devon & Dartmoor NP SHMNA Appendix 4 – South Hams Overview Report
October 2013 I gva.co.uk 60
Figure 3.9: Calculating the Net Annual Need for Affordable Housing – South Hams Excluding Dartmoor National Park
Source: GVA, 2013
South Hams, Plymouth, Cornwall, West Devon & Dartmoor NP SHMNA Appendix 4 – South Hams Overview Report
October 2013 I gva.co.uk 61
Figure 3.10: Calculating the Net Annual Need for Affordable Housing – South Hams Including Dartmoor National Park
Source: GVA, 2013
South Hams, Plymouth, Cornwall, West Devon & Dartmoor NP SHMNA Appendix 4 – South Hams Overview Report
October 2013 I gva.co.uk 62
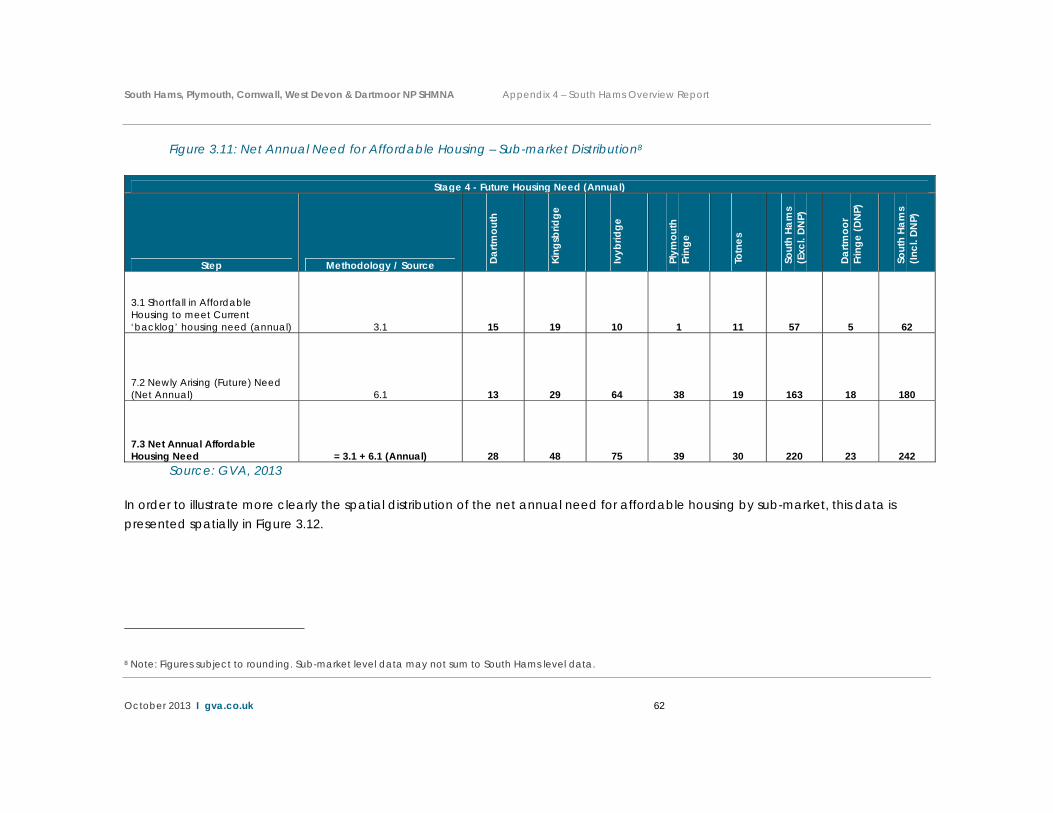
Figure 3.11: Net Annual Need for Affordable Housing – Sub-market Distribution8
Stage 4 - Future Housing Need (Annual)
Step Methodology / Source Dartm
outh
King
sbrid
ge
Ivyb
ridge
Plym
outh
Fr
inge
Totn
es
Sout
h Ha
ms
(Exc
l. DN
P)
Dartm
oor
Frin
ge (D
NP)
Sout
h Ha
ms
(Incl
. DN
P)
3.1 Shortfall in Affordable Housing to meet Current ‘backlog’ housing need (annual) 3.1 15 19 10 1 11 57 5 62
7.2 Newly Arising (Future) Need (Net Annual) 6.1 13 29 64 38 19 163 18 180
7.3 Net Annual Affordable Housing Need = 3.1 + 6.1 (Annual) 28 48 75 39 30 220 23 242
Source: GVA, 2013
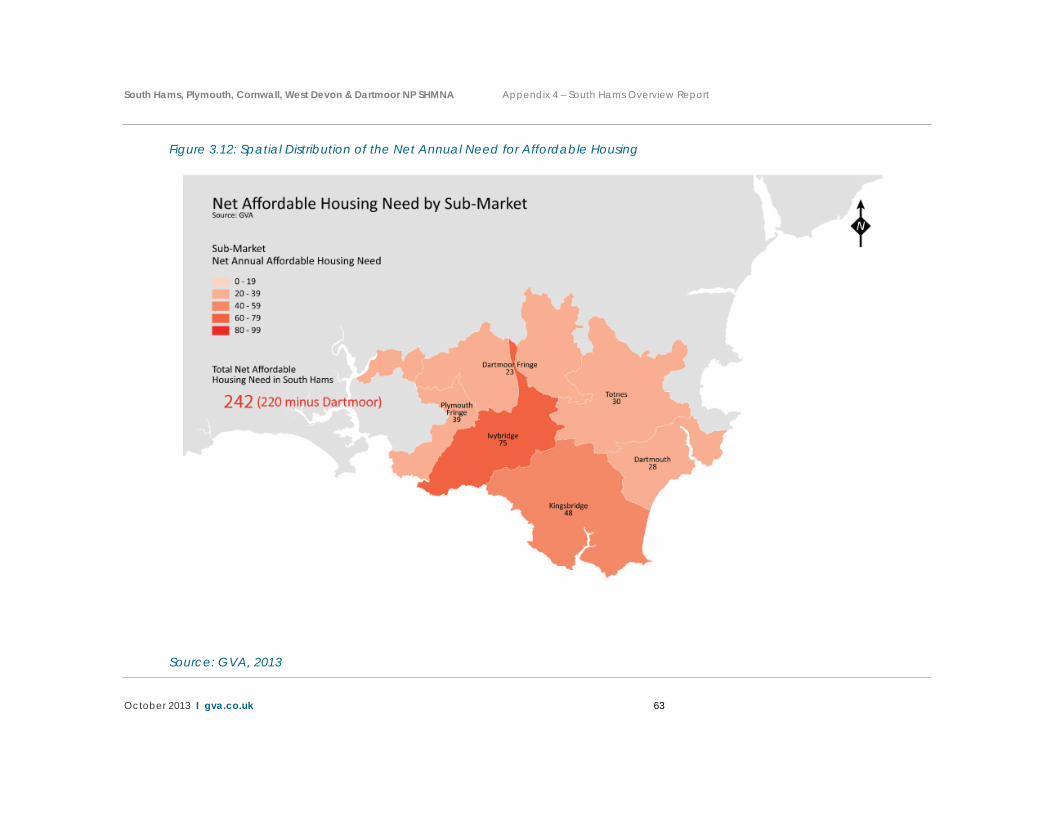
In order to illustrate more clearly the spatial distribution of the net annual need for affordable housing by sub-market, this data is presented spatially in Figure 3.12.
8 Note: Figures subject to rounding. Sub-market level data may not sum to South Hams level data.
South Hams, Plymouth, Cornwall, West Devon & Dartmoor NP SHMNA Appendix 4 – South Hams Overview Report
October 2013 I gva.co.uk 63
Figure 3.12: Spatial Distribution of the Net Annual Need for Affordable Housing
Source: GVA, 2013
South Hams, Plymouth, Cornwall, West Devon & Dartmoor NP SHMNA Appendix 4 – South Hams Overview Report
October 2013 I gva.co.uk 64
Importantly the SHMNA has looked at the range of products now classified as affordable housing to understand the roles they can play in meeting the needs of the households identified as requiring this tenure of housing. These are considered below:
Social Rent – This represents the traditional tenure of affordable housing. The analysis of the following tenure product is considered against access to social rented housing which continues to represent the majority of ‘affordable stock’ across South Hams.
Intermediate Housing – The SHMNA identified that in South Hams this type of affordable housing could reasonably meet 12% of the overall level of need for affordable housing identified. This is in part reflective of the capacity of the committed pipeline of intermediate affordable housing in South Hams to meet housing needs. Within South Hams there is a strong annual supply of intermediate housing already committed for development within the district. It is also based on the capacity of households to afford access to this tenure based upon setting the upper limit for accessing intermediate products at the income required to access the private market (in line with the housing needs assessment). The lower limit was set at the income required to afford a 55% equity share in a small family house at the lower quartile price. This has been set to allow for a 50% equity purchase alongside a 5% deposit.
Output 6 – Estimate of future households requiring market housing
The analysis undertaken to inform Output 5 shows that in South Hams 40%9 of newly forming households are able to afford market housing of some form over the short-term.
The analysis undertaken to inform Output 3 is used within the main SHMNA report to identify a range of housing requirements needed to meet generated demand from a growing household base. This takes into account an allowance for an assumed future quantum of vacant properties to allow for turnover. The range of identified housing requirements for all tenures are shown in the table below.
9 Note: Step 4.2 in Figure 3.8 shows that 60% of newly forming households cannot afford market housing, with 40% therefore able to afford these tenures (owner occupation and/or private rented)
South Hams, Plymouth, Cornwall, West Devon & Dartmoor NP SHMNA Appendix 4 – South Hams Overview Report
October 2013 I gva.co.uk 65
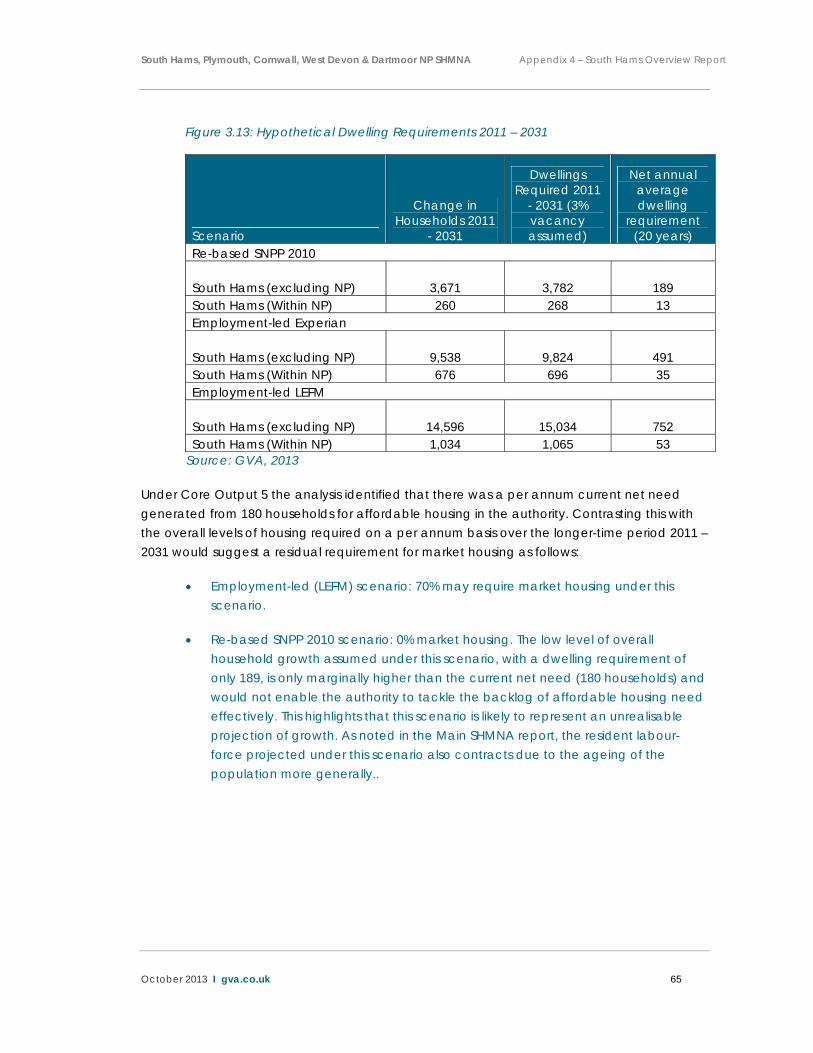
Figure 3.13: Hypothetical Dwelling Requirements 2011 – 2031
Scenario
Change in Households 2011
- 2031
Dwellings Required 2011
- 2031 (3% vacancy assumed)
Net annual average dwelling
requirement (20 years)
Re-based SNPP 2010
South Hams (excluding NP) 3,671 3,782 189 South Hams (Within NP) 260 268 13 Employment-led Experian
South Hams (excluding NP) 9,538 9,824 491 South Hams (Within NP) 676 696 35 Employment-led LEFM
South Hams (excluding NP) 14,596 15,034 752 South Hams (Within NP) 1,034 1,065 53
Source: GVA, 2013
Under Core Output 5 the analysis identified that there was a per annum current net need generated from 180 households for affordable housing in the authority. Contrasting this with the overall levels of housing required on a per annum basis over the longer-time period 2011 – 2031 would suggest a residual requirement for market housing as follows:
Employment-led (LEFM) scenario: 70% may require market housing under this scenario.
Re-based SNPP 2010 scenario: 0% market housing. The low level of overall household growth assumed under this scenario, with a dwelling requirement of only 189, is only marginally higher than the current net need (180 households) and would not enable the authority to tackle the backlog of affordable housing need effectively. This highlights that this scenario is likely to represent an unrealisable projection of growth. As noted in the Main SHMNA report, the resident labour-force projected under this scenario also contracts due to the ageing of the population more generally..
South Hams, Plymouth, Cornwall, West Devon & Dartmoor NP SHMNA Appendix 4 – South Hams Overview Report
October 2013 I gva.co.uk 66
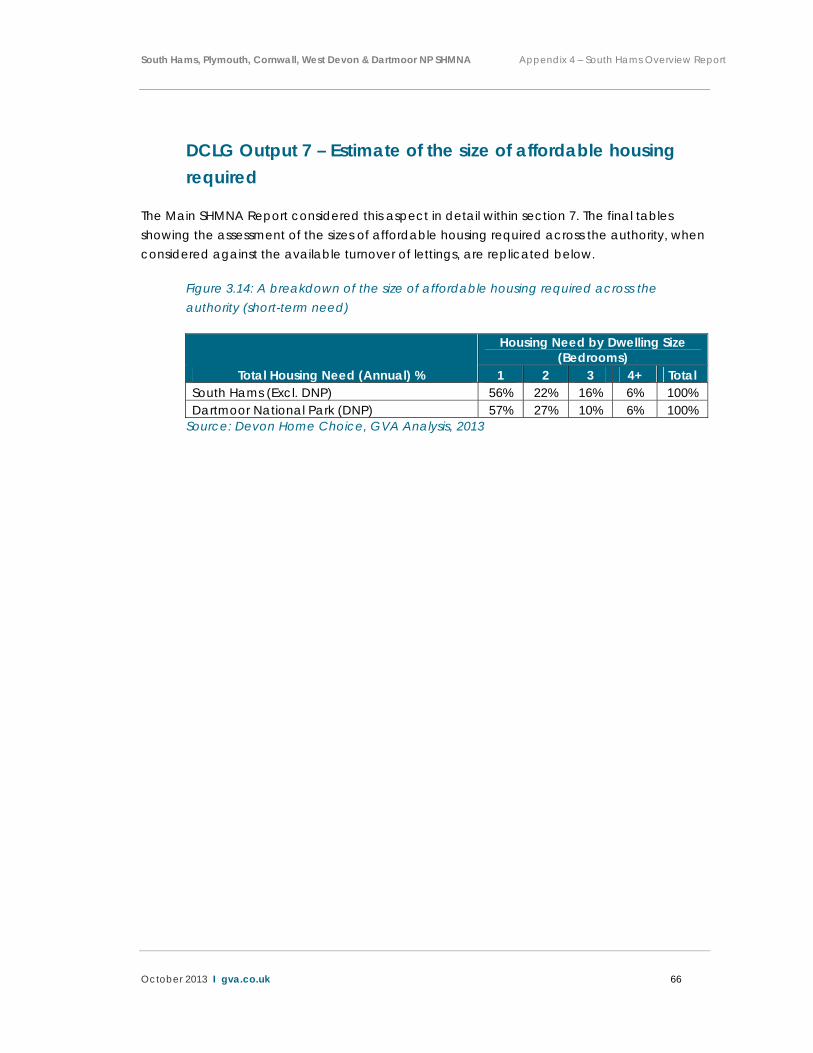
DCLG Output 7 – Estimate of the size of affordable housing required
The Main SHMNA Report considered this aspect in detail within section 7. The final tables showing the assessment of the sizes of affordable housing required across the authority, when considered against the available turnover of lettings, are replicated below.
Figure 3.14: A breakdown of the size of affordable housing required across the authority (short-term need)
Total Housing Need (Annual) %
Housing Need by Dwelling Size (Bedrooms)
1 2 3 4+ Total South Hams (Excl. DNP) 56% 22% 16% 6% 100% Dartmoor National Park (DNP) 57% 27% 10% 6% 100%
Source: Devon Home Choice, GVA Analysis, 2013
South Hams, Plymouth, Cornwall, West Devon & Dartmoor NP SHMNA Appendix 4 – South Hams Overview Report
October 2013 I gva.co.uk 67
Conclusion – Bringing the Evidence Together The analysis has been presented throughout the Appendix document to illustrate findings against the Core Outputs as set within the DCLG Guidance.
This section rather than reiterating these findings provides a short synopsis of the implications of the findings of the SHMA for policy and strategy development within South Hams.
Ensuring a Balanced Housing Market
Over the plan period it is important that policy and strategy aid in delivering a housing market which matches the needs and requirements of the authority’s current and future residents. The following conclusions of the research are therefore important in achieving this goal:
The modelling of future population projections indicates that there will be a sustained need for new housing to meet the needs of a growing population linked to historic demographic trends and the future levels of jobs forecast to be created in the authority.
In total the SHMNA suggests that there will be a requirement for between 189 and 752 dwellings per annum between 2011/12 and 2030/31 to meet the demands generated by new household formation arising from demographic and economic changes.
The analysis of the current need for affordable housing in the authority over the next five years indicates a high demand for this tenure. An annual need of 242 affordable properties is calculated as being required to meet the future needs over the next five years and the existing backlog (with 22 of these required within the Dartmoor Fringe sub-market in the Dartmoor National Park). This reflects the impact of rising house prices over the first half of the last decade and the continued pressures on wages as well as the availability of mortgage finance. It also reflects the fact that affordable housing makes up a relatively low proportion of the overall stock in South Hams currently, approximately 11%, a proportion which is considerably below the national average of 17%.
The changing age profile of the projected population of the authority indicates that the authority will increasingly see skewing of its population to older persons, with this moderated under projections linked to scenarios of job growth through the in-migration of working age persons. Overall the number of older persons is projected to increase significantly, indeed the projections suggest that those aged over 75 will make up approximately between 14% and 17% of the total
South Hams, Plymouth, Cornwall, West Devon & Dartmoor NP SHMNA Appendix 4 – South Hams Overview Report
October 2013 I gva.co.uk 68
population by 2031 (depending on the scenario considered) compared to just over 11% now.
In addition to older person households the projections also indicate that in order to maintain a level of working age population to match employment opportunities that there will be a sustained need for family housing within the authority.
Specifically in terms of affordable housing the analysis indicates that there will be a high demand for smaller properties, 1 – 2 bed, with need for this size of property making up 78% of total need (in the sub-markets excluding the Dartmoor National Park). Importantly, however, the lower levels of turnover in larger properties also suggests that in order to address future need and the current backlog new larger affordable properties will also be required.
Recognising the Impact of the Current Housing Market Context
Whilst the SHMNA sets out a detailed evidence base documenting demand and housing need drivers it also recognises the challenges posed by current market conditions.
Whilst the SHMNA analysis has evidenced a sustained need for affordable housing tenures over the plan period the current market and finance context presents a significant potential obstacle to delivering sufficient numbers of affordable housing to address need. The following recommendations need to be considered in the setting of policy:
Reduction in the availability of grant monies to aid in the delivery of affordable housing places greater pressure on delivering affordable housing tenures through traditional Planning Obligation approaches. This requires a pro-active and responsive approach to enabling more viable housing sites to come forward earlier in the plan period. A pro-active approach in encouraging the delivery of more viable housing sites will be important in addressing the wider demand for all tenures of housing and assist in ensuring that the ability of households to purchase housing is not further worsened through a continued lack of supply, which is likely to continue to drive up house prices.
A careful balance is required in terms of other competing requirements through Planning Obligations if the delivery of affordable housing is to be prioritised. This includes the future setting of CIL targets and the balancing of aspirations to deliver other linked improvements for example green space or off-site community benefits.

South Hams, Plymouth, Cornwall, West Devon & Dartmoor NP SHMNA Appendix 4 – South Hams Overview Report
October 2013 I gva.co.uk 69
The recognition that the needs of households will need to be met through a spectrum of different affordable housing products. The SHMNA analysis has indicated that whilst a notable proportion of households in need will require social housing other affordable products including Intermediate tenure properties will be able to address the needs of some households and should therefore form part of any new provision delivered across South Hams.