Embed Size (px)
Citation preview

7/25/2019 Strategic Infrastructure Steps Report 2014
http://slidepdf.com/reader/full/strategic-infrastructure-steps-report-2014 1/88
Strategic InfrastructureSteps to Operate and
Maintain InfrastructureEfficiently and Effectively
April 2014
Prepared in collaboration with The Boston Consulting Group
Industry Agenda

7/25/2019 Strategic Infrastructure Steps Report 2014
http://slidepdf.com/reader/full/strategic-infrastructure-steps-report-2014 2/88
© World Economic Forum
2014 - All rights reserved.
No part of this publication may be reproduced or transmitted in any form or by any means,
including photocopying and recording, or by any information storage and retrieval system.
The views expressed are those of certain participants in the discussion and do not necessarily
reflect the views of all participants or of the World Economic Forum.
REF 180314
7/25/2019 Strategic Infrastructure Steps Report 2014
http://slidepdf.com/reader/full/strategic-infrastructure-steps-report-2014 3/88
3Steps to Operate and Maintain Infrastructure Efficiently and Effectively
Contents
3 Foreword
6 Contributors
7 Context and Objectives of the Report8 Executive Summary
13 Overview of the StrategicInfrastructure Initiative
14 Introduction: The Operations andMaintenance (O&M) Imperative
14 The Global Infrastructure Gap
15 The O&M Opportunity
17 The O&M Challenges
19 A Framework for O&M BestPractices
24 1. Implementing O&M Best Practices
24 1.1 Maximize asset utilization
32 1.2 Enhance quality for users
36 1.3 Reduce O&M costs
42 1.4 Mitigate externalities
45 1.5 Extend asset life
52 1.6 Reinvest with a life cycle view
58 2. Enabling O&M Best Practices58 2.1 Ensure funding
63 2.2 Build capabilities
69 2.3 Reform governance
74 3. The Way Forward
78 4. O&M Case Study: The PanamaCanal Authority
82 Endnotes
Foreword
Foreword by the World Economic Forum
Today’s global infrastructure demand is estimated at about US$ 4 trillion in annual
expenditure with a gap – or missed opportunity – of at least US$ 1 trillion every year.One of the most important areas for investment globally is indeed infrastructure. Thisspecific asset class should be put into perspective when addressing the needs of thefastest growing populations, namely, Africa and Asia. In spite of the growing gap inbuilding new infrastructure it should be emphasized that the worldwide stock of existinginfrastructure is worth about US$ 50 trillion, which is of the same order of magnitudeas the global stock market capitalization (US$ 55 trillion) and comparable, to a certainextent, to the global GDP (US$ 72 trillion). This existing stock offers a tremendousopportunity to narrow the infrastructure gap if governments are capable and willing tooptimize the operations and maintenance (O&M) of their infrastructure assets.
A country’s competitive economic advantage clearly depends on a properly articulatedinfrastructure vision and long-term planning. Government leaders must inspect theirproject portfolios critically and decide which ones to accelerate first based on their
strategic importance, independently of the restricted duration of a political cycle.However, vision and planning are not sufficient and it is fundamental that governmentslearn how to assess and select an appropriate infrastructure delivery model at the earlystages of the project preparation process and are fully aware of the implementationconsequences in terms of whole life-cycle cost. In addition, governments need todevelop a holistic and long-term strategy for operating and maintaining their physicalassets that may represent a considerable financial burden for future taxpayers.
The World Economic Forum’s Strategic Infrastructure Initiative is a collaborativereflection of the steps required to efficiently and effectively deliver economicinfrastructure projects. The Initiative, with its linkages to the B20 and G20, and itscumulative track-record of pan-regional engagement of the private sector, governmentand civil society, has identified the following key challenges to date: the prioritization ofinfrastructure projects in a robust and bankable project pipeline; the acceleration of theproject preparation process; and the selection of the most adequate project deliverymodel. However, these challenges are often only the tip of the iceberg given that theseinfrastructure assets will be operated for 20, 30 or more years after initial construction.In fact, governments have to properly manage their stock of public infrastructure butare often much more interested in building new assets. This tempting choice may notbe optimal given the opportunity of better managing the existing infrastructure stock byoptimizing their utility and lifetime – at a reasonable cost. In reality, many governmentsstruggle to achieve high O&M performance due to insufficient funding, weak capabilitiesand inadequate O&M governance.
This report assumes that infrastructure assets have already been built, after beingselected and prioritized on the basis of a country’s infrastructure vision and plan, anddelivered with the most adequate procurement model – whether a public-private
partnership or not. In this context, the four best-practice areas concerning O&Mcovered in this report are: (i) increase utility; (ii) decrease total cost; (iii) increase lifetimevalue; and (iv) policy enablers. For each of these best-practice areas the report identifiesand illustrates three critical success factors that governments should be aware of andshould seriously consider for their O&M strategies.
The Strategic Infrastructure Initiative – and its Knowledge Series Reports – has beenproviding a roadmap to steer governments and key stakeholders to comprehensiveframeworks and actionable best practices that cover the whole infrastructure life-cycle,namely, origination, preparation and implementation of physical assets. This report isthe last volume in this series and is focused on project implementation, namely theO&M of existing infrastructure assets – an often neglected and yet critical practice. Thefuture of the World Economic Forum’s work will fold into the broader umbrella of theGlobal Strategic Infrastructure Initiative, which will continue to carve out an exceptional
space for a number of regional and national discussions in the years to come, includingLatin America and Asia and also Europe and North America. These efforts will continueto substantiate the globally acquired body of knowledge and experience into concretemeasures that contribute to boosting strategic infrastructure development.
7/25/2019 Strategic Infrastructure Steps Report 2014
http://slidepdf.com/reader/full/strategic-infrastructure-steps-report-2014 4/88
4 Steps to Prepare and Accelerate Public-Private Partnerships
This report is a direct result of a cooperative process with leaders from government,civil society and the private sector, particularly the engineering and construction,financial services and investors industries. In this regard, we would like to thankand acknowledge the World Economic Forum partner companies that served onthe Strategic Infrastructure Initiative Steering Committee: ABB; Alcoa; AMEC; Arup;Bilfinger; CCC, CH2M HILL; CVC Capital Partners; Danfoss; Fluor Corporation; GE;Hindustan Construction Company; Kokusai Kogyo (Japan Asia Group); LeightonHoldings; Prudential; Punj Lloyd; The Rockefeller Foundation; Siemens; SNC-Lavalin Group; Toshiba and Welspun Corporation. We would like to give special
acknowledgement to Hamish Tyrwhitt (Chief Executive Officer, Leighton Holdings2011-2014) for his relentless interest and commitment to serve as chair of the StrategicInfrastructure Initiative from spring 2012 to spring 2014.
We would also like to thank the many experts who contributed to the report throughtheir role on the Strategic Infrastructure Initiative Advisory Committee: Norman Anderson (CG/LA Infrastructure); Gordon Brown (Prime Minister of the UnitedKingdom 2007-2010); Victor Chen Chuan (University of Sichuan); Nathalie Delapalme(Mo Ibrahim Foundation); Angelo Dell’Atti (IFC); Clive Harris (World Bank Institute);Franziska Hasselmann (ETH Zurich); Rajiv Lall (IDFC); Yves Leterme (OECD); ClareLockhart (Institute for State Effectiveness); Thomas Maier (EBRD); Mthuli Ncube(African Development Bank); Aris Pantelias (University College London); Mark Romoff(Canadian Council for Public- Private Partnerships); Douglas Stollery (Stollery CharitableFoundation); Shamsuddeen Usman (Minister of National Planning Commission of
Nigeria 2011-2013) and James Zhan (UNCTAD).
Nicolás Mariscal Torroella (Chairman, Grupo Marhnos) and José Fortes Méndez(Director of Infrastructure, Grupo Marhnos) are kindly acknowledged for discussing andproviding us with the material necessary for the preparation of the O&M case studyon the Tlalnepantla Hospital. Roberto Roy, Minister for Canal Affairs, Panama, is alsoacknowledged for the fruitful discussions in Panama City in October 2013 which servedas the basis for the O&M case study on the Panama Canal Authority that is includedin this report. Jorge Quijano, Chief Executive Officer, Panama Canal Authority, is alsoacknowledged for granting us access to his technical staff and carrying out interviewsusing the O&M checklist developed in this report.
Finally, we would like to thank the cross-fertilization brought about by the membersof the Global Agenda Council on Infrastructure, chaired by Thomas Maier (EBRD) andthe Global Agenda Council on Long-term Investing, chaired by Danny Truell (Wellcome Trust).
The experience, perspective and guidance of all the above people and organizationscontributed substantially to a number of remarkable discussions with particularhighlights at the World Economic Forum on Africa, Cape Town, May 2013, at theSummit on the Global Agenda, Abu Dhabi, November 2013, and the World EconomicForum Annual Meeting 2014 in Davos-Klosters.
Alex Wong
Senior DirectorHead of Centre for Global Industries (Geneva)
Pedro Rodrigues de AlmeidaDirectorHead of Infrastructure & Urban Development Industries
7/25/2019 Strategic Infrastructure Steps Report 2014
http://slidepdf.com/reader/full/strategic-infrastructure-steps-report-2014 5/88
5Steps to Operate and Maintain Infrastructure Efficiently and Effectively
Foreword by the European Bank for Reconstruction andDevelopment (EBRD)
Over the past several years, the discussion with respect to infrastructure investmenthas been punctuated by calls for more resources to be made available to close the“financial gap” between the current global levels of investment compared with theestimated global need. Systemic uplift in the levels of investment must happen todrive global economic growth, job creation and improved competitiveness. The workof the World Economic Forum, in close coordination with the Russian and Australian
presidencies of G20 and B20, has helped to forge a new consensus on the drivers forthe infrastructure gap and its underlying issues. While financing is, of course, essential,the infrastructure gap can mostly be explained by other overriding factors, namelyinsufficient numbers of projects that come to the market and which are based onadequate structures and optimal life-cycle costing, and are driven by a solid underlyingeconomic case.
This report makes a valuable contribution to the debate by highlighting and explainingthe importance of operations and maintenance (O&M) of existing infrastructurestocks. Given the sheer value of these sunken assets, the report rightly points outhow countries and cities, particularly in the emerging markets, can extract higheconomic value by ensuing that the full asset value of these assets are extracted overthe entire planned life-cycle of each asset. Indeed, if existing infrastructure is not well-maintained, countries often face a costly conundrum of political and social pressures to
pursue much more costly greenfield projects, some of which may have been avoided(or at least postponed by several years) if rigorous approaches to O&M had beenimplemented from the outset. Given the general state of fiscal constraints prevailing inmany countries today, the importance of O&M aspects is brought into stark relief.
Finally, it is crucial to remember that proper O&M is part and parcel of high-qualityservice orientation for users, and this user-based focus is what drives their willingnessto pay for services and thus underpins funding sustainability. As such, effective O&Mand asset management approaches for existing infrastructure provide a blueprint forsustainable greenfield investment of the future.
While the report recognizes that the set of answers towards improving the status quo isby nature complex and multifaceted – and touches on the need for example to deepeninstitutional strengthening and capacity across the board – it also makes a valuablecontribution towards highlighting a host of tried and tested guiding principles and bestpractices that have been shown to produce good results. In that respect, it deserveswide dissemination both among the public and private sectors, and across the broadspectrum of investors in infrastructure.
Thomas MaierGAC Infrastructure Chair andManaging Director of Infrastructure,European Bank for Reconstructionand Development (EBRD)
7/25/2019 Strategic Infrastructure Steps Report 2014
http://slidepdf.com/reader/full/strategic-infrastructure-steps-report-2014 6/88
6 Steps to Operate and Maintain Infrastructure Efficiently and Effectively
Contributors
Project Team
Christoph RothballerProject Manager, Strategic Infrastructure
InitiativeMarie Lam-Frendo Associate Director, Head of InfrastructureInitiatives
Hanseul Kim Associate Director, Head of Engineering &Construction Industry
Editors
World Economic Forum
Alex WongSenior Director, Head of the Centre forGlobal Industries
Pedro Rodrigues de AlmeidaDirector, Head of Infrastructure & UrbanDevelopment Industries
The Boston Consulting Group (Adviserand Knowledge Partner)
Philipp GerbertSenior Partner, Global Head of Infrastructure
Marco AiroldiSenior Partner, Global Head of TransportInfrastructure
Jeff Hill
Partner, Head of Engineering & Construction Americas
Jan JustusPrincipal, Infrastructure Expert
Strategic Infrastructure SteeringCommittee
ABB– Roman Schafer, Head of Business
Intelligence, Corporate Strategy– Chief Executive Officer: Ulrich
Spiesshofer
Alcoa
– Kevin McKnight, Chief SustainabilityOfficer and Vice-President, Environment,Health and Safety
– Chairman and Chief Executive Officer:Klaus Kleinfeld
AMEC– Duncan Guy, Senior Vice-President and
Head of Government Relations– Chief Executive Officer: Samir Brikho
Arup– Peter Scuderi, Associate Director,
Strategic Asset Management– Chairman-Elect: Gregory Hodkinson
Bilfinger– Joerg Weidner, Senior Manager,
Technology Centre– Chairman of the Executive Board:
Roland Koch
CH2M HILL– Jason Adkisson, Senior Corporate
Counsel– Chief Executive Officer: Jacqueline
Hinman
Consolidated Contractors Company– Chafic Ladkani, Senior Financial Analyst,
Treasury– President, Engineering & Construction:
Samer S. Khoury
CVC Capital Partners– Stephen Vineburg, Partner and Chief
Executive Officer, Infrastructure– Managing Partner: Donald Mackenzie
Danfoss– Fleming Voetmann, Head of Public
Affairs and Leadership Communication– President and Chief Executive Officer:
Niels Christiansen
Fluor Corporation– Robert Prieto, Senior Vice-President– Stephen Dobbs, Senior Group President– Chairman and Chief Executive Officer:
David T. SeatonGE– Jay Ireland, Chief Executive Officer, GE
Africa– Nils Tcheyan, Head, Africa Policy– Chairman and Chief Executive Officer:
Jeffrey R. Immelt
Hindustan Construction Company– Arjun Dhawan, President, Infrastructure
Business– Chairman and Managing Director: Ajit
Gulabchand
Kokusai Kogyo (Japan Asia Group)– Kiyoaki Sugiyama, Executive Officer
– Chairperson and Chief Executive Officer:Sandra Wu
Leighton Holdings– Patrick Brothers, Chief Development
Officer– Chief Executive Officer: Hamish Tyrwhitt
Prudential– Pierre-Olivier Bouée, Group Chief Risk
Officer– Group Chief Executive: Tidjane Thiam
Punj Lloyd– Luv Chhabra, Director of Corporate
Affairs
– Chairman: Atul Punj The Rockefeller Foundation– Michael Berkowitz, Managing Director– President: Judith Rodin
Siemens– Roland Busch, Member of the Managing
Board and Chief Executive Officer,Infrastructure and CitiesSector
– Chief Executive Officer: Joe Kaeser
Skanska– Nick Doherty, Executive Vice-President– President and Chief Executive Officer:
Johan Karlström
SNC-Lavalin– Christian Jacqui, Executive Vice-
President, Global Operations– President and Chief Executive Officer:
Robert G. Card
Toshiba– Shoji Takenaka, Global Vice-President,
Smart Community Division– President and Chief Executive Officer:
Hisao Tanaka
Welspun Corporation– Vineet Mittal, Co-Founder and Managing
Director, Welspun Energy– Chairman: Balkrishan Goenka
Strategic Infrastructure AdvisoryCommittee
Norman AndersonPresident and Chief Executive Officer, CG/ LA Infrastructure
Victor Chen ChuanProfessor of Engineering Management,Business School, Sichuan University
Nathalie DelapalmeDirector of Research and Policy, Mo IbrahimFoundation
Angelo Dell’Atti
Manager, International Finance Corporation(IFC)
Clive HarrisPractice Manager, Public-PrivatePartnerships, World Bank Institute
Franziska HasselmannSenior Research Associate, Institutefor Construction and InfrastructureManagement, ETH Zurich and Swiss PostChair in Management of Network Industries,EPFL
Rajiv LallExecutive Chairman, InfrastructureDevelopment Finance Company
Yves LetermeDeputy Secretary-General, Organisation forEconomic Co-operation and Development
Clare LockhartDirector and Co-Founder, Institute for StateEffectiveness
Thomas MaierManaging Director, Infrastructure, EuropeanBank for Reconstruction and Development(EBRD)
Mthuli NcubeChief Economist and Vice-President, AfricanDevelopment Bank
Aristeidis PanteliasLecturer and Course Director, MScInfrastructure Investment and Finance, TheBartlett School of Construction & ProjectManagement, University College London
Mark Romoff President and Chief Executive Officer, The Canadian Council for Public-PrivatePartnerships
Douglas StolleryMember of the Board of Directors, StolleryCharitable Foundation
Shamsuddeen UsmanMinister for National Planning (2011–2013)
of NigeriaJames X. ZhanDirector, Investment and Enterprise,United Nations Conference on Trade andDevelopment (UNCTAD)
7/25/2019 Strategic Infrastructure Steps Report 2014
http://slidepdf.com/reader/full/strategic-infrastructure-steps-report-2014 7/88

7/25/2019 Strategic Infrastructure Steps Report 2014
http://slidepdf.com/reader/full/strategic-infrastructure-steps-report-2014 8/88

7/25/2019 Strategic Infrastructure Steps Report 2014
http://slidepdf.com/reader/full/strategic-infrastructure-steps-report-2014 9/88
9Steps to Operate and Maintain Infrastructure Efficiently and Effectively
Figure 2: Checklist of O&M Best Practices/Critical Success Factors
in the inner circle) for policy-makersto create the conditions that willenable sustainable O&M. The threeimplementation strategies thatinfrastructure operators shouldembrace are:
– Increasing the utility of infrastructure,by maximizing asset utilization andenhancing the quality for users
– Decreasing the total cost ofinfrastructure, by reducing O&Mcosts and mitigating environmentaland social externalities
– Increasing infrastructure’s valueover its lifetime, by extending assetlifetime and reinvesting from theperspective of a whole life cycle
The report not only recommendsspecific actions for improving O&M, butalso addresses the root causes of O&Munderperformance, such as insufficientfunding, immature capabilities andinappropriate governance structures.
To make high-performance O&Msustainable, policy-makers needto consider the three enablementstrategies:
– Ensuring stable and sufficient
funding– Building institutional and individual
capabilities
– Reforming governance
For each of the best practice areas,the report identifies the critical successfactors that governments and operatorsshould take into consideration (Figure2). While many governments andoperators already apply some of theselevers, they often neglect to consider
all the levers systematically, and so failto reap the full optimization potential.By assessing their country’s or asset’smaturity in each critical success factor,and the relevance of that factor to the
specific context, governments andoperators can use this checklist toidentify and prioritize the areas wherechange is required.
Implementation Best Practices
1.1 Maximize asset utilization. Giventhe challenge of congestion and publicfinancial constraints (and sometimesspace constraints) on building newassets, governments should aim tomaximize the utilization of their existingassets. First, they can increase peakthroughput by unlocking backupcapacity (e.g. hard shoulder running,reversible lanes on highways), makingtargeted capacity enhancement at
bottlenecks (e.g. adding lanes orintroducing e-tolling) and encouragingusers to utilize the full system capacity(e.g. introducing high-occupancylanes). Even within the existing
capacity, however, various measuresare available to increase throughput.In transport, headways betweenvehicles can be reduced, for example,by advanced road traffic management
and next-generation rail or air trafficcontrol systems. For electricity andwater, operators can reduce physicallosses by harnessing leakage detectiontechnology, properly maintaining andrepairing networks, and investing innew equipment. Concerted actionon all these levers can make a largeimpact. Manila Water of the Philippines,for example, drove its non-revenuewater ratio down from 63% in 1997 to just 11% in 2010. Moreover, the waterneeds of 200 million people could be
met if the 45 million cubic metres ofwater lost through physical leakageevery day in the developing world couldbe retained.
Note: HSE = Health Safety E nvironment; CBA = Cost-Benefit Analysis
7/25/2019 Strategic Infrastructure Steps Report 2014
http://slidepdf.com/reader/full/strategic-infrastructure-steps-report-2014 10/88

7/25/2019 Strategic Infrastructure Steps Report 2014
http://slidepdf.com/reader/full/strategic-infrastructure-steps-report-2014 11/88
11Steps to Operate and Maintain Infrastructure Efficiently and Effectively
asset context and based on a properassessment of the vulnerability andcriticality of each piece of equipment.Developing such customized andinnovative maintenance treatmentscan have a major impact; for example,the asphalt-preserving surface coatingapplied to the M25 motorway in theUnited Kingdom (UK) increased thepavement’s life by a third.
Another crucial factor in extendinglifetime is the adequate managementof the asset, according to itsspecifications, to control excessiveusage or consumption (e.g. regulatingthe use of heavy trucks on rural roads). A further major risk to infrastructureis natural disasters. The economiclosses caused by storms, floodingand earthquakes worldwide overthe past 30 years are estimated atUS$ 3.5 trillion, and these hazards
are becoming more common andmore destructive because of climatechange. To address this, governmentsmust identify and assess those risks,develop cross-sectoral master plansand incorporate more resilience intoexisting assets. Their efforts shouldfocus not only on structural measures,such as building protective barriersand retrofitting existing facilities, butalso on cost-effective, non-structuralmeasures, including the creation ofnatural buffer zones and the adaptationof more resilient design codes for futurereconstructions and upgrades.
1.6 Reinvest with a life cycle view.Since most of the infrastructure indeveloped countries was constructedfrom the 1950s to 1970s, many assetsare approaching the end of their lifecycle and need to be rehabilitated orreplaced. However, before committingto major capital expenditure,governments should first identify allpossible project options and investigate
more cost-effective solutions, suchas throughput optimization, lossreduction, demand-side measures,systemwide capacity balancing andtargeted investments to debottleneckexisting sites. The project should thenbe selected on the basis of a rigorouscost-benefit analysis, taking the wholelife cycle into account. In many cases,the life cycle analysis will reveal that thelong-term costs of O&M are actuallymuch greater than the initial costs ofconstruction. The life cycle cost analysis
thus needs to be performed early onand in the specific asset context, asthe majority of life cycle costs can stillbe influenced through shrewd designand engineering decisions, such aswhether to use concrete or asphaltfor paving a road. After committing tothe project, the most efficient deliverymode – public sector, PPP or privatesector – should be chosen on the basisof a value-for-money assessment,taking into account the potentialquality of service and level of risk to thegovernment budget. For example, thenew hospital in Tlalnepantla, Mexicowas delivered as a PPP, realizingwhole life-cycle savings of 30% relative
to the projected costs of traditionalpublic delivery, as well as producinga “greener” infrastructure facility withenergy savings estimated at 20%.
Enablement Best Practices
In addition to implementing O&Mbest practices, governments alsoneed to create the right conditions
for optimizing O&M for the long term. They need to ensure funding, buildcapabilities and reform governance.
2.1 Ensure funding. A typical source offunding for O&M requirements is annualappropriations from the governmentbudget. However, these are vulnerableto political expediency and so are oftenill-suited to O&M, which requires a verypredictable and sustainable source offunding. More suitable models includededicated maintenance funds that
earmark and ring-fence user taxes,user-charge models and revenuesfrom ancillary businesses. As examplesof dedicated maintenance funds,the Swiss and Austrian road fundsprovide reliable sources of fundingthat are decoupled from the annualpublic budget. But such funds facetheir own set of challenges in manycountries: the increasing fuel efficiencyof cars (and their future replacementby e-cars), as well as flat fuel tax rates,erode the funds’ financial base. It isthus essential to link their revenuesto inflation and actual traffic volumes. A broader adoption of user chargesis also warranted, as they can more
7/25/2019 Strategic Infrastructure Steps Report 2014
http://slidepdf.com/reader/full/strategic-infrastructure-steps-report-2014 12/88
12 Steps to Operate and Maintain Infrastructure Efficiently and Effectively
easily link funding to inflation andtraffic volumes. User charge modelsnot only ensure a dedicated fundingcontribution from each user, but alsoencourage customers to use theavailable capacity responsibly andsparingly. Introducing or increasinguser charges requires a sophisticatedstakeholder communication strategy,and a delicate balancing of financialand economic objectives as well associal considerations. Perhaps thebest approach is to correlate new usercharges with quality improvementson the one hand, and to providetargeted tariff reductions or alternativeinfrastructure on the other. Finally,ancillary business opportunities cangenerously supplement the funding ofthe core infrastructure business; forexample, best practice airports can
realize more than 50% of their revenuesfrom retail, hotels, advertising andparking.
2.2 Build capabilities. In manycountries, the key constraint toimplementing all of these O&M bestpractices is the shortage of skilled staff.One priority is to increase formal O&Meducation and training in the variousdisciplines by academia, internationalfinancial institutions (IFIs), governmentsand the private sector, and to enhance
other forms of knowledge exchange. Actually, the O&M phase itself is anexcellent learning environment, asits stability and long-term orientationenable uninterrupted learning curvesover a project’s life cycle. While suchskill education and training is essential,it is not sufficient. Governments needto do more to attract high-quality O&Mmanagers and planners, and to developand retain them for the long term.Sustainable O&M performance is
compromised not just by the shortageof individual capabilities, but alsoby the common lack of institutionalcapabilities. When making theirinfrastructure plans, governmentsneed to ensure that O&M projectsare prioritized in an integrated cost-benefit framework, alongside greenfieldprojects; and, to ensure the continuityof the maintenance programmebeyond election cycles. Governmentsshould conduct regular assessmentsof the existing asset base, and create
an infrastructure balance sheet toshow how the stock of assets hasevolved and to forecast the requiredmaintenance funding. Governmentsshould also introduce standardized
infrastructure asset managementprocesses and frameworks (suchas ISO 55000), and make full use ofdata, benchmarking and modellingfor optimizing O&M procedures andexpenditures. The North-West TransitWay near Sydney, Australia provides agood example of what can be achievedby applying such data-driven decision-making. By using a sophisticatedpavement-modelling tool based onhighly granular data, the contractorswere able to home in on an optimalwhole life-cycle solution with costsavings of 15%, while still ensuring roadavailability of 99%.
2.3 Reform governance. Governmentshave to deal not only with legacyassets, but also with legacyorganizations and cultures. The right
governance model is a crucial factorin motivating agencies and their staffto optimize O&M. One approach iscorporatization of public agencies;it often captures the advantages ofa privately run company, includingenhanced productivity, streamlinedprocesses, commercial orientationand financial sustainability, whileremaining accountable to the publicand serving the public interest. Whenthe Aqaba Water company in Jordanwas corporatized, the outcome was
a 30% sales increase, a renewal of90% of the network, performanceimprovements, increased employeetraining and enhanced customerservice. Improvements are needednot just to individual agencies, butalso to coordination across sectors,government levels and even borders.Finally, additional private participationcould enhance infrastructure O&Mby tapping the private sector’s skillsin managing infrastructure assets.
In water treatment, some major UScities have recorded savings of over30% in operating costs. Given thecurrent strong interest of privateinstitutional investors in low-risk,long-term infrastructure investments,governments may consider grantingconcessions or selling some assetson favourable terms and recycling theproceeds into new projects – but onlyif such transactions provide value formoney to society.
The Way Forward
While many governments andoperators already apply some of theseO&M best practices, many others
fail to achieve anything near the fulloptimization potential. They shouldbegin by systematically reviewing andbenchmarking their O&M practicesand policies against the completebest practice checklist (Figure 2). After identifying the most criticalissues in a country’s and sector’sparticular context, governments willneed to establish a broad action plan.While inevitably some trade-offs willhave to be made when crafting it,governments should always try to findwin-win solutions; these are increasinglyavailable now, thanks to newtechnologies and process innovations.
Many of the implementation bestpractices can provide quick fixes, andare essential for short-term efficiencyimprovements that can unlock funds
for larger transformations. However,governments should treat O&M not onlyas an operational necessity aimed atreducing costs, but also as a strategicelement that optimizes the value ofan infrastructure asset for society –by increasing the asset’s utilization,availability and service levels. In thelong term, a sustainable O&M solutionwill inevitably require the right enablersin place, secured and stable funding,managerial and technical capabilities,and the right governance structure.
Excellence in infrastructure O&Mis a key means of narrowing theglobal infrastructure gap – but it is nopanacea. Most countries will still needto construct new assets and addressvast infrastructure deficiencies. Still, byoptimizing existing capacity utilization,O&M best practice can significantlyreduce the amount of new constructionand, by optimizing operating costs, canalso make financial resources available
for whatever new construction is trulyneeded. Of course, it can also easecurrent congestion far faster than newconstruction could.
Well-designed O&M strategies andpolicies, in conjunction with policiesto improve the earlier phases ofinfrastructure projects (planning,preparation, procurement andconstruction), can benefit developedand developing countries immensely. They will thus have the opportunity
to boost their infrastructure services,strengthen their competitiveness andfoster socio-economic progress andprosperity.

7/25/2019 Strategic Infrastructure Steps Report 2014
http://slidepdf.com/reader/full/strategic-infrastructure-steps-report-2014 13/88
13Steps to Operate and Maintain Infrastructure Efficiently and Effectively
Overview of the Strategic Infrastructure Initiative
The World Economic Forum’s StrategicInfrastructure Initiative supportsgovernments in their efforts to address
three fundamental questions as theystrive to maximize their returns oninvestment from strategic infrastructureprojects. The questions are:
– How should they identify andprioritize infrastructure projectsthat make the greatest impact oneconomic growth, social uplift andsustainability?
– Once they have selected theinvestments, how should theyprepare and procure these assets
most efficiently and effectively?– Once the assets have been built,
how should they operate andmaintain them to maximize theirvalue for society?
The first phase of the initiative, in2011-2012, explored the first questionand produced the report Strategic
Infrastructure: Steps to Prioritize and Deliver Infrastructure Effectively
and Efficiently in September 2012. The second phase, in 2012-2013,addressed the second question,specifically looking at PPPs asexemplary modes of project delivery. The corresponding report, StrategicInfrastructure: Steps to Prepare and Accelerate Public-Private Partnerships,was published in May 2013. The thirdphase, in 2013-2014 and summarizedin this report, addresses the third
question and discusses in detail issuesof operating and maintaining existinginfrastructure assets. Figure 3 providesan overview of the initiative’s threephases and their respective topics.
The initiative draws on Partners fromthe Forum’s Infrastructure & UrbanDevelopment Industries and other
relevant groups, including Mobility,Energy and Investor Industries. Otherparticipants include experts frommultilateral development banks,academia, governments and the widerinfrastructure community.
Figure 3: Overview of the Strategic Infrastructure Initiative

7/25/2019 Strategic Infrastructure Steps Report 2014
http://slidepdf.com/reader/full/strategic-infrastructure-steps-report-2014 14/88
14 Steps to Operate and Maintain Infrastructure Efficiently and Effectively
A country’s infrastructure endowmentplays a major strategic role inits economic growth and globalcompetitiveness. High-qualityinfrastructure facilities may be costly
to build and maintain, but theyprovide many economic benefits, asthey facilitate trade and productionefficiencies for other industries.Consider how an unreliable electricitysupply would add to the overall costof doing business, as firms must eitherpause production during blackouts orpay for expensive back-up generators.Several studies have shown the positiveeffect of infrastructure on the nationaleconomy: depending on the currentinfrastructure stock, a 1% increase ininfrastructure assets will boost grossdomestic product (GDP) by 0.05% to0.25% in the long term.1
Functioning infrastructure makesa positive impact not only on theeconomy, but also on the environmentand society at large. Every family andcommunity needs proper infrastructureto thrive and achieve social progress –for example, the electricity that enableschildren to read at night and the
road that gives them speedy accessto healthcare facilities. Yet in Africa,40% of agricultural produce rots onthe way to market because of badroads, and half a billion people lackaccess to electricity.2 In the absenceof electricity, people continue usingfuel sources such as charcoal andkerosene, with all the predictable socialand environmental results: increaseddisease, deforestation and carbonemissions.
The GlobalInfrastructure Gap
The global infrastructure gap is a
pressing issue
The global demand for infrastructureinvestment is huge and estimatedat about US$ 3.7 trillion annually.3 Indeveloping countries, it is driven bygrowing population, economic growth,urbanization and industrialization. In thedeveloped world, a particular concernis that so much legacy infrastructureneeds maintenance and rehabilitation,owing to the ageing of assets, stricterenvironmental regulations and theglobalization of supply chains.
The high demand is not being met,however, as only about US$ 2.7trillion is invested each year.4 Thesupply of new infrastructure cannotkeep pace with demand because ofvarious impediments; notably, thepublic sector’s budget constraintsfollowing the global financial crisis, andthe reluctance of private financiers tocommit capital to long-term and risky
projects. In addition, the delivery ofinfrastructure programmes is hamperedby several issues in the projectorigination and preparation phase,including biased project identificationand prioritization, low-quality master-planning, slow permit and procurementprocesses, and inadequate riskallocation and delivery models.
In short, the growth of the infrastructureasset base is failing to keep up withsociety’s needs. The global roadnetwork, for example, has expanded by88% since 1990, which might soundimpressive, except that global roadfreight traffic has increased 218% overthe same period.5 Across all sectors of
economic and social infrastructure, theglobal infrastructure investment gapamounts to at least US$ 1 trillion peryear, which corresponds to about 1.4%of global GDP 6 (Figure 4). To make
matters worse, much of the existingasset base is wearing out: many of theinfrastructure assets in the EuropeanUnion (EU) and North America werebuilt in the 1950s-1970s, and many,approaching the end of their expectedlifespans, are becoming structurallydeficient or functionally obsolete.For example, the average age of the607,380 bridges in the US is currently42 years, and that of the 84,000 damsis 52 years.7 And in Germany, abouta third of rail bridges are over 100years old.8 In fact, most developedcountries have neglected to modernizetheir infrastructure, as infrastructurespending has declined over recentdecades, and priority has often beengiven to building new projects.
To narrow or close the infrastructure
gap, governments can pull three
levers
Governments can reduce infrastructure
demand, build new assets or optimizeexisting infrastructure assets (Figure 4).
Reduce demand . Reducing demandfor infrastructure services is sometimesa viable option, if user needs forthese essential public services canbe satisfied in other ways. Electricityconsumption can be reduced throughsystematic promotion of energy-savingdevices. However, many services,such as transport, cannot be feasiblyreduced without jeopardizing economic
and social development.
Build new assets. The most obviousand widely discussed solution is tobuild new infrastructure facilities. (The
Introduction: The Operationsand Maintenance (O&M)
Imperative

7/25/2019 Strategic Infrastructure Steps Report 2014
http://slidepdf.com/reader/full/strategic-infrastructure-steps-report-2014 15/88
15Steps to Operate and Maintain Infrastructure Efficiently and Effectively
required actions were described inthe Strategic Infrastructure Initiative’sprevious two reports.9 ) However, thesolution is resource-intensive, complexand prone to delays – unappealingcharacteristics in a world of tight fiscalbudgets and limited private long-termlending/investing.
Optimize existing infrastructure assets. An underexploited opportunity is to
upgrade the existing asset base byoptimizing the O&M of the infrastructureassets, i.e. making them more effective,cheaper or longer-lasting. While thislever has often been neglected bypolicy-makers in the past, it commandsattention now in the current context ofconstrained finance, ageing facilitiesand rising demand. The Swisstransportation policy, for example,explicitly stipulates that optimal
management of existing capacities haspriority over capacity expansion.10
This report aims to examine the rolethat O&M best practice can play innarrowing the global infrastructure gap,while recognizing that a comprehensiveand sustainable approach to closingthe gap will require government actionon all three levers.
Figure 4: The Global Infrastructure Gap and Levers to Close the Gap
1. Including economic and social infrastructure 2. Infrastructure to 2030 (Volume 2): Mapping Policy for Electricity, Water and Transport , June 2007. Paris: Organisation for Economic Cooperation and
Development (OECD) 3. IHS Global Insight Construction Database, March 2012 4. Using $70T as global GDP, non-PPP adjusted (2011)
The O&MOpportunity
There is significant potential
for improving O&M of existing
infrastructure assets
Current management of infrastructureassets is a cause for concern. According to a survey by the EuropeanFederation of National Maintenance
Societies, asset management practicesof the European infrastructureindustry are rated below those ofthe manufacturing and processindustries, not just in the overall
ranking but in every one of the keysubcategories (Figure 5).11 Publiclyowned infrastructure assets have beenmanaged suboptimally in developedcountries, and even more so indeveloping countries. In any country,O&M is often the victim of pressuredpublic budgets and political priorities –O&M projects win few votes relative togreenfield projects.
Trillions of US dollars have been
invested over the past decades to buildthe global infrastructure asset base,which includes 43,000 airports, 33million kilometres (km) of roads and 1.2billion fixed-line connections (Figure 6).
With worldwide infrastructure assetsworth about US$ 50 trillion,12 the valueis roughly the same in magnitude as theglobal stock market capitalization (US$55 trillion)13 and global GDP (US$ 72trillion).14
Infrastructure, as one of the world’sgreat capital stocks, cannot beneglected, and governments need tomake a long-term effort to unlock thispotential value. Pursuing the “power
of one per cent” can make a dramaticimpact, as each percentage point ofO&M optimization brings substantialfinancial and economic rewards. Butasset optimization yields more than

7/25/2019 Strategic Infrastructure Steps Report 2014
http://slidepdf.com/reader/full/strategic-infrastructure-steps-report-2014 16/88
16 Steps to Operate and Maintain Infrastructure Efficiently and Effectively
Figure 5: Comparison of Asset Management across Industries
Note: Asset management maturity measured on a scale between 1 (lowest maturity) and 5 (best-practice) based on 23 questions. 112 public and private entities from 24 European countries and 23
industry sectors contributed to the survey. “Process industries” includes extraction, mining and quarr ying companies; “Manufacturing” includes food products, wood, paper and el ectronic equipment;
“Infrastructure” includes production and distribution of electricity, water supply, roads and railways etc.
Source: How organizations manage their physica l assets in practice - EFNMS Asset Management Survey 2011, 2011. European Asset Management Committee within EFNMS
cost savings; it can also provide socialand environmental benefits, whichmakes it well aligned with governments’public service mission.
The O&M opportunity is realistic
The chances of successfully optimizingO&M are enhanced by three factors:existing role models of good practice,technological innovation and relativelymodest implementation costs.
Role models. Many private as well aspublic infrastructure assets have alreadyoptimized their O&M, and therebyhave set an industry benchmark andindicated various best practices.Infrastructure managers can emulatetheir counterparts’ work in their ownsector, or adapt the work of thosein other sectors. They can also learnlessons from other capital-intensiveindustries, such as oil and gas or heavyindustry. The potential for laggards to
improve is clear. Technological innovation. Infrastructure,with its long innovation cycles, hasgenerally not been a front-runner in
innovation, but it could soon experiencean impressive productivity gain frominnovative technologies promisingnew O&M solutions. The technologyrevolution in remote sensing, advancedanalytics, integrated scheduling andcontrol, and autonomous operationswill also have a transformative effecton the infrastructure industry. As theysay, “the Bits will become just asimportant as the Bricks”. Just considerthe differences made by applications
such as smart meters, dynamic trafficmanagement and e-tolling, and next-generation air traffic control systems. These technologies are increasinglymoving beyond the pilot phase andbecoming more affordable, with cost-effective roll-outs at scale either aprospect or already a reality.
Relatively modest implementationcosts. In the otherwise capital-intensiveinfrastructure industry, O&M solutionsusually carry a very reasonable price
tag; payback is quick, and economicbenefit-to-cost ratios are high.Regarding the costs of supplying water:estimates are that building new damsand rainwater harvesting facilities,
for example, would cost US$ 0.04-0.06 per cubic metre (m3 ), whereasrehabilitation of existing infrastructurewould only cost about US$ 0.02/m3,and demand-side measures far lessthan that.15
The O&MChallenges
The O&M reality is a sobering one
Many issues with existing infrastructureillustrate the lack of O&M best practice. The following statistics indicate theextent of the problem:
Congestion and unproductive use of
capacity
– Despite the slowdown of shippingactivity in the aftermath of the globalfinancial crisis, about 5-10% of theglobal vessel fleet was kept idle by
port congestion in 2009-2012.16
– In the US, airport congestion anddelays cost its economy US$ 22billion in 2012,17 and unless matters

7/25/2019 Strategic Infrastructure Steps Report 2014
http://slidepdf.com/reader/full/strategic-infrastructure-steps-report-2014 17/88
17Steps to Operate and Maintain Infrastructure Efficiently and Effectively
Figure 6: Overview of the Global Infrastructure Asset Base
improve, 20 US airports will find thattraffic exceeds capacity by 2015.18 At China’s largest airports, in Beijingand Shanghai, three-quarters of allflights are delayed, with each minuteof delay costing airlines wastedfuel, passenger compensations andinterruptions to luggage handling.19
– In the developing world, 45 millioncubic metres of water are lost dailybecause of leakage, enough toprovide for the needs of 200 million
people.20
Poor quality for users
– A large-scale power outage in Indialeft approximately 700 million peoplewithout electricity in July 2012.21 The north-eastern US experienceson average 214 minutes of poweroutage per year, compared to justsix minutes in Japan.22
– More than 20% of the 54,700
US tap water systems supplying49 million people are regularly inviolation of the Safe Drinking Water Act.23
– One-third of US highways andone-quarter of major urban roadsare considered to be in pooror mediocre condition, and areincreasingly subject to failure.24 Furthermore, 25% of bridges arestructurally deficient or functionallyobsolete.25 Overall, ageing andunreliable infrastructure will lead to job cutbacks and declining businessproductivity, costing the averageUS family an estimated US$ 3,000
in disposable household incomeannually through 2020.26
– Barges on the US inland waterwayssystem, where more than half ofthe locks are over 50 years old, areregularly held up for hours each dayby service interruptions that delaygoods from getting to market.27
Cost inefficiencies
– If an additional US$ 12 billion had
been spent on road repairs across Africa during the 1990s, the US$45 billion spent on reconstructioncould have been pre-empted.28 And, the cost of keeping the US
transportation system in a state ofgood repair is just one-third of thecost of replacing it.29
– More than US$ 250 million30 wasspent to rehabilitate the LongfellowBridge in Boston (US); had regularmaintenance been performed on it,the total historical cost would havebeen only about US$ 81 million.31
– Crane productivity at many portsis only half of the over 40 moves
per hour that world-class ports canachieve, suggesting that a largenumber of ports are operating atseriously inefficient levels.
Environmental and social externalities
– More than 25 million metric tons ofCO
2 are produced in US traffic jams
each year,32 corresponding to theCO
2 emitted from electricity used by
3.4 million homes per year, or theannual greenhouse gas emissions of
5.2 million cars.33
– Every year, traffic accidents kill morethan 1.2 million people around theworld and injure up to 50 million.34
Note: Data describes the global infrastructure stock.
Source: CIA World Factbook, https://www.cia.gov/library/publications/the-world-factbook/, 2012

7/25/2019 Strategic Infrastructure Steps Report 2014
http://slidepdf.com/reader/full/strategic-infrastructure-steps-report-2014 18/88
18 Steps to Operate and Maintain Infrastructure Efficiently and Effectively
In India alone, about 15,000 peopledie each year crossing rail tracks.35
– Unsafe drinking water is one ofthe main causes of the 1.5 milliondiarrhoea-related deaths of childrenin developing countries each year.36
These O&M issues affect both
developing and developed countries,although the type of problem does vary(Box 1).
O&M underperforms for a variety of
reasons
There are three broad causes of theshortage of high-quality and sustainableO&M (Figure 7).
Insufficient funding. Overall publicfunding for infrastructure is inadequate,
and the amount of available fundsfor O&M specifically is even worse. The O&M shortfall is partly due topoliticians’ built-in bias in favour ofgreenfield projects, which have vote-catching potential. By contrast, O&Mprojects have low political visibility, andlong-term maintenance requirementsdo not make a good fit with the shortpolitical cycle. So it is hardly a surprise
that decision-makers generally do notparticipate in ribbon-cutting ceremoniesfor a maintenance project. In addition,the public budgeting processes, whereO&M and capital expenditure (capex)budgets are typically separated andwhere budgets are set annually, donot match well with the multiyearrequirements of O&M programmes. In
addition, O&M costs cannot always beeasily recovered from user charges:the requisite price increases tend toprovoke stakeholder opposition, andin developing countries, they are oftensubject to payment evasion. Weak capabilities. O&M decision-making is often hampered by poorasset management processes andframeworks, and substandard systems,tools and data. Without abundant and
accurate data on the asset’s conditionand performance, and without reliablebenchmarks and best practicesfor guidance, O&M managers arebound to struggle. Even when bestpractices are known, they might beinsufficiently exploited because ofunderstaffed or underskilled engineeringand management departments, asO&M has a less-appealing image for
professionals than construction. Andeven though a great opportunity existsto reskill staff using the learning curvederived from stable O&M tasks, thatopportunity often gets neglected.
Inadequate governance. The institutionsgoverning infrastructure assets areoften weak and bureaucratic, whichhinders professional and independentO&M. Because of the absence ofprivate-sector involvement andcompetition, little pressure to reducecosts or to optimize the existingfacilities exists, and inefficiency canflourish.
Figure 7: Root Causes of O&M Issues
Notes: AM = Asset Management; TQM = Total Quality Management
7/25/2019 Strategic Infrastructure Steps Report 2014
http://slidepdf.com/reader/full/strategic-infrastructure-steps-report-2014 19/88
19Steps to Operate and Maintain Infrastructure Efficiently and Effectively
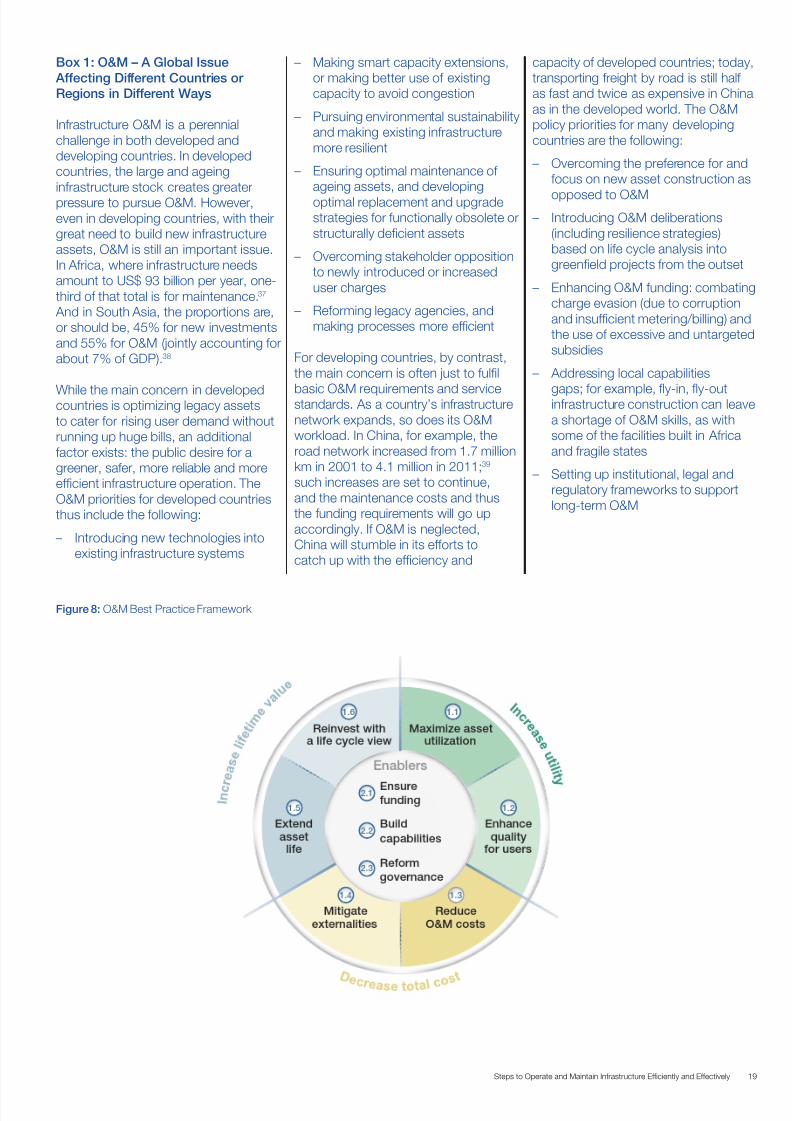
Box 1: O&M – A Global Issue
Affecting Different Countries or
Regions in Different Ways
Infrastructure O&M is a perennialchallenge in both developed anddeveloping countries. In developedcountries, the large and ageinginfrastructure stock creates greaterpressure to pursue O&M. However,even in developing countries, with theirgreat need to build new infrastructureassets, O&M is still an important issue.In Africa, where infrastructure needsamount to US$ 93 billion per year, one-third of that total is for maintenance.37 And in South Asia, the proportions are,or should be, 45% for new investmentsand 55% for O&M (jointly accounting forabout 7% of GDP).38
While the main concern in developedcountries is optimizing legacy assetsto cater for rising user demand withoutrunning up huge bills, an additionalfactor exists: the public desire for agreener, safer, more reliable and moreefficient infrastructure operation. TheO&M priorities for developed countriesthus include the following:
– Introducing new technologies intoexisting infrastructure systems
– Making smart capacity extensions,or making better use of existingcapacity to avoid congestion
– Pursuing environmental sustainabilityand making existing infrastructuremore resilient
– Ensuring optimal maintenance ofageing assets, and developingoptimal replacement and upgradestrategies for functionally obsolete orstructurally deficient assets
– Overcoming stakeholder oppositionto newly introduced or increaseduser charges
– Reforming legacy agencies, andmaking processes more efficient
For developing countries, by contrast,the main concern is often just to fulfil
basic O&M requirements and servicestandards. As a country’s infrastructurenetwork expands, so does its O&Mworkload. In China, for example, theroad network increased from 1.7 millionkm in 2001 to 4.1 million in 2011;39 such increases are set to continue,and the maintenance costs and thusthe funding requirements will go upaccordingly. If O&M is neglected,China will stumble in its efforts tocatch up with the efficiency and
capacity of developed countries; today,transporting freight by road is still halfas fast and twice as expensive in Chinaas in the developed world. The O&Mpolicy priorities for many developingcountries are the following:
– Overcoming the preference for andfocus on new asset construction as
opposed to O&M– Introducing O&M deliberations
(including resilience strategies)based on life cycle analysis intogreenfield projects from the outset
– Enhancing O&M funding: combatingcharge evasion (due to corruptionand insufficient metering/billing) andthe use of excessive and untargetedsubsidies
– Addressing local capabilities
gaps; for example, fly-in, fly-outinfrastructure construction can leavea shortage of O&M skills, as withsome of the facilities built in Africaand fragile states
– Setting up institutional, legal andregulatory frameworks to supportlong-term O&M
Figure 8: O&M Best Practice Framework

7/25/2019 Strategic Infrastructure Steps Report 2014
http://slidepdf.com/reader/full/strategic-infrastructure-steps-report-2014 20/88
20 Steps to Operate and Maintain Infrastructure Efficiently and Effectively
A Framework forO&M Best Practices
Governments should aim to make
the most of existing assets
A basic government responsibility isto secure maximum value for moneyfrom the O&M of a country’s existinginfrastructure assets. Governments canadopt various strategies to optimizethe socio-economic returns generatedfrom those assets; the framework inFigure 8 offers a structured overview ofmanagement strategies (representedby the outer circle) and enablementstrategies (represented by the innercircle).
Three broad strategies are availableto governments for managing theirinfrastructure assets and maximizingthe return on those past investments:
– Increase the utility of the existinginfrastructure asset, by maximizingits utilization and enhancing itsquality for each user.
– Decrease the total costs of providingthe infrastructure service – not just by reducing internalized O&Mcosts but also by mitigating theenvironmental and social externalitycosts.
– Increase the lifetime value, eitherby extending the asset’s life tomaintain the benefits over anextended period, or by organizing
a rehabilitation, replacement orupgrade plan that takes whole life-cycle considerations properly intoaccount.
Some of those levers can beinterdependent. While in certainsituations trade-offs will be requiredbetween the different strategies (forexample, reducing operating costs mayreduce service quality), governmentsshould seek win-win solutions thatassure a simultaneous realization ofthose strategies (for example, e-tollingreduces both operating costs and theenvironmental footprint, while increasingquality for users).
In addition to the managementstrategies, governments also need toestablish the right enabling conditionsto address the root causes ofsubstandard O&M performance (asdiscussed earlier) and to sustain theimplementation of O&M best practice. The enablement strategies are:
– Ensure sufficient funding forcontinuous O&M
– Build sufficient capabilities toexecute O&M successfully
– Reform governance to incentivizeoptimal O&M
Above all, it concerns the political willto implement those best practices. The issue is not about a lack of bestpractices or too little technologicalinnovation; it really has to do with thestructure and the will to adopt the
lessons learned and apply them on abroader scale.
Based on extensive consultations withthe multistakeholder constituencies
of the World Economic Forum’sStrategic Infrastructure Initiative, thisreport identifies and discusses 27actionable best practices and criticalsuccess factors that are essential whenundertaking the O&M implementationand enablement strategies (Figure 9).
Figure 9’s checklist represents a holistic
or ideal agenda for optimizing O&M. Although it shows how complex andbroad O&M can be and needs to be, itcertainly does not imply that successfulO&M is unachievable; many countries
Figure 9: Checklist of O&M Best Practices/Critical Success Factors
Note: HSE = Health Safety Env ironment; CBA = Cost-Benefit Analysis

7/25/2019 Strategic Infrastructure Steps Report 2014
http://slidepdf.com/reader/full/strategic-infrastructure-steps-report-2014 21/88

7/25/2019 Strategic Infrastructure Steps Report 2014
http://slidepdf.com/reader/full/strategic-infrastructure-steps-report-2014 22/88
22 Steps to Operate and Maintain Infrastructure Efficiently and Effectively
Figure 10: Panama Canal O&M Measures
Note: KPI = Key Performance Indicator; ACP = Panama Canal Authority; LNG = Liquefied Natural Gas; Ro-Ro = Roll-on Roll-off
7/25/2019 Strategic Infrastructure Steps Report 2014
http://slidepdf.com/reader/full/strategic-infrastructure-steps-report-2014 23/88
23Steps to Operate and Maintain Infrastructure Efficiently and Effectively
This report illustrates the best practiceswith support from over 200 examples
and case studies to give the readera real-life impression of successfulimplementations. The examplesare drawn from different sectors ofeconomic and social infrastructure,and from both developing anddeveloped countries. Part 4 containsa comprehensive case study of thePanama Canal O&M, which holisticallyexemplifies the full array of bothimplementation and enablementbest practices. Figure 10 providesan overview of the O&M measurestaken at the Panama Canal along thedimensions of the O&M framework.

7/25/2019 Strategic Infrastructure Steps Report 2014
http://slidepdf.com/reader/full/strategic-infrastructure-steps-report-2014 24/88
24 Steps to Operate and Maintain Infrastructure Efficiently and Effectively
1. Implementing O&M BestPractices
This section of the report discussesO&M management best practices.It provides selected approaches tooptimizing existing infrastructure assets,without any attempt to cover each
sector comprehensively, and addressessix broad strategies:
– Maximize asset utilization(chapter 1.1)
– Enhance quality for users(chapter 1.2)
– Reduce O&M costs (chapter 1.3)
– Mitigate externalities (chapter 1.4)
– Extend asset life (chapter 1.5)
– Reinvest with a life cycle view(chapter 1.6)
1.1 Maximize assetutilization
Many existing infrastructure assets
suffer from congestion becausedemand has risen well beyond thelevel forecasted. Since their capacityis limited, and it might not be feasibleto build new assets, it is essential forgovernments to make the most oftheir installed asset capacity. Even aslight increase in effective throughputcan make a large difference, sincecongestion is a strongly non-linearphenomenon.
Increasing throughput of existing assetshas enormous societal value. Once
the large, upfront sunk investmentsfor building an infrastructure assethave been made, each additional userwill incur only low marginal costs, butthat usage will translate into greater
user benefits and/or revenues – andthus contribute to pay off the initialinvestment.
To alleviate congestion and maximizeasset utilization, operators shouldpursue a three-part best practicestrategy: enhance peak capacity andeffective throughput; apply demandmanagement to reduce peak demandby shifting some of it off-peak; andoptimize availability and reducedowntime (Figure 11).
Figure 11: Overview of Asset Utilization Strategies

7/25/2019 Strategic Infrastructure Steps Report 2014
http://slidepdf.com/reader/full/strategic-infrastructure-steps-report-2014 25/88
25Steps to Operate and Maintain Infrastructure Efficiently and Effectively
Enhance peak capacity and effective
throughput
Enhance peak capacity by unlocking backup capacity.
Infrastructure assets often haveembedded additional or reservecapacity that is not being used. Oncemade available, it can ease bottlenecksdramatically. Some examples:
– The hard shoulder or emergencylane on highways: by opening theseto traffic during rush hours, or indynamic response to heavy traffic,authorities can greatly reduce traffic jams. Using this approach, theItalian highway system at Bolognahas cut total user time lost byalmost 75%, while also reducingaccidents by 18% and injuries and
deaths by about 35%.42
– Reversible lanes on highways:when necessary, certain stretchesof a highway can be designated fortraffic going in either direction. HongKong’s busy Route 8 highway, forinstance, applies a real-time mix oflane assignment management.43
– Underexploited power transmissionlines: real-time ratings, basedon a continuous monitoring
of mechanical tension andtemperature, tend to yield highercapacity than static ratings(which are based on conservativeassumptions such as high ambienttemperature and high solar
radiation). This allows operatorsto harness existing, untappedtransmission capacity and thusresolve line congestion problems. The McCarney-to-Big Lake line in Texas, for instance, was able toincrease its capacity by 10-15%through real-time ratings, therebyaccommodating the increase inwind farms and cancelling a plannedUS$ 20 million line upgrade.44
Obviously, such backup capacitytechniques have their risks (safetylapses, increased stress, wear on thesystem), which need to be carefullymanaged.
Enhance peak capacity by targetedcapacity enhancement.
A system operates only as effectivelyas its weakest component. So acost-effective approach to enhancingcapacity is to conduct a systemwideanalysis to identify bottlenecks, andthen make targeted and incrementalinvestments using existing infrastructureand/or rights-of-way, rather thanundertaking major construction work.Some examples:
– Airports: London City Airport (UK)took a coordinated, capacity-
boosting initiative across the system,from landside (four additionalsecurity lines, a larger departurelounge, self-service kiosks) to apron(four new aircraft stands for larger
aircraft, a new runway link andconnecting pier) and airside (closercooperation with air traffic control tooptimize slot availability). The resultwas an increase in capacity from32 to 38 air traffic movements perhour.45
– Roads: various debottlenecking
techniques have been used, suchas adding extra lanes in upslopes inhilly terrain, and free flow tolling tomaximize capacity at typical chokepoints.
– Water treatment: for example, the As-Samra plant in Jordan, whenoverloaded owing to pollution, madea limited but targeted investment inadditional centrifuge presses andgravity belt thickeners to remove thebottleneck in the treatment process.
A related approach is to dynamicallyadjust resources to prevent congestionat bottlenecks. Frankfurt Airport, forinstance, introduced an integratedsystem of real-time, passenger flowforecasting and resource planning. The system simulates passengerflows, identifies upcoming bottlenecks,provides continuous updates to the Terminal Operations Centre anddynamically adjusts the requiredstaff. The system increased peak
terminal capacity from 150,000 to200,000 passengers per day, reducingpassenger waiting times by 20%, andalso reduced resource planning fromfive days to only a few hours.46
7/25/2019 Strategic Infrastructure Steps Report 2014
http://slidepdf.com/reader/full/strategic-infrastructure-steps-report-2014 26/88
26 Steps to Operate and Maintain Infrastructure Efficiently and Effectively
Enhance peak capacity by enabling
and encouraging users to optimally usecapacity.
A system’s capacity is determinednot only by the infrastructure asset’sdesign and operation, but also by theusers (e.g. cars, aircraft, ships). Whileinfrastructure operators have no directinfluence over that aspect of capacity,they can enable and encourage usersto use the system capacity to the fullestextent possible.
– Enable high-capacity usage viastructural measures: many airports,for example, have constructednew gates to accommodate largeraircraft such as the Airbus A380. To encourage carpooling, Vinci Autoroutes in France created 1,000dedicated parking places near toll
gates,47 and many US highwayshave introduced special managed orhigh-occupancy vehicle lanes.
– Encourage high-capacity usagethrough pricing: For instance,Heathrow Airport (UK), limited to two
runways while other major Europeanairports with similar passengernumbers have three to four, chargessmall aircraft relatively higher feesto motivate carriers to use larger,high-capacity aircraft. And on UShighways, high-occupancy toll(HOT) lanes create incentives forcarpooling by waiving charges formulti-passenger cars.
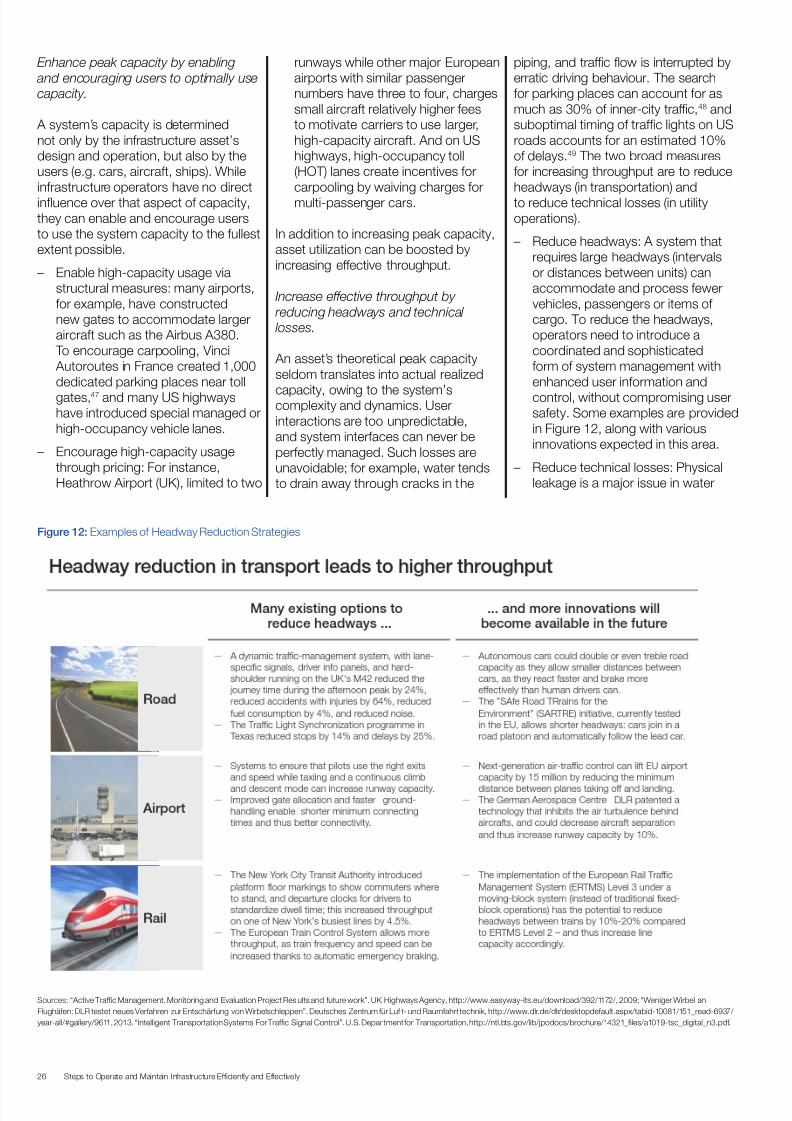
In addition to increasing peak capacity,asset utilization can be boosted byincreasing effective throughput.
Increase effective throughput by
reducing headways and technical losses.
An asset’s theoretical peak capacityseldom translates into actual realized
capacity, owing to the system’scomplexity and dynamics. Userinteractions are too unpredictable,and system interfaces can never beperfectly managed. Such losses areunavoidable; for example, water tendsto drain away through cracks in the
piping, and traffic flow is interrupted byerratic driving behaviour. The searchfor parking places can account for asmuch as 30% of inner-city traffic,48 andsuboptimal timing of traffic lights on USroads accounts for an estimated 10%of delays.49 The two broad measuresfor increasing throughput are to reduceheadways (in transportation) andto reduce technical losses (in utilityoperations).
– Reduce headways: A system thatrequires large headways (intervalsor distances between units) canaccommodate and process fewervehicles, passengers or items ofcargo. To reduce the headways,operators need to introduce acoordinated and sophisticatedform of system management withenhanced user information and
control, without compromising usersafety. Some examples are providedin Figure 12, along with variousinnovations expected in this area.
– Reduce technical losses: Physicalleakage is a major issue in water
Figure 12: Examples of Headway Reduction Strategies
Sources: “Active Traffic Management. Monitoring and Evaluation Project Results and future work”. UK Highways Agency, http://www.easyway-its.eu/download/392/1172/, 2009; “Weniger Wirbel an
Flughäfen: DLR testet neues Verfahren zur Entschärfung von Wirbelschleppen”. Deutsches Zentrum für Luf t- und Raumfahrt technik, http://www.dlr.de/dlr/desktopdefault.aspx/tabid-10081/151_read-6937/
year-all/#gallery/9611, 2013. “Intelligent Transportation Systems For Traffic Signal Control”. U.S. Depar tment for Transportation, http://ntl.bts.gov/lib/jpodocs/brochure/14321_files/a1019-tsc_digital_n3.pdf.

7/25/2019 Strategic Infrastructure Steps Report 2014
http://slidepdf.com/reader/full/strategic-infrastructure-steps-report-2014 27/88
27Steps to Operate and Maintain Infrastructure Efficiently and Effectively
and electricity transmission anddistribution systems, owing to low-quality design and construction,insufficient maintenance and ageingcomponents. About 45 millioncubic metres of water is lost dailyin the developing world as a resultof physical leakage – enough tomeet the water needs of 200 millionpeople.50 And the loss of potentialwater revenues in some parts of Africa is often as high as 40-50%. To reduce the losses of water orelectricity, the following steps areindicated:
– Use technology and analytics to
detect leakages. For example,in Malaysia’s Selangor state, theinstallation of pressure controlin the water distribution networkreduced leakage by more than a
quarter.51 Similarly in the UK, anadvanced pressure managementsystem with software, sensorsand controllers is used to detectleakages early on, and hasreduced water loss by 1.5 millionlitres per day.52
– Conscientiously and promptly
repair leakages. In Bangkok,more than 150,000 leakswere repaired and 551 km ofmains were replaced between
1997 and 2004, by usingperformance-based servicecontracts that incentivized theprivate contractor on actualleakage reduction, effectivelyreducing the non-revenue waterratio from 42% to 30%.53
– Invest in new equipment . Forexample, replacing old, high-loss distribution transformersby modern high-efficiencytransformers, as done in large
programmes in India and China,can reduce losses by up to 80%.Globally, this approach couldreduce energy consumptionby 200 terawatt-hours peryear, which is equivalent tothe Benelux countries’ entireelectricity consumption.54
Increase effective throughput by reducing commercial losses.
Effective throughput is impeded notonly by technical issues, but also bycommercial losses. For example,“commercial leakage” in the developingworld accounts for 30 million cubic
metres of water that are consumeddaily but not paid for.55 The causesinclude operational issues such as poormetering, billing and debt collection,employee corruption, and illegalconnections and theft. Commercialleakage is not confined to water andelectricity utilities, but also occurs inthe transport sector (although it isless pronounced there), through tollevasion on highways and fare-dodgingon public transport. Several measurescan be taken to reduce commercialleakage:
– Install improved or smart meters,making customer metering morereliable, and use anti-corruptionmeasures to enforce correctreadings. Phnom Penh’s WaterSupply Authority, for example,increased meter coverage from
12% in 1993 to 100% in 2008,and introduced an incentive-basedpayment scheme for meter-readingstaff, correlated to their collectedbills. The result was an increase inthe debt-collection ratio from 50%to 99%, and only a 6% non-revenuewater ratio (down from more than50%).56
– Improve debt collection. In SãoPaulo, contractors were offeredincentives to collect on outstanding
bills; the initiative raised US$ 43million, equivalent to 78% of the baddebt, within two years.57
– Prevent theft and improveenforcement. Closed-circuittelevision and system protectiondevices can be used to preventtheft, and enforcement can beimproved by pressing for revisedlaws and collaborating with thepolice.
– Combat illegal connections bymeans of marketing campaigns andpublic participation. For example, inSouth Africa, a national campaignwas conducted via the Internet,posters and media to curb illegalconnections, including the optionof reporting electricity thievesanonymously. This campaign ledto the discovery and disconnectionof about 80,000 illegal connectionsand tampered meters.58 In Delhi,India, authorities have reduced
theft by using a “social audit” andinformation campaigns on thedangers of tapping electricity fromlive wires.59
In combination, these measures
can make a particularly strongimpact. The State Electricity Boardin Andhra Pradesh, India launcheda comprehensive drive to regularizeits finances. It backed a new lawthat punishes electricity theft, andintroduced IT-supported metering(protective boxes on transformers) aswell as new tools to analyse customers’monthly consumption and to triggeralerts. The board also embarked onan anti-corruption fight: inspectorshave to issue a numbered reportand receipt to customers, and usersare given a one-time opportunity toobtain an authorized connection afterpaying a fine. The cumulative impactof those measures was a reductionof electricity losses from 38% to lessthan 20%, and a regularization of 2.25million unauthorized connections.60 In
the water sector, Manila Water of thePhilippines provides a good exampleof what can be achieved by applyingsimilarly broad measures; it drove downits non-revenue water ratio from 63% in1997 to just 11% in 2010.61
Apply demand management
Demand-side strategies, aimed atredistributing demand in time, spaceor mode, are equally important inmaking the most of existing capacity.
They often present a cost-effectivealternative to increasing capacity, andalso have the potential to deliver betterenvironmental outcomes, improvedpublic health and more prosperous andliveable cities.
As Tony Blair declared during histime as British Prime Minister, “Wecannot simply build our way out ofthe problems we face. It would beenvironmentally irresponsible – andwould not work.”62 Far preferable would
be a comprehensive application ofdemand management techniques; thiscould, for instance, reduce peak-periodcar travel in British urban areas by over20%.63 The opportunities for applyingdemand management have increasedgreatly, thanks to technologicalprogress in metering, billing andpayment, such as e tolling and smartmeters.
Four broad approaches areavailable: time-based user charges;self-regulation through improvedinformation; increased operationscontrol; and a shift of demand acrossmode and space.
7/25/2019 Strategic Infrastructure Steps Report 2014
http://slidepdf.com/reader/full/strategic-infrastructure-steps-report-2014 28/88
28 Steps to Operate and Maintain Infrastructure Efficiently and Effectively
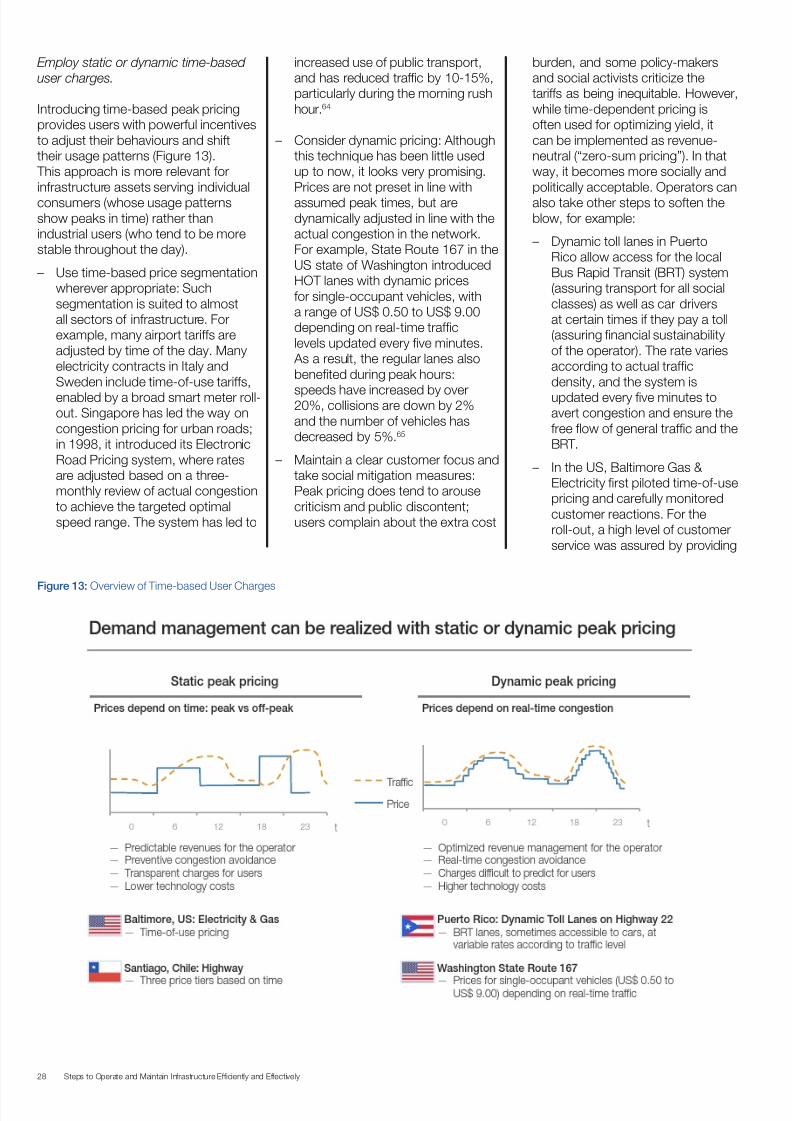
Employ static or dynamic time-based
user charges.
Introducing time-based peak pricingprovides users with powerful incentivesto adjust their behaviours and shifttheir usage patterns (Figure 13). This approach is more relevant forinfrastructure assets serving individualconsumers (whose usage patternsshow peaks in time) rather thanindustrial users (who tend to be morestable throughout the day).
– Use time-based price segmentationwherever appropriate: Suchsegmentation is suited to almostall sectors of infrastructure. Forexample, many airport tariffs areadjusted by time of the day. Manyelectricity contracts in Italy andSweden include time-of-use tariffs,
enabled by a broad smart meter roll-out. Singapore has led the way oncongestion pricing for urban roads;in 1998, it introduced its ElectronicRoad Pricing system, where ratesare adjusted based on a three-monthly review of actual congestionto achieve the targeted optimalspeed range. The system has led to
increased use of public transport,and has reduced traffic by 10-15%,particularly during the morning rushhour.64
– Consider dynamic pricing: Althoughthis technique has been little usedup to now, it looks very promising.Prices are not preset in line withassumed peak times, but aredynamically adjusted in line with theactual congestion in the network.For example, State Route 167 in theUS state of Washington introducedHOT lanes with dynamic pricesfor single-occupant vehicles, witha range of US$ 0.50 to US$ 9.00depending on real-time trafficlevels updated every five minutes. As a result, the regular lanes alsobenefited during peak hours:
speeds have increased by over20%, collisions are down by 2%and the number of vehicles hasdecreased by 5%.65
– Maintain a clear customer focus andtake social mitigation measures:Peak pricing does tend to arousecriticism and public discontent;users complain about the extra cost
burden, and some policy-makersand social activists criticize thetariffs as being inequitable. However,while time-dependent pricing isoften used for optimizing yield, itcan be implemented as revenue-neutral (“zero-sum pricing”). In thatway, it becomes more socially andpolitically acceptable. Operators canalso take other steps to soften theblow, for example:
– Dynamic toll lanes in PuertoRico allow access for the localBus Rapid Transit (BRT) system(assuring transport for all socialclasses) as well as car driversat certain times if they pay a toll(assuring financial sustainabilityof the operator). The rate variesaccording to actual trafficdensity, and the system is
updated every five minutes toavert congestion and ensure thefree flow of general traffic and theBRT.
– In the US, Baltimore Gas &Electricity first piloted time-of-usepricing and carefully monitoredcustomer reactions. For theroll-out, a high level of customerservice was assured by providing
Figure 13: Overview of Time-based User Charges

7/25/2019 Strategic Infrastructure Steps Report 2014
http://slidepdf.com/reader/full/strategic-infrastructure-steps-report-2014 29/88
29Steps to Operate and Maintain Infrastructure Efficiently and Effectively
energy reports, investing inadvanced meters and retainingoptionality for users. The resultwas a high customer-satisfactionrate, while achieving the goal ofreducing peak demand by 18-33%.66
Promote self-regulation through usereducation and information.
Customer behaviour is driven by morethan just financial incentives. In fact,if users perceive the value of shiftingtheir demand patterns – value such asless time lost or better environmentaloutcomes – they might intrinsicallyadapt their behaviour. In somesettings, however, additional consumereducation is needed on the potentialof savings and appropriate measures,
as in the São Paulo Slum Electrificationand Loss Reduction Programme inBrazil. If customers are educated aboutthe potential impact, all they need is therelevant information to act. Technologyis making such information increasinglyavailable. Smart meters, for example,enable customers to “see” their usageprofile in real time and take appropriateaction. A survey in North Americafound that 71% of consumers believethat detailed water usage data wouldencourage them to save water.67 The
various technologies employed in thetransport sector can be considered,ranging from asset-heavy solutions onthe infrastructure side to asset-light ITon the user side:
– Asset-heavy: Hong Kong’s Route8 highway, for instance, hastraffic displays providing real-time congestion information withwarnings, and also implementspassive and active diversion.68
– Asset-light: Traffic and navigationapps such as Waze (community-based and crowd-sourced) arenow available. Drivers passivelycontribute real-time traffic data,or actively report accidents andany other hazards; the app thenprovides other road users withan up-to-the-minute account ofroad conditions and suggests anoptimized route.
Increase operations control.
In many cases, promoting self-regulation may not be sufficient; explicitusage limitations may be required,which can usefully complement the
pricing approaches while avoiding thesocial-exclusion effects of user charges. Administrative slot allocation at airportsis one example, and many cities, from Athens, Greece to Quito, Ecuador,impose road space rationing based onlicence plate numbers.
Shift demand across mode and space.
The various techniques just discussed– static and dynamic peak pricing, self-regulation and operations control – canfacilitate demand management not justby reducing demand or by redistributingit more evenly across time, but also byspreading it across space and mode.Examples include:
– Shifts in space: In France, todiscourage diversions of truck
drivers from tolled highways tofree regional roads, authorities areplanning a satellite-based tollingsystem to charge trucks even whenthey are on these non-toll regionalroads.
– Shifts in mode: To encouragecargo companies to use rail ratherthan road transport, Switzerlandintroduced a heavy traffic toll, basedon distance, weight and emissions. As a result, heavy-truck traffic
across the Alps has slightly declinedover the last ten years despiteincreasing cross-border trade.Canada’s Central Okanagan region,formerly the most car-dependent
region of British Columbia with 85%of suburban commuters driving towork in single-occupant vehicles,set about to redress the balance. Itraised parking prices above the costof a public transport pass; launcheda carpooling initiative; introduceda school-based, green transporteducational programme; andexpanded infrastructure for bicyclesand public transport. The result wasa surge in bicycle commuting, withone in seven residents bicyclingto work in 2004, and the region’shighest growth rate in publictransport usage.69
To succeed in shifting usage in modeor space, the best strategy is notonly to impose punitive pricing on the
traditional, unfavoured option, butalso to ensure that the new, favouredoption offers greater convenience andefficiency. In the Swiss case mentioned,the railway option became morecompetitive because the governmentinvested in modernizing the railinfrastructure, and introduced reformsthat gave rail companies greaterflexibility and entrepreneurial freedom.
The work of the World Economic Forumin Tianjin, People’s Republic of China,
reflects another wide-ranging concertedinitiative, involving systemwidethroughput optimization and demandmanagement measures (Box 3).

7/25/2019 Strategic Infrastructure Steps Report 2014
http://slidepdf.com/reader/full/strategic-infrastructure-steps-report-2014 30/88
30 Steps to Operate and Maintain Infrastructure Efficiently and Effectively
Box 3: The Future of Urban
Development Initiative and Its Work
in Tianjin, People’s Republic of China
The Future of Urban DevelopmentInitiative,70 led by the World EconomicForum, aims to serve as a partner intransformation for cities around theworld as they address major urbanchallenges. Tianjin, its inaugural“champion city”, is a growing
metropolis of 13 million people, withthe world’s sixth-largest seaport andan important special economic zonefor manufacturing. Not surprisingly, itsuffers from heavy traffic congestion,and the initiative has developed aholistic city strategy to address theissue.
While car ownership in the city hasrecently increased 10-15% per year,road infrastructure has increased byonly 3%. With the number of cars
forecast to double between 2010 and2015, the solution will have to involvemore than constructing new roadsand public transport systems; it willalso require optimizing the operationsof the existing transport network. Theinitiative’s recommendations include thefollowing:
Expand intelligent transport systems.
– Introduce dynamic traffic control andparking guidance systems
– Improve driver information ontraffic conditions using dynamicsignboards, highway radio and on-board navigation systems
– Install transponders for electronic tollcollection and congestion pricing
Optimize public transport operations.
– Improve last-mile access bycoordinating bus and metroschedules
– Introduce digital payment cards validfor all transport modes within thesystem
– Eliminate left turns on bus routes,and introduce express and local busservices
– Establish a BRT system with its ownright of way
Integrate land use and transport planning.
– Establish a process for allgovernment departments to worktogether on land use and transportplanning
– Promote transit-orienteddevelopment
– Create a safer and more pleasantenvironment for bicycling andwalking
Optimize availability and reduce
downtime
Asset availability may be constrainedby legal issues, for instance with night-time restrictions on port and airportoperations. In such cases, the unusedcapacity can only be released throughregulatory changes. For other typesof downtime, however, resolution lieswithin the power of the infrastructure
operators themselves.
Asset downtime certainly represents achallenge for operators, and reducesreliability for users. Eight out of 10 portssuffer from unscheduled downtime, andof those, almost half are down at least10% of the time.71 These challenges areincreasing as the stock of infrastructureassets ages. For example, Germany’sKiel Canal, the most travelled artificialwaterway in the world, had to closefor several days in 2013 for repairs
to its inadequately maintained locks. This downtime required detours of 250nautical miles (463 km), costing about€ 70,000 on average per vessel.72
To increase availability, operatorsshould take the following measureswhen appropriate and feasible:
– Reduce the number of scheduleddowntimes by adapting themaintenance cycle and by bundlingmaintenance tasks into a one-timeintervention.
– Minimize the risk and number
of unscheduled breakdowns by
7/25/2019 Strategic Infrastructure Steps Report 2014
http://slidepdf.com/reader/full/strategic-infrastructure-steps-report-2014 31/88
31Steps to Operate and Maintain Infrastructure Efficiently and Effectively
undertaking regular and reliablepreventive maintenance and byadhering to strict constructionstandards.
– Reduce the downtime of eachoutage by optimizing the repairand maintenance processes. Forexample, Skanska used rapid-strength concrete for road pavingbay replacements on the UK’s M25motorway to minimize lane closuresand increase road availability fordrivers. Autostrade per l’Italiahas broadly re-engineered itsmaintenance processes for bridgesand viaducts, reducing the share ofmaintenance tasks with medium-to-severe traffic interference from50% to 10%. Shift work can keepconstruction sites active, and
thereby also speed completion ofrepairs: in Germany, for instance,highway works currently use onlytwo-thirds of the maximum possibledaylight working hours.73
– Consider operations requirements in
maintenance planning. Autostradeper l’Italia schedules short-durationmaintenance tasks for off-peakhours, minimizing the inconvenienceto drivers if congestion could beexpected during daytime works.
– Keep the systems running during
maintenance works by properlyplanning deviations and providingtemporary alternatives. Forexample, Skanska, while replacingthe movement joints underneaththe Queen Elizabeth II Bridgeon the M25 motorway, installedan innovative ramp to reducethe duration of lane closuresand increase bridge availabilityfor drivers. The Panama Canal
duplicates key components toensure 365-day, 24-hour service;two pairs of canal locks and twopairs of valves for the lock chambersexist, so replacements can bemade without interrupting normaloperations.
– Improve incident management .
Accidents, other incidents andconstruction work jointly accountfor up to 25% of road congestion,74 so efficient incident managementis crucial, including accidentprevention measures, a quick-response rescue service, rapidclearance of accident sites and
localized weather forecasting to alertsnow removal teams. London isimproving the management of utilityconstruction sites with a web-basedutility management plan, a systempiloted in Birmingham: if proposedwater and electricity utility works arelikely to interrupt traffic, the operatoris assigned a specific time slot forcarrying them out, and has to pay apenalty if the deadline passes beforecompletion.
As all the measures come at a price,the objective is not to maximizeavailability but to find the optimaloperating range – to balance the costsof implementing the various measuresagainst the benefits, such as saveduser time and revenues. Aircraftoperators and manufacturers serve
as good examples; their sophisticatedquantitative models determine optimalO&M schedules for reducing downtime.
1.2 Enhance qualityfor users
Historically, the users of infrastructureassets have not been a priorityconsideration for many operators.Infrastructure facilities tend to enjoya natural monopoly, so there is little
competitive pressure to provideoutstanding customer service.Instead, a “public service mentality”tends to prevail – the dutiful provisionof predefined, uniform service forcustomers rather than an engagedeffort to monitor their changing needsand satisfy their wishes. The customers,on their side, might grumble, but theiroptions are limited, especially if theservice is subsidized or provided forfree, and usually no alternative provision
exists anyway.
Service quality, a constant issue inmany countries, is becoming moreacute because of ageing assets. Low-quality service is not only annoying forusers, but is also expensive for society. The US Department of Energy reports,for example, that power outages costthe national economy US$ 150 billionannually.75
On the users’ side, expectations
are rising not only because of theincreasingly applied “user pays”principle, and increased competitionand privatization, but also becausecustomers increasingly compare
their local service to internationalbenchmarks, such as the Skytraxrating of airports.76 As some usergroups consolidate – through airlineand shipping mergers or alliances, forexample – so their clout increases.
Against this background, infrastructureoperators need to take steps toadvance their service levels. Threebroad strategies are indicated:adopting a customer-centric operatingmodel; enhancing the end-to-enduser experience; and launching smarttechnologies to refine performance.
Adopt a customer-centric operating
model
Infrastructure has traditionally beenan engineering-driven endeavour,
which puts greater emphasis on theasset than on the user. By custom,the operators adhere to predefinedperformance standards derived fromstable, well-defined and standardizedregulatory requirements and/ortechnical handbooks, and pay littleattention to customers’ ambiguous anddiverse needs. The providers might putgreat effort into optimizing the asset’stechnical features (e.g. the speed oftrains), while disregarding what is reallyimportant to the customer (e.g. access
to and frequency of the trains, and thecomfort and general experience of the journey).
In view of these challenges, however,some operators are beginning tosee the virtues of a more customer-centric mindset, and are trying outthe standard marketing tools routinelyapplied in consumer industries. Toembrace customer orientation, theyshould seek to improve customer
insight, and then adopt an operatingmodel that enables continuous clientfocus and service.
Improve customer insight.
– Identify the customers and segmentthe customer base. Infrastructureoperators do not necessarily havea direct relationship with end users,and so might not have a goodunderstanding of their needs. Bothdirect and indirect customers exist:at airports, the airline companiesas well as passengers; and atports, the shipping lines, third-party logistics providers, railwaysand trucking companies, all with
7/25/2019 Strategic Infrastructure Steps Report 2014
http://slidepdf.com/reader/full/strategic-infrastructure-steps-report-2014 32/88
32 Steps to Operate and Maintain Infrastructure Efficiently and Effectively
their distinct needs. Some airportshave duly developed an in-depthunderstanding of their variouscustomer segments, even targetingnon-travellers (e.g. sightseers andpick-up people), and increasedtheir appeal to them through, forexample, airport events, visitor toursand improved landside shopping
outlets.
– Understand what the customersneed. Conducting market analysisand research to provide a thoroughunderstanding of the drivers, trendsand economics of the corporatecustomer’s business and the enduser’s personal needs can helpcreate a compelling customerexperience for infrastructure assetsand related services.
– Conduct customer surveys:While standard procedure inconsumer industries, surveys arestill underutilized by infrastructureproviders. A survey of 10,000airport users on their most-wanted amenities revealedthat 49% want a cinema, 36%would appreciate sleepingoptions and, perhaps surprisinglyin the age of e-readers andsmartphones, about 32% wouldlike a library; yet, only a few
airports offer these services.77
Without proper market research,operators often give priorityto “hard” characteristics suchas speed, rather than to “soft”characteristics (e.g. convenience,reliability), even though usersmight also demand the latter.
– Assess user needs accordingto various categories: Thesecover essential requirementssuch as accessibility, affordabilityand safety; basic requirementsincluding performance,reliability and ease of use; andadvanced requirements suchas information, comfort andancillary services (Figure 14).While the basic requirements are“hygiene factors”, the higher-level requirements can provide adifferentiated user experience.
– Establish what the customer valuesin order to prioritize spending
among the quality categories.Use advanced analytical toolsincluding conjoint or discretechoice analysis, based on revealedor stated preferences data or
big data analytics, to clarifycustomers’ willingness to pay. Also,consider upgrading to two-wayuser engagement through socialnetworks to receive lively feedback.
The overall objective is not to maximizequality, but to deliver the appropriatelevel of quality in line with the users’
quality-cost trade-off. In other words,operators need to strike a trade-offbetween service improvements andincreased costs. Such an approachwill help to accomplish two aims: first,to challenge over-engineered technicalspecifications with no tangible benefitto the end user; and second, to ensurethat hidden customer requirements doget fulfilled.
Enable and institute customer
orientation in the operating model.
– Define a customer value proposition,differentiated by customer group.For example, some ports arespecializing in a particular usersegment, such as shippers seekingto minimize port and service fees, orshippers whose priorities are quickturnaround times and streamlinedprocedures. In fact, a singleinfrastructure facility can provide formore than one customer segment.
Kuala Lumpur International Airport inMalaysia opened a special terminalto serve low-cost airlines that valuequick aircraft turnarounds and lowairport fees, while the main terminalcaters to full-service carriers byproviding short connecting timesand high-quality services.
– Evaluate the competitive advantageand the uniqueness of the valueproposition relative to competition(which is often indirect). Forexample, the Panama Canalmonitors the alternative routes, suchas the US intermodal land bridge orthe Suez Canal, segmented by typeof goods.
– Develop and implement acomprehensive marketing plan. The benefits can be remarkable:even toll roads, where demand islargely exogenous, have increasedrevenues by about 10% using thefull marketing mix – product andprocess improvements such as
e-tolling, special promotions, priceoptimization by time and user group,and loyalty programmes.
– Measure and track customer
performance and satisfaction. Setup an outcome-oriented internalmanagement system based onkey performance indicators (KPIs)with specific quality targets.Incentivize the organization throughperformance standards and service-level agreements (for example,some airports have entered into
KPI-based quality-performanceagreements with airlines). Inaddition, communicate the qualityresults to stakeholders to keep theminformed. However, care shouldbe taken to manage expectations;for instance, rail customers mightexpect 100% punctuality, but formost operators a realistic target isabout 80%, and they should engagecustomers accordingly.
– Shift to a customer-oriented
organizational set-up. LeightonContractors in Australia uses a24 hours a day, 7 days a week(24/7) help desk at the SouthEast Queensland Schools PPP toserve as a single point of contactfor teachers to discuss anyconcerns about security, cleaning,maintenance, groundkeeping and janitorial services. The helpdeskresolves 97% of issues at firstcontact, thereby freeing teachers todevote their energies to educational
outcomes. And the Dutch oil andgas terminal company Royal Vopakuses a key account managementsystem as a one-stop shop forcustomers, contributing to itsconsistently high occupancy rate.
– Engage the workforce. To ensurehigh-quality customer service, acommitted workforce is just asimportant as well-defined processesand advanced technology. The high punctuality levels on
Japanese railways, for example,are attributable not only to excellentmaintenance, availability of reservecarriages and careful timetableplanning, but also to the training ofnew drivers on punctuality, and tothe governance model that enablescommunication and coordinationacross drivers, and allowsdepartments to excel in incidentmanagement.
– Train staff in customer service as
well as operational processes. Paris-Orly Airport in France runs coursesfor staff on how to treat customersfrom different cultures (e.g. India,China) to meet their specificexpectations.78

7/25/2019 Strategic Infrastructure Steps Report 2014
http://slidepdf.com/reader/full/strategic-infrastructure-steps-report-2014 33/88
33Steps to Operate and Maintain Infrastructure Efficiently and Effectively
Figure 14: Types of Requirements for Infrastructure Users
Enhance the end-to-end user
experience
The best operators not only addressthe basic requirements of users, butalso strive to create a positive end-to-end user experience in two respects:the operators excel in ancillary servicesby holistically addressing all customerneeds (Figure 14), and they optimizethe whole network performance by
partnering with adjacent assets andother stakeholders.
Address customer needs holistically.
To maximize the value that thecustomer will derive from using theinfrastructure, operators shouldconsider all end-to-end servicefeatures that may be relevant fromthe customer’s perspective. Someexamples:
– The Panama Canal Authority (ACP),or Autoridad del Canal de Panamá,has launched a just-in-time schemethat notifies vessels of their requiredarrival time and their provisionaltransit time 96 hours prior to theirscheduled transit. This informationenables them to arrive much closerto their scheduled transit, andthereby reduces anchorage timeand saves fuel because they canslow-steam to the canal entrance.79
– Vinci Autoroutes strives to provideroad users not only with a high-standard, on-road experience, butalso with an impressive end-to-end
experience by “reinventing thebreak”. It introduced 33 themed reststations, including a vineyard stationclose to Bordeaux and a “Catalan Village” close to the Spanish border.During the summer high season,it organizes events (sports andgames, and family-centred andkids’ activities including a pettingzoo) which attract nearly 500,000participants.80
– In the airport sector, SingaporeChangi Airport is a world leader incustomer quality, with the accoladeof 5-Star status in the Skytraxratings. Its high rating is due at leastin part to the abundance and qualityof ancillary services it offers in theeffort to satisfy various customerneeds. Figure 15 provides anoverview of these services. (Someof them can actually be chargedfor, and contribute to the funding
of O&M activities, as elaborated inchapter 2.1.)
Optimize the quality of the full system, in partnership with other stakeholders.
Infrastructure assets operate innetworks, and an individual operatoris unlikely to have full control over thewhole system’s performance. No matterhow impressively any one operatorperforms, the user experience could bedented by any poor performance onthe part of adjacent assets or carriersusing the infrastructure. Accordingly, tooptimize full system performance andthe end-to-end customer experience,partnering is crucial.
– Partner with main users. Enter intostrategic partnerships with the mainclients, as they play a key role indelivering quality to the end user.Frankfurt Airport cooperates closelywith its main airline by integratinginformation, logistics processesand IT systems, to keep connectingtimes to a minimum and avoiddelays and lost baggage.
– Partner with adjacent assets. Portoperators, for instance, need tocooperate with adjacent supplychain operators (e.g. railways) tooptimize hinterland connectivity andintermodal processes, and therebyenhance the full supply chain’scompetitiveness.
– Partner with relevant nationalauthorities. Khalifa Port in Abu Dhabi
joined forces with the Customs Administration and the Food Control Authority to introduce a one-stop-shop system for customers. Withtheir backing, Khalifa Port is able tointegrate and accelerate the flow oftrade-related documentation in acentralized electronic system.81
Use smart technologies to refine
user performance
As digitization is affecting all
businesses, it is also becoming a keydriving force in infrastructure. Currentlyno pressing need for additionalinnovation exists, as many smarttechnologies are already available andhave been tested. Better and widerapplication, however, is needed. Byharnessing the new technologies aptly,infrastructure providers can ease manyof the traditional quality-cost trade-offsand achieve win-win solutions (Figure16; and chapter 1.3 on automation.)
Consider the example of e-tolling onhighways and its effects: for customers,it speeds up the journey and reducescongestion; for the operator, it reducesthe cost of collecting payments; andfor the environment, it lowers emissionsand fuel consumption by reducingstops and waits at tollbooths.
Smart technologies can be employedto produce three types of improvementin quality for users: better customer
information and interaction; improvedsystem performance and safety; andfaster billing and payment. Operatorsneed to take advantage of using smarttechnologies in each case.
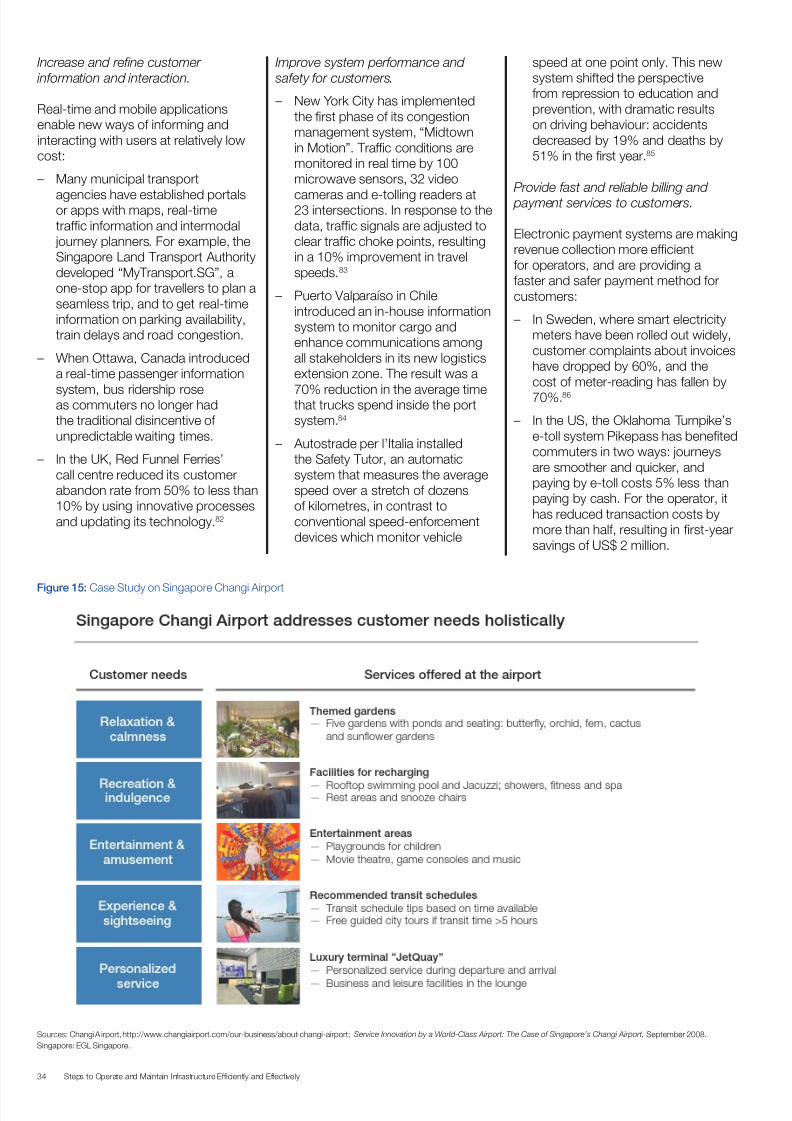
7/25/2019 Strategic Infrastructure Steps Report 2014
http://slidepdf.com/reader/full/strategic-infrastructure-steps-report-2014 34/88
34 Steps to Operate and Maintain Infrastructure Efficiently and Effectively
Increase and refine customer
information and interaction.
Real-time and mobile applicationsenable new ways of informing andinteracting with users at relatively lowcost:
– Many municipal transport
agencies have established portalsor apps with maps, real-timetraffic information and intermodal journey planners. For example, theSingapore Land Transport Authoritydeveloped “MyTransport.SG”, aone-stop app for travellers to plan aseamless trip, and to get real-timeinformation on parking availability,train delays and road congestion.
– When Ottawa, Canada introduceda real-time passenger information
system, bus ridership roseas commuters no longer hadthe traditional disincentive ofunpredictable waiting times.
– In the UK, Red Funnel Ferries’call centre reduced its customerabandon rate from 50% to less than10% by using innovative processesand updating its technology.82
Improve system performance and
safety for customers.
– New York City has implementedthe first phase of its congestionmanagement system, “Midtownin Motion”. Traffic conditions aremonitored in real time by 100microwave sensors, 32 video
cameras and e-tolling readers at23 intersections. In response to thedata, traffic signals are adjusted toclear traffic choke points, resultingin a 10% improvement in travelspeeds.83
– Puerto Valparaíso in Chileintroduced an in-house informationsystem to monitor cargo andenhance communications amongall stakeholders in its new logisticsextension zone. The result was a
70% reduction in the average timethat trucks spend inside the portsystem.84
– Autostrade per l’Italia installedthe Safety Tutor, an automaticsystem that measures the averagespeed over a stretch of dozensof kilometres, in contrast toconventional speed-enforcementdevices which monitor vehicle
speed at one point only. This newsystem shifted the perspectivefrom repression to education andprevention, with dramatic resultson driving behaviour: accidentsdecreased by 19% and deaths by51% in the first year.85
Provide fast and reliable billing and payment services to customers.
Electronic payment systems are makingrevenue collection more efficientfor operators, and are providing afaster and safer payment method forcustomers:
– In Sweden, where smart electricitymeters have been rolled out widely,customer complaints about invoiceshave dropped by 60%, and thecost of meter-reading has fallen by
70%.86
– In the US, the Oklahoma Turnpike’se-toll system Pikepass has benefitedcommuters in two ways: journeysare smoother and quicker, andpaying by e-toll costs 5% less thanpaying by cash. For the operator, ithas reduced transaction costs bymore than half, resulting in first-yearsavings of US$ 2 million.
Figure 15: Case Study on Singapore Changi Airport
Sources: Changi A irport, http://www.changiairport.com/our-business/about-changi-airport; Service Innovation by a World-Class Airport: The Case of Singapore’s Changi Airport, September 2008.
Singapore: EGL Singapore.

7/25/2019 Strategic Infrastructure Steps Report 2014
http://slidepdf.com/reader/full/strategic-infrastructure-steps-report-2014 35/88
35Steps to Operate and Maintain Infrastructure Efficiently and Effectively
– The Octopus payment card in HongKong, used by 95% of the 16-65year-old population, allows users tomake seamless payments acrossall modes of transport (bus, rail andboat), as well as at parking garages. The card also provides users withdiscounts, and is accepted at12,000 retail outlets.87
Such smart systems can generatefurther value for operators; by collectingand analysing data, they can gaindeeper insight into user behaviourand thereby optimize capacities,enable time-based pricing and provideadditional information to customers.
Smart solutions are not a panacea,of course, and sometimes they are
inappropriate. They can be difficultto integrate into legacy systems, andthe investment required for acquiringand installing them might not beworth it. Some smart meter projects,for instance, have failed to provide apositive business case. Moreover, thetechnology landscape is still evolving,with asset-heavy solutions implementedby infrastructure operators competingagainst asset-light and smart-phone-based solutions. Despitethis uncertainty, many technologies
that appear too expensive today willincreasingly become cost-effectivewhen implemented at scale, and willfurther enhance the effectiveness andefficiency of infrastructure assets.
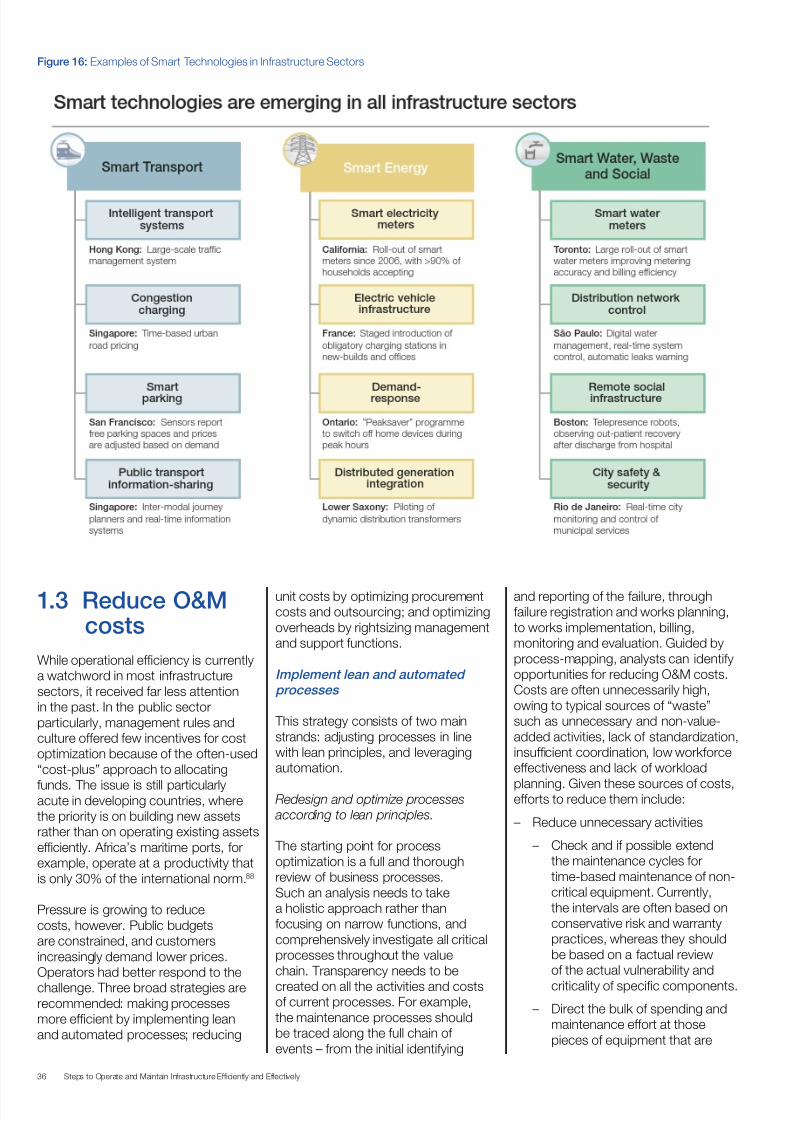
7/25/2019 Strategic Infrastructure Steps Report 2014
http://slidepdf.com/reader/full/strategic-infrastructure-steps-report-2014 36/88
36 Steps to Operate and Maintain Infrastructure Efficiently and Effectively
Figure 16: Examples of Smart Technologies in Infrastructure Sectors
1.3 Reduce O&Mcosts
While operational efficiency is currentlya watchword in most infrastructuresectors, it received far less attentionin the past. In the public sectorparticularly, management rules andculture offered few incentives for costoptimization because of the often-used“cost-plus” approach to allocating
funds. The issue is still particularlyacute in developing countries, wherethe priority is on building new assetsrather than on operating existing assetsefficiently. Africa’s maritime ports, forexample, operate at a productivity thatis only 30% of the international norm.88
Pressure is growing to reducecosts, however. Public budgetsare constrained, and customersincreasingly demand lower prices.Operators had better respond to thechallenge. Three broad strategies arerecommended: making processesmore efficient by implementing leanand automated processes; reducing
unit costs by optimizing procurementcosts and outsourcing; and optimizingoverheads by rightsizing managementand support functions.
Implement lean and automated
processes
This strategy consists of two mainstrands: adjusting processes in linewith lean principles, and leveragingautomation.
Redesign and optimize processes according to lean principles.
The starting point for processoptimization is a full and thoroughreview of business processes.Such an analysis needs to takea holistic approach rather thanfocusing on narrow functions, andcomprehensively investigate all criticalprocesses throughout the valuechain. Transparency needs to be
created on all the activities and costsof current processes. For example,the maintenance processes shouldbe traced along the full chain ofevents – from the initial identifying
and reporting of the failure, throughfailure registration and works planning,to works implementation, billing,monitoring and evaluation. Guided byprocess-mapping, analysts can identifyopportunities for reducing O&M costs.Costs are often unnecessarily high,owing to typical sources of “waste”such as unnecessary and non-value-added activities, lack of standardization,insufficient coordination, low workforceeffectiveness and lack of workload
planning. Given these sources of costs,efforts to reduce them include:
– Reduce unnecessary activities
– Check and if possible extendthe maintenance cycles fortime-based maintenance of non-critical equipment. Currently,the intervals are often based onconservative risk and warrantypractices, whereas they shouldbe based on a factual reviewof the actual vulnerability and
criticality of specific components.
– Direct the bulk of spending andmaintenance effort at thosepieces of equipment that are
7/25/2019 Strategic Infrastructure Steps Report 2014
http://slidepdf.com/reader/full/strategic-infrastructure-steps-report-2014 37/88
37Steps to Operate and Maintain Infrastructure Efficiently and Effectively
most likely to fail and whosefailures would have the mostdamaging impact.
– Implement condition-basedmaintenance to avoid needlessreplacements and thereby saveon costs.
– Consider start-from-homeinitiatives rather than summoningdepot-based maintenanceteams, to reduce travel incompany cars and trucks.
– Standardize O&M processes
– Develop standard operatingprocedures, including the “who,what, where, when, why andhow”. For example, LondonUnderground developed ageneric concept describing
the likely O&M of stations,depots, railways and passengerservices up to 2020, in order toreduce the variety of operatingstandards and equipmentused in future upgrades andto achieve high reliability atminimum cost.89 Remain alert tochanging system requirements,however, and remain flexibleenough to forgo somestandardization.
– Improve work scheduling andcoordination
– Strengthen field forceeffectiveness by refiningcoordination betweensupervisors and the field force,as well as contractors. YorkshireWater (UK) integrated anddigitized all previously paper-based data into a single, real-time information system tosharpen its work scheduling,enable dynamic task allocationand allow access for both theinternal field force and externalservice partners. Better routeingand information on repair jobs led to a 50% reductionin unnecessary field jobs,and customer performanceimproved.90
– Enhance workforce effectiveness
– Optimize team size, beingguided by internal or external
benchmarking.– Consider centralizing teams and
adopting flexible team set-ups.
– Consider staff specialization. At
the Barranquilla water supplierin Colombia, for example,specialized teams wereestablished to deal with differenttasks – customer-complainthandling, maintenance workand inspection. In conjunctionwith other initiatives, thisspecialization has reduced thetime taken to repair pipe leaks by50%.91
– Optimize staff allocation and shiftwork. By reorganizing its shifts,Singapore’s public transportoperator SMRT improved driverproductivity by 10%.92
– Plan well ahead to streamlineprocesses
– Integrate maintenance planningwith operations planning to
enable anti-cyclical scheduling ofmaintenance tasks during timesof low system load.
– Plan holistically to reduceworkload variability and toaverage out workloads over thecourse of the year.
– Plan individual work processesin a detailed way to avoid, forinstance, insufficient stocks ofinventory and hence delays andadditional logistics costs.
With its strong maintenance planningphilosophy, the ACP, for example,is able to pre-order or pre-buildcomponents and equipment, andthereby avoid waiting times duringthe actual maintenance works. UsingGantt charts, it plans maintenanceactivities down to the minute. Thanksto such detailed planning, it optimizesthe sequence of maintenance steps,and has succeeded in reducing major
gate outages from an average 14 daysin the past to just 4.5 days now. It hasalso successfully shifted to an all-in-one-go model of maintenance work,rather than multiple sequential workpackages, to avoid repeating some ofthe fixed costs (e.g. sending out staff,building scaffolding).
In some cases, however, economiesof scale can be achieved by bundlingsimilar maintenance tasks from varioussites, rather than by conducting all-in-
one-go maintenance at a single site.For example, the MTA New York City Transit found that its one-station-at-a-time rehabilitation approach wasproving too costly and time-consuming,
so it shifted to a component-basedprogramme. This involved assessingcertain items of equipment andstructures across all stations, suchas platform edgings or escalators,and then carrying out repairs whereindicated. In this way, resources wereconcentrated on the most neededupgrades.93
Leverage automation technologies.
Process optimization often requiresdifficult trade-offs between quality andcosts. The need for these traditionaltrade-offs can be increasingly reducedor even dispersed by automation.
Opportunities for automation abound– from driverless underground trainsin metros and unmanned stacking
cranes in ports, to the inspection ofassets using wireless sensors andto automated repair scheduling (seeFigure 17 and Box 4 for examples).Skanska’s use of Building InformationModelling provides a good example ofautomation leading to improved value.Instead of traditional survey methods,Skanska used laser scanning to storedesign and construction informationfrom structures and road surfaces, andto optimize and plan maintenance andrehabilitation works – providing a return
on investment of 10 to 1 relative to theold methods.
Automation is not limited to singleoperation processes, but is now beingapplied to whole systems. Control andmonitoring take place in integratedand sometimes remote operationscentres, which provide real-time, end-to-end visibility on all of a system’sprocesses, and enhance efficiencywithout compromising quality or safety. The high-tech Rio Operations Center
in Brazil is a case in point; openedin 2010, it integrates the data andmonitoring functions of 30 agenciesand utilities under one roof.94

7/25/2019 Strategic Infrastructure Steps Report 2014
http://slidepdf.com/reader/full/strategic-infrastructure-steps-report-2014 38/88
38 Steps to Operate and Maintain Infrastructure Efficiently and Effectively
Figure 17: Examples of Automation in Infrastructure
Box 4: GE’s Centralized Asset
Management Operating Model forHealthcare Facilities95
While health systems nowadays arechallenged to reduce costs to matchfinancial realities, the opportunity toreduce the cost burden associatedwith managing assets remainsrelatively neglected. About 95% of ahospital’s clinical asset base consists ofventilators, infusion pumps, telemetryunits and other mobile workhorsedevices. The amount of such
equipment per hospital bed has jumped62% over the past 15 years, butaverage utilization is only about 42%;a modern hospital’s asset inventory isnow both pricier than ever and oftenunderutilized.
GE’s Centralized Asset ManagementOperating Model for healthcare facilitiescan help reduce those costs. Themodel optimizes the asset workflowsat each hospital through better trackingand monitoring of the mobile assetsat all hospitals within a healthcaresystem. In addition to facility-level optimization, the model can enablehealthcare systems to leverage theiroperations’ scale on the system-
level by centralizing and coordinating
distribution of the devices for three ormore hospitals within a 50-mile (80-km)radius. In this comprehensive approach,all processes associated with clinicalasset management (procurement,utilization, infection control andequipment maintenance) are controlledand supported centrally. A centraldistribution unit maintains appropriatestocks at each facility, moving thedevices as needed from one hospital toanother to meet fluctuating demand.
By adopting the model, healthcaresystems can reduce the costsassociated with asset management by15-25%, and can save on future capitalspending.
Optimize procurement costs and
outsourcing
Optimize procurement costs.
Despite high spending, the purchasingpractices of infrastructure operatorsare often underdeveloped. Manyprocurement departments tend toconcentrate on the initial purchase
rather than on whole life-cycle cost, and
regularly base their purchase decisionon single product attributes, such asbrand, performance, durability or after-sales service. A wiser policy is to applya total-cost-of-ownership analysis,incorporating a whole life-cycle reviewof any high-value system, equipmentand component being purchased.
A comprehensive procurement strategyneeds to apply the various commercialprocurement levers such as suppliermanagement, bundling and best-
cost country sourcing. In addition,however, it should seek to enhanceprocurement processes and applytechnical procurement levers suchas standardization and make-or-buywhere possible. The checklist in Figure18 provides an overview of the variousprocurement levers, and the case studyon the As-Samra wastewater treatmentplant (Box 5) illustrates an example ofselect technical procurement levers.
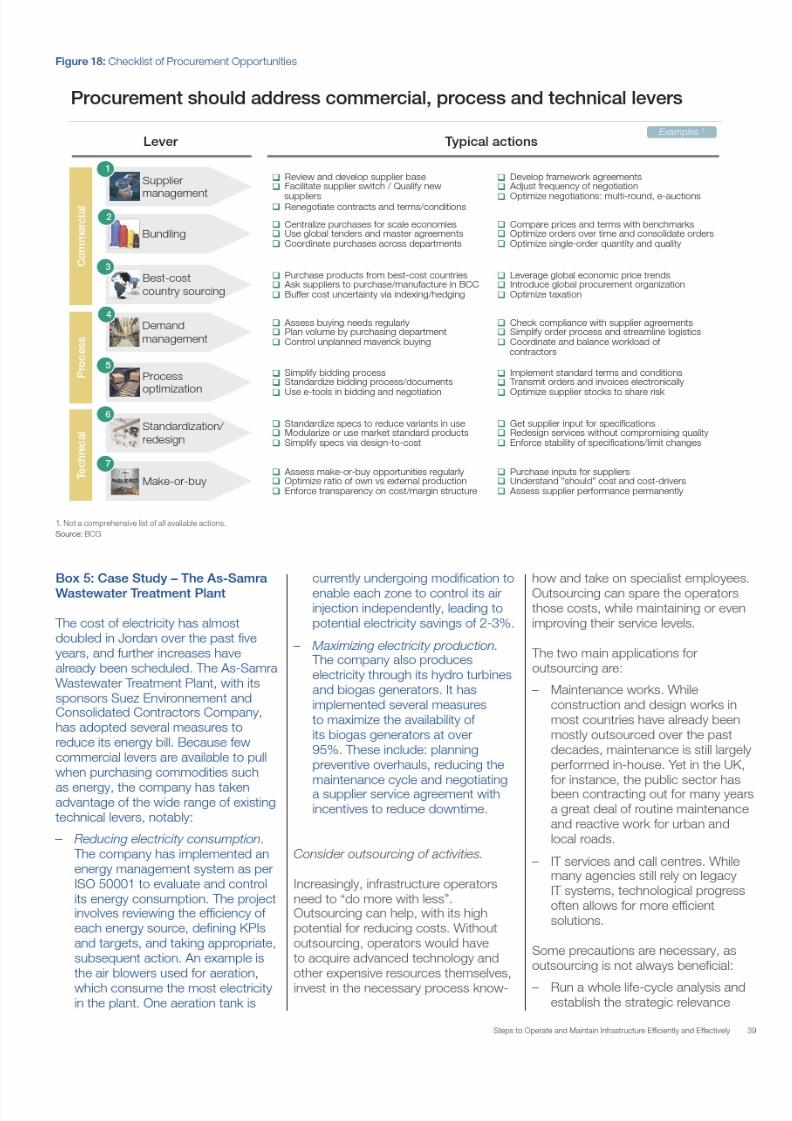
7/25/2019 Strategic Infrastructure Steps Report 2014
http://slidepdf.com/reader/full/strategic-infrastructure-steps-report-2014 39/88
7/25/2019 Strategic Infrastructure Steps Report 2014
http://slidepdf.com/reader/full/strategic-infrastructure-steps-report-2014 40/88
40 Steps to Operate and Maintain Infrastructure Efficiently and Effectively
of each activity that is a candidatefor outsourcing. Each make-or-buy decision should balance theoperator’s own know-how, cost andscale against those of third-partyproviders.
– Use performance-based contracts.Such contracts have worked
successfully in many countries(e.g. Brazil and Argentina) in theroads sector, as they incentivizethe private-sector partner tooperate efficiently over an extendedcontract period of 5-7 years withclear outcome-based performancemetrics. Typically, they achievesavings of 10 40%, while alsoimproving road quality and safety.96
– Decide carefully on the contractedoutsourcing period. It should be long
enough for the contractor to justifyinvestment in advanced equipment,research and development, trainingand new systems, but short enoughto benefit from a competitive marketand to get the best price throughregular re-tendering.
– Select the right package size or takea portfolio approach, where multiplesmall projects are packaged andmanaged by a single contractor.Such a method will realize
synergies and enable economiesof scale, reduce transaction costs,diversify financial risks for theprivate contractor, integrate themanagement of all the projects andprovide comparable standards. A good example is the trendtowards regional contracts for O&Moutsourcing. In Alberta, Canadafor instance, outsourcing contractshas led to 25% savings in roadmaintenance.97
– Assess and amend the procurementprocesses and foreign directinvestment framework to assurethat both domestic and foreignoutsourcing providers will be ableto participate in the bids. This willmaximize competitiveness and getthe best deal for the governmentbased on world-class skills andknowledge.
– Build a strong relationship withthe provider organization. Whilecontracts are obviously important,they often are not sufficient, asoutsourced services may entailhard-to-measure outcomes andunpredictable needs and costs, and
hence, a reliance on the provider’scooperative attitude.98
– Retain an appropriate levelof control. A fair degree ofdirect operational control maybe necessary when manycontractors are involved and inneed of coordination.
– Keep some of the outsourcedactivity in-house, to preservean “echo” or benchmark of theservice.
– Secure organizational know-how.Even when outsourcing is usedabundantly, the agency will stillneed staff with engineering andcommercial skills, to managerisks and to challenge thecontractors’ performance.
– Assess the alternatives tooutsourcing. For example, inDenmark, a fairly commonapproach to maintenance is throughpartnering. In Italy, Autostradeper l’Italia, in repaving its highwaynetwork with porous asphalt, optedto assign the project to its subsidiaryconstruction company. Thisapproach provided the flexibility and
incentives of external contracting,but also reaped the benefits ofscale across the network. The twoassociated organizations supportedeach other in optimizing the asphaltrecipe and the works processes,and succeeded in reducing the priceof the innovative asphalt by 30% tothe same level as regular asphalt.
Rightsize management and support
functions
In addition to improving operationalprocesses and costs, infrastructureoperators also need to make structuralimprovements to overheads. Manyorganizations have grown organicallyover time, changing their regionalfootprint and functional requirementsbut retaining legacy structures that
are now ill-suited to current demands.In this regard, the operator needs toconduct a regular strategic review ofits organization, and in particular itsmanagement and support functionssuch as finance, human resourcesand technology/IT. (See chapter 2.3for more comprehensive governancereforms to be initiated by policy-makers.)
7/25/2019 Strategic Infrastructure Steps Report 2014
http://slidepdf.com/reader/full/strategic-infrastructure-steps-report-2014 41/88
41Steps to Operate and Maintain Infrastructure Efficiently and Effectively
Transform into a lean organization.
Many infrastructure operatorsapparently regard themselves as“oversized”, and perceive their supportfunctions as being of low quality. Thefollowing remedies are indicated:
– Redesign the organization. A high-
performance organization requiresthe right structure, clearly definedindividual roles and accountabilities,as well as collaboration guidelinesand joint budgets to align incentivesand coordinate and facilitateinformation exchange acrossdepartments.
– Undertake delayering. Delayeringwill optimize the number of directreports (span of control). By makingthe organization leaner, operators
can avoid micromanagementand excessive bureaucracy, cutduplication and reduce the distancebetween top management and thecustomer.
– Investigate and perhaps adoptshared services. Such one-stopservice centres can centralize,standardize and automate support
functions, and reduce their costs byup to 40%.99
Any of these initiatives will only besuccessful if accompanied by arigorous, organization-wide changemanagement effort, supported bystrong commitment and strategicdirection from key executives.
Embed a cooperative and high-
performance culture.
Given a lack of spontaneouscooperation among employees,O&M decisions in many infrastructureorganizations are taken in silos. But tooptimize total costs of ownership, it isessential to have joint decisions andactive communication involving theengineering, construction, purchasing,
maintenance and operations functions. To realize such a cooperative culturerequires adaptation not just of theorganizational design, but also ofthe organizational context. Fosteringteamwork and cooperation involvesthe following essentials: shared valuesand vision, an open and performance-oriented culture, proper career paths,long-term incentives, strong leadershipcapabilities, and high-quality IT systemsand tools. Two examples illustrate this:
– The Tennessee Valley Authorityin the US introduced a BalancedScorecard with clear financial,customer, process and learningtargets, and cascaded andcommunicated this to all employees,with bonuses and non-monetaryrewards linked to the targets. Theinitiative resulted in office-spacesavings worth US$ 20 million, anda US$ 6 million reduction in systemlosses.100
– The ACP transformed from a“process control” culture to one ofentrepreneurial decision-making,by abolishing the “instructionsfor everything” and installing acontinuous improvement process,where staff can propose ideasthrough the intranet. The newculture inspired a team of about70 professionals to set up a“maintenance circle” and gettogether even after work hours todiscuss issues and best practices.
Balance centralization and
decentralization within the organization.
This balance is of particular importanceto network infrastructure such as roadsand railways, as well as to water andelectricity distribution and transmissionnetworks with an extensive regionalstructure. While the role of the centrecan vary, successful infrastructureoperations typically balance local assetmanagement responsibility with centralknowledge sharing and scale efficiencygains. Infrastructure assets are realassets, which require distributed visualinspection and asset managementinterventions by teams with localresponsibility for O&M. However, toenable economies of scale, somedegree of coordination, monitoringand exchange of know-how should be
provided by central units or regionaloperations centres.
1.4 Mitigateexternalities
Infrastructure is a public good, withgreat economic and social advantagesfor a variety of stakeholders. Theadvantages come at a cost, of course,and often not just financial costsbut also environmental and socialexternalities.
The environmental impact includescontributions to climate change, airpollution, loss of biodiversity, and soiland water pollution. For example, totalexternal transport costs in the EU(excluding congestion) amount to morethan € 500 billion or 4% of total GDP,and more than half is attributable toenvironmental impacts.101
The social impact includes adversehealth effects and the annoyance ofnoise and congestion. Traffic accidentskill more than 1.2 million peopleworldwide each year, and injure upto 50 million.102 See Figure 19 for anoverview of the environmental andsocial externalities of different transportmodes and electricity-generationtechnologies.
Increasingly, infrastructure operators arebeing scrutinized for their environmental
and social sustainability. Against abackground of resource constraints– scarcity of water, energy and rawmaterials – and the problems of wastemanagement and climate change,

7/25/2019 Strategic Infrastructure Steps Report 2014
http://slidepdf.com/reader/full/strategic-infrastructure-steps-report-2014 42/88
42 Steps to Operate and Maintain Infrastructure Efficiently and Effectively
infrastructure operators not only haveto meet the tighter environmentalregulations set by policy-makers, butalso have to pre-empt public criticismfrom consumers, societal groups andthe media.
Three broad approaches can be taken:planning a comprehensive programmeof sustainability/health, safety andenvironment (HSE) interventions;
embedding sustainable practices intoeveryday operations; and cooperatingwith other relevant stakeholders.
Arrange comprehensive
sustainability/HSE plans
Develop a holistic sustainability/HSE
strategy and plan.
Sustainability is a wide domain, so nosingle measure will suffice. Operatorsneed to take action, and set clearKPIs, on a number of fronts to tackleenvironmental and social issues. Inparticular:
– Improve resource efficiency to usematerials, energy and water in a
thoughtful and eco-friendly way, andto minimize waste.
Figure 19: Overview of Externalities in Transport and Electricity
1. Including landscape and biodiversity losses, soil and water pollution, and urban impacts 2. Vehicle and fuel production, and infrastructure provision 3.
Including material usage and impact on crops
Note: The data displayed for transport refers to the “high scenario” in the source.
Source: External Costs. Research results on socio-environmental damages due to electricity and transport, 2003. Brussels: European Commission
– Minimize the impact on biodiversityand the ecosystem.
– Minimize noise, dust and emissionsto mitigate the adverse healthimpact on local residents.
– Commit to responsible businessconduct by, for example, respectinglabour rights, preventing corruptionand preserving cultural and historicalmonuments.
One comprehensive model ofconcerted action is the “Paquet Vert
Autoroutier” that Vinci Autoroutessigned with the French government,which addresses several aspects ofsustainability (Figure 20).
Adopt a comprehensive set of
sustainability measures: “Reduce,
Recycle, Replace” – and Rethink.
– Reduce input materials, waste andemissions. London Undergroundis using regenerative braking tosave up to 25% of used electricity.Modern water treatment facilitiescan reduce sludge production by35% and energy use by 30%, whileemitting little bad smell.103 And, theUK’s National Grid has reducedgreenhouse gas emissions by 58%
from the 1990 baseline.104
– Recycle waste, as a resourcefor other products. The EastBay Municipal Utilities District inCalifornia uses methane from
waste to power generators,thereby making it one of the first
wastewater treatment facilities in theUS to be a net-energy producer.105 And in Singapore, the advancedtreatment facilities produce 30%of the country’s water supply, thusreducing reliance on imports fromMalaysia.106
– Replace equipment, and leverageinnovative technologies. Examplesof this are Tokyo’s Toei subway,which has replaced most of its trainswith energy-efficient rolling stock;
and efficient coal plants that emitabout one-third less CO
2 than most
of the plants currently installed.107
– Rethink the conventional waysof operating infrastructure. For
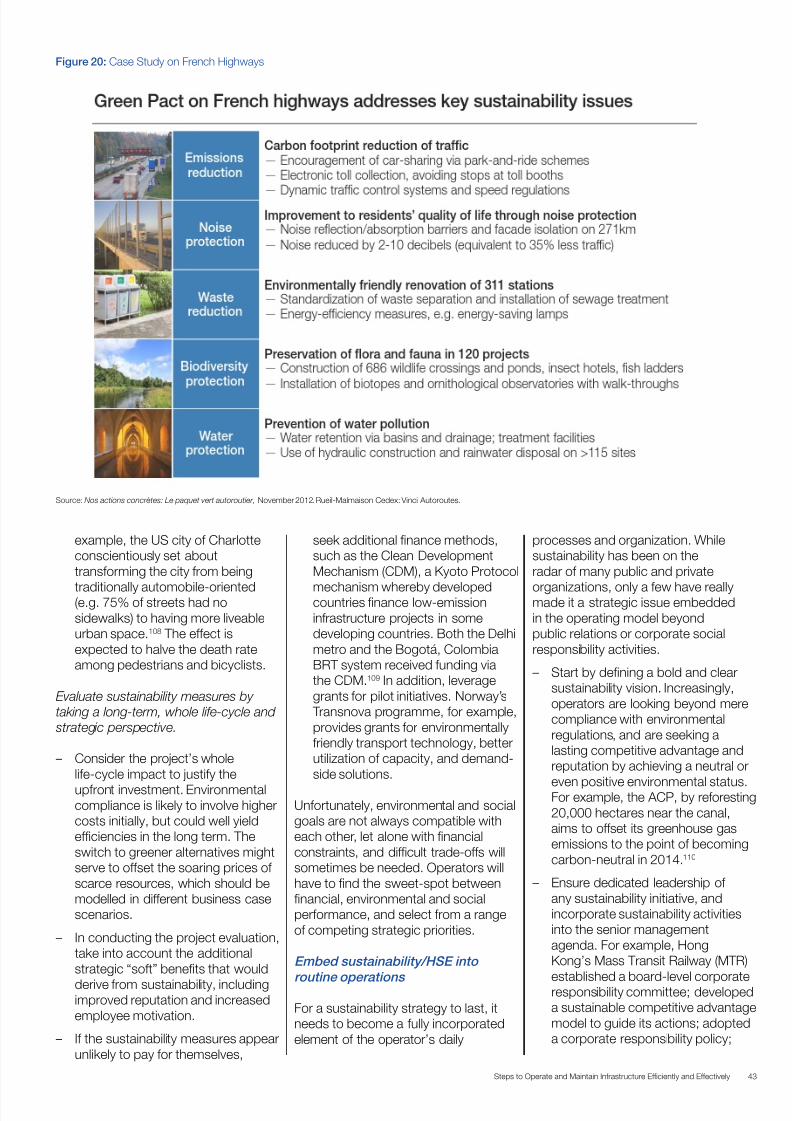
7/25/2019 Strategic Infrastructure Steps Report 2014
http://slidepdf.com/reader/full/strategic-infrastructure-steps-report-2014 43/88
43Steps to Operate and Maintain Infrastructure Efficiently and Effectively
Figure 20: Case Study on French Highways
Source: Nos actions concrètes: Le paquet vert autoroutier, November 2012. Rueil-Malmaison Cedex: Vinci Autoroutes.
example, the US city of Charlotteconscientiously set abouttransforming the city from being
traditionally automobile-oriented(e.g. 75% of streets had nosidewalks) to having more liveableurban space.108 The effect isexpected to halve the death rateamong pedestrians and bicyclists.
Evaluate sustainability measures bytaking a long-term, whole life-cycle and strategic perspective.
– Consider the project’s wholelife-cycle impact to justify the
upfront investment. Environmentalcompliance is likely to involve highercosts initially, but could well yieldefficiencies in the long term. Theswitch to greener alternatives mightserve to offset the soaring prices ofscarce resources, which should bemodelled in different business casescenarios.
– In conducting the project evaluation,take into account the additionalstrategic “soft” benefits that would
derive from sustainability, includingimproved reputation and increasedemployee motivation.
– If the sustainability measures appearunlikely to pay for themselves,
seek additional finance methods,such as the Clean DevelopmentMechanism (CDM), a Kyoto Protocol
mechanism whereby developedcountries finance low-emissioninfrastructure projects in somedeveloping countries. Both the Delhimetro and the Bogotá, ColombiaBRT system received funding viathe CDM.109 In addition, leveragegrants for pilot initiatives. Norway’s Transnova programme, for example,provides grants for environmentallyfriendly transport technology, betterutilization of capacity, and demand-side solutions.
Unfortunately, environmental and socialgoals are not always compatible witheach other, let alone with financialconstraints, and difficult trade-offs willsometimes be needed. Operators willhave to find the sweet-spot betweenfinancial, environmental and socialperformance, and select from a rangeof competing strategic priorities.
Embed sustainability/HSE into
routine operations
For a sustainability strategy to last, itneeds to become a fully incorporatedelement of the operator’s daily
processes and organization. Whilesustainability has been on theradar of many public and private
organizations, only a few have reallymade it a strategic issue embeddedin the operating model beyondpublic relations or corporate socialresponsibility activities.
– Start by defining a bold and clearsustainability vision. Increasingly,operators are looking beyond merecompliance with environmentalregulations, and are seeking alasting competitive advantage andreputation by achieving a neutral or
even positive environmental status.For example, the ACP, by reforesting20,000 hectares near the canal,aims to offset its greenhouse gasemissions to the point of becomingcarbon-neutral in 2014.110
– Ensure dedicated leadership ofany sustainability initiative, andincorporate sustainability activitiesinto the senior managementagenda. For example, HongKong’s Mass Transit Railway (MTR)
established a board-level corporateresponsibility committee; developeda sustainable competitive advantagemodel to guide its actions; adopteda corporate responsibility policy;

7/25/2019 Strategic Infrastructure Steps Report 2014
http://slidepdf.com/reader/full/strategic-infrastructure-steps-report-2014 44/88
44 Steps to Operate and Maintain Infrastructure Efficiently and Effectively
and, in 2001, was the first Chinesecompany to publish an annualsustainability report.111
– Engage the broader workforce, andbuild a sustainability culture withinthe whole organization. In particular,arrange an internal communicationprogramme and training courses for
all staff members, not just for thoseresponsible for HSE. For example,Manila Water runs extensiveemployee training, convenesmonthly meetings to discussenvironmental issues and raiseawareness, monitors energy useand greenhouse gas emissions, andconducts energy audits.112
– Adjust governance structure. Ideally,create a sustainability departmentwith appropriate authority and
accountability; however, also assignresponsibilities for sustainability tothe key units of the organization, not just to the central team.
– Amend business processes.For example, to reduce work-related injuries, the MTA Metro-North Railroad made safetya line management priority,improved safety processes afteranalysing hazards and increasedcommunication and audits on
safety. As a result, lost-timeinjuries decreased by 60% andlost work days by 81% between2002 and 2006.113 By takingsimilar measures, the Los AngelesCounty Metropolitan Transportation Authority (US), which received 2,700injury claims in 2001 at an estimatedcost of US$ 68 million, managed toreduce the number of claims andlost work days by about 50%.114
Cooperate with relevant
stakeholders
Successful operators in thesustainability field take amultistakeholder approach. They havean active programme of communicatingwith stakeholders, as well ascollaborating with fellow operators andother stakeholders for higher impactacross the infrastructure system.
Communicate promptly and proactivelywith stakeholders.
– Develop an information campaignto raise the awareness and interestof employees, suppliers, customersand other stakeholders. The
ACP proactively engages with itssurrounding communities throughan outreach programme; its watergovernance approach is based onsix regional advisory councils and 30local committees.
– Ensure transparency. ManilaWater, for example, became the
first Philippine company to publisha climate change policy and asustainability report. It also offerstours of its water and wastewatertreatment plants to public- andprivate-sector visitors andschools.115
– Make sure the information providedto stakeholders is understandableand concise, and not in the form ofa full technical analysis/report.
– Ensure that communication is two-
way. Solicit reports on sustainabilityattainments or shortfalls, and invitesuggestions on remedies.
Collaborate on systemwide sustainability measures.
Adverse social and environmentaleffects are often due more to the usersthan to the infrastructure operators. Nosingle operator can remedy the problemon its own; sustainability efforts have
to be made across the system andvalue chain, and should be addressedin collaboration with customers,adjacent operators, suppliers and otherstakeholders.
– Evaluate measures from a systemperspective. For example, innovativeroad surfacing not only benefitsthe operator financially by savingon maintenance, but also benefitsdrivers and the public at large byreducing car fuel consumption. Therefurbishing of Missouri’s Interstate
70 (US) with smoother surfacingimproved fuel efficiency by 2.5%,reduced emissions and enabledannual savings of US$ 8 million forthe 9,000 large trucks that use theroad every day.116
– Incentivize users to improve theirenvironmental performance. Forexample, Zurich airport was the firstin the world to charge differentiatedlanding fees according to theaircraft’s emissions, a policy that
has contributed to the markedincrease in efficient, emission-class4 and 5 aircraft at the airport – fromabout 55% of movements to above85%.117
– Support customers to operatesustainably by providing themwith the necessary facilities. Forexample, the Port of Los Angelesruns an air quality programme toreduce emissions from ships: asa result of its “Alternative MaritimePower”, vessels at berth can nowrun on mains electricity rather than
on heavy-diesel-fuel combustionengines.118
– Require and help suppliersand contractors to adhere toenvironmental standards; implementa system of compliance checksor certification. Manila Water,for example, conducts trainingcourses and audits for suppliers tohelp improve their environmentalperformance.
– Coordinate with other agencies. The South African National Roads Agency runs a comprehensiveroad safety programme that notonly focuses on costly engineeringmeasures but also cooperates cost-effectively with other authoritieson user education (e.g. roadsafety lessons at schools) and onenforcement (e.g. overload control).
– Cooperate across the valuechain. Improvements to air trafficmanagement, for instance,
require the cooperation of aircraftmanufacturers, airports, airlines,regulators and air traffic controllers.Backed by such cooperation, a fullimplementation of next-generationair traffic management could leadto a 4% reduction in aviation CO
2
emissions by 2020.119
– Cooperate across sectors. Forexample, mining infrastructurecould generate more social value ifthe various stakeholders, including
mining firms, transport operatorsand government agencies, wereto work together to create amultipurpose transport systemwhere mine cargo and passengertraffic can interoperate.
1.5 Extend assetlife
Using existing infrastructure assets aslong as possible provides clear benefits. As most of the cost of providing theinfrastructure consists of fixed pastinvestments, and given relatively lowcurrent operating costs, each additional

7/25/2019 Strategic Infrastructure Steps Report 2014
http://slidepdf.com/reader/full/strategic-infrastructure-steps-report-2014 45/88
45Steps to Operate and Maintain Infrastructure Efficiently and Effectively
year of service will produce high valueas the asset is amortized. The problemsalso are clear: the condition of theinfrastructure keeps deteriorating asa result of ageing, usage and various
external factors. Eventually, the assetmay lose its ability to function cost-effectively or even to function at all.
To extend the asset’s life, operatorsshould pursue three broad strategies(Figure 21):
– Invest in preventive and predictivemaintenance, thereby keeping theasset in operational shape andpreventing breakdowns.
– Avoid and control excessive assetconsumption and stress, andthereby slow down the deteriorationprocess.
– Enhance the asset’s resilienceagainst disaster; in that way,extreme events should not producea devastating effect.
Unfortunately, these approaches tendto get neglected. For politically-mindeddecision-makers, little incentive existsto invest in preventive maintenance
and resilience; the immediate benefitsare hardly visible, and the long-termpositive impact is difficult to measureand verify. In fact, in the UK, an 11-year
backlog in highway maintenance hasaccumulated.120
The impact of such neglect can besevere, both for users and the cost
of later repair. The Rhine bridge inLeverkusen, Germany, for example,had to be closed to trucks for fourmonths in 2012-2013 while overduerepairs were made. And in Norway, anundermaintained bridge, at first denieda waterproof membrane costing aboutUS$ 600,000, had to be replacedentirely at a cost of US$ 15 million(excluding the cost of detours forusers).121
Invest in preventive and predictive
maintenance
Preventive maintenance is applied toinfrastructure assets suffering light tomoderate distress. It involves plannedtreatments that are carefully timed andcost-effective. Its aim is to forestallcostly corrective action and to improvethe condition of a system before afailure occurs.
The case for preventive maintenance is
a strong one:– Preventive maintenance slows
deterioration and increases thelifespan of an asset; for example, itcan add 5-10 years to the servicelife of a road surface.122
Figure 21: Overview of Lifetime Extension Strategies
– Preventive maintenance reduceslife cycle costs. If maintenance isneglected, more drastic repairsmight be required in the future,often with dramatically higher costs.
Therefore, preventive maintenancecan postpone or replace costlierrehabilitation. An analysis of UShighways revealed that deferredmaintenance led to 29% highercosts overall: the total life cycle costof a well-maintained road is US$2.82 million per lane mile, vs US$3.64 million per lane mile for anundermaintained road.123
– Preventive maintenance enhancesperformance; it improves the quality,
functioning and availability of asystem for users. By preventingbreakdowns, it saves the costs andinconvenience that users suffer as aresult of blackouts or detours.
A preventive maintenance strategyis clearly indicated, but it is not soeasy to formulate, implement andadhere to. A structured approach isneeded – evaluating the likelihood andimpact of asset failures, customizing amaintenance strategy, assessing theasset’s current condition and creating aformal intervention plan.
7/25/2019 Strategic Infrastructure Steps Report 2014
http://slidepdf.com/reader/full/strategic-infrastructure-steps-report-2014 46/88
46 Steps to Operate and Maintain Infrastructure Efficiently and Effectively
Monitor assets to determine their
vulnerability and criticality.
Only with a fact base of asset failuresand their impact can operatorsdefine evidence-based maintenanceapproaches and justify theirinvestments in preventive maintenance. The various steps required are asfollows:
– Record all past failures and thecorresponding maintenance workfor all structures, equipment andcomponents. On a malfunction-cause-and-treatment sheet, notethe downtime and the type ofmaintenance work undertaken.Record the types of failures,including the manner of failure, thecircumstances and the failure-eventsequence. Establish and analysethe root cause of the failure, andidentify the components whosedeterioration led to the failure.
– Calculate the frequency andimpact of the failures to assess thevulnerability and criticality of theasset:
– Assess the failure rate (takinginto account the condition ofthe asset). If empirical data islimited, establish a risk measure
through expert judgements andlaboratory tests.
– To establish the criticality ofeach asset, estimate the impactof such failures in terms of lostrevenues, increased costs anddissatisfied users. In addition,assess the level of serviceexpectations and requirementsof the users and regulators.
– Prioritize the assets in a riskclassification matrix along two
dimensions: failure frequency andfailure impact (or vulnerability andcriticality).
Customize the maintenance strategy foreach asset.
On the basis of the asset’s vulnerabilityand criticality, choose an appropriatemaintenance strategy. There arefour broad types to consider – one isessentially reactive, the other three are
preventive (Figure 22):– Corrective/reactive or failure-based
maintenance is a strategy thatactivates repair work in the eventof a breakdown, and is designed
to bring a failed system back toits operational condition. It shouldbe the strategy of choice only ifthe risk of failure is very low andif the consequences of failure arefairly mild; or, where preventivemaintenance measures are notavailable.
– Scheduled maintenance isperformed at defined intervals, eitherafter a certain period of use (time-based) or after a certain amountof usage (use-based). This is thestrategy of choice when failuresare costly or safety is critical, andwhen the failure rate is fairly low buttends to increase over time. Thespecific time intervals for inspectionsand maintenance can be basedeither on the manufacturers’recommendations or on the
operator’s experience.
– Condition-based or predictive maintenance is a strategy thattriggers maintenance activity whenthe asset’s condition (as measuredby machine diagnostic techniquesor by continuous or occasionalmonitoring) falls below a certainthreshold. The aim is to time themaintenance work optimally, sothat it is not performed more often– and hence more expensively –
than necessary, and so that it canbe undertaken at a convenienttime, when the service will be leastdisrupted.
– Risk-based or reliability-centred maintenance considers not onlythe asset’s current condition, butalso the likely consequences offailure, including the impact onnetwork performance. The mainaim of this strategy is to reducethe overall risk and impact of
unexpected failures, i.e. to ensurehigh reliability. The strategy involvesinspecting and monitoring the high-risk components of a system veryfrequently and thoroughly, whilepaying less attention to evaluatingthe low-risk components.
Two examples highlight the benefitsof preventive maintenance. In theUK, Skanska applied an asphaltpreservation surface coating on the
M25 motorway that reduced wateringress and extended the life of theroad surface by one-third, therebyreducing costs by one-fifth. And inthe US, the Georgia Department
of Transportation developed a newmaintenance strategy for each airportin the state, prioritizing preventivemeasures such as crack sealing,surface treatments and thin overlays. The policy effectively delayed the needfor rehabilitation work, and therebyreduced the funding required forrunway resurfacing each year from 75%of the state programme budget to just37%, and improved the condition of theassets.124
The trend is increasingly away fromfixed-interval scheduled maintenanceand towards predictive, data-enabledmaintenance; the effect is to reducewaste, as equipment and parts arenow exchanged only when they clearlyneed to be. The Massachusetts WaterResources Authority (US), for example,
developed a predictive maintenancestrategy based on condition monitoringand the probability and consequencesof failure of each component. Theprogramme increased equipmentavailability to 99%, and achieved costsavings by eliminating unneeded andlow-value preventive maintenancework and shifting the freed-upresources to predictive tasks and actualmaintenance work.125 To enable suchpredictive maintenance strategies,repeated assessments of the asset
condition are paramount.
Assess the asset’s current condition.
For predictive maintenance, the choiceand timing of treatments need to bebased on the asset’s starting or currentcondition; establishing its condition asaccurately as possible is thus crucialand can be done in the following ways:
– Introduce a system of continuousassessment. New technologies
can improve equipment checks; forexample, laser technology can beused to detect road damage, andsensors, which are becoming muchcheaper, can embed intelligenceinto previously “dumb” objects.Fluxys, a natural-gas infrastructurecompany, installed 39 sensors tomonitor any possible damage to twopipelines crossing the Dutch-Frenchborder.126 Another new approachis urban crowdsourcing, used forcollecting asset-condition data atmuch lower costs and with fasterresponse times than the traditionalinspector approach. In the US,Boston’s pothole-finding app, StreetBump, records every judder and jolt

7/25/2019 Strategic Infrastructure Steps Report 2014
http://slidepdf.com/reader/full/strategic-infrastructure-steps-report-2014 47/88
47Steps to Operate and Maintain Infrastructure Efficiently and Effectively
when a mobile phone with a built-inaccelerometer is running the app.If a bump triggers three separatereports within four days, it isdeclared an issue and the problem
will be fixed once located via theGlobal Positioning System (GPS)coordinates.127
– Model the asset’s degradationprocess. For example, manyUK water utilities use advanceddecision support systems for assetdeterioration curve modelling, basedon statistical methods such asregression and Markov models.
– Develop a standardized metric foreach asset’s condition, including
a warning level that is typically setclose to the fatal limit minus a buffer,which correlates with the processingtime needed for implementingrepairs. Network Rail in the UK usesa health index for its asset conditionassessments.
The Seto-Ohasi bridge in Japan,which has an intended lifespan of200 years, is a case in point. Theinspection routine includes daily visualchecks, biannual structural checksand extraordinary inspections afternatural disasters. The data is fed intothe “Inspection Management System”and the “Repair History System”.One output is a deterioration curve
for the top coat of paint: it enablesthe maintenance team to make earlyplans for repainting (a task which takesyears), thereby helping to forestall anydamage to the expensive and less
accessible undercoat.128
Draw up a tailored maintenance intervention plan for each asset.
Operators need to establish both long-term and short-term plans, indicatingthe required maintenance interventionsat varying levels of detail. To do so, theyneed to consider and evaluate differenttreatments; for roads, this could includeimproved drainage, sealing of jointsand cracks, and resurfacing to protect
against progressive erosion, based on awhole life-cycle evaluation. Aspects thatoperators need to consider in craftingthose plans include the following:
– Select a specific strategy for eachpiece of equipment (sometimeseven for each component), as eachof them has its own distinctivefailure rate, maintenance cost,serviceability and criticality.Infrastructure assets typically consistof different structures and pieces
of equipment, so a one-size-fits-allapproach is hardly appropriate.
– Contextualize the chosen treatmentto the specific circumstances. Forroads, the choice and timing of
preventive maintenance treatmentsdepend on such factors as climate,type of traffic and volume of traffic.In addition, consider the asset’shistorical design and construction
features, as well as the previousmaintenance routines. Ideally, alldata is recorded in an integratedasset management system (chapter2.2).
– Determine an optimal monitoringand maintenance cycle. All toooften, preventive maintenancecycles/intervals are based onconservative risk and warrantypractices. Conduct a thoroughreview of risk and warranty, basedon the asset’s vulnerability, criticalityand components. Academicresearch can provide muchguidance in this regard.
– Adopt a system perspective, not just an asset perspective. Takeinto account the components’interdependencies within thecomplex system, and design anappropriate group maintenancestrategy that maximizes overallreliability and availability, and takesadvantage of cost synergies.
– Even the most conscientiouspreventive maintenance is noguarantee against failure, so allmaintenance policies should include
Figure 22: Overview of Maintenance Strategies

7/25/2019 Strategic Infrastructure Steps Report 2014
http://slidepdf.com/reader/full/strategic-infrastructure-steps-report-2014 48/88
48 Steps to Operate and Maintain Infrastructure Efficiently and Effectively
procedures for ad-hoc corrective/ reactive maintenance.
– While prioritizing preventivemaintenance, take care not toovermaintain. The best strategyis not the one that maximizes theasset’s lifespan, but the one thatenables an optimally economical life
and optimal availability. Preventivemaintenance can be uneconomicalif conducted to excess. The optimallevel will balance the preventive
maintenance costs against the costsof breakdown and repair (Figure 23).
Control excessive asset
consumption and stress
Infrastructure assets suffer whensubjected to inappropriate usagevolumes and/or excessive loads. Theresulting wear and tear from suchuncontrolled practices can drasticallydegrade the asset’s condition andshorten its lifespan.
Typically, an infrastructure asset isdesigned to accommodate a level ofservice within a defined range. Forexample, a road is constructed to agiven degree of robustness, basedon the anticipated number of vehiclesand weight of the loads per vehicle.Usage requirements change, of course,so the original design parameters aresometimes exceeded. In the US, themajority of local roads were designedfor far lower volumes of traffic than theynow accommodate; since 1990, heavy-
Figure 23: Optimization of Maintenance Spending
truck traffic has increased at a rate 50%greater than that of car traffic.
To protect their infrastructure againstuncontrolled or excessive assetconsumption and stress, operatorsshould consider the followingmeasures:
Study and assess the empirical relationship between asset use and
degradation.
Consider, for example, the currentproposal in Germany to introduce
megatrucks (“gigaliners”) of up to60 tons. Prior to authorization, theproposal is being studied in trials onspecified roads in several federal states;this is to assess the impact that the
vehicles will make on the service lifeand safety of roads and bridges.
Enact rules and regulations, and
develop operations manuals and restrictions that conform with the
evidence.
Local traffic laws, for instance, couldbe enacted to control the issuingof overweight vehicle permits, todesignate truck routes or to restrictvehicle weight, length and height.Besides enacting those rules, however,it is essential to collaborate with
authorities to ensure enforcement. Forexample, the concessionaire for theN4 route in Mozambique and South Africa assisted both governments inestablishing axle-load controls, which
reduced the proportion of overloadedvehicles from 23% in 2001 to 9% in
2004.
129
Leverage technology for usage monitoring.
NedTrain, Dutch Railway’s maintenancecompany, uses a wayside monitoringsystem that can measure axle load anddetect wheel defects while trains are inmotion, and report them promptly. Thedefective wheels can then be repaireddirectly before causing any furtherdamage to tracks. One particularly
important feature is that of linkingthe wheel quality measurements toinformation from the maintenancedatabase. In this way, NedTrainoptimized the wheel profile and

7/25/2019 Strategic Infrastructure Steps Report 2014
http://slidepdf.com/reader/full/strategic-infrastructure-steps-report-2014 49/88
49Steps to Operate and Maintain Infrastructure Efficiently and Effectively
introduced an alternative maintenanceregime, leading to a 30% increase inwheel life and life cycle cost savings ofup to 50%.130
Embed incentives in user agreements
or user charges.
Adopt segmented and incremental usercharges, according to the amount ofasset consumption and stress causedto the system. So that road pricingvaries in line with the costs incurred byeach vehicle, truck owners – dependingon the truck’s mass and the distance– would pay much higher road tollsor licence fees than car owners, as asingle, fully-loaded 80,000-pound (36-ton) truck degrades the road surface asseverely as 750 cars do.131
Enhance disaster resilience
Infrastructure assets repeatedly facenatural hazards, and can suffer majordevastation – as shown by the brokentelephone and electricity lines afterHurricane Sandy (Caribbean, US),the interrupted water supply after theearthquake in Chile, and the breachedlevees after Hurricane Katrina inLouisiana (US). The economic lossescaused by such disasters over thepast 30 years are estimated at US$
3.5 trillion worldwide. Major disasterscan cost about 5% of GDP, such asthe 2011 tsunami in Japan, and morethan 100% of GDP in low-incomeand small-island states.132 While thesecatastrophes dominate the media,equal or even greater losses can be
caused by less dramatic but recurrentmisfortunes.
Although disasters are infrequent,infrastructure assets, with lifetimesof several decades, remain at risk.Moreover, natural hazards arebecoming more common and moredestructive; evidence suggests thattheir frequency and severity, andhence their damaging impact, areincreasing.133 In the future, climatechange could intensify storms,droughts, flooding, landslides,extreme temperatures and forest fires,particularly in coastal and arid areas,with dire effects on any infrastructureassets that were not built to withstandsuch forces. The Organisationfor Economic Co-operation andDevelopment (OECD) predicts a rise
in sea level of half a metre by 2070;that would put 150 million people andUS$ 35 trillion of assets at risk fromcoastal flooding.134 In addition to thesehydrometeorological or geophysicalthreats, infrastructure assets are alsoincreasingly under threat from terroristattacks and even cyberattacks.
Greater disaster resilience is crucial.Fortunately it is attainable, and isgenerally far less costly than fixing thedamage. For instance, the flooding
of New Orleans during HurricaneKatrina in 2005 caused US$ 81 billionin damage,135 whereas the hurricaneprotection system that was builtafterwards cost only US$ 14 billion.136
Resilience measures tend to beneglected, however. The perception
is that resilience-building generateslow net returns on investment, in viewof the long-term nature of resilienceinvestments and the low likelihood ofoccurrence.
A new approach and a new mindsetwill be required to remedy thoseshortcomings. Governments need tomainstream disaster risk managementinto all stages of the infrastructure lifecycle – from planning and constructionto O&M – particularly for criticalinfrastructure assets. To strengthenthe infrastructure system’s ability toresist, cope with and recover fromextreme events, a comprehensive setof resilience strategies is required (asfollows, and Figure 24).
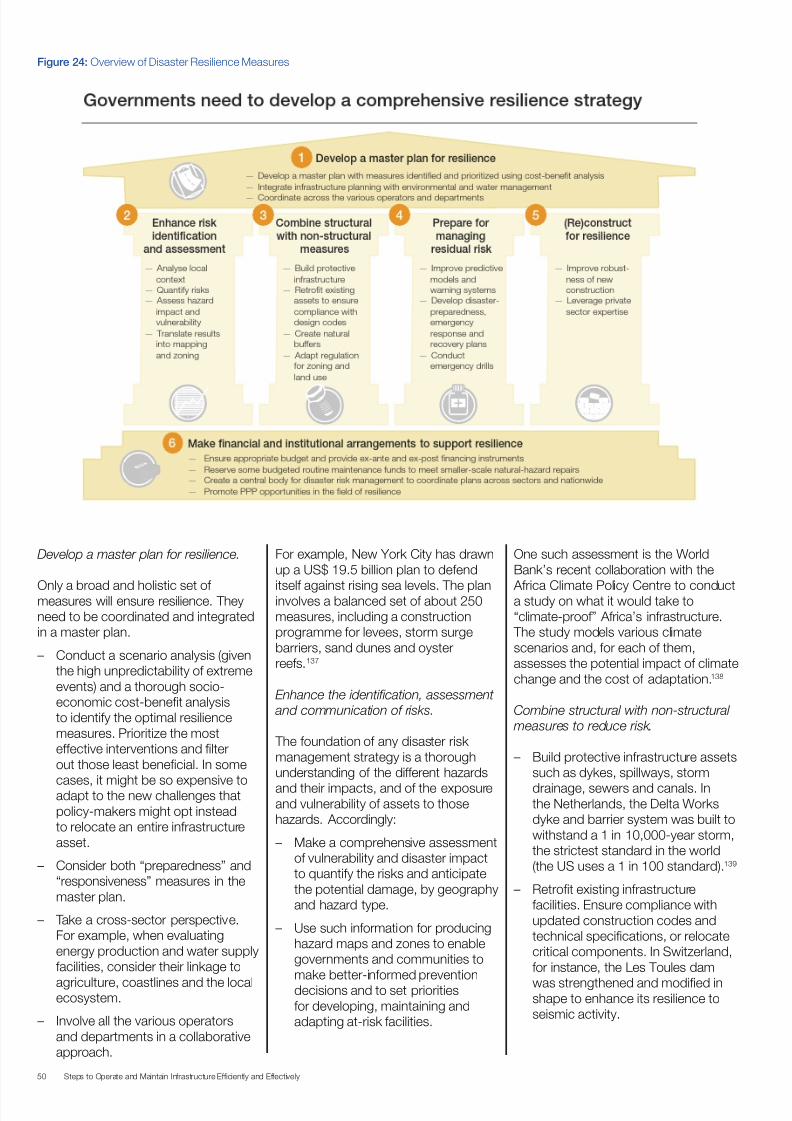
7/25/2019 Strategic Infrastructure Steps Report 2014
http://slidepdf.com/reader/full/strategic-infrastructure-steps-report-2014 50/88
50 Steps to Operate and Maintain Infrastructure Efficiently and Effectively
Figure 24: Overview of Disaster Resilience Measures
Develop a master plan for resilience.
Only a broad and holistic set ofmeasures will ensure resilience. Theyneed to be coordinated and integratedin a master plan.
– Conduct a scenario analysis (giventhe high unpredictability of extremeevents) and a thorough socio-economic cost-benefit analysisto identify the optimal resiliencemeasures. Prioritize the mosteffective interventions and filterout those least beneficial. In some
cases, it might be so expensive toadapt to the new challenges thatpolicy-makers might opt insteadto relocate an entire infrastructureasset.
– Consider both “preparedness” and“responsiveness” measures in themaster plan.
– Take a cross-sector perspective.For example, when evaluatingenergy production and water supplyfacilities, consider their linkage to
agriculture, coastlines and the localecosystem.
– Involve all the various operatorsand departments in a collaborativeapproach.
For example, New York City has drawnup a US$ 19.5 billion plan to defend
itself against rising sea levels. The planinvolves a balanced set of about 250measures, including a constructionprogramme for levees, storm surgebarriers, sand dunes and oysterreefs.137
Enhance the identification, assessment and communication of risks.
The foundation of any disaster riskmanagement strategy is a thoroughunderstanding of the different hazards
and their impacts, and of the exposureand vulnerability of assets to thosehazards. Accordingly:
– Make a comprehensive assessmentof vulnerability and disaster impactto quantify the risks and anticipatethe potential damage, by geographyand hazard type.
– Use such information for producinghazard maps and zones to enablegovernments and communities tomake better-informed preventiondecisions and to set prioritiesfor developing, maintaining andadapting at-risk facilities.
One such assessment is the WorldBank’s recent collaboration with the
Africa Climate Policy Centre to conducta study on what it would take to“climate-proof” Africa’s infrastructure. The study models various climatescenarios and, for each of them,assesses the potential impact of climatechange and the cost of adaptation.138
Combine structural with non-structural measures to reduce risk.
– Build protective infrastructure assetssuch as dykes, spillways, storm
drainage, sewers and canals. Inthe Netherlands, the Delta Worksdyke and barrier system was built towithstand a 1 in 10,000-year storm,the strictest standard in the world(the US uses a 1 in 100 standard).139
– Retrofit existing infrastructurefacilities. Ensure compliance withupdated construction codes andtechnical specifications, or relocatecritical components. In Switzerland,for instance, the Les Toules dam
was strengthened and modified inshape to enhance its resilience toseismic activity.
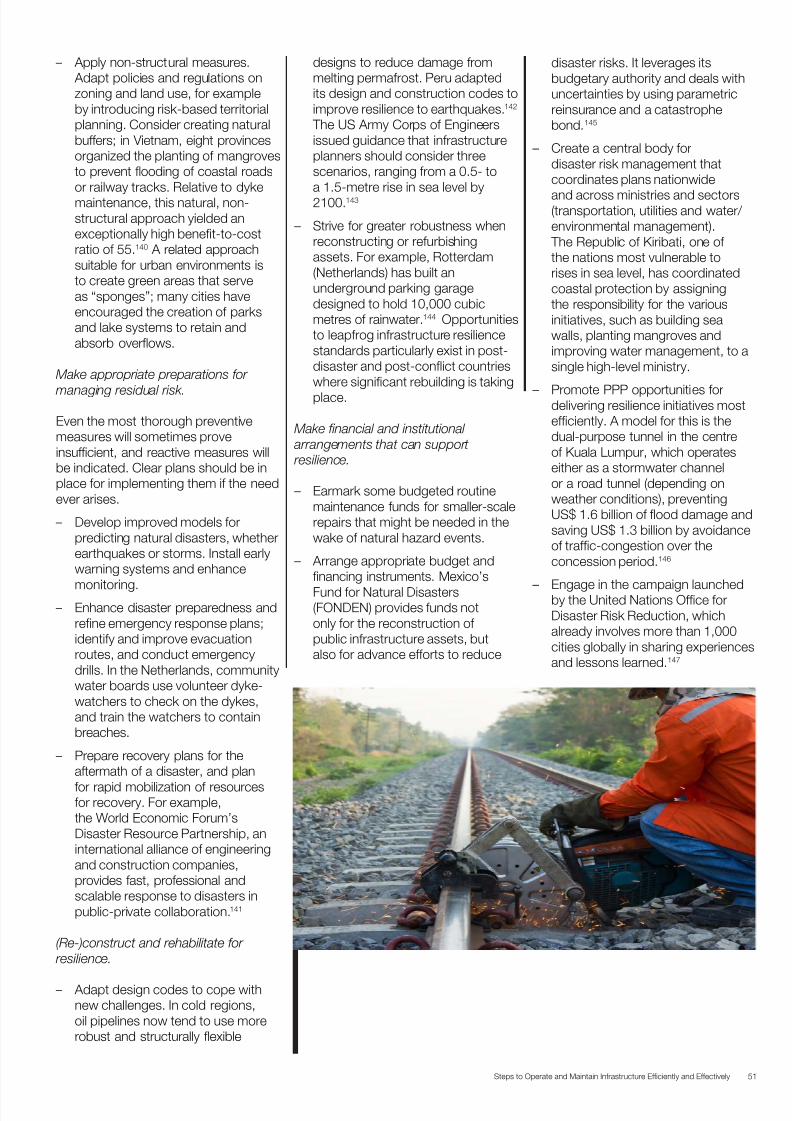
7/25/2019 Strategic Infrastructure Steps Report 2014
http://slidepdf.com/reader/full/strategic-infrastructure-steps-report-2014 51/88
51Steps to Operate and Maintain Infrastructure Efficiently and Effectively
– Apply non-structural measures. Adapt policies and regulations onzoning and land use, for exampleby introducing risk-based territorialplanning. Consider creating naturalbuffers; in Vietnam, eight provincesorganized the planting of mangrovesto prevent flooding of coastal roadsor railway tracks. Relative to dykemaintenance, this natural, non-structural approach yielded anexceptionally high benefit-to-costratio of 55.140 A related approachsuitable for urban environments isto create green areas that serveas “sponges”; many cities haveencouraged the creation of parksand lake systems to retain andabsorb overflows.
Make appropriate preparations for
managing residual risk.
Even the most thorough preventivemeasures will sometimes proveinsufficient, and reactive measures willbe indicated. Clear plans should be inplace for implementing them if the needever arises.
– Develop improved models forpredicting natural disasters, whetherearthquakes or storms. Install earlywarning systems and enhance
monitoring.– Enhance disaster preparedness and
refine emergency response plans;identify and improve evacuationroutes, and conduct emergencydrills. In the Netherlands, communitywater boards use volunteer dyke-watchers to check on the dykes,and train the watchers to containbreaches.
– Prepare recovery plans for theaftermath of a disaster, and plan
for rapid mobilization of resourcesfor recovery. For example,the World Economic Forum’sDisaster Resource Partnership, aninternational alliance of engineeringand construction companies,provides fast, professional andscalable response to disasters inpublic-private collaboration.141
(Re-)construct and rehabilitate for
resilience.
– Adapt design codes to cope withnew challenges. In cold regions,oil pipelines now tend to use morerobust and structurally flexible
designs to reduce damage frommelting permafrost. Peru adaptedits design and construction codes toimprove resilience to earthquakes.142 The US Army Corps of Engineersissued guidance that infrastructureplanners should consider threescenarios, ranging from a 0.5- toa 1.5-metre rise in sea level by2100.143
– Strive for greater robustness whenreconstructing or refurbishingassets. For example, Rotterdam(Netherlands) has built anunderground parking garagedesigned to hold 10,000 cubicmetres of rainwater.144 Opportunitiesto leapfrog infrastructure resiliencestandards particularly exist in post-disaster and post-conflict countrieswhere significant rebuilding is taking
place.
Make financial and institutional
arrangements that can support resilience.
– Earmark some budgeted routinemaintenance funds for smaller-scalerepairs that might be needed in thewake of natural hazard events.
– Arrange appropriate budget andfinancing instruments. Mexico’s
Fund for Natural Disasters(FONDEN) provides funds notonly for the reconstruction ofpublic infrastructure assets, butalso for advance efforts to reduce
disaster risks. It leverages itsbudgetary authority and deals withuncertainties by using parametricreinsurance and a catastrophebond.145
– Create a central body fordisaster risk management thatcoordinates plans nationwide
and across ministries and sectors(transportation, utilities and water/ environmental management). The Republic of Kiribati, one ofthe nations most vulnerable torises in sea level, has coordinatedcoastal protection by assigningthe responsibility for the variousinitiatives, such as building seawalls, planting mangroves andimproving water management, to asingle high-level ministry.
– Promote PPP opportunities fordelivering resilience initiatives mostefficiently. A model for this is thedual-purpose tunnel in the centreof Kuala Lumpur, which operateseither as a stormwater channelor a road tunnel (depending onweather conditions), preventingUS$ 1.6 billion of flood damage andsaving US$ 1.3 billion by avoidanceof traffic-congestion over theconcession period.146
– Engage in the campaign launchedby the United Nations Office forDisaster Risk Reduction, whichalready involves more than 1,000cities globally in sharing experiencesand lessons learned.147
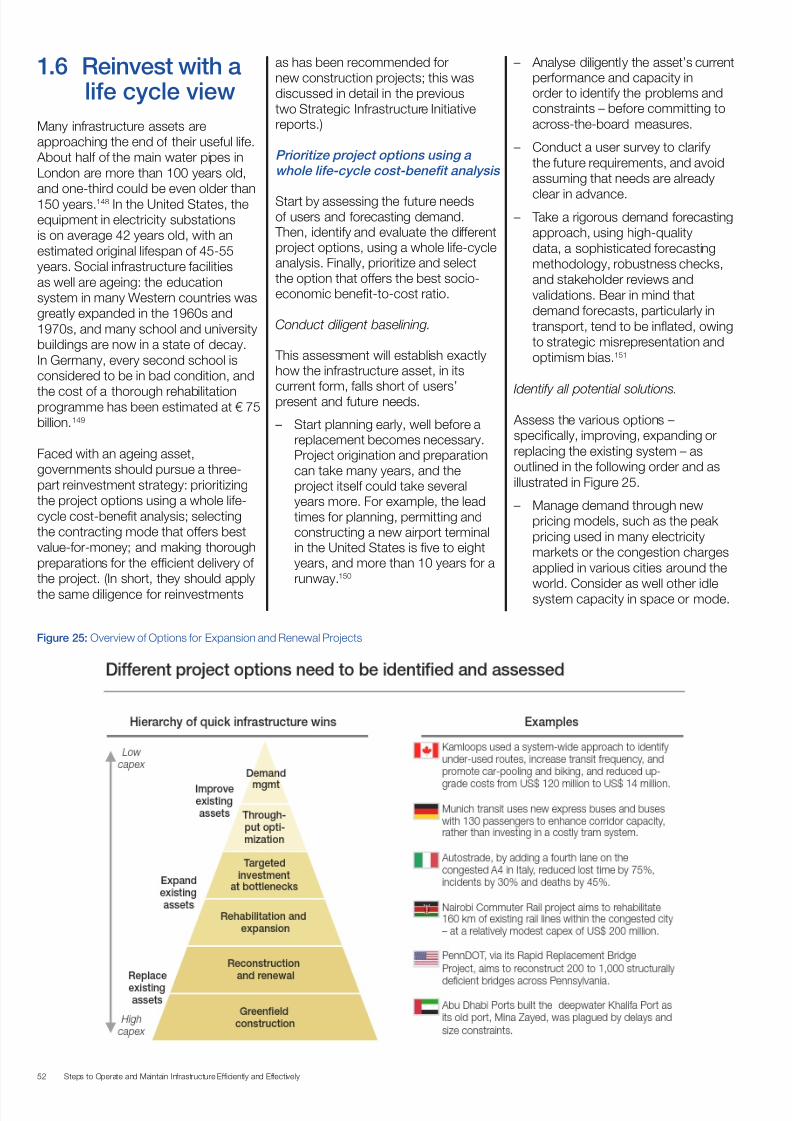
7/25/2019 Strategic Infrastructure Steps Report 2014
http://slidepdf.com/reader/full/strategic-infrastructure-steps-report-2014 52/88
52 Steps to Operate and Maintain Infrastructure Efficiently and Effectively
1.6 Reinvest with alife cycle view
Many infrastructure assets areapproaching the end of their useful life. About half of the main water pipes inLondon are more than 100 years old,and one-third could be even older than150 years.148 In the United States, theequipment in electricity substationsis on average 42 years old, with anestimated original lifespan of 45-55years. Social infrastructure facilitiesas well are ageing: the educationsystem in many Western countries wasgreatly expanded in the 1960s and1970s, and many school and universitybuildings are now in a state of decay.In Germany, every second school isconsidered to be in bad condition, and
the cost of a thorough rehabilitationprogramme has been estimated at € 75billion.149
Faced with an ageing asset,governments should pursue a three-part reinvestment strategy: prioritizingthe project options using a whole life-cycle cost-benefit analysis; selectingthe contracting mode that offers bestvalue-for-money; and making thoroughpreparations for the efficient delivery ofthe project. (In short, they should apply
the same diligence for reinvestments
as has been recommended fornew construction projects; this wasdiscussed in detail in the previoustwo Strategic Infrastructure Initiativereports.)
Prioritize project options using a
whole life-cycle cost-benefit analysis
Start by assessing the future needsof users and forecasting demand. Then, identify and evaluate the differentproject options, using a whole life-cycleanalysis. Finally, prioritize and selectthe option that offers the best socio-economic benefit-to-cost ratio.
Conduct diligent baselining.
This assessment will establish exactlyhow the infrastructure asset, in its
current form, falls short of users’present and future needs.
– Start planning early, well before areplacement becomes necessary.Project origination and preparationcan take many years, and theproject itself could take severalyears more. For example, the leadtimes for planning, permitting andconstructing a new airport terminalin the United States is five to eightyears, and more than 10 years for arunway.150
– Analyse diligently the asset’s currentperformance and capacity inorder to identify the problems andconstraints – before committing toacross-the-board measures.
– Conduct a user survey to clarifythe future requirements, and avoidassuming that needs are already
clear in advance.– Take a rigorous demand forecasting
approach, using high-qualitydata, a sophisticated forecastingmethodology, robustness checks,and stakeholder reviews andvalidations. Bear in mind thatdemand forecasts, particularly intransport, tend to be inflated, owingto strategic misrepresentation andoptimism bias.151
Identify all potential solutions.
Assess the various options –specifically, improving, expanding orreplacing the existing system – asoutlined in the following order and asillustrated in Figure 25.
– Manage demand through newpricing models, such as the peakpricing used in many electricitymarkets or the congestion chargesapplied in various cities around the
world. Consider as well other idlesystem capacity in space or mode.
Figure 25: Overview of Options for Expansion and Renewal Projects

7/25/2019 Strategic Infrastructure Steps Report 2014
http://slidepdf.com/reader/full/strategic-infrastructure-steps-report-2014 53/88
53Steps to Operate and Maintain Infrastructure Efficiently and Effectively
– Increase throughput by meansof new technologies, such asautomated highway tolling ornext-generation air traffic controlsystems. Alternatively, reduce lossesin the case of utilities; for example,water systems can be optimizedeconomically by reducing leakageand theft rather than by buildingnew supply lines or treatmentplants.
– Make a targeted investment todebottleneck the system. Thisapplies to port terminals, forexample, that require systemwidecoordination, from sea-side (berthallocation for vessels) to yard-side(yard space allocation) and land-side(truck gate management).
– If new construction is needed, opt
for expanding a current facility ifpossible (e.g. a new runway at anexisting airport), rather than creatinga new facility on a greenfield site. The former option will enableeconomies of scale in operationsand better connectivity, whereasthe latter option could result infragmentation.
– Undertake greenfield developmentas a last resort. Before taking thedecision, ensure that the followingcriteria are met: current systemcapacity is fully and efficiently used;rehabilitation of the current facilitywould be too costly because ofserious structural deficiencies;an expansion of the currentfacility, owing to design or spaceconstraints, is unable to meet theexpected demand or changingrequirements of users; and cheaperalternative modes or system designsare unfeasible.
Conduct a whole life-cycle cost-benefit analysis for each alternative.
Once the different project alternativeshave been identified, evaluate each
by conducting a whole life-cyclecost-benefit analysis, which shouldconsider: all associated costs fromcradle to grave, as well as the variousbenefits including direct user benefits;the environmental impacts (air, waterand noise pollution, climate change,resource depletion, land and forestdegradation); social effects (e.g. oneducation, health, safety, culturaldiversity); and economic effects (e.g.
on GDP, employment, property values,taxes).
In many cases, the life cycle analysiswill reveal that the long-term costs ofO&M are actually much greater thanthe initial costs of construction. The lifecycle cost analysis thus needs to beperformed early on, as the majority oflife cycle costs can still be influenced atthat time through shrewd design andengineering decisions. Later on, thatinfluence diminishes, and the cost ofchanges increases (Figure 26). In thelife cycle analysis, the trade-off betweenopex and capex should be explicitlymodelled, and any smart solutions thatmight reduce whole life-cycle costsshould be considered.
Previous designs and construction
techniques were not always conduciveto O&M. Thus, for rehabilitation andreconstruction projects (as for newconstruction projects), adopt a life cycleorientation when making decisions ondesign and procurement – “purchasingnot the cheapest but the best in thelong run”. In addition, leverage theresults of the life cycle analysis to planand secure the budget for later O&Mexpenses.
Figure 26: Benefits of Life Cycle Analysis
Sources: Prieto, B.: Application of Life Cycle Analysis in the Capital Assets Industry. In PM World Today, 2012; Long-Life Concrete Pavements in Europe and Canada, 2007 . US Federal Highway
Administration. The New Paving Realities: The Impact of Asphalt Cost Escalator Clauses on State Finances, 2012. Portland : Portland Cement Association.
7/25/2019 Strategic Infrastructure Steps Report 2014
http://slidepdf.com/reader/full/strategic-infrastructure-steps-report-2014 54/88
54 Steps to Operate and Maintain Infrastructure Efficiently and Effectively
Prioritize and rank the projects withinthe portfolio, and develop the project pipeline.
– Rank projects according to theirsocio-economic benefit-to-cost ratio,and screen out any that do not addvalue.
– Identify and highlight trade-offs thatare inherently difficult to quantify –for example, environmental impactversus financial costs.
– Embed projects in the context of thebroader strategic infrastructure plan.
– Across projects, assess bothcost-side synergies (enabled bythe synchronizing of procurementand construction schedules) anddemand-side synergies (based oninterdependencies of a network’s
assets).
– Decide on ideal timing, not just forthe start of the project but also forthe build-out – specifically, whetherto follow a steady, incrementaldevelopment or to take a “batch”approach.
Select the contracting mode that
offers best value for money
Consider the full array of procurement
and contracting options.
The options range from traditionalcivil works contracts (e.g. Design-Bid-Build, Design-Build) to PPPs (e.g.Build-Operate-Transfer [BOT], Design-Build-Operate). But there are also lesscommon and more innovative formsof contracting; for example, Sweden isincreasingly moving towards Design-Build contracts with O&M periods.152
PPPs are often particularly well suited
to upgrades, replacements andrehabilitation. By tapping private-sectorknow-how in designing, constructing,operating and maintaining infrastructure,the asset can maximize quality andminimize total life cycle costs. Thefollowing are two examples:
– The BOT concession for expandingthe terminal at the Colombo, SriLanka port enabled investment in anew quay and berths; an increasedalongside-depth; a modern
container-handling system; and a“hot seat handover” system thatallows three shifts per day. Thesemeasures reduced congestion andvessel waiting times, improved
productivity by 33% and yieldedan overall 40% reduction intransportation costs for imports andexports.153
– In Romania, the upgrade ofBucharest municipality’s water andsanitation system was assigned to aconcessionaire, which invested US$
210 million in modernizing servicesand built a new water treatmentplant. Water losses declined by 44%after leaks were fixed and a newmetering system was introduced,and customer satisfaction hasincreased dramatically.154 Thecase study on the hospital PPPin Tlalnepantla, Mexico providesanother example (Box 6).
Conduct a rigorous value-for-money analysis.
PPPs will not always provide best valuefor money (VfM). To choose the mostpromising delivery and financing mode,governments should create a public-sector comparator (PSC) that estimatesthe whole life cost of carrying out theproject under the traditional standardgovernment delivery model. Then, theyshould estimate the whole life costsof the alternative PPP approach, andcompare them against the PSC. A PPPis considered VfM only if it entails a netpositive economic gain relative to thePSC.
In doing the VfM analysis, the analystsshould take into account the followingadvice:155
– Consider both costs and benefits ofall the rival delivery modes. Include alltypes of costs, not only the evidentcosts for investment, O&M andfinancing, but also those related tothe transaction and oversight of the
contract. Make sure to compare “likewith like” when assessing the non-financial benefits of various modes,such as the potential of a PPPfor accelerated and higher-qualityproject delivery.
– Analyse and evaluate the risks,which will help to correct distortions;risks are typically not budgetedunder public procurement. To placea value on each risk, multiply theprojected cost of resolving the
problem (in the event that the risk isrealized) by its estimated likelihood.
– Make any other adjustments thatmight be necessary for competitive
neutrality; for example, factor inthe different tax treatments that thevarious options would be subject to.
– Adopt clear guidelines to improvequality and consistency. Forinstance, UK policy is to usestandardized Excel tools andguidelines, specify discount-rate
assumptions, and estimate riskvalues on the basis of past projects.
– To check the robustness of the base-case analysis, use sensitivity testingand scenario analysis to challengethe underlying assumptions and theirimpact on the VfM results.
– Supplement the quantitative analysiswith qualitative expert assessmentson whether it is in the public interestto deliver core services by the privatesector. For example, in the UK,
qualitative reviews are conducted onthree aspects: viability, desirabilityand achievability.
– Take a multistage approach, andrepeat it at various times. Forexample, Australian policy is toconduct a VfM analysis beforeissuing the request for proposals,but then to reassess the alternativedelivery modes at later stages of theproject, such as after submission ofthe bids.
The result of the VfM analysis willdepend on a number of factors. Private-sector delivery stands a better chance ofproviding a net benefit to society whenmore of the following characteristicsapply:
– Large size of the project relative totransaction costs
– Opportunities for reducing life cyclecosts via innovative design andengineering solutions
– Opportunities for revenueoptimization and innovation
– Superior design expertise and/orimplementation expertise within theprivate sector
– Feasibility of risk identification andallocation
– Specification of service needs asoutputs and outcomes
– Possibility of estimating the asset’s
long-term costs and demand– Stability of technological aspects
– Low complexity in intra-governmentcoordination
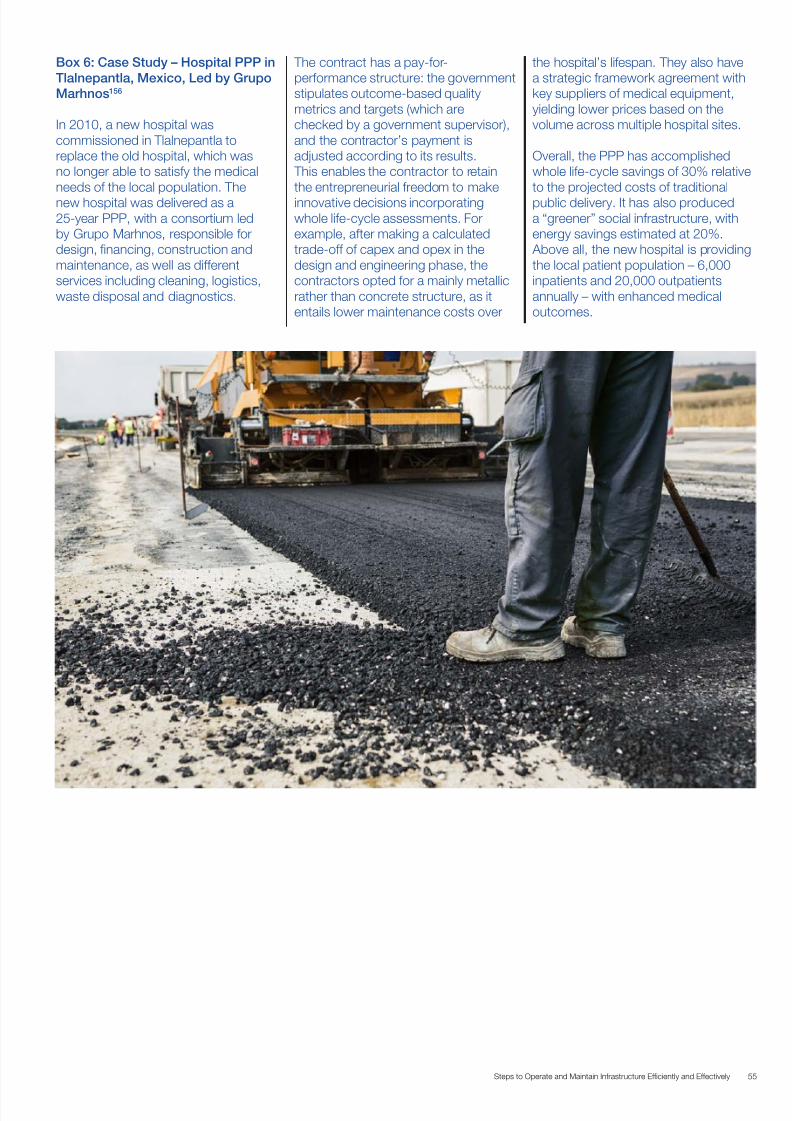
7/25/2019 Strategic Infrastructure Steps Report 2014
http://slidepdf.com/reader/full/strategic-infrastructure-steps-report-2014 55/88
55Steps to Operate and Maintain Infrastructure Efficiently and Effectively
Box 6: Case Study – Hospital PPP in
Tlalnepantla, Mexico, Led by Grupo
Marhnos156
In 2010, a new hospital wascommissioned in Tlalnepantla toreplace the old hospital, which wasno longer able to satisfy the medicalneeds of the local population. Thenew hospital was delivered as a25-year PPP, with a consortium ledby Grupo Marhnos, responsible fordesign, financing, construction andmaintenance, as well as differentservices including cleaning, logistics,waste disposal and diagnostics.
The contract has a pay-for-performance structure: the governmentstipulates outcome-based qualitymetrics and targets (which arechecked by a government supervisor),and the contractor’s payment isadjusted according to its results. This enables the contractor to retainthe entrepreneurial freedom to makeinnovative decisions incorporatingwhole life-cycle assessments. Forexample, after making a calculatedtrade-off of capex and opex in thedesign and engineering phase, thecontractors opted for a mainly metallicrather than concrete structure, as itentails lower maintenance costs over
the hospital’s lifespan. They also havea strategic framework agreement withkey suppliers of medical equipment,yielding lower prices based on thevolume across multiple hospital sites.
Overall, the PPP has accomplishedwhole life-cycle savings of 30% relativeto the projected costs of traditionalpublic delivery. It has also produceda “greener” social infrastructure, withenergy savings estimated at 20%. Above all, the new hospital is providingthe local patient population – 6,000inpatients and 20,000 outpatientsannually – with enhanced medicaloutcomes.
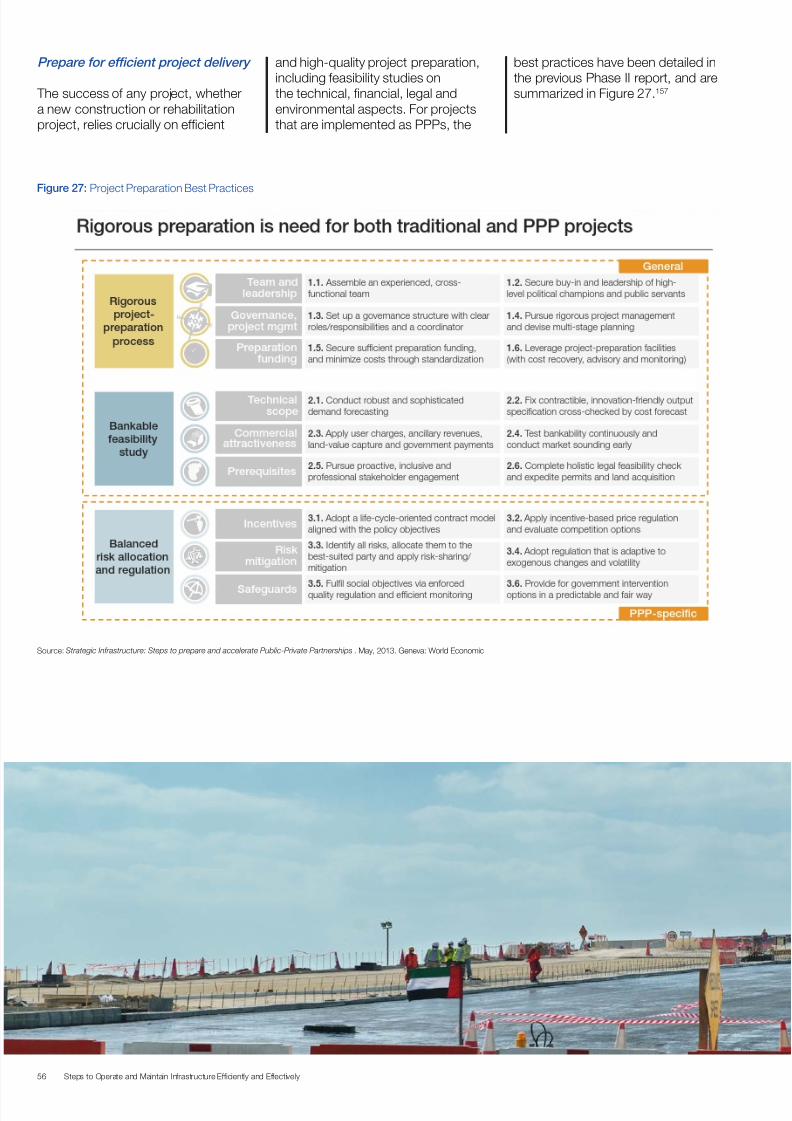
7/25/2019 Strategic Infrastructure Steps Report 2014
http://slidepdf.com/reader/full/strategic-infrastructure-steps-report-2014 56/88
56 Steps to Operate and Maintain Infrastructure Efficiently and Effectively
Prepare for efficient project delivery
The success of any project, whethera new construction or rehabilitationproject, relies crucially on efficient
and high-quality project preparation,including feasibility studies onthe technical, financial, legal andenvironmental aspects. For projectsthat are implemented as PPPs, the
best practices have been detailed inthe previous Phase II report, and aresummarized in Figure 27.157
Figure 27: Project Preparation Best Practices
Source: Strategic Infrastructure: Steps to prepare and accelerate Public-Private Partnerships. May, 2013. Geneva: World Economic

7/25/2019 Strategic Infrastructure Steps Report 2014
http://slidepdf.com/reader/full/strategic-infrastructure-steps-report-2014 57/88
57Steps to Operate and Maintain Infrastructure Efficiently and Effectively
For projects implemented under thetraditional government delivery, thesame best practices as listed in theupper part of Figure 27 apply, but someadditional engineering and design leversare advisable.158
Apply value engineering.
– Avoid over-engineering in design.Specifically, be frugal and adaptto (and perhaps adapt) customerneeds; question the performancespecifications, and deliver onlywhat the customer really wants.For example, for the Tyrrhenian toll-road project, Autostrade per l’Italiamanaged to reduce the projectedcapital expenditure from € 3.6 billionto just € 2.0 billion by loweringthe maximum speed and thereby
saving on expensive tunnels andbridges. A railway project mightsimilarly achieve huge savings byopting for a medium-speed ratherthan a high-speed rail line: thatwould be particularly feasible forshort-distance lines, where reliableand economical travel may bemore important than slightly shorter journey times.
– Develop systems that fulfil customerneeds at the lowest possible
life cycle cost – for example,by developing and adoptingmodular or standardized designsthat can be repeated acrossprojects; homogenizing processes,equipment and material; andleveraging learning and scaleeffects.
– Design for longevity. The privateconcessionaire of the world’s tallest
bridge, the Millau Viaduct in France,has guaranteed that it will remainoperational for at least 120 years.
– Design for flexibility. User needsevolve; ports, for instance, mightneed to accommodate largercontainer ships. So ideally, theasset should have built-in, long-
term adaptability from the outset.Heathrow Airport’s Terminal 5,for example, employed modulardesigns so the gates could beequally usable for both low-cost andhub carriers. Leighton Contractors,for its South East QueenslandSchools PPP, made the schoolfacilities future-proof for the 30-yearconcession by planning three stagesof construction, with progression tothe next stage based on increasingstudent numbers. When school
enrolments accelerated beyond theoriginal forecast, one facility wasredesigned to accommodate 30%more students than planned.
– Consider innovative designs. Forexample, the proposed eco-friendly“sponge-like” water system inPhiladelphia (US), involving newforms of drainage, repaving withporous materials, green roofs andwetlands, would be less than halfthe cost of a conventional upgrade
of the current system of pipes andbasins.159
Optimize construction management and monitoring.
– Set up a project managementoffice for systematically monitoringand supporting project teams andcontractors in their efforts to avoid
slippages in cost and schedule.Define clear roles and interfaces toimprove coordination of the differentparties involved.
– Define and implement leanmethodology in construction andthe supply chain to avoid waste,such as waiting times for materials
and equipment, unnecessarymovements and rework.
– Establish a rigorous and forward-looking system of cost-, risk- andtime management.
– Use innovative technologies. Forrebuilding roads, for instance,this could involve modern andspecialized asphalt systemsor concretes, prefabricatedcomponents and recycled materials.
Optimize procurement.
– Procure any equipment andcomponents based on the best VfM, taking a whole life-cycleperspective and considering bothcost and quality.
– Consider innovation-friendly output/ outcome specifications; use inputspecifications sparingly: everyadditional input specification limitsdesign options, and so could
increase costs.
– Scope procurement documentsdiligently, and freeze the projectspecifications before putting theproject out for tender, to avoid costlychanges later.
– Design contracts with clear liabilityrules and bonus-malus incentives.

7/25/2019 Strategic Infrastructure Steps Report 2014
http://slidepdf.com/reader/full/strategic-infrastructure-steps-report-2014 58/88
58 Steps to Operate and Maintain Infrastructure Efficiently and Effectively
2. Enabling O&M BestPractices
This section of the report discussesand illustrates the best practicesrelated to enabling sustainable O&M. Itis structured along the dimensions offunding, capabilities and governance. It
does not deal with the broader enablingenvironment, that is, best practicesrelated to the legal and institutionalframework, and development of thelocal industry and the financial market.
2.1 Ensure funding
The funding (or revenues) for operatingand maintaining infrastructure assetsneeds to come from somewhere.160
Traditionally, the funding would comemainly or entirely from the government,through tax revenues, and would actas a full or partial subsidy, in that theservices were provided to users for freeor at prices below cost. With publicbudgets often depleted nowadays,however, that model is unsustainable,and more diversified funding sourcesare needed.
One particular problem with traditionalpublic budget funding is that it makesmaintenance budgets vulnerable topolitical expediency: when politiciansneed to make overall budget cuts,O&M funding suffers. Even withoutthese rival claims on funding, however,politicians have little incentive to makeprovision for O&M, given the low profileof O&M projects relative to those fornew construction. In addition, the oft-employed pay-as-you-go funding mightdefer maintenance work, or even stop itmidway, and thereby create additional
inefficiencies as well as an undue focuson achieving the lowest-possible initialcosts.
What O&M needs is long-term planningcertainty and continuity of fundingacross multiple government cycles. Toensure sufficient and stable fundingfor O&M, governments can earmark
a proportion of user taxes, apply usercharges or capture ancillary businessopportunities. (The following discussionmainly relates to publicly operatedinfrastructure. In a PPP model, thesame funding sources are available, butthe government automatically enters along-term O&M funding commitmentthrough the contract with the privateparty.)
Dedicate user taxes to a
maintenance fund
User taxes, such as a fuel tax, areoften channelled into a nation’s generalbudget; the relevant agency receivesdiscretionary allocations from thatgeneral budget, and in turn allocatesthem to O&M, which is often subject topolitical expediency. A sounder systemwould ring-fence all or some of the usertaxes for the O&M of the infrastructureasset – whose users actually pay thosetaxes, after all. One approach is to set
up a dedicated maintenance fund,which receives the user taxes anddisburses the money to the agenciesimplementing O&M. The road sector,for instance, benefits from a “road fund”in many countries.
This closed monetary cycle will enable areliable source of maintenance funding,and prevent alternative uses of the usertaxes. The ring-fenced maintenancefund means that maintenance cannow take place when needed, rather
than when current liquidity allows. Thefund effectively provides long-termpredictability and a multiyear fundingguarantee by decoupling funding fromthe annual logic of public budgets.
The benefits go further than that. The fund enhances transparency onspending levels and resource allocation.If the fund is able to issue debt to raiseliquidity for investments, enhanced
public budget control and betterfinancial planning result, as the fundneeds to repay those loans using itsdedicated future income streams.
The gain in predictability has adownside: less fiscal flexibility for thegovernment. The current governmentloses its allocation rights over a part ofthe tax revenues and so has less roomto manoeuvre in its overall budgeting.
A dedicated fund can create amore stable funding base for O&M,but it is no panacea and does notguarantee efficient use of the acquiredfunds. Many first-generation roadfunds in the 1960s and 1970s in Africa, Asia and Latin America werecharacterized by insufficient revenuesand poor governance, resulting in poorallocation of funds and low operationalefficiency.161 Governments shouldconsider the following lessons whendesigning O&M funds:
Secure a sufficient and diversified
revenue base.
– Consider the various user taxes (forroads, these include fuel tax, vehiclelicence fee and vehicle purchasetax), as well as user charges (suchas tolls, vignettes, overweightcharges and fines) as potentialfunding sources besides regulargovernment appropriations from thegeneral budget.
– Evaluate the performance ofeach revenue source in terms ofeconomic efficiency, user incentives,social fairness, collection cost,
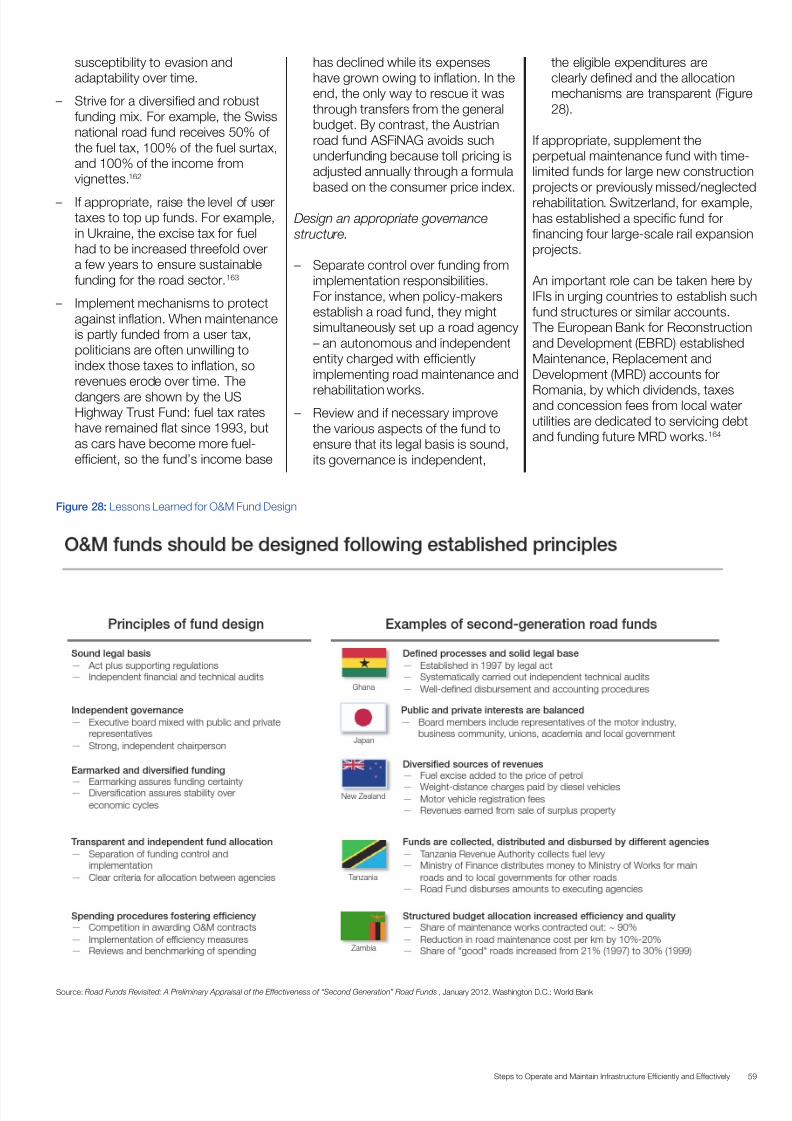
7/25/2019 Strategic Infrastructure Steps Report 2014
http://slidepdf.com/reader/full/strategic-infrastructure-steps-report-2014 59/88
59Steps to Operate and Maintain Infrastructure Efficiently and Effectively
susceptibility to evasion andadaptability over time.
– Strive for a diversified and robustfunding mix. For example, the Swissnational road fund receives 50% ofthe fuel tax, 100% of the fuel surtax,and 100% of the income fromvignettes.162
– If appropriate, raise the level of usertaxes to top up funds. For example,in Ukraine, the excise tax for fuelhad to be increased threefold overa few years to ensure sustainablefunding for the road sector.163
– Implement mechanisms to protectagainst inflation. When maintenanceis partly funded from a user tax,politicians are often unwilling toindex those taxes to inflation, sorevenues erode over time. The
dangers are shown by the USHighway Trust Fund: fuel tax rateshave remained flat since 1993, butas cars have become more fuel-efficient, so the fund’s income base
has declined while its expenseshave grown owing to inflation. In theend, the only way to rescue it wasthrough transfers from the generalbudget. By contrast, the Austrianroad fund ASFiNAG avoids suchunderfunding because toll pricing isadjusted annually through a formulabased on the consumer price index.
Design an appropriate governance
structure.
– Separate control over funding fromimplementation responsibilities.For instance, when policy-makersestablish a road fund, they mightsimultaneously set up a road agency– an autonomous and independententity charged with efficientlyimplementing road maintenance and
rehabilitation works.– Review and if necessary improve
the various aspects of the fund toensure that its legal basis is sound,its governance is independent,
the eligible expenditures areclearly defined and the allocationmechanisms are transparent (Figure28).
If appropriate, supplement theperpetual maintenance fund with time-limited funds for large new constructionprojects or previously missed/neglectedrehabilitation. Switzerland, for example,has established a specific fund forfinancing four large-scale rail expansionprojects. An important role can be taken here byIFIs in urging countries to establish suchfund structures or similar accounts. The European Bank for Reconstructionand Development (EBRD) establishedMaintenance, Replacement andDevelopment (MRD) accounts for
Romania, by which dividends, taxesand concession fees from local waterutilities are dedicated to servicing debtand funding future MRD works.164
Figure 28: Lessons Learned for O&M Fund Design
Source: Road Funds Revisited: A Preliminary Appraisal of the Effectiveness of “Second Generation” Road Funds, January 2012. Washington D.C.: World Bank
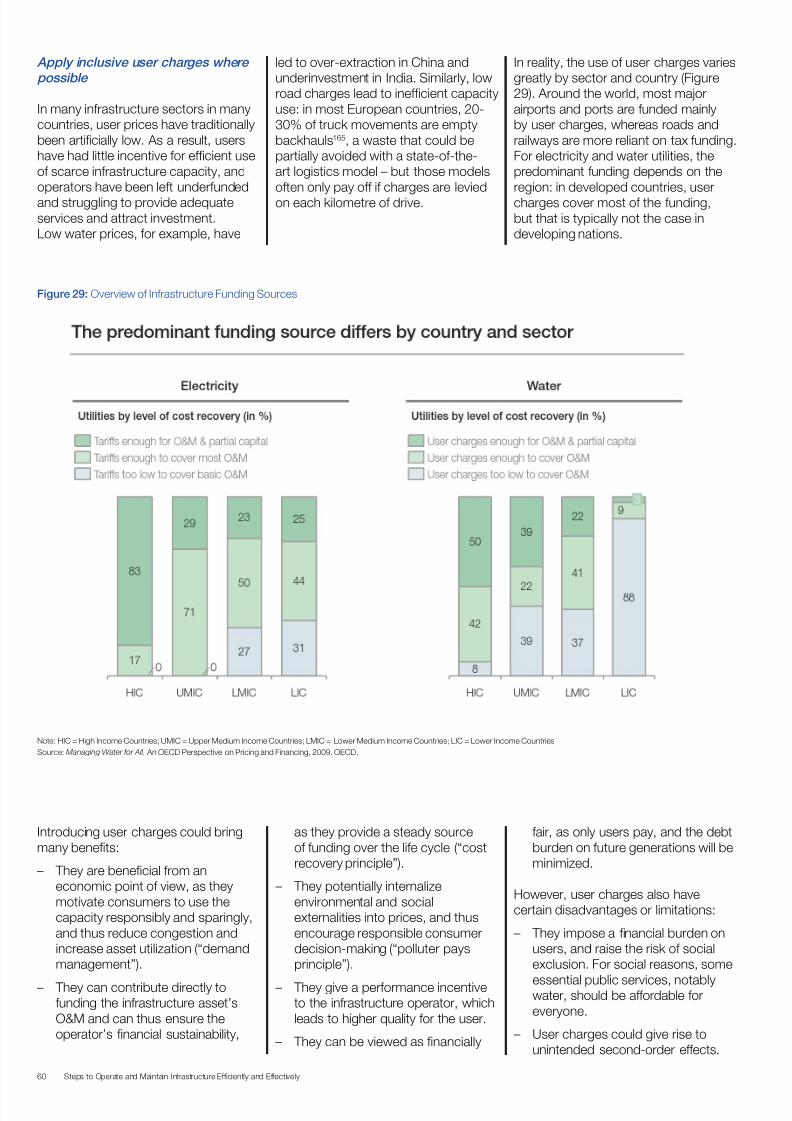
7/25/2019 Strategic Infrastructure Steps Report 2014
http://slidepdf.com/reader/full/strategic-infrastructure-steps-report-2014 60/88
60 Steps to Operate and Maintain Infrastructure Efficiently and Effectively
Apply inclusive user charges where
possible
In many infrastructure sectors in manycountries, user prices have traditionallybeen artificially low. As a result, usershave had little incentive for efficient useof scarce infrastructure capacity, andoperators have been left underfundedand struggling to provide adequateservices and attract investment.Low water prices, for example, have
led to over-extraction in China andunderinvestment in India. Similarly, lowroad charges lead to inefficient capacityuse: in most European countries, 20-30% of truck movements are emptybackhauls165, a waste that could bepartially avoided with a state-of-the-art logistics model – but those modelsoften only pay off if charges are leviedon each kilometre of drive.
In reality, the use of user charges variesgreatly by sector and country (Figure29). Around the world, most majorairports and ports are funded mainlyby user charges, whereas roads andrailways are more reliant on tax funding.For electricity and water utilities, thepredominant funding depends on theregion: in developed countries, usercharges cover most of the funding,but that is typically not the case indeveloping nations.
Figure 29: Overview of Infrastructure Funding Sources
Note: HIC = High Income Countries; UMIC = Upper Medium Income Countries; LMIC = Lower Medium Income Countries; LIC = Lower Income Countries
Source: Managing Water for All. An OECD Perspective on Pricing and Financing, 2009. OECD.
Introducing user charges could bringmany benefits:
– They are beneficial from aneconomic point of view, as theymotivate consumers to use thecapacity responsibly and sparingly,and thus reduce congestion andincrease asset utilization (“demandmanagement”).
– They can contribute directly tofunding the infrastructure asset’sO&M and can thus ensure theoperator’s financial sustainability,
as they provide a steady sourceof funding over the life cycle (“costrecovery principle”).
– They potentially internalizeenvironmental and socialexternalities into prices, and thusencourage responsible consumerdecision-making (“polluter paysprinciple”).
– They give a performance incentiveto the infrastructure operator, whichleads to higher quality for the user.
– They can be viewed as financially
fair, as only users pay, and the debtburden on future generations will beminimized.
However, user charges also havecertain disadvantages or limitations:
– They impose a financial burden onusers, and raise the risk of socialexclusion. For social reasons, some
essential public services, notablywater, should be affordable foreveryone.
– User charges could give rise tounintended second-order effects.

7/25/2019 Strategic Infrastructure Steps Report 2014
http://slidepdf.com/reader/full/strategic-infrastructure-steps-report-2014 61/88
61Steps to Operate and Maintain Infrastructure Efficiently and Effectively
For instance, a toll road could leadto rat-run congestion on a paralleluncharged road; and, the impositionof congestion charges to reducetraffic levels could result in lowerrevenues for shops within that zone.
– They involve transaction costs forthe operator, and can mean time
costs for the user (e.g. queues thatform at some highway tollbooths). The issue is receding, however, instep with technological progress;e-tolling, for example, eliminatessuch delays.
– User charges are by no meansapplicable for all assets. Only insome sectors, such as airportsor ports, or in particular parts ofa network, such as expressways,is there enough demand to
support charging users. For otherinfrastructure assets, particularly inrural areas, additional governmentfunding arrangements need to be inplace.
Once again, IFIs can play an importantrole in introducing user charges.For example, the EBRD’s MunicipalEnvironmental Loan Facility providesloans to commercialized utilities inRomania, on condition that costrecovery user charges are levied and
effectively collected.166
The following is a list of measuresfor policy-makers to consider whenintroducing user charges:
Forestall or at least defuse the likely resistance from users.
Upon initial introduction, user chargestend to arouse opposition. Theytypically gain acceptance, however,
if any of the following measures areapplied:
– If initiating user charges, correlatethem with significant qualityimprovements, as when anupgraded toll road saves motoristsvaluable time commuting to workeach morning. If appropriate,actively communicate this addedvalue in a publicity campaign. In thelong run, people tend to moderatetheir opposition or modify theirbehaviour. For example, when thecongestion charge was introducedin Stockholm, Sweden in 2006,more than half of the populationwas against tolls, but in 2011, 70%
supported the charge, given the20% reduction in rush-hour traffic.167
– Offer user-friendly, efficient andaccessible payment options.Highway 6 in Israel bills its usersautomatically, using an in-vehicletransponder unit. Alternatively, non-registered users are billed through
licence plate recognition, allowingthe highway to operate as a normalfreeway with interchanges andwithout tollbooths, while achieving atoll collection rate of 97%.168
– Educate the public on theadvantages of the new system andthe anticipated payments. For theBarranquilla water PPP, a publicitycampaign explained how the newwater supply line greatly reducesthe cost of water in comparison
with the traditional supply fromwater trucks.169 Education initiativescan also help users to reduce theirconsumption, and hence theirbills. In the case of the São Paulo(Brazil) Slum Electrification andLoss Reduction Programme, userconsumption fell by 40% partly asa result of an information campaignand various energy efficiencymeasures.170
Set user charges by balancing financial
sustainability, user incentives and affordability objectives.
Various objectives need delicatebalancing, as in ensuring that the assetis financially sustainable, encouragingusers to deliberately use the asset andmaking the service affordable for allpotential users.
– Ensure the operator’s financialstability, within limits.
– Determine the user chargebased on the investment andoperating costs, so that arisk-adequate return can begenerated; alternatively, considersubsidies to fill the funding gap.
– Establish mechanisms to adaptthe user charge over time toadjust for inflation.
– Set a cap on the user chargeto avoid an abuse of monopolypower by the operator.
– Embed incentives into user chargesto manage demand (see chapter1.1).
– Ensure that user charges areaffordable to all user groups, basedon an analysis of willingness andability to pay. According to aninternational rule of thumb, anaffordability problem arises whenhouseholds spend more than 3-5%of their income on a particularinfrastructure service, such as wateror public transport.171
Design “inclusive user charges”to mitigate the adverse social
consequences.
– Consider reduced tariffs for at-riskgroups, or design socially inclusivetariff structures. Several countrieshave used a tiered water pricingsystem: for instance, a certainamount of water a day is provided
at a low price to satisfy basicneeds, and thereafter, as waterconsumption increases, so doesthe price. Some public transportsystems apply flat pricing, whicheffectively subsidizes the dailycommute of poor working peoplewho live in distant suburbs.
– Provide different service levels toaddress affordability concerns.Manila Water’s “Water for thePoor” programme, for example,
offers relatively modestly pricedcommunity connections.172
– Improve alternative infrastructure.When the inner London cordontoll was introduced in 2004, thesocial exclusion effect was offsetby simultaneous improvements tothe public transport system. Thecombined intervention reduced cartraffic by 15% and congestion by30%, while increasing bus ridershipand bus reliability.173
– Seek subsidies where appropriate.When an asset receives a subsidy(or viability gap funding), userpayments can be reduced, andideally that will make the serviceaffordable for all users. For example,most public transport systems in theworld cannot recover their expensesthrough fares alone; they regularlyreceive supply-side subsidies for thesake of positive externalities, suchas increased frequency of service,reduced congestion and lessadverse environmental impact. Analternative approach is that of directdemand-side subsidies targetingspecific users, but it is often difficultto implement in practice.
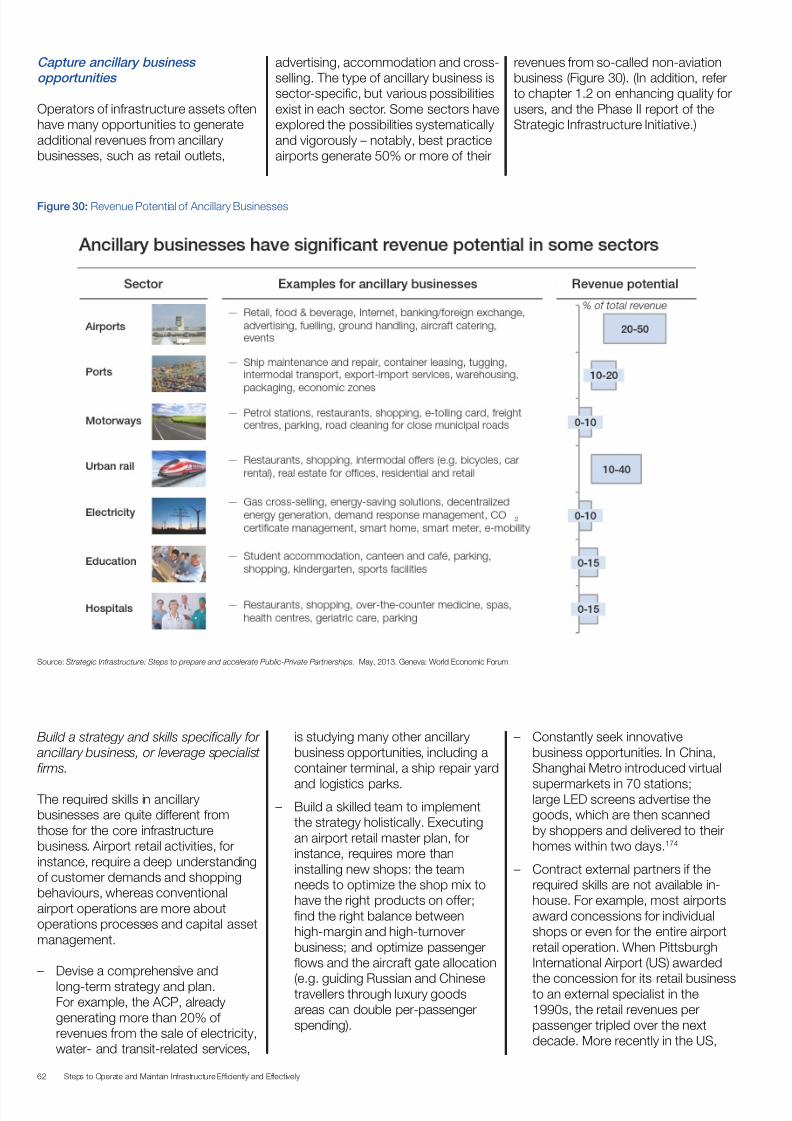
7/25/2019 Strategic Infrastructure Steps Report 2014
http://slidepdf.com/reader/full/strategic-infrastructure-steps-report-2014 62/88
62 Steps to Operate and Maintain Infrastructure Efficiently and Effectively
Capture ancillary business
opportunities
Operators of infrastructure assets oftenhave many opportunities to generateadditional revenues from ancillarybusinesses, such as retail outlets,
advertising, accommodation and cross-selling. The type of ancillary business issector-specific, but various possibilitiesexist in each sector. Some sectors haveexplored the possibilities systematicallyand vigorously – notably, best practiceairports generate 50% or more of their
revenues from so-called non-aviationbusiness (Figure 30). (In addition, referto chapter 1.2 on enhancing quality forusers, and the Phase II report of theStrategic Infrastructure Initiative.)
Figure 30: Revenue Potential of Ancillary Businesses
Source: Strategic Infrastructure: Steps to prepare and accelerate Public-Private Partnerships. May, 2013. Geneva: World Economic Forum
Build a strategy and skills specifically for ancillary business, or leverage specialist
firms.
The required skills in ancillarybusinesses are quite different fromthose for the core infrastructurebusiness. Airport retail activities, forinstance, require a deep understandingof customer demands and shoppingbehaviours, whereas conventionalairport operations are more aboutoperations processes and capital assetmanagement.
– Devise a comprehensive and
long-term strategy and plan.For example, the ACP, alreadygenerating more than 20% ofrevenues from the sale of electricity,water- and transit-related services,
is studying many other ancillarybusiness opportunities, including acontainer terminal, a ship repair yard
and logistics parks.– Build a skilled team to implement
the strategy holistically. Executingan airport retail master plan, forinstance, requires more thaninstalling new shops: the teamneeds to optimize the shop mix tohave the right products on offer;find the right balance betweenhigh-margin and high-turnoverbusiness; and optimize passengerflows and the aircraft gate allocation
(e.g. guiding Russian and Chinesetravellers through luxury goodsareas can double per-passengerspending).
– Constantly seek innovativebusiness opportunities. In China,Shanghai Metro introduced virtual
supermarkets in 70 stations;large LED screens advertise thegoods, which are then scannedby shoppers and delivered to theirhomes within two days.174
– Contract external partners if therequired skills are not available in-house. For example, most airportsaward concessions for individualshops or even for the entire airportretail operation. When PittsburghInternational Airport (US) awarded
the concession for its retail businessto an external specialist in the1990s, the retail revenues perpassenger tripled over the nextdecade. More recently in the US,
7/25/2019 Strategic Infrastructure Steps Report 2014
http://slidepdf.com/reader/full/strategic-infrastructure-steps-report-2014 63/88
63Steps to Operate and Maintain Infrastructure Efficiently and Effectively
Virginia’s Office of Transportationposted a request for information fora pilot project on the developmentof mixed-use facilities at two metrostations, in order to get private-sector feedback on an area ofbusiness having little in commonwith its roadway-centric heritage.175
Leverage scale and all assets for ancillary business.
Leverage the project’s scale, its tangibleassets or even its intangible assets. Anexample of each:
– Scale: a motorway PPP might offerroad cleaning services to nearbyvillages.
– Tangible assets: a highway operatormight rent space for fibre-optic
cables, or charge for right-of-way tosolar and wind power generators.
– Intangible assets: a public transportnetwork could make its electronicpayment scheme available to otherbusinesses to accept payments orconduct promotion activities. Asan actual example, New York Citysecured a US$ 41 million deal froma bank, giving the latter the namingrights to the city’s bike-sharingprogramme.176
Capture land value.
Land value capture is mainly applicablein greenfield settings, but notexclusively so. Operators of existinginfrastructure assets can benefit as well:
– Make the most of existing land. InHong Kong, MTR derives more than30% of its operating profits fromproperty development, ownershipand management.177
– Increase the space efficiency ofexisting operations, and therebyfree up land or increase capacity.Dusseldorf Airport in Germany isintroducing an automated parkingsystem that enables cars to parkcloser to each other, thus increasingspace productivity by 40%.178
– For expansion projects, pursuefurther opportunities to apply landvalue capture. During the briefwindow of opportunity betweenplanning and publicizing the project,buy up the land and then eithersell it to independent real estatedevelopers or make it part of the
development package. For example,the new metro lines in Brasilia(Brazil) and Copenhagen (Denmark)raised 85% and 50%, respectively,of their required funding throughland sales.179
2.2 Build
capabilities
To implement O&M best practice,governments first need to build the rightcapabilities. These are of three broadtypes:
– Asset management planning on thecountry-wide institutional level
– Data, benchmarks and tools on theagency-specific institutional level
– Training and talent development onthe individual level
This section offers detailedrecommendations for developing eachof the three capabilities.
Introduce asset management
planning
To introduce sound asset managementplanning, governments need to embedO&M into national infrastructure plans,
reform the principles of infrastructureaccounting and adopt a common assetmanagement framework across thevarious agencies.
Embed O&M into national infrastructure plans.
– Make O&M a priority in the nationalinfrastructure policy. Developpolicies to foster and enable theefficient management of existinginfrastructure, in addition to the
conventional focus on policiesfor new asset construction, as inSwitzerland.
– For each infrastructure sector,commission occasional reports onnetwork condition and performance,and aggregate and consolidateagency-level maintenance plans intoa nationwide plan. While no clearprocess for identifying maintenanceand rehabilitation needs exists inmany countries, this reporting and
planning will produce an integratedperspective across regions andoperators – a crucial resource, givenhow fragmented the managementresponsibilities tend to be across
regions and municipalities, as wellas across agencies, state-ownedenterprises and private operators(refer also to the discussion ofpublic agency cooperation inchapter 2.3). On the basis of thisassessment of current condition andfuture demand, draw up long-termmaintenance plans and forward-looking O&M budgets.
– Develop a truly integrated nationalinfrastructure plan. Integratemaintenance and rehabilitationprojects into the nationalinfrastructure programme/plans,alongside greenfield projects, andprioritize all projects according tothe highest cost-benefit ratio basedon economic, environmental andsocial factors. This will counter thecommon temptation to over-favour
high-profile greenfield projects, anddiscourage a pure “fix it first” policy.
– Ensure the durability and continuityof these O&M plans acrossgovernment cycles, either bylegislating standards or by assigningthe planning to quasi-independent,technocrat-led agencies.
Reform the principles of public
infrastructure accounting.
– One key requisite for robust O&Mbudgets and plans is an appropriatesystem of public accounting.Under the traditional, single-entrycameralistic systems of fiscalaccounting, which concentratesimply on cash inflows andoutflows, decision-makers have littleincentive to maintain the existingasset base: after all, maintenanceappears to involve cash outflowsbut no inflows, as the increase
in value of the asset stock is notrecorded. In contrast, a proper,modern accrual-based double-entrysystem of accounting can rebalancethe incentives. Assets can now berecorded on the balance sheet,with their value being depreciatedand regularly reassessed. Forinstance, a road’s value depreciateswith each additional pothole, andthat information can be used toimprove decisions and reportto stakeholders to reveal the
maintenance backlog, helping to justify maintenance spending. TheUS introduced the Governmental Accounting Standards BoardStatement 34 in 1999 to help local

7/25/2019 Strategic Infrastructure Steps Report 2014
http://slidepdf.com/reader/full/strategic-infrastructure-steps-report-2014 64/88
64 Steps to Operate and Maintain Infrastructure Efficiently and Effectively
and state governments profile theirinfrastructure in a proper way; and,many countries now aim to abide byaccrual-based International PublicSector Accounting Standards,which are based on the private-sector International FinancialReporting Standards (IFRS).180
Adopt a common asset managementframework.
– Develop a country-wide,standardized asset managementframework for adoption bythe different agencies to guidemanagers and workers in executingtheir O&M tasks. Such a frameworkshould cover all aspects of a sound
asset management system, rangingfrom asset management policy andstrategy to enablers and controls,and to performance assessmentsand management reviews. Foreach agency, these systemcapabilities need to be developedin a customized approach basedon their respective human resource,knowledge management andorganizational learning challengesand opportunities.
– Structure the asset managementframework in keeping withinternational standards, such as theBritish Standards Institution’s (BSI)Publicly Available Specification (PAS55) and International Standards
Organisation 55000 (ISO 55000)(Figure 31). The PAS 55, publishedby the BSI under the supervision ofthe Institute of Asset Management,provides a 28-point requirementschecklist of good practices inphysical asset management. Itsguidance is widely applicable, forinstance to gas, electricity andwater utilities, and to road, air andrail transport. It also provides atoolkit for self-assessment. In fact,PAS 55/ISO 55000 certificationwas ranked second among thetop 10 investment priorities forasset management practitioners in2013.181
Figure 31: Example of an Asset Management Framework
Note: BSI = British Standards Institution; PAS = Publicly Available Specification; AM = Asset Management
Source: PAS 55-1: Asset Management in The Institute of Asset Management:, 2008.
Apply data, benchmarks and tools
The main O&M-relevant capabilitiesthat each individual governmentagency needs to develop are those
for collecting relevant data andbenchmarks, acquiring the appropriateIT systems and other tools, and usingthem in conjunction as a way toimprove decision-making.
Traditionally, the O&M of infrastructureassets has been subjected toinsufficient scrutiny and measurement.Operators often have only a verysketchy overview of a facility and its
equipment. The history of an asset’sconstruction and repairs is often lost,and information on the current assetcondition is frequently not available.Operators also tend to have too
little data on the asset’s usage andperformance levels, and hence on itscost effectiveness. Even when theyhave abundant data, they may struggleto use it because of its varied relevance
and inconsistency.
Without the right hard data for analytics,benchmarking, modelling and impactevaluation, operators are hampered

7/25/2019 Strategic Infrastructure Steps Report 2014
http://slidepdf.com/reader/full/strategic-infrastructure-steps-report-2014 65/88
65Steps to Operate and Maintain Infrastructure Efficiently and Effectively
in their decision-making and settingof stretch targets. Governments andoperators should ideally know the stateof each asset, piece of equipment andcomponent, and how each of themperforms, both over time and relativeto others. That will involve a structuredapproach to capturing, sifting andaggregating the relevant information ina comprehensive IT system. The betterthe monitoring and measuring, thesharper the O&M decisions will be, andthe greater their eventual impact.
Collect comprehensive O&M data.
– Assess and understand the datarequirements that are necessaryto optimize O&M. A prioritized listof the key data requirements willassure that costly data collection is
focused on the areas where mostvalue can be created.
– Set up an asset register and collectdata on the asset’s history, thecurrent condition, O&M measures,performance, usage and context.
– To supplement that effort, putadequate systems, processesand resources in place forregularly updating the data. Earlydata repositories may lack thecomprehensiveness needed for full
life cycle analysis, but the modelsshould improve as more databecomes available over time.
– Exploit the big data opportunity(Box 7), which will complement thetraditional structured database anddata management systems.
Box 7: The Big Data Opportunity
Today’s world produces a vast amountof digital data. The volume is currentlyincreasing by 2.5 billion gigabytesevery day. The proliferation of low-cost sensor technology has openeda treasure trove of new informationsources, including transactions, socialmedia, radio frequency identificationsensors, cameras and GPS, whichcan be harnessed by infrastructureoperators.182
New opportunities arise not just fromthe soaring volume of data, but alsofrom the data’s increasing variety(which can now be mined even fromunstructured data sources) andvelocity (i.e. the speed at which datais collected, processed and used for
decision-making and automatic systemresponses). With this mass of dataand rapid advances in processingpower, storage density and connectionspeed, big data applications arebecoming increasingly economical. They present a major opportunity forimproving productivity and efficiencyin infrastructure. Operators willfind it easier than ever to improvemarket research, enhance O&Mdecision-making and boost customerrelationships and satisfaction.
One obvious benefit is that of makinginfrastructure operations moreefficient. They might, for instance,leverage big data to improve intelligenttransportation systems and enabledynamic peak pricing, and in that way
avoid having to invest in expensivenew capacity. The Stockholm roadauthorities, for instance, collect real-time traffic data from a variety ofsources, including vehicle GPS, radarsensors, congestion charging andweather reports, and process it viaalgorithms to advise motorists onoptimal travel routes.183
To take full advantage of big data,infrastructure operators need to defineopen and interoperable interfacesand industry standards to enable datainterchange. They can publish datathrough application programminginterfaces and thereby enableentrepreneurs to unlock the value ofthe data; connect to other data; anddevelop new user solutions. New YorkCity’s “Midtown in Motion” congestion
management system provides such aninterface for app developers. Despitethis openness, operators need to becautious and manage data responsiblyin the public interest to earn the trustof stakeholders on data privacy andcybersecurity.184
In addition, the infrastructure industryneeds to embrace new forms ofmultistakeholder collaboration. Inthe Netherlands, for example, the Amsterdam Smart City project has 70
partners from business, government,academia and the local populationworking together to identify, test andeventually scale up different smart cityinitiatives, such as car sharing, homeenergy management and electricity-powered ships.185

7/25/2019 Strategic Infrastructure Steps Report 2014
http://slidepdf.com/reader/full/strategic-infrastructure-steps-report-2014 66/88
66 Steps to Operate and Maintain Infrastructure Efficiently and Effectively
Organize benchmarking.
Infrastructure operators shouldbenchmark themselves against otheroperators to identify potential ways ofimproving the system. Comparisonsare seldom straightforward, of course,and no two situations are identical. Toensure meaningful results, the analystshave to delicately choose which datato analyse, decide on the best level ofgranularity for the KPIs, and take intoaccount contextual factors such asdemand, location and the asset’s age. And, they need to use a consistentand standardized methodology whencollecting data. One challenge theyface is that infrastructure data isseldom available publicly; the rules onrecord-keeping and on disclosing datavary from country to country. A global
infrastructure benchmarking initiative,as suggested by the MultilateralDevelopment Banks (MDB) WorkingGroup on Infrastructure and supportedby the latest Business 20 (B20), wouldbe beneficial in this regard.
– In benchmarking, cover all aspectsof O&M in a sector-specificapproach; combine qualitativeand quantitative data, and alsoexchange ideas on cost reduction,quality upgrades and otherimprovements. The Community ofMetros (CoMET), a consortium of30 metro systems from around theworld that is facilitated by a researchcentre at Imperial College London,is an interesting example. It tracksmore than 30 KPIs of its members,provides quantitative benchmarksand establishes qualitative bestpractices in case studies. Partlyon the basis of its indications, theNew York City Transit Authorityintroduced floor markings to show
commuters where to stand onplatforms, and departure clocks fordrivers to standardize their “dwelltime”. As a result, capacity onone of New York’s busiest transitlines increased by 4.5%, with 17%considered achievable.186
– Actively seek appropriate peers,and then conscientiously conductexternal benchmarking. Forexample, in the US, the PhoenixWater Services Departmentundertook a review of its O&Mpractices and benchmarked themagainst other well-run utilities, bothpublic and private. The quality ofcustomer service rose, while costsfell by US$ 10 million annually.187
– Benchmark data can also beprovided by national governmentsto consolidate data from the manylocal and regional agencies. TheUS Department of Transportationoperates an online databaseof detailed capital and O&Mcost estimates for Intelligent Transportation System deployments,ranging from roadside informationto toll plazas and parkingmanagement.188
– Conduct internal benchmarkingas well, if possible. LondonUnderground has introduced abenchmark report comparing thedifferent areas of its network.189 AndRoyal Vopak of the Netherlandsuses its terminal maturity modelto assess and compare its oil andgas storage terminals throughout
the world, and improve theirperformance.190
Implement asset management systems and tools.
There is no point in collecting data fordata’s sake; the point is to transformdata into useful information that aidsand improves decision-making. For thatto happen, operators need to put inplace the right information managementsystems and mechanisms.191 Theyneed to implement an IT-based assetmanagement system to integratethe different datasets, plan and timeinterventions, trigger actions, andmonitor and evaluate performance.Such an asset management systemserves three purposes (see Figure 32for examples):
– Real-time and transparent status reports. A coherent dashboard ofmaintenance needs should supportfunding calls, ease the budgeting
process, build consensus acrosssiloed departments and facilitatecommunication with externalstakeholders.
– Ex-ante modelling. The systemshould help analysts to model andpredict the costs and impacts ofdifferent planned O&M interventions,and thereby help to refine decision-making.
– Ex-post analytics. The systemshould provide evidence-basedassessments of O&M interventions,which can help to optimize qualityand expenditures over time.
Some considerations to bear in mind:
– The asset management systemshould integrate a variety ofmodules, including fixed-assetaccounting, inventory management,condition assessment, financialforecasts, work management,quality management and regulatory
compliance. Many systems alsoinclude a geographic informationsystem (GIS) component, which canhelp with maintenance schedulingand staff deployment for dispersedassets. For example, Swiss FederalRailways has complementedits fixed asset database with ageographical information system,and the asset records of RandWater, a water utility in South Africa,are all linked to GIS data.
– One key challenge for assetmanagement systems today isto manage different standardsacross an infrastructure system, asover time, assets have been builtaccording to changing norms andcodes. Not only do these assetsneed different operating standardsand maintenance routines, but alsothe user perception regarding thosedifferent service levels needs to bemanaged.
– Any asset management systemwill only be as good as theinformation it contains; hence, theneed for adequate asset surveysand maintenance records, dataentry protocols and interfacesto other databases, such as theaccounting system. When theMassachusetts Water Resources Authority introduced a computerizedmaintenance management system,an initial audit concluded that thedata quality needed improvements,
and recommended new proceduresand links to other software.
One case in point is Jordan’s As-Samrawastewater treatment plant, whichuses a computerized maintenancemanagement system and exemplifiesseveral of the benefits. It integratesand shares information across differentfunctions, including maintenanceactivities, spare-parts inventory andprocurement. In addition, it makespredictive maintenance possible by
monitoring the asset’s condition,sets KPIs for major equipment andcompares the actual availability andcondition against targets.

7/25/2019 Strategic Infrastructure Steps Report 2014
http://slidepdf.com/reader/full/strategic-infrastructure-steps-report-2014 67/88
67Steps to Operate and Maintain Infrastructure Efficiently and Effectively
In addition to information managementsystems, operators should also developguidance and tools for improvingO&M decision-making (e.g. operationsmanuals and maintenance guidelines;methodological guidelines for life cyclecost analysis and demand forecasting;virtualization, simulation and modellingtools such as the road managementsoftware HDM-4). (See the case study
in Box 8.)
Figure 32: Functionality of Asset Management Systems
Note: DoT = Department of Transport
Source: “Best of the Best: Americas Transportation Awards”. US Department of Transportation: Federal Department of Highway Administration, http://www.fhwa.dot.gov/publications/
publicroads/12marapr/03.cfm, 2012.
Box 8: Case Study – Leighton
Contractors, North-West Transit Way, Australia192
In the north-west of Sydney, with itsrapidly growing population, commutersneeded a new public transport systemfor rapid and reliable access to the citycentre. Leighton Contractors won a10-year concession to design, build,
operate and maintain the bus-only,21-km route with 30 bus stations. Thecontract specifies strict performanceand maintenance standards, and theroad has to be in good condition whentransferred at the end of the contract.
To fulfil those requirements andmanage the concession efficiently,the contractor analysed historical data(based on monitoring the roadway’scondition at one-metre intervals),identified and excluded from theanalysis all irrelevant external factors,established a performance model anddeterioration rates for the paving, andapplied the Highway Development
and Management (HDM4) system, adecision-making tool for optimal wholelife-cycle management. The HDM4tool was beneficial, as it can predictroad network and paving performance,road-user effects, and can producea schedule of optimum roadwaymaintenance as well as plan overallfunding requirements.
Leighton Contractors was then in aposition to predict the performanceand condition of the paving, anddraw up a life cycle plan that struck abalance between capex and opex, andoptimized the maintenance strategies. As a result, overall cost savings of 15%were achieved. The company also undertook scenarioanalysis to evaluate different levelsof service and the associated costimplications. A whole-of-life solutionemerged that provides a higher level ofservice (the road is now 99% available)while still complying with the contractedmaintenance requirements.
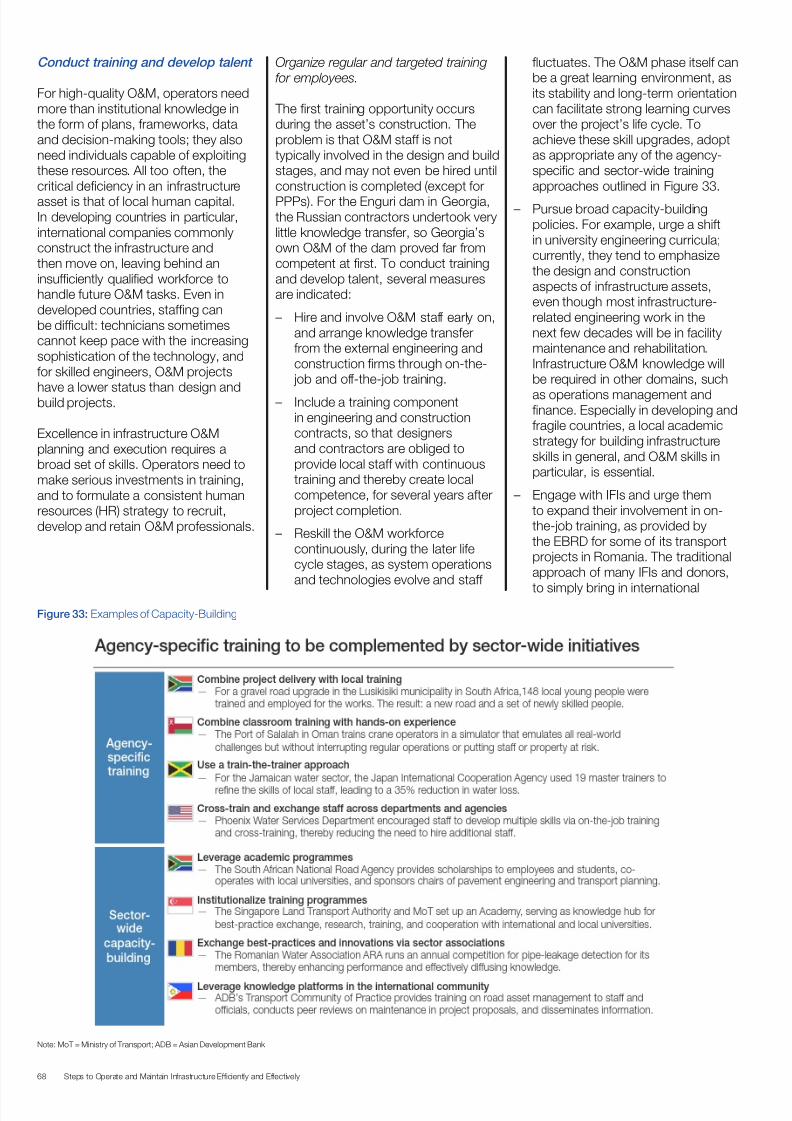
7/25/2019 Strategic Infrastructure Steps Report 2014
http://slidepdf.com/reader/full/strategic-infrastructure-steps-report-2014 68/88
68 Steps to Operate and Maintain Infrastructure Efficiently and Effectively
Conduct training and develop talent
For high-quality O&M, operators needmore than institutional knowledge inthe form of plans, frameworks, dataand decision-making tools; they alsoneed individuals capable of exploitingthese resources. All too often, thecritical deficiency in an infrastructureasset is that of local human capital.In developing countries in particular,international companies commonlyconstruct the infrastructure andthen move on, leaving behind aninsufficiently qualified workforce tohandle future O&M tasks. Even indeveloped countries, staffing canbe difficult: technicians sometimescannot keep pace with the increasingsophistication of the technology, andfor skilled engineers, O&M projects
have a lower status than design andbuild projects.
Excellence in infrastructure O&Mplanning and execution requires abroad set of skills. Operators need tomake serious investments in training,and to formulate a consistent humanresources (HR) strategy to recruit,develop and retain O&M professionals.
Organize regular and targeted trainingfor employees.
The first training opportunity occursduring the asset’s construction. Theproblem is that O&M staff is nottypically involved in the design and buildstages, and may not even be hired untilconstruction is completed (except forPPPs). For the Enguri dam in Georgia,the Russian contractors undertook verylittle knowledge transfer, so Georgia’sown O&M of the dam proved far fromcompetent at first. To conduct trainingand develop talent, several measuresare indicated:
– Hire and involve O&M staff early on,and arrange knowledge transferfrom the external engineering andconstruction firms through on-the- job and off-the-job training.
– Include a training componentin engineering and constructioncontracts, so that designersand contractors are obliged toprovide local staff with continuoustraining and thereby create localcompetence, for several years afterproject completion.
– Reskill the O&M workforcecontinuously, during the later lifecycle stages, as system operationsand technologies evolve and staff
fluctuates. The O&M phase itself canbe a great learning environment, asits stability and long-term orientationcan facilitate strong learning curvesover the project’s life cycle. Toachieve these skill upgrades, adoptas appropriate any of the agency-specific and sector-wide trainingapproaches outlined in Figure 33.
– Pursue broad capacity-buildingpolicies. For example, urge a shiftin university engineering curricula;currently, they tend to emphasizethe design and constructionaspects of infrastructure assets,even though most infrastructure-related engineering work in thenext few decades will be in facilitymaintenance and rehabilitation.Infrastructure O&M knowledge willbe required in other domains, such
as operations management andfinance. Especially in developing andfragile countries, a local academicstrategy for building infrastructureskills in general, and O&M skills inparticular, is essential.
– Engage with IFIs and urge themto expand their involvement in on-the-job training, as provided bythe EBRD for some of its transportprojects in Romania. The traditionalapproach of many IFIs and donors,
to simply bring in international
Figure 33: Examples of Capacity-Building
Note: MoT = Ministry of Transport; ADB = Asian Development Bank
7/25/2019 Strategic Infrastructure Steps Report 2014
http://slidepdf.com/reader/full/strategic-infrastructure-steps-report-2014 69/88
69Steps to Operate and Maintain Infrastructure Efficiently and Effectively
experts to provide technicalassistance, can have a distortingeffect by demoralizing agency staff.
Actively engage in talent management and development.
When building capabilities, operatorsshould look beyond training, and take alonger-term, strategic approach throughtalent management and development. They need to adopt vigorous policiesin three key areas: HR planning,recruitment and retention, and peopledevelopment. Details for each includethe following:
– HR planning. As a result of thedemographic shift in developedcountries, many utilities facethe prospect of a dearth ofengineers and other skilled labour.
In response, several operatorshave initiated strategic workforceplanning by splitting their labourforce into different skill categories,calculating the potential shortfallin each one, and developing pre-emptive measures such as newrecruiting and retention strategies. The Department of Transport in Victoria, Australia, compiled acore-capabilities report identifyingrequired skills; established a list of146 vacancy-sensitive jobs with thecurrent job occupants and potentialsuccessors; introduced a careerplanning and development tool;launched a two-year programme toadvance high-potential employeesinto leadership positions; andincreased the use of mentoring,coaching and mobility schemes.193
– Recruitment and retention.Infrastructure operators willincreasingly have to draw froma limited number of engineering
graduates and unfamiliar recruitingpools. In what is traditionallya bricks-and-mortar industry,they now have to recruit IT andtechnology specialists as well.Some operators are engaging thechallenge head-on. The HamburgPort Authority in Germany nowhas a dedicated chief informationofficer with a 60-member IT teamto facilitate its transition to a smartport and realize its ambition to treblecontainer numbers by 2025 – andall within its current, confined portarea. More broadly, Chile has takena long-term approach to increasingthe appeal of public service jobs ingeneral by sending talented recruits
on university courses abroad,and by offering them competitivesalaries.
– People development . Singapore’spublic services lay out generalistor specialist career paths for futureleaders, offer customized trainingand university scholarships to
develop their skills, and provideattractive performance-basedcompensation packages.194
2.3 Reformgovernance
Many public infrastructure agencieshave outmoded governancestructures and procedures. Theyare still subject to political influence
and weighed down by bureaucracy– characteristics that militate againstinstitutional independence, efficiencyand accountability. In fact, many publicagencies assume both policy andimplementation roles, a process thatconflicts with the good governanceprinciple, namely the separation ofcontrol and management.
Corporatize and professionalizepublic agencies
In such cases, institutional public-sector reform is strongly advisable,either through corporatization orprofessionalization of the agenciesmanaging infrastructure assets.Corporatization is the process bywhich a public-sector department istransformed into a distinct legal entity(with the government as owner), whoseassets, finances, and functions aresegregated from other governmentoperations. Corporatization aims tocapture the advantages of a privatelyrun company, including productivity,streamlined processes, commercialorientation and financial sustainability,while remaining accountable to thepublic and serving the public interest.Professionalization likewise involvesadopting many aspects of privatecompanies, but without changing theagency’s legal status.
Corporatization achieves its goals bygiving the former agency the following:
– Clear incentives and targets forimproved performance
– Greater organizational autonomy fordecision-making, compared with its
limited independence as part of agovernment department
– A more rigorous system ofoversight, by clarifying the role of thegovernment as owner and controller,and defining priorities for the board
– External accountability for achievingits targets
Corporatization also enables a moreflexible system of shared ownershipbetween different government levelsand departments, and allows for easiertransfer of ownership in the future,including privatization.
When pursuing corporatization,governments should consider thefollowing actions:
Establish a separate legal entity and sound corporate governance.
– Specify strategic direction andclear objectives, as well as clarifyroles and responsibilities. Spell outthe limited, arm’s-length natureof departmental control over thenewly corporatized entity. And,avoid duplication of activity betweenthe new organization and thedepartment sponsoring it.
– Ensure the organization’s managerialindependence by granting itconsiderable freedom of action. The entity will be successful to theextent that it keeps politics out ofits policies, and maintains soundcorporate decision and planninghorizons of more than one electioncycle.
– Retain some control. The new entityhas to stay externally accountable(to the government, or rather to theelectorate); it needs incentives and
targets to reinforce its performancegoals, while at the same time notbeing micromanaged. The best wayto bring that about is by contract– whether through a licence,performance agreement, service-delivery agreement or shareholders’agreement. The contract shouldcontain the agreed obligations ofeach party (in particular, specificfinancial and operational targets setby the government departments);the reporting and monitoringrequirements; and any incentives,penalties, ministerial interventionand approval rights, such as forthe business and financial plan.For example, the Sydney Water
7/25/2019 Strategic Infrastructure Steps Report 2014
http://slidepdf.com/reader/full/strategic-infrastructure-steps-report-2014 70/88
70 Steps to Operate and Maintain Infrastructure Efficiently and Effectively
Act allows the regulator to demandremedial action, impose monetarysanctions and even terminate thelicence for the corporatized entity.
– Establish an independent board.It should be sufficiently qualified,and should act independentlyof the controlling shareholder or
department to ensure the entity’slong-term financial sustainability.In South Africa, JohannesburgWater’s board members cannot bemembers of the City Council. Andfor PUB, Singapore’s national wateragency, members of the board aredeliberately selected to represent abroad spectrum of stakeholders.195
Introduce modern financial management and accounting practices.
– Set clear financial targets andpolicies related to cost recovery,profitability, dividends and subsidies.
– Give the new entity full controlof financial matters, includinginvestment, financing and pricing(within the regulatory limits), toensure financial sustainability.In contrast to a governmentdepartment, which often ismanaged as a cost centre andso has little incentive for superiorperformance, a corporatized entityis managed as a profit centre withits own revenue streams. For suchan entity, the key source of fundingis no longer government transfersbut customer revenues generatedthrough services, meaning itwill have strong cost, revenue,investment and service-qualityincentives, and will treat consumersaccordingly.
– Implement dual-entry corporateaccounting, and decision-making
frameworks based on net presentvalue, to ensure an unbiased budgetallocation for construction andmaintenance based on a whole life-cycle view.
– Set up an adequate and transparentfinancial reporting system to enableinternal controls through the board,external independent audits andeasily accessible information for thegeneral public.
Institute customer and commercial
orientation.
– Commit to the customer via acustomer charter or a formalcustomer contract. The National
Water & Sewerage Corporation ofUganda has a customer charter thatspecifies service standards. Anotherexample is the operating licencefor Sydney Water, which includesschedules for customer service thatset out the rights and obligationsof both the corporation and thecustomer.
– Monitor and report on customersatisfaction targets. Sydney Water isrequired by the terms of its licenceto accurately measure, record andannually report its performanceagainst specified customer serviceindicators to the regulator.
Establish data-driven management, and nominate capable leadership.
– Establish a transparent framework
for setting targets, monitoringperformance and prioritizingmeasures. For example, theMunicipal Finance Management Actof South Africa requires productionof a Balanced Scorecard forJohannesburg Water.
– Motivate staff through aremuneration scheme, careerprogression and personalperformance assessments. In 2004,Singapore’s PUB moved fromtenure-based fixed incrementalpay increases to a system ofperformance-based or merit-basedpay increases.
– Base leadership nominationsor appointments on technicalexpertise, not political connections,to avoid “revolving doors”.Even after entities have beencorporatized, little will change unlesschange comes from the top. TheMassachusetts Port Authority, forexample, removed controversial
political appointees and installedan independent chief executiveofficer (CEO) unburdened by politicalobligations. He established clearcriteria for decision-making, in linewith strategic business objectives;assigned accountability for cashflows to business unit managers;revamped hiring procedures, staffevaluation and bonus principles;and introduced a system forreporting political pressure to theboard. In combination, these varied
measures finally reduced politicalinterference.196
A good example of corporatization’sbenefits is Aqaba Water in Jordan.
The effects of corporatization includeda sharper commercial orientation,leading to a 30% increase in sales;additional investment, such as renewalof 90% of the network; performanceimprovements; increased training foremployees; and enhanced customerservice including a 24/7, one-stopservice centre, and quicker response
time for complaints.197
Corporatization is often a first step tobroader reforms, such as privatizationand competition. (See Figure 34 foran example from Singapore, and referto the following discussion for moredetails.)
Foster cooperation between publicagencies
Reforms of the institutional frameworkshould extend beyond individualagencies, and should also addressthe need for more coordination andcooperation between agencies.
Coordinate across assets and different levels of national, regional and local government.
In many countries, responsibilities foroperating and maintaining infrastructureare fragmented across different levelsof government and jurisdictionalboundaries. Individual regions or evenmunicipalities might be assignedresponsibility for a large share of theinfrastructure, and might well give theirregional interest priority over nationalinterests.
– Develop metropolitan or regionalinfrastructure plans to coordinatethe O&M and rehabilitation plans.For instance, in a regional airportsystem as in Paris and London,each airport could be assigned
a particular role – catering to full-service, low-cost or cargo carriers– to enable specialization andeconomies of scale.
– Establish a designated coordinatinginstitution, and define clear rolesand responsibilities for all otheragencies involved. The EBRDhas coordinated changes of tariffstructures and public servicecontracts by taking an integrated,multicity approach across 20 cities
in Tajikistan.– If appropriate, enter into
performance contracts with regionalor municipal subsidiaries to holdthem more accountable, increase
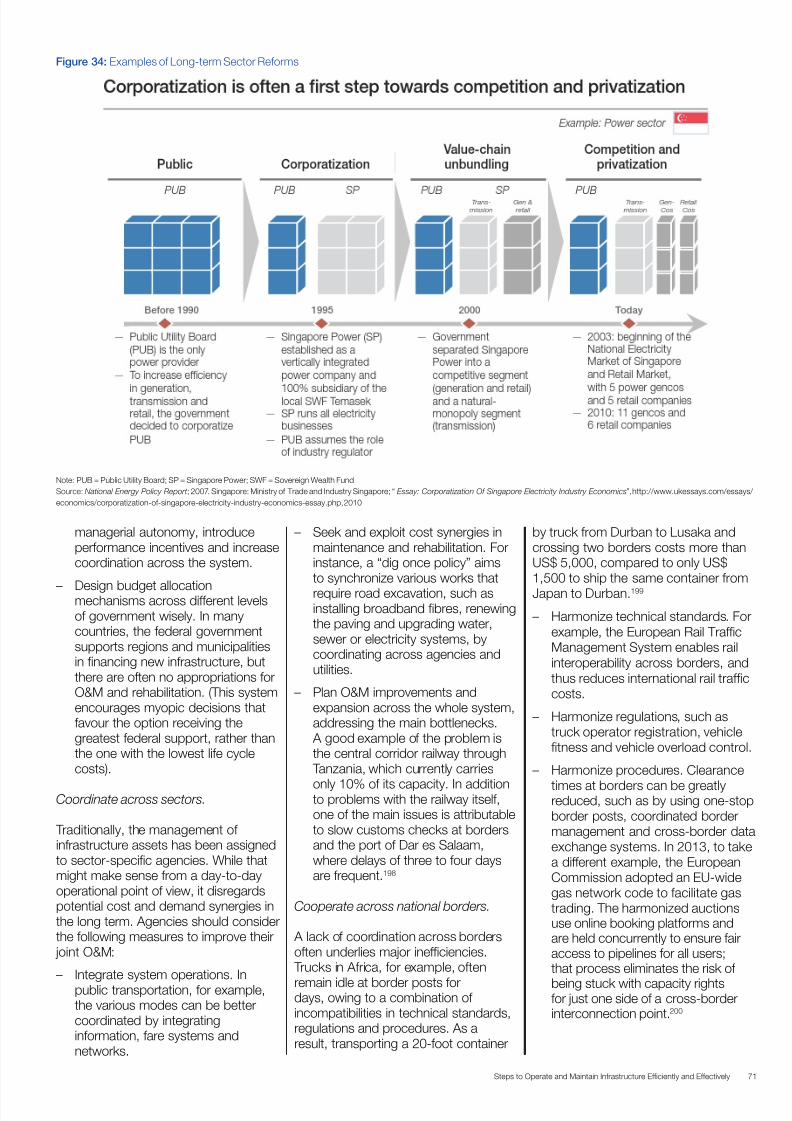
7/25/2019 Strategic Infrastructure Steps Report 2014
http://slidepdf.com/reader/full/strategic-infrastructure-steps-report-2014 71/88
71Steps to Operate and Maintain Infrastructure Efficiently and Effectively
Figure 34: Examples of Long-term Sector Reforms
Note: PUB = Public Utility Board; SP = Singapore Power; SWF = Sovereign Wealth Fund
Source: National Energy Policy Report ; 2007. Singapore: Ministry of Trade and Industry Singapore; “Essay: Corporatization Of Singapore Electricity Industry Economics”, http://www.ukessays.com/essays/
economics/corporatization-of-singapore-electricity-industry-economics-essay.php, 2010
managerial autonomy, introduceperformance incentives and increasecoordination across the system.
– Design budget allocationmechanisms across different levelsof government wisely. In manycountries, the federal governmentsupports regions and municipalitiesin financing new infrastructure, butthere are often no appropriations forO&M and rehabilitation. (This systemencourages myopic decisions thatfavour the option receiving thegreatest federal support, rather thanthe one with the lowest life cyclecosts).
Coordinate across sectors.
Traditionally, the management ofinfrastructure assets has been assignedto sector-specific agencies. While thatmight make sense from a day-to-dayoperational point of view, it disregardspotential cost and demand synergies inthe long term. Agencies should considerthe following measures to improve their joint O&M:
– Integrate system operations. Inpublic transportation, for example,the various modes can be bettercoordinated by integratinginformation, fare systems andnetworks.
– Seek and exploit cost synergies inmaintenance and rehabilitation. Forinstance, a “dig once policy” aimsto synchronize various works that
require road excavation, such asinstalling broadband fibres, renewingthe paving and upgrading water,sewer or electricity systems, bycoordinating across agencies andutilities.
– Plan O&M improvements andexpansion across the whole system,addressing the main bottlenecks. A good example of the problem isthe central corridor railway through Tanzania, which currently carries
only 10% of its capacity. In additionto problems with the railway itself,one of the main issues is attributableto slow customs checks at bordersand the port of Dar es Salaam,where delays of three to four daysare frequent.198
Cooperate across national borders.
A lack of coordination across bordersoften underlies major inefficiencies. Trucks in Africa, for example, often
remain idle at border posts fordays, owing to a combination ofincompatibilities in technical standards,regulations and procedures. As aresult, transporting a 20-foot container
by truck from Durban to Lusaka andcrossing two borders costs more thanUS$ 5,000, compared to only US$1,500 to ship the same container from
Japan to Durban.199
– Harmonize technical standards. Forexample, the European Rail TrafficManagement System enables railinteroperability across borders, andthus reduces international rail trafficcosts.
– Harmonize regulations, such astruck operator registration, vehiclefitness and vehicle overload control.
– Harmonize procedures. Clearance
times at borders can be greatlyreduced, such as by using one-stopborder posts, coordinated bordermanagement and cross-border dataexchange systems. In 2013, to takea different example, the EuropeanCommission adopted an EU-widegas network code to facilitate gastrading. The harmonized auctionsuse online booking platforms andare held concurrently to ensure fairaccess to pipelines for all users;that process eliminates the risk of
being stuck with capacity rightsfor just one side of a cross-borderinterconnection point.200

7/25/2019 Strategic Infrastructure Steps Report 2014
http://slidepdf.com/reader/full/strategic-infrastructure-steps-report-2014 72/88
72 Steps to Operate and Maintain Infrastructure Efficiently and Effectively
In some cases, of course, suchcoordination and cooperation might stillprove insufficient, and an integrationof activities, and thus mergers, will beneeded to optimize joint operations.
Merge agencies to optimize scale and scope.
In some countries, infrastructure ischaracterized by small and potentiallyinefficient management units, owingto a fragmented municipal structureor a complex system of local, regionaland federal assets. Of the 150,000public water supply systems in the US,more than 93% are very small, eachserving fewer than 3,300 people.201 Consolidating operators is thus oneway of enhancing the ratio of overheadto operations and achieving an efficientscale and scope. Mergers are most
beneficial when the assets in question arehomogeneous; the economies of scaleand scope are large; the network effectsare pronounced; and some individualparts of the businesses are unprofitableand reliant on cross-subsidies. However,demerging of agencies may be indicatedin some cases when increasingcomplexity outweighs the benefits ofscale and scope.
– Optimize scale. In Romania, localwater utilities were consolidated on
a regional level to attain the requiredscale for operating efficiently; forinstance, suppliers from severaltowns and municipalities around Clujwere merged to form Apa Somes.202
– Optimize scope. By consolidatingseven separate local agenciesinto one multimodal transportationagency, the Orange County Transportation Authority in Californiasecured efficiency gains andeliminated duplicate functions. Ona national level, both Sweden and
Finland have combined their roadand railway administrations into asingle agency in each case.203 Andon an even broader scale, ninecities with a combined 42 millioninhabitants in China’s Pearl RiverDelta are considering merging intoone megacity to provide moreseamless transportation.204
– Optimize scale and scope acrossdifferent sectors and regions. Forexample, the Port Authority of New York and New Jersey (US) operatesfive airports, two tunnels, fourbridges, three bus terminals andfive port terminals across the twostates.205
Consider private-sector participationand competition
Private-sector participation can improveO&M by tapping the private sector’sfinancial resources, as well as its skills inoperating and maintaining infrastructureefficiently and effectively on a wholelife-cycle cost basis. Many benefits tend
to emerge, in efficiency and quality ofoperations, as well as in revenue andservice innovation. For instance, inwater treatment, savings of more than30% in operating costs have beenrecorded in some major US cities, suchas Indianapolis and Milwaukee.206
The present time offers a goodopportunity to sell brownfieldinfrastructure assets on favourableterms. Many government budgetsare still constrained in the wake of the
global financial crisis, while institutionalinvestors have large amounts of privatecapital at their disposal. Encouragedby the current low-interest-rateenvironment, these investors, notablypension funds and insurance firms,are seeking low-risk, long-term andinflation-hedged investments such asinfrastructure. They are particularlyinterested in the O&M phase, asthe main risks have already beenresolved; namely, the most difficult tomanage, early-life-cycle risks – design,
construction and ramp-up of demand.
Currently, there is considerable drypowder available for infrastructureinvestment in OECD countries. The 145unlisted infrastructure funds collectivelyreached an all-time high in October2013, seeking global aggregate capitalof US$ 97 billion. Yet recently, thenumber of deals has been flat relativeto the past five years, suggesting a“money chasing deals” phenomenon.Investors are paying high prices –witness the recent privatization of ANA Aeroportos de Portugal – and thatmeans a potential concession or sell-off opportunity for the public sector,enabling it to recycle capital into newinfrastructure assets, to pay down debtor to expand social services.
Governments need to proceed withcaution, however – for their own sakeand for that of the users. By simplyaiming to maximize the proceeds ofprivatization (“monetization deals”), agovernment could be consigning itscitizens to disproportionately high usercharges, and restricting its own flexibilityfor the long term.
Review the private participation optionsthoroughly.
– Clarify the policy objectives. On theone hand, there might be an interestin safeguarding public-sector controlof the asset’s operations and futuredevelopment; on the other, thereare the economic objectives of
improved operations and investmentdecisions. These competingconsiderations will become part ofthe calculation when deciding whichoption to favour.
– Assess stakeholder readiness of theprivate sector (whether sufficientcompetition and skills are present),civil society (how acceptable privateparticipation will be) and governmentinstitutions (what their oversight andregulatory capabilities are).
– Consider the various forms ofprivate-sector participation, includingservice- or performance-basedcontracts, PPPs and privatization.(See Figure 35 and the Phase IIreport of this initiative.)
– Scrutinize any proposed privateinvolvement, by means of a rigorousvalue-for-money analysis, todetermine whether it really wouldbe the most beneficial option forsociety (chapter 1.6). Private-sectorparticipation has challenges of itsown, related to higher costs offinance, regulatory failures, long-terminflexibility, labour transition issuesand disregard of certain publicobjectives.
At times, merely the spectre ofprivatization will motivate public utilitiesto improve O&M performance, as wasthe case for many US public waterutility systems. And public agenciescan learn from their interaction withprivate-sector operators. For example,the Central Highlands Region Water Authority in Victoria, Australia was ableto acquire new knowledge and skillsfrom a PPP for a water treatment plant,and duly improved water quality inother water distribution areas.207 But ifprivate participation is the way forward,governments should make properprovision for it beforehand.
Prepare private participation diligently.
– Engage in a restructuring or
optimization programme prior toinitiating the privatization process, toboost valuations and sell assets at agood price.
– Put in place the institutional and
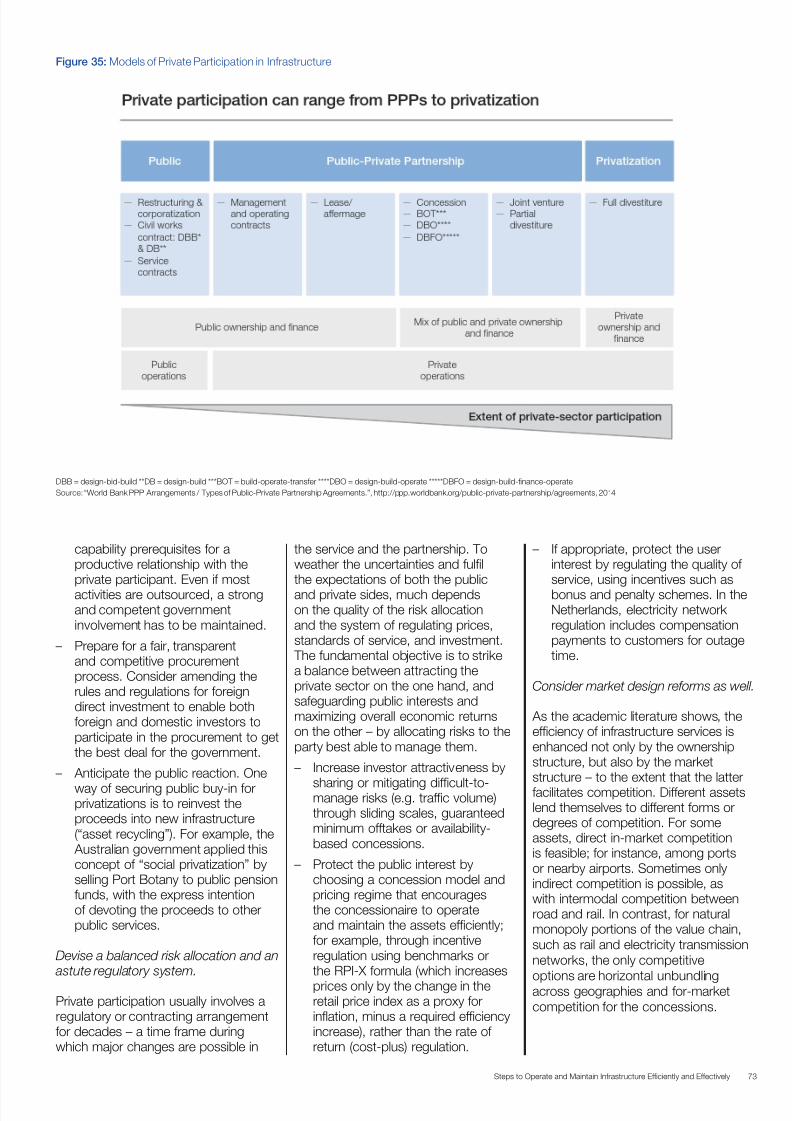
7/25/2019 Strategic Infrastructure Steps Report 2014
http://slidepdf.com/reader/full/strategic-infrastructure-steps-report-2014 73/88
73Steps to Operate and Maintain Infrastructure Efficiently and Effectively
capability prerequisites for aproductive relationship with theprivate participant. Even if mostactivities are outsourced, a strongand competent governmentinvolvement has to be maintained.
– Prepare for a fair, transparentand competitive procurementprocess. Consider amending therules and regulations for foreigndirect investment to enable bothforeign and domestic investors toparticipate in the procurement to getthe best deal for the government.
– Anticipate the public reaction. One
way of securing public buy-in forprivatizations is to reinvest theproceeds into new infrastructure(“asset recycling”). For example, the Australian government applied thisconcept of “social privatization” byselling Port Botany to public pensionfunds, with the express intentionof devoting the proceeds to otherpublic services.
Devise a balanced risk allocation and an astute regulatory system.
Private participation usually involves aregulatory or contracting arrangementfor decades – a time frame duringwhich major changes are possible in
the service and the partnership. Toweather the uncertainties and fulfilthe expectations of both the publicand private sides, much dependson the quality of the risk allocationand the system of regulating prices,standards of service, and investment. The fundamental objective is to strikea balance between attracting theprivate sector on the one hand, andsafeguarding public interests andmaximizing overall economic returnson the other – by allocating risks to theparty best able to manage them.
– Increase investor attractiveness by
sharing or mitigating difficult-to-manage risks (e.g. traffic volume)through sliding scales, guaranteedminimum offtakes or availability-based concessions.
– Protect the public interest bychoosing a concession model andpricing regime that encouragesthe concessionaire to operateand maintain the assets efficiently;for example, through incentiveregulation using benchmarks orthe RPI-X formula (which increases
prices only by the change in theretail price index as a proxy forinflation, minus a required efficiencyincrease), rather than the rate ofreturn (cost-plus) regulation.
Figure 35: Models of Private Participation in Infrastructure
DBB = design-bid-build **DB = design-build ***BOT = build-operate-transfer ****DBO = design-build-operate *****DBFO = design-build-finance-operate
Source: “World Bank PPP Arrangements / Types of Public-Private Partnership Agreements.”, http://ppp.worldbank.org/public-private-partnership/agreements, 2014
– If appropriate, protect the userinterest by regulating the quality ofservice, using incentives such asbonus and penalty schemes. In theNetherlands, electricity networkregulation includes compensationpayments to customers for outagetime.
Consider market design reforms as well.
As the academic literature shows, theefficiency of infrastructure services isenhanced not only by the ownershipstructure, but also by the marketstructure – to the extent that the latterfacilitates competition. Different assetslend themselves to different forms ordegrees of competition. For someassets, direct in-market competitionis feasible; for instance, among portsor nearby airports. Sometimes onlyindirect competition is possible, aswith intermodal competition betweenroad and rail. In contrast, for naturalmonopoly portions of the value chain,such as rail and electricity transmissionnetworks, the only competitive
options are horizontal unbundlingacross geographies and for-marketcompetition for the concessions.

7/25/2019 Strategic Infrastructure Steps Report 2014
http://slidepdf.com/reader/full/strategic-infrastructure-steps-report-2014 74/88
74 Steps to Operate and Maintain Infrastructure Efficiently and Effectively
3. The Way Forward
To neglect O&M is an easy option, but afalse economy. Maintaining an existingasset is nowhere near as glamorous asbuilding a new infrastructure asset; thepayback in positive public perception
and political reward is negligible.Maintenance is thus easily cut, anddangerously so. “Neglect is patient, buteventually it does lose its temper” – andwhen that happens, the consequencescan be very costly.
Presumably, policy-makers havealways been aware of the dangers,but have frequently failed to translatethat awareness into action. Theyare now finding that, after decadesof operational mismanagement andunderinvestment in maintenance, theirpolicies have come back to hauntthem. In many countries, a hugebacklog of maintenance work hasaccumulated; it cannot be delayedwithout serious danger to the continuityof vital infrastructure services, and itis going to cost far more than timelymaintenance would have.
O&M is now becoming a strategicissue on the agenda of many nations.
Their competitive edge is at stake.Even in this digital age, physicalinfrastructure remains a foundationof competitiveness, just as much aseducation is. Company executives,trade groups and even EU officialswarn that Europe will fall further behindunless recent cuts in infrastructurespending are reversed.208 In the US,repeated presidential comments about America’s “crumbling” highways havehighlighted the issue, as has formerSecretary of Transportation Raymond
LaHood’s remark that “America is onebig pothole”.209
Time for action and investment
The moment to invest in O&M is now.First, the conditions are right:
– When combined, two factors – highunemployment and a sluggisheconomic recovery on the onehand, and the large economicmultiplier effects associated withinfrastructure on the other – makea compelling case for investingnow, as a means of stimulating theeconomy and avoiding a legacy ofdeferred maintenance for the nextgeneration.
– The increasing pressure on publicbudgets should be a spur tooperational excellence. The solutionto infrastructure problems can nolonger be just more funding; it alsoneeds to involve greater efficiencyand effectiveness, in keeping withthe new paradigm: “More with less”.
Second, the key building blocks arealready within reach. As opportunitiesgo, successful O&M is a very realisticone:
– It is doable. Many examples exist of
good practice and lessons learned(as discussed throughout thisreport).
– It is affordable. The O&Minterventions are hardly expensivewhen compared with capital-intensive construction.
– It is backed by numeroustechnological and managerialinnovations. While many newinnovations are already available,
many more are in the pipeline; but,what is also needed is to apply thecurrent innovations on a broaderscale.
Only the political will is missing. So,what is needed is a wake-up callfor society and the will to reform thecurrent infrastructure system.
O&M is a wide-ranging responsibility
It concerns developed and developingcountries, national and stategovernments, cities and municipalities,and private-sector infrastructureoperators. Developed countries areunder particularly heavy pressure toenhance O&M, as a higher proportionof their infrastructure stock is ageing.Developing countries need to addressO&M issues of their own: theircurrent operations are often seriouslyinefficient, and the rapid build-up oftheir infrastructure assets entails acorresponding surge in necessarymaintenance work in the near future. And in fragile states, O&M is crucialfor sustaining essential infrastructureservices to keep the economy andsociety working.
Cities, too, will have to upgradetheir O&M, in the effort to stretchtheir infrastructure services,
increase efficiency and reduce theirenvironmental footprint. Greaterdemands are being made on existinginfrastructure resources, as cities movefrom the traditional model of urbansprawl towards more concentratedgrowth and greater density.
As for private infrastructure operators,they have a double inducementto pursue O&M excellence: risingregulatory pressure (e.g. the move fromcost-plus to incentive or benchmark
regulation) and the pressure to createshareholder value.
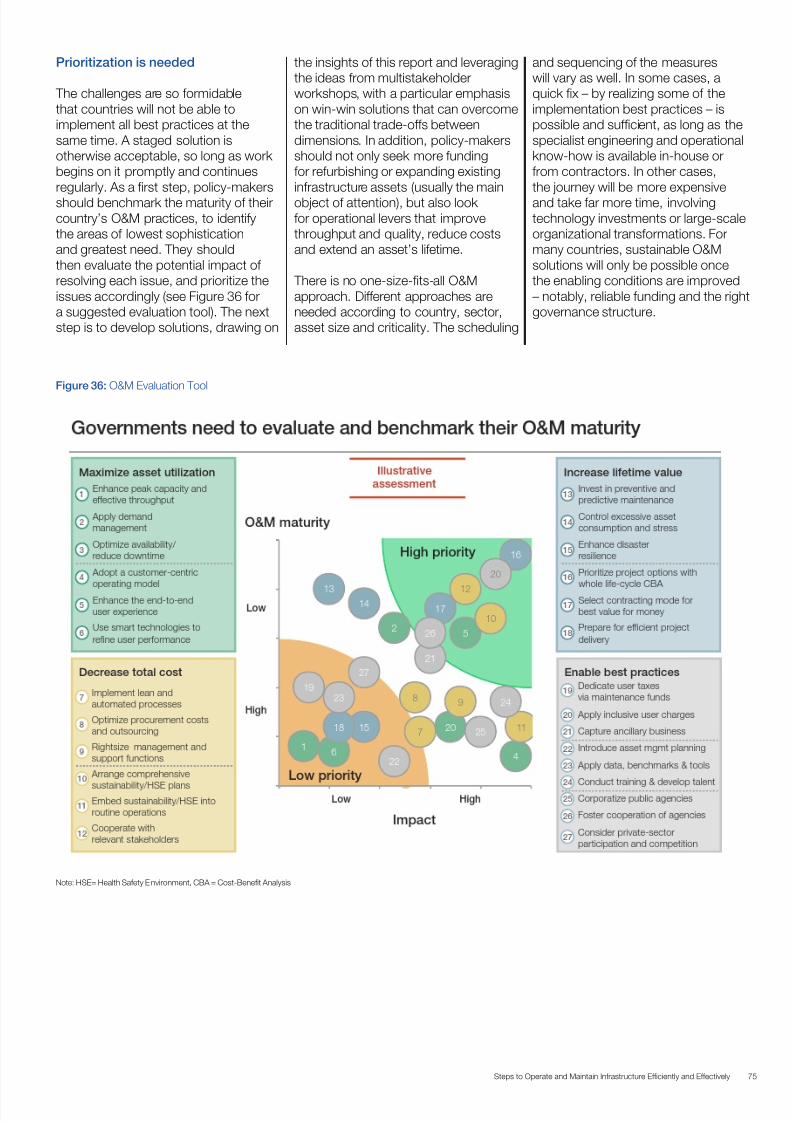
7/25/2019 Strategic Infrastructure Steps Report 2014
http://slidepdf.com/reader/full/strategic-infrastructure-steps-report-2014 75/88
75Steps to Operate and Maintain Infrastructure Efficiently and Effectively
Prioritization is needed
The challenges are so formidablethat countries will not be able toimplement all best practices at thesame time. A staged solution isotherwise acceptable, so long as workbegins on it promptly and continuesregularly. As a first step, policy-makersshould benchmark the maturity of theircountry’s O&M practices, to identifythe areas of lowest sophisticationand greatest need. They shouldthen evaluate the potential impact ofresolving each issue, and prioritize theissues accordingly (see Figure 36 fora suggested evaluation tool). The nextstep is to develop solutions, drawing on
Figure 36: O&M Evaluation Tool
Note: HSE= Health Safety E nvironment, CBA = Cost-Benefit Analysis
the insights of this report and leveragingthe ideas from multistakeholderworkshops, with a particular emphasison win-win solutions that can overcomethe traditional trade-offs betweendimensions. In addition, policy-makersshould not only seek more fundingfor refurbishing or expanding existinginfrastructure assets (usually the mainobject of attention), but also lookfor operational levers that improvethroughput and quality, reduce costsand extend an asset’s lifetime.
There is no one-size-fits-all O&Mapproach. Different approaches areneeded according to country, sector,asset size and criticality. The scheduling
and sequencing of the measureswill vary as well. In some cases, aquick fix – by realizing some of theimplementation best practices – ispossible and sufficient, as long as thespecialist engineering and operationalknow-how is available in-house orfrom contractors. In other cases,the journey will be more expensiveand take far more time, involvingtechnology investments or large-scaleorganizational transformations. Formany countries, sustainable O&Msolutions will only be possible oncethe enabling conditions are improved– notably, reliable funding and the rightgovernance structure.
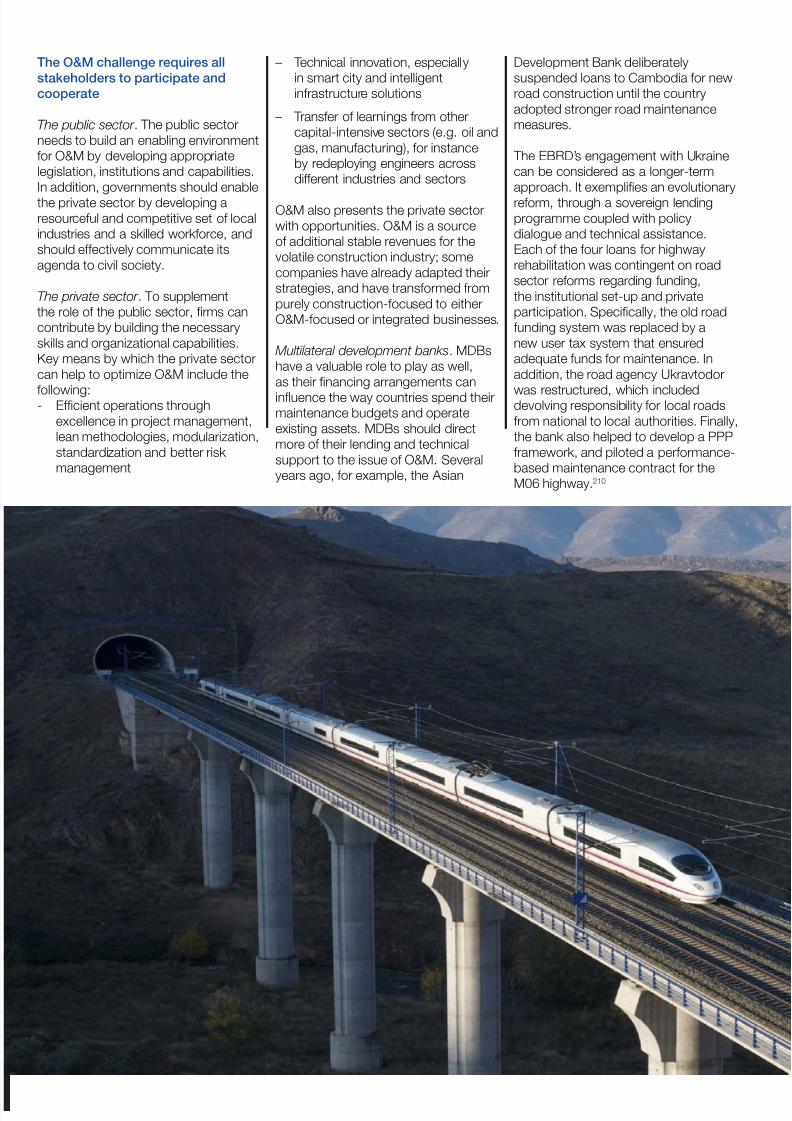
7/25/2019 Strategic Infrastructure Steps Report 2014
http://slidepdf.com/reader/full/strategic-infrastructure-steps-report-2014 76/88
76 Steps to Operate and Maintain Infrastructure Efficiently and Effectively
The O&M challenge requires all
stakeholders to participate and
cooperate
The public sector . The public sectorneeds to build an enabling environmentfor O&M by developing appropriatelegislation, institutions and capabilities.In addition, governments should enablethe private sector by developing aresourceful and competitive set of localindustries and a skilled workforce, andshould effectively communicate itsagenda to civil society.
The private sector . To supplementthe role of the public sector, firms cancontribute by building the necessaryskills and organizational capabilities.Key means by which the private sectorcan help to optimize O&M include the
following:- Efficient operations throughexcellence in project management,lean methodologies, modularization,standardization and better riskmanagement
– Technical innovation, especiallyin smart city and intelligentinfrastructure solutions
– Transfer of learnings from othercapital-intensive sectors (e.g. oil andgas, manufacturing), for instanceby redeploying engineers acrossdifferent industries and sectors
O&M also presents the private sectorwith opportunities. O&M is a sourceof additional stable revenues for thevolatile construction industry; somecompanies have already adapted theirstrategies, and have transformed frompurely construction-focused to eitherO&M-focused or integrated businesses.
Multilateral development banks. MDBshave a valuable role to play as well,as their financing arrangements can
influence the way countries spend theirmaintenance budgets and operateexisting assets. MDBs should directmore of their lending and technicalsupport to the issue of O&M. Severalyears ago, for example, the Asian
Development Bank deliberatelysuspended loans to Cambodia for newroad construction until the countryadopted stronger road maintenancemeasures.
The EBRD’s engagement with Ukrainecan be considered as a longer-termapproach. It exemplifies an evolutionaryreform, through a sovereign lendingprogramme coupled with policydialogue and technical assistance.Each of the four loans for highwayrehabilitation was contingent on roadsector reforms regarding funding,the institutional set-up and privateparticipation. Specifically, the old roadfunding system was replaced by anew user tax system that ensuredadequate funds for maintenance. Inaddition, the road agency Ukravtodor
was restructured, which includeddevolving responsibility for local roadsfrom national to local authorities. Finally,the bank also helped to develop a PPPframework, and piloted a performance-based maintenance contract for theM06 highway.210
7/25/2019 Strategic Infrastructure Steps Report 2014
http://slidepdf.com/reader/full/strategic-infrastructure-steps-report-2014 77/88
77Steps to Operate and Maintain Infrastructure Efficiently and Effectively
Multistakeholder partnerships.Collaborations between government,business and civil society organizationsare very valuable. They havetraditionally focused on areas of publicservice delivery and supply, andshould continue to do so, but similarpublic-private joint efforts shouldalso be launched for assessing theinfrastructure O&M needs of regionsand cities, and for prioritizing the keyactions from an economic, social andenvironmental perspective.
O&M is not a silver bullet, but it
is a key part of the solution to the
infrastructure crisis
Even superlative O&M would not beable to close the global infrastructureinvestment gap on its own. So long
as demand increases, construction ofnew assets will also be required. Still,by optimizing existing capacity, O&Mbest practice can reduce the need fornew construction (and, in so reducingthe costs of existing infrastructure, it
can also free up financial resources fornew construction). Of course, O&M canease current congestion far faster thannew construction, given the latter’s longlead times.
With the vast existing infrastructureasset base worldwide, even amodest improvement in O&M willmake a significant impact. Certainlythe baseline is fairly low in manycountries and sectors at present, sothe potential for improvement is great;and, thanks to recent innovations andthe existing models of good practice,the improvements can be made at arelatively modest cost.
By enabling better management ofexisting assets, O&M best practiceswill contribute generously to increased
competitiveness, economic growth andsocial progress around the globe.

7/25/2019 Strategic Infrastructure Steps Report 2014
http://slidepdf.com/reader/full/strategic-infrastructure-steps-report-2014 78/88
78 Steps to Operate and Maintain Infrastructure Efficiently and Effectively
4. O&M Case Study: ThePanama Canal Authority
The Panama Canal, about 80 km(50 miles) in length, connects the Atlantic and Pacific Oceans at one ofthe narrowest points of the Americancontinent. After more than 100 years,
it still stands out as a masterpiece ofengineering. Since its opening in 1914,more than a million vessels from aroundthe world have transited the waterway,on any one of 144 maritime routeslinking more than 80 countries. Everyday, about 38 ships on average passalong the canal. The canal contributes considerably toPanama’s economy. While the directcontribution to the government budgetis about US$ 1.2 billion a year (8% ofthe budget), considering all indirecteffects, such as the maritime andlogistics industry it supports, the canalinfluences about 25% of Panama’sGDP. The canal is also key to globaltrade, and plays a prominent role inmany of the leading economies in theworld. About 5% of total global cargo istransported through the canal, including10% of US exports and imports.
The canal is managed, operated
and maintained by the autonomousgovernment agency Autoridaddel Canal de Panamá (ACP), orthe Panama Canal Authority. Themanagement principles currentlyapplied at the ACP exemplify thevarious best practice areas in theO&M framework – maximizing assetutilization, enhancing quality for users,reducing operating costs, mitigatingexternalities, extending asset life andreinvesting with a life cycle view. In allof these areas, the ACP strategists
have taken targeted actions.211 Thisconscientious approach comes asno surprise: after the handover fromthe US in 1999, the ACP developedas a disciplined commercial canal
operator, leaving behind the previousadministrative model. The changewas fostered by the Government ofPanama, which put the right enablingfactors in place, helping to ensure
funding, build capabilities and reformgovernance, and thereby facilitatingsustainable O&M. (See Figure 37 for anoverview of the ACP’s O&M strategies.)
Maximizing asset utilization
The ACP optimizes throughput. It hasreduced the average vessel transittime from 27 to 24 hours by fine-tuningtransit processes and thus enablingmore transits per day. Transit times arenot only shorter now, but also morepredictable, so the canal is attractingmore container liners that have tokeep to strict schedules. In 1995,200,000 containers were transportedthrough the waterway; the numbernow exceeds 12 million Twenty-footEquivalent Units (TEUs).
The ACP maximizes availability. Itprovides a 365-day, 24-hour service,and has increased the reliability andcontinuity of service by minimizing
downtimes. That has been partly dueto a policy of incorporating redundancyinto the key system components,such as the lock gates. For example,each lock chamber has two valves,so a valve can be replaced withoutsuspending normal operations(the water-filling process is sloweddown somewhat, but service is notinterrupted).
The ACP uses a mixed demandmanagement system – partly price-
based and partly rules-based. Itsbooking system allows pre-booking ofslots, and reserves a certain number ofslots for each vessel size category andfor specified pre-booking periods, so
there will always be some slots availablefor late-bookers. While slots for the firstthree booking periods are awarded ona first come, first served basis (rules-based), a short-notice slot (i.e. one day
prior to the transit) is awarded throughan auction (price-based).
Enhancing quality for users
In running its infrastructure business,the ACP applies various marketingstrategies and tools. It has introducedcustomer segmentation by vesseltype, commodity and geography. (Thesegments include: container, dry bulk,liquid bulk, passenger, car, refrigeratedgoods and general cargo.) It hascreated dedicated teams to conductmarket research on each segment, andto serve each of them appropriately.
The ACP has also introducedtechnology for forecasting user traffic,and adopted scenario planning toassess the different customer marketsand the changes to the underlyingdrivers. For example, it studies thecompetitiveness of coal productionin different regions, and the evolving
fortunes of shale gas and consequentpotential for exports of liquified naturalgas (LNG) from the US. In addition,the ACP is continuously engaged inanalysing its own competitive position.Given the competition from the SuezCanal and the land bridge across theUS, it monitors those competitorsconstantly, assessing their competitiveadvantages and disadvantages.
The ACP is customer-oriented, andintent on improving the customer
experience. Its online booking systemallows vessels to conveniently registermany months in advance for anassured transit time – a service that ismuch appreciated by cruise lines and

7/25/2019 Strategic Infrastructure Steps Report 2014
http://slidepdf.com/reader/full/strategic-infrastructure-steps-report-2014 79/88
79Steps to Operate and Maintain Infrastructure Efficiently and Effectively
Figure 37: Case Study on the Panama Canal
Note: KPI = Key Performance Indicator; ACP = Panama Canal Authority; LNG = Liquefied Natural Gas; Ro-Ro = Roll-on Roll-off
container shippers. In fact, a specialallocation is reserved for cruise ships,which can access the allocation morethan a year in advance, prior to all othertypes of vessel.
To reduce the user’s costs, and thusenhance its own competitive appeal,the ACP has recently initiated a new just-in-time service that allows vesselsto pass more efficiently. The vesselsreceive notification of their requiredarrival time and provisional transittime 96 hours prior to their scheduledtransit, and can thereby accuratelypace the final leg of their voyage to thecanal entrance; in that way, they canuse fuel more efficiently and reduceanchorage time.
These various measures have proved
their worth by yielding high levels ofcustomer satisfaction. In 2012, thecustomer satisfaction index, based ona survey of Ship Masters after transit,registered 97.8%.
Reducing O&M costs
The ACP conducts central corporateplanning, and sets financial targets andgoal-oriented budgets to drive efficiencyin the organization. The planningmetrics, however, are concerned withmore than mere financial performance:the aggregate performance index iscomposed of 40% financial metrics(e.g. the operating margin), 25% humanresource metrics (e.g. occupationalsafety, staff well-being, productivity)and 35% client and operations metrics(e.g. vessel transit time, energy andwater efficiency).
Great importance is accorded toanalysis and planning. Any proposedconstruction or maintenance projectsfirst have to undergo a whole life-
cycle return-on-investment analysisbefore they get the go-ahead forimplementation. And, overhauls areplanned in detail a full year in advance. The ACP aims to pre-assemble
components and pre-order materialsand equipment to avoid waiting timesduring the actual maintenance works.Its maintenance planning makes use ofGantt charts, where the activities areitemized by the minute, and generatesthe optimal sequence of steps forrepair work. The value of such detailedplanning and preparation is evidentfrom the results. To fix a major gateoutage now takes 4.5 days on average,compared with 14 days in the past. Afurther boost for maintenance efficiencyhas come from the new “all-in-one-go” maintenance model, which hasreplaced the old policy of carrying outmaintenance work in multiple sequentialpackages.
The ACP’s procurement systempromotes competition and
transparency, with open specificationsand whole life-cycle evaluation ofmajor parts. Responses to tenderingare evaluated twice over – from atechnical and a financial perspective.

7/25/2019 Strategic Infrastructure Steps Report 2014
http://slidepdf.com/reader/full/strategic-infrastructure-steps-report-2014 80/88
80 Steps to Operate and Maintain Infrastructure Efficiently and Effectively
And where appropriate, the ACP usesperformance-based procurement; forexample, the specifications for newlocks stipulated a target time for fillingand emptying the lock chambers ratherthan the type of technology to be used.
The ACP’s corporate culture hasalso changed with the times. Thetraditional, tight process control culture(“instructions for everything”) hasgiven way to a culture of continuousimprovement that values entrepreneurialdecision-making. In addition, a formal,continuous improvement processis now in place, whereby staff canpropose innovations through an intranetplatform, and a dedicated team ofprofessionals has been established foranalysing and improving processes.
All of these measures, in the cause ofoperational excellence, contribute to anoperating profit margin of around 45%and returns on equity of about 20%.(Being wholly owned by the state, the ACP is not charged for the use of waterand land, which would definitely alterthese results.)
Mitigating externalities
The ACP runs comprehensiveprogrammes of environmental
mitigation, with the aim of becomingcarbon-neutral. For example, areforestation programme along thecanal has involved the planting of600,000 seedlings so far. The agencyalso operates a filtration plant toprovide water to about 500,000 peoplein Panama; and, it operates varioushydraulic and thermal power plants forthe canal’s own operations, selling theexcess energy to the external market.
Operating the canal involves a vastconsumption of water, thus watermanagement is a priority concern forthe ACP. Under its Integrated WaterResource Management scheme, theagency monitors and modifies the levelof the canal’s lake, taking into accountthe hydrological and meteorologicalforecasts, and allocates water forthe various needs, including lockoperations, utility consumption andelectricity generation. The agencyalso works actively to reduce water
consumption. The new locks currentlyunder construction, despite being 60%wider and 40% longer than the existinglocks, will actually consume 7% lesswater, as 60% of the water required for
each transit will be salvaged in the newreservation basins and then reused.
The ACP has deliberately integratedenvironmental stewardship intoits regular business processes. Itestablished an energy efficiencycommittee, and has institutedenvironmental impact assessmentsat various project stages. It alsoundergoes an external environmentalaudit every six months. Itsenvironmental division is well resourced,with 45 staff, about 20 of whom areworking exclusively on environmentalissues related to the expansion project.In addition, the ACP’s integratedmanagement dashboard includesenvironmental KPIs.
Finally, the ACP engages proactively
with external stakeholders and thesurrounding communities. It operatesa community outreach programme,which includes providing training forteachers, and its water governanceapproach is based on six regional
advisory councils and 30 localcommittees. It also publicly discloseskey environmental performance metrics(e.g. a water quality index).
Extending asset life
The ACP maintains an elaboratemaintenance schedule, with therequired interventions for eachasset being carefully planned wellin advance. The approach is a mixof preventive maintenance used forcritical assets, and corrective “run-to-failure” maintenance used for non-critical components. The preventivemaintenance is implemented in any ofthree ways – time-based, usage-basedor condition-based – depending on theasset’s criticality and the availability ofinformation on the asset’s condition.
Substantial resources are dedicatedto maintenance; the agency has spentnearly US$ 2 billion on upgrades andimprovements to the canal since 2000. The main areas of maintenance include

7/25/2019 Strategic Infrastructure Steps Report 2014
http://slidepdf.com/reader/full/strategic-infrastructure-steps-report-2014 81/88
81Steps to Operate and Maintain Infrastructure Efficiently and Effectively
dredging operations in the navigationchannel, controlling erosion andlandslides, improving locks and theircomponents, and maintaining dams,landfills and power plants.
Reinvesting with a life cycle view
The ACP looks to the future, andmakes plans constantly. The currentexpansion should secure its place in theglobal supply chain, and safeguard it, tosome extent, against new competitionfrom the projected rival canal inNicaragua and the increasingly de-iced Arctic route. But the canal’s expansionprogramme was actually prompted bythe increased demands of world trade,and the consequent surge in both thenumber and the size of cargo ships. The latest container vessels can carry
about 18,000 TEUs, while the canal’sold locks could only accommodateships with a maximum of about 5,000 TEUs. While the old canal was toolimited in the number of vessels it couldtransit each year, that number is about
to double. All the new measures areaimed at maintaining the canal as theroute of choice for international trade.
The expansion programme involves aninvestment of US$ 5.2 billion. It consistsof various major works, including theconstruction of new larger locks, thedredging of navigational channelsand a new Pacific access channel. The programme was approved by anational referendum in 2006, in whichPanamanians voted heavily in favourof expansion. The ACP believes thatthe expansion, once completed in2015, will boost Panama’s annual GDPgrowth rate by 1.2%, which would lift100,000 Panamanians out of poverty.
The expansion plans have taken intoaccount the canal’s O&M needs and
costs over the whole life cycle. The ACP’s maintenance department was anearly participant in the planning of theconstruction and the purchase of newequipment, notably the new locks. Theplanners conducted a full total-cost-of-ownership analysis, and gatheredexternal benchmarks to validate theresults. Maintenance concerns arealso incorporated into the constructioncontracts; specifically, the contractorfor the locks is obliged to maintain themfor three years, and also has to perform
failure mode analysis and reliabilityanalysis to support future preventivemaintenance works.
Looking ahead, the Government ofPanama has created the right enablingconditions for optimizing the O&M ofthe canal for the long term. They are:
Ensuring funding
During the US era until 1999, tolls were
set on the basis of covering costs,but the canal took a more advancedapproach to increase its revenues andoptimize its yield. It segmented themarket, and adapted tolls to differentcargoes, using a sophisticated pricingmodel that included the estimated totallanded cost of transporting the goodsfrom origin to destination (not onlythe canal costs) as well as the pricesensitivity of the relevant user segment.
There is no political interference in
the use of the canal’s proceeds. Bylaw, after covering the costs of O&M,modernization and expansion, theagency disburses the surplus fundsto the National Treasury. (In the last
financial year, the country gained morethan US$ 1 billion in this way.)
In addition to the toll revenues, ancillarybusinesses currently contribute morethan 20% of the ACP’s revenues:notably, through the sale of electricity,water and transit-related services. The ACP is studying additional ancillarybusiness opportunities, including anLNG terminal, a roll-on/roll-off terminal,a ship repair yard, a bunkering terminal,logistics parks, a container terminal andcontainer-on-barge services.
Building capabilities
Panama has no university-levelprogramme focusing on maintenance,nor a professional maintenanceassociation. Given this, the ACP itself
provides most of its staff training, andruns its own apprentice school. Morethan 8,000 employees attended itstraining courses in 2012. The agencyalso uses state-of-the-art software tooptimize its maintenance planning andworks. The ACP has nurtured a maintenanceculture among its staff. A team ofdedicated maintenance professionalshas even set up a maintenance circle,with about 70 members, who get
together after work hours to discussissues and best practices. The teamrecently organized a conferenceattended by professionals from acrossthe region.
Reforming governance
The ACP was not privatized, butcorporatized with a professionalstructure. Although a governmentagency, it has financial autonomy
and functions quite independently:politics are kept well clear of the canal,so the agency enjoys long planninghorizons while the government benefitsfrom receiving the full profits. Thisindependence is also reflected in itsleadership personnel. The CEO isselected on the basis of experienceand competence, and is not a politicalnominee.
7/25/2019 Strategic Infrastructure Steps Report 2014
http://slidepdf.com/reader/full/strategic-infrastructure-steps-report-2014 82/88
82 Steps to Operate and Maintain Infrastructure Efficiently and Effectively
1 Romp, W. and de Haan, J. Public capital and economic growth: a critical survey . European Investment Bank Papers Volume 10, Number 1/2005,40-70.
2 Africa’s infrastructure: A time for Transformation. 2010. Washington DC: The International Bank for Reconstruction and Development/World Bank.
3 Strategic Infrastructure: Steps to Prepare and Accelerate Public-PrivatePartnerships. May, 2013. Geneva: World Economic Forum.
4 Ibid.
5 Own analysis based on Euromonitor data.
6 Strategic Infrastructure: Steps to Prepare and Accelerate Public-PrivatePartnerships. May, 2013. Geneva: World Economic Forum.
7 Report card for America’s infrastructure. April, 2013. Pittsburgh: AmericanSociety of Civil Engineers (ASCE).
8 Zukunft der Verkehrsinfrastrukturfinanzierung. December, 2012. Berlin:Kommission Zukunft der Verkehrsinfrastrukturfinanzierung.
9 Strategic Infrastructure: Steps to Prioritize and Deliver InfrastructureEffectively and Efficiently . September, 2012. Geneva: World EconomicForum; and Strategic Infrastructure: Steps to Prepare and AcceleratePublic-Private Partnerships. May, 2013. Geneva: World Economic Forum.
10 “Die Ziele der Verkehrspolitik”. Eidgenössisches Departement für
Umwelt, Verkehr, Energie und Kommunikation, http://www.uvek.admin.ch/ verkehrspolitikdesbundes/02759/02828/index.html?lang=de, 2013.
11 The term “asset management”, as used throughout this report, should beunderstood as it normally is used in infrastructure and industrial contexts;it should not, of course, be understood in its common financial-servicessense. A suitable definition for the purposes of this report is “the activityof integrating decisions about design and construction, maintenance andrehabilitation, as well as operations, in order to maximize benefits to users,minimize total costs of ownership and maximize the asset’s lifespan”. Theterms “infrastructure management” and “infrastructure asset management”are used interchangeably.
12 Own analysis, based on data on the global infrastructure stock andHow Infrastructure Investments Support the U.S. Economy: Employment,Productivity and Growth. January, 2009. Amherst: Political Economy
Research Institute.
13 2012 WFE market highlights. January, 2013. World Federation ofExchanges.
14 “The World Factbook”. CIA, https://www.cia.gov/library/publications/the-world-factbook/geos/xx.html.
15 Charting Our Water Future: Economic frameworks to inform decision- making. 2009. Washington DC: 2030 Water Resources Group.
16 Global Shipping Weekly – Equity Research. August, 2012. SanFrancisco: Wells Fargo.
17 “Report card on American infrastructure”. ASCE, http://www.infrastructurereportcard.org/a/#p/home, 2013.
18 Stalk, G. “The threat of global gridlock”. In Harvard Business Review ,July-August 2009.
19 “FlightStats On-time Report – June 2013”. FlightStats. http://www.flightstats.com/go/story.do?id=1061, 2013.
Endnotes
20 The Challenge of Reducing Non-Revenue Water (NRW) in DevelopingCountries. How the Private Sector Can Help: A Look at Performance-Based Service Contracting. December, 2006. Washington DC: World Bank.
21 Pidd, H. “India blackouts leave 700 million without power”. In TheGuardian, 2012.
22 Terrorism and the Electric Power Delivery System. 2012. WashingtonDC: National Research Council.
23 Duhigg, C. “Millions in U.S. Drink Dirty Water, Records Show”. In TheNew York Times, 2009.
24 Rough Roads Ahead: Fix Them Now or Pay for It Later . May,2009. Washington DC: American Association of State Highway and Transportation Officials.
25 “Report card on American infrastructure”. ASCE, http://www.infrastructurereportcard.org/a/#p/home, 2013.
26 Failure to act. The impact of current infrastructure investment on America’s economic future. 2013. Washington DC: American Society ofCivil Engineers.
27 “Report card on American infrastructure”. ASCE, http://www.infrastructurereportcard.org/a/#p/home, 2013.
28 World Development Report 1994 – Infrastructure for development . June,1994. Washington DC: World Bank.
29 Road to Recovery. Transforming America’s Transportation. 2011.Washington DC: Carnegie Endowment for International Peace.
30 MassHighway . 2008. Accelerated Bridge Program (ABP) Plan. http:// www.eot.state.ma.us/acceleratedbridges/downloads/ActiveList_040113.pdf.
31 Boston Herald Special Report, Longfellow’s long list of woes. January,2008. Boston: Casey Ross.
32 Urban Mobility Report 2012. December, 2012. Texas: Texas A&M Transportation Institute; CO
2 emissions from fuel combustion – Highlights.
2012. Paris: International Energy Agency.
33 “Greenhouse Gas Equivalencies Calculator”. United StatesEnvironmental Protection Agency (EPA), http://www.epa.gov/cleanenergy/ energy-resources/calculator.html.
34 Global Status Report on Road Safety: Supporting a Decade of Action.March, 2013. Geneva: World Health Organization (WHO).
35 George, N. India Rail Track Deaths Amount To 15,000 Each Year. InHuffington Post , 2012.
36 Diarrhoea: Why children are still dying and what can be done. 2009.Geneva: WHO/United Nations Children’s Fund.
37 Africa’s infrastructure: A time for Transformation. 2010. Washington DC: The International Bank for Reconstruction and Development/World Bank.
38
Jones S. “Infrastructure Challenges in East and South Asia”. In IDSBulletin, 2006 , 37:3, pp. 28-44; Fay, M. and Yepes, T. Investing inInfrastructure: What is needed from 2000 to 2010? Policy ResearchWorking Paper 3102. 2003. Washington DC: World Bank.
7/25/2019 Strategic Infrastructure Steps Report 2014
http://slidepdf.com/reader/full/strategic-infrastructure-steps-report-2014 83/88
83Steps to Operate and Maintain Infrastructure Efficiently and Effectively
39 Road Transport in the People’s Republic of China. December, 2009.Geneva: International Road Transport Union. “World Fact Book”. CIA, www.cia.gov/library/publications/the-world-factbook/geos/ch.html.
40 For a detailed discussion of infrastructure asset management, refer to:Uddin, Waheed et al. Public Infrastructure Asset Management. Secondedition. New York: 2013.
41 Impediments for Implementing a Sound Asset ManagementSystem. March, 2013. Rutgers: Center for Advanced Infrastructure and Transportation – State of Good Repair Summit.
42 Data provided by Autostrade.
43 “Hong Kong’s integrated traffic management system”, IST International,http://www.itsinternational.com/categories/utc/features/hong-kongs-integrated-traffic-management-system/, March-April, 2012.
44 Varley, J. “Tension based real-time monitoring untaps hidden potential”.In Modern Power Systems, 2009.
45 Best Practice in Infrastructure Asset Management: Creating and maintaining value for all stakeholders. 2010. London: First StateInvestments.
46 “The new technologies set to revolutionise the airport journey”. Airport Business, http://www.airport-business.com/2013/06/the-new-technologies-set-to-revolutionise-the-airport-journey/#sthash.NUz90zmn.dpuf, June, 2013.
47 Nos actions concretes. November, 2012. Rueil-Malmaison: Vinciautoroutes. http://adm.vinci-autoroutes.com/sites/default/files/u1/vinci_paquet_vert_actions_concretes.pdf.
48 “IBM Global Parking Survey: Drivers Share Worldwide Parking Woes”.IBM, http://www-03.ibm.com/press/us/en/pressrelease/35515.wss, 2011.
49 Temporary Losses of Highway Capacity and Impacts on Performance:Phase 2, Oakridge National Laboratory Report No. ORNL/TM-2004/209,Oak Ridge. November, 2004. TN: US Department of Transportation, OakRidge National Laboratory.
50
The Challenge of Reducing Non-Revenue Water (NRW) in DevelopingCountries: How the Private Sector Can Help: A Look at Performance-Based Service Contracting. December, 2006. World Bank.
51 Ibid.
52 “i2O Water helps Veolia water save 1.5 million litres of water a day”. i2O,http://www.i2owater.com/page/6/?p=zpfeqwqq, January, 2012.
53 Ibid.
54 Targosz, R. et al. “The Potential for Global Energy Savings from HighEfficiency Distribution Transformers”. European Copper Institute. February,2005.
55 The Challenge of Reducing Non-Revenue Water (NRW) in Developing
Countries: How the Private Sector Can Help: A Look at Performance-Based Service Contracting. December, 2006. World Bank.
56 Transformation of Phnom Penh’s Water Supply Authority . 2009.Singapore: Institute of Water Policy, National University of Singapore.
57 The Challenge of Reducing Non-Revenue Water (NRW) in DevelopingCountries: How the Private Sector Can Help: A Look at Performance-Based Service Contracting. December, 2006. World Bank.
58 “Eskom recovers over R243 million since launch of Operation Khanyisa”.Operation Khanyisa, http://www.operationkhanyisa.co.za/blog/entry/press-release-eskom-recovers-over-r243-million-since-launch-of-operation-kh,2013.
59 Reducing Technical and Non‐Technical Losses in the Power Sector .
July, 2009. World Bank.
60 Ibid; Reforming the Power Sector. Controlling Electricity Theft andImproving Revenue. 2004. World Bank.
61 PPP’s role in delivering improved water supply services for metro Manila.2013. Manila: Manila Water Company, Inc. and the Asian DevelopmentBank.
62 White Paper on Transport . 2004. London: British Government.
63 Smarter Choices, Changing the Way We Travel . 2004. London:Department for Transport.
64 Kian Keong, C. Road Pricing: Singapore’s Experience. Prepared for thethird seminar of the IMPRINT-EUROPE Thematic Network: “Implementing
Reform on Transport Pricing: Constraints and solutions: learning from bestpractice”, Brussels: 23-24 October 2002.
65 SR 167. HOT Lanes Pilot Project. Fourth Annual Performance Summary.May 2008-April 2012. Washington State Department of Transportation.
66 Faruqui, A., Sergici, S. BGE’s Smart Energy Pricing Pilot Summer 2008Impact Evaluation. The Brattle Group, April 2009.
67 Oracle. Testing the Water. Redwood Shores, California. January 11,2010.
68 “Hong Kong’s integrated traffic management system”. IST International,http://www.itsinternational.com/categories/utc/features/hong-kongs-integrated-traffic-management-system/ , 2012.
69 “Central Okanagan TDM Program: Partnering for Sustainable Transportation”. Transport Canada, Government of Canada Publications,http://data.tc.gc.ca/archive/eng/programs/environment-utsp-centralokanagan-838.htm, July, 2004.
70 The Future of Urban Development Initiative: Tianjin Champion CityStrategy . January, 2013. Geneva: World Economic Forum.
71 “The Barometer Report 2”. Trelleborg Marine Systems, http://www.trelleborg.com/en/Marine-Systems/Resources/Downloads/Barometer-Report-2/ , 2011.
72 “Locked Out: Disrepair Forces Closure of Vital Shipping Lane”. DerSpiegel, http://www.spiegel.de/international/germany/repairs-force-sudden-closure-of-vital-german-kiel-canal-shipping-lane-a-887759.html,
2013.73 “Schlendrian am Bau bringt langen Stau”. AllgemeinerDeutscher Automobilclub, http://www.pressrelations.de/new/standard/result_main.cfm?pfach=1&n_firmanr_=101611&sektor=pm&detail=1&r=410901&sid=&aktion=jour_pm&quelle=0, 2010.
74 “Traffic Congestion and Reliability: Trends and Advanced Strategiesfor Congestion Mitigation”. US Department of Transportation: FederalDepartment of Highway Administration, http://www.ops.fhwa.dot.gov/ congestion_report/executive_summary.htm, 2005.
75 The Smart Grid. An introduction. U.S. Department of Energy, LitosStrategic Communication.
76
“World Airport Rating”. Skytrax, http://www.airlinequality.com/ AirportRanking/ranking-intro.htm.
77 “International survey reveals travellers’ dream airport”. Skyscanner, http:// www.skyscanner.net/news/international-survey-reveals-travellers-dream-airport, 2013.
78 “Aéroports de Paris pursues the perfect passenger experience”. Airportbusiness, www.airport-business.com/2013/04/aeroports-de-paris-pursues-the-perfect-passenger-experience/, April, 2013.
79 “Panama Canal Authority launches just-in-time-service”. Port TechnologyInternational, http://www.porttechnology.org/industry_sectors/panama_canal_authority_launches_just_in_time_service, 2013.
80 “Etapes estivales: vous donner envie de vous arrêter!”. Vinci autoroutes,
http://www.vinci-autoroutes.com/fr/article/etapes-estivales-vous-donner-envie-de-vous-arreter, 2012.
81 “ADPC and ADT sign MoU with Government agencies to speed up porttransactions”. ADPC, http://www.adpc.ae/en/news/media-centre/press-releases/news-113.html, 2013.
7/25/2019 Strategic Infrastructure Steps Report 2014
http://slidepdf.com/reader/full/strategic-infrastructure-steps-report-2014 84/88
84 Steps to Operate and Maintain Infrastructure Efficiently and Effectively
82 Best Practice in Infrastructure Asset Management. Creating and maintaining value for all stakeholders. December, 2010. London: First StateInvestments.
83 “NYC DOT Announces Expansion of Midtown Congestion ManagementSystem, Receives National Transportation Award”. New York CityDepartment of Transportation, www.nyc.gov/html/dot/html/pr2012/ pr12_25.shtml, 2012.
84 Inter-American Competitiveness Network. Signs of Competitiveness inthe Americas Report 2013.
85 Safety Tutor Project . Autostrade per l’Italia Spa. http://www.asecap.com/ english/documents/GalataASPI_000.pdf .
86 “Evaluation of residential smart meter policies. WEC-ADEME Casestudies on Energy Efficiency Measures and Policies”. VaasaETT GlobalEnergy Think Tank. July 2010.
87 McLysaght, Gao and Chen. “The Hong Kong Octopus Card”. http:// chenx.richie.idc.ul.ie/Chinese%20pages/thesis/OCTOPUS.pdf.
88 The Transport Situation in Africa. October, 2009. Addis Ababa, Ethiopia:UN Economic Commission for Africa.
89 Deep Tube Railway – Generic Operations and Maintenance Concept – 2020. September, 2011. Deep Tube Programme.
90 Yorkshire Water Success Story. 2013. Ventyx. www.ventyx.com/en/ resources/type/success/~/media/3a6adfbae3714d3b8ecc2f9c17ac015b.ashx.
91 “When a water meter is worth more than a house”. Inter- American Development Bank (IDB), www.iadb.org/idbamerica/index.cfm?thisid=3917, 2006.
92 Nova and CoMET: Improving the management and delivery of masspublic transportation in cities. Presentation by Richard Anderson at theNova Symposium on 27 April 2006 in Buenos Aires, Argentina.
93 In Transit. Funding the Future of Public Transit . 2011. HNTB.
94
Singer, N. “Mission Control, Built for Cities”. The New York Times,2012. www.nytimes.com/2012/03/04/business/ibm-takes-smarter-cities-concept-to-rio-de-janeiro.html?pagewanted=all.
95 Centralized Asset Management Operating Model . 2012. Waukesha,USA: GE HealthCare. http://partners.gehealthcare.com/Centralized%20Distribution%20White%20Paper.pdf.
96 Performance-based Contracting for Preservation and Improvement ofRoad Assets. 2009. World Bank.
97 “Infrastructure to 2030 (Volume 2): Mapping Policy for Electricity, Waterand Transport”. OECD, http://www.oecd.org/futures/infrastructureto2030/ infrastructureto2030volume2mappingpolicyforelectricitywaterandtransport.htm, 2007.
98
Brown, A., Swersky A. Smarter Outsourcing in the Public Sector: ACarthaginian Tale. The Boston Consulting Group. June, 2013.
99 Roghé, F., Toma, A., Messenböck, R., Kempf, S., Marchingo, M.Breaking Free of the Silo. Creating Lasting Competitive Advantage ThroughShared Services. The Boston Consulting Group. November, 2013.
100 Tennessee Valley Authority: A Balanced Scorecard Hall of Fame Profile. Harvard Business School, 2005.
101 External Costs of Transport in Europe. Update Study for 2008. September, 2011. Delft: CE Delft.
102 Global Status Report on Road Safety: Supporting a Decade of Action.March, 2013. Geneva: WHO.
103 From companies to municipalities, Organica provides water solutionsfor each individual situation. Organica, http://www.organicawater.com/ solutions/case-studies/.
104 “Climate Change”. National Grid, http://www2.nationalgrid.com/ responsibility/how-were-doing/grid-data-centre/climate-change/, 2013.
105 “Blueprint for Integrating Technology Innovation into the National WaterProgram”. EPA, water.epa.gov/blueprint.cfm, 2013.
106 Managing Water Use in Scarce Environments. A Catalogue of CaseStudies 2030. 2013. Washington DC: Water Resources Group.
107 Power Generation from Coal . International Energy Agency 2012, p. 59.
108 Creating More Complete Streets in Charlotte, North Carolina. 2010.Charlotte Department of Transportation.
109 Climate Change Impact and Opportunities for the Urban Sector . 2009. Asian Development Bank.
110 “Panama Canal aims to go carbon neutral in 2014”. T icotimes, http:// www.ticotimes.net/More-news/Top-Story/News/Panama-Canal-aims-to-go-carbon-neutral-in-2014_Friday-March-04-2011, 2011.
111 Redefining the Future of Growth: The New Sustainability Champions.2011. Geneva: World Economic Forum.
112 Sustainability Report 2007 – Manila water company . 2007. Manila WaterCompany.
113 Safety Culture Change Yields Sustainable Improvements. 2007. DuPont.
114
Partnering for Safety and Savings. 2007. DuPont. http://www2.dupont.com/Sustainable_Solutions/en_US/assets/downloads/case_studies/ LACMTA_PublicTransportation_CaseStudy.pdf.
115 Sustainability Report 2011 – Sustainable Growth. 2011. Manila WaterCompany.
116 Pavement Smoothness and Fuel Efficiency: Increased Fuel CostsHeighten the Importance of Transportation Investments. July, 2008.Jefferson City: Missouri Department of Transportation.
117 Aircraft Emission Charges Zurich Airport. Zurich Airport, http://www.flughafen-zuerich.ch/~/media/FlughafenZH/Dokumente/Das_Unternehmen/ Laerm_Politik_und_Umwelt/Luft/Emission_Charges_2010.pdf, July 2010.
118 “Alternative Maritime Power”. The Port of Los Angeles, http://www.
portoflosangeles.org/environment/alt_maritime_power.asp.
119 A global approach to reducing aviation emissions. First stop: carbon- neutral growth from 2020. August, 2009. Montreal: International Air Transport Association.
120 Annual Local Authority Road Maintenance Survey (ALARM) 2011.March, 2011. London: Asphalt Industry Alliance (UK).
121 Levik, K. “How to sell the message ‘Road maintenance is necessary’ todecision makers”. Norwegian Public Roads Administration, http://ntl.bts.gov/lib/12000/12100/12140/pdf/Levik.pdf , 2007.
122 “An Overview of Preventive Maintenance Concepts and Practices(Education Program)”. Michigan Road Preservation Association, http:// www.m-rpa.org/overview.htm, 1999.
123 Road Maintenance. Issue Brief . October, 2006. Sacramento AreaCouncil of Governments.
124 Integration of Preventive Maintenance into the State Airport PavementManagement Process. October, 2004. Georgia Department of Transport/Nebraska Department of Transport.
125 Case Study – Massachusetts Water Resources Authority . WERF Org.
126 Improving pipeline integrity with the Threatscan system – GE’s IndustrialInternet monitors vitally important energy infrastructure. 2013. Oil&GasIndustrial Internet in Action, General Electric Company.
127 Hardy, I. “Bump and mend: The apps helping fix city streets”. In BBCNews. 11 June 2012.
128 “Preventive maintenance on highway-railway combined bridges”. JointConference on Advances in Bridge Engineering-II, http://www.iabse-bd.org/old/45.pdf , 2010.

7/25/2019 Strategic Infrastructure Steps Report 2014
http://slidepdf.com/reader/full/strategic-infrastructure-steps-report-2014 85/88
85Steps to Operate and Maintain Infrastructure Efficiently and Effectively
129 Biau, C. et al. “How to increase sound private investment in Africa’sroad infrastructure: Building on country successes and OECD policy tools”.NEPAD-OECD Africa Investment Initiative. December 2008.
130 I. Vermeij et al. “Optimisation of Rolling Stock Wheelset Life throughBetter Understanding of Wheel Tyre Degradation”. Lloyd’s Register RailEurope.
131 Merriss, J. New Research on Pavement Damage Factors. OregonDepartment of Transportation. June, 2003.
132 Managing Disaster Risks for a resilient future: The Sendai Report . 2012.World Bank.
133 Natural catastrophes in economies at different stages of development .January, 2012. Munich: Munich Re/Geo Risks Research/ NatCatSERVICE.
134 “Rising Seas”. National Geographic, http://ngm.nationalgeographic.com/2013/09/rising-seas/folger-text, 2013.
135 Greene, R. A. “Corps of Engineers not l iable for Katrina damage, courtrules”. CNN , 2012. http://edition.cnn.com/2012/09/25/us/louisiana-katrina-lawsuit.
136 Marshall, B. “Funding crisis looms for $14 billion hurricane protectionsystem”. The Lens, 2013. http://thelensnola.org/2013/02/14/a-cadillac-flood-defense-but-now-comes-the-hard-part-paying-for-it/.
137 A Stronger, More Resilient New York. New York: The City of New York,June, 2013.
138 Saghir, J. “Tackling the Climate Vulnerability of Africa’s Infrastructure”.ICA, 2013. www.icafrica.org/en/news-events/ica-news/article/tackling-the-climate-vulnerability-of-africas-infrastructure-4539/.
139 “Rising Seas”. National Geographic, http://ngm.nationalgeographic.com/2013/09/rising-seas/folger-text, 2013.
140 Investing in Resilience – Ensuring a disaster-resistant future. 2013. AsianDevelopment Bank.
141 “Disaster Management”. World Economic Forum, http://www.weforum.
org/issues/disaster-management.142 Pique, J., Martel, P. How Peruvian Seismic Code Greatly ImprovedBuilding Response to Real Earthquakes. Vancouver, B.C., Canada: 13thWorld Conference on Earthquake Engineering, 2004. Paper No. 1825.
143 Boesch, D. F. et al. Updating Maryland’s Sea-level Rise Projections. Special Report of the Scientific and Technical Working Group to theMaryland Climate Change Commission. University of Maryland Center forEnvironmental Science, Cambridge, MD, 2013.
144 “Rising Seas”. National Geographic, http://ngm.nationalgeographic.com/2013/09/rising-seas/folger-text, 2013.
145 FONDEN: Mexico’s natural disaster fund – A review. 2012. WashingtonDC: International Bank for Reconstruction and Development/World Bank.
146 “Success of Kuala Lumpur’s dual purpose tunnel”. ITS International,http://www.itsinternational.com/categories/detection-monitoring-machine-vision/features/success-of-kuala-lumpurs-dual-purpose-tunnel/ , 2012.
147 How to Make Cities More Resilient: A Handbook for Local GovernmentLeaders. 2010. United Nations Office for Disaster Risk Reduction.
148 London Assembly. London’s water supply. October, 2003. A report bythe London Assembly’s Public Services Committee.
149 “Investitionen in Infrastruktur: Löwenanteil für die Bildung”. Handelsblatt,http://www.handelsblatt.com/politik/deutschland/investitionen-in-infrastruktur-loewenanteil-fuer-die-bildung-seite-all/3086874-all.html, 2009.
150 Sirkin, H. L. “U.S. Airport Capacity: Failure to Launch”. Businessweek,
July 06, 2012. http://www.businessweek.com/articles/2012-07-06/fear-of-flying.
151 For more information on best practices in demand forecasting, seechapter 2.1 of the report Strategic Infrastructure: Steps to Prepare and
Accelerate Public-Private Partnerships. World Economic Forum, 2013.
152 The Nordic State Road and Railway Infrastructure Market. ResearchReports of the Finnish Transport Agency . 2013. Helsinki: Finnish Transport Agency.
153 IFC Support to Transport. Highlights of Advisory and Investment Work inthe Airlines, Airports, Ports, Roads, Urban Transit & Rail, and Warehouse &Logistics Sectors. 2010. International Finance Corporation (IFC).
154 “IFC Support to Infrastructure”. IFC, http://www1.ifc.org/wps/wcm/ connect/62aa5680498390a982c4d2336b93d75f/InfrastructureBooklet_FINALweb.pdf?MOD=AJPERES&CACHEID=62aa5680498390a982c4d23
36b93d75f , 2009.
155 Value for Money. State of the Practice. December 2011. U.S.Department of Transportation. Federal Highway Administration.
156 Success Stories Public-Private Partnerships. Mexico: Toluca andTlalnepantla Hospitals. 2011. Washington DC: International FinanceCorporation.
157 Strategic Infrastructure: Steps to Prepare and Accelerate Public-PrivatePartnerships. 2013. World Economic Forum.
158 Eight Key Levers for Effective Large-Capex-Project Management:Introducing the BCG LPM Octagon. The Boston Consulting Group, 2012.
159 Cardno, C. “Group Seeks Sustainable, Integrated Water Projects”. The American Society of Civil Engineers, 2013. http://www.asce.org/ CEMagazine/ArticleNs.aspx?id=23622323172#.Ua9S7Ngw8-N.
160 “Funding” refers to infrastructure revenue streams, i.e. money providedby the ultimate payers (either the government or the users) for theinfrastructure asset during the course of its life cycle; “financing” refers tothe money raised upfront for the capital investment, from financiers (whichreceive a return on their investment during the asset’s life cycle).
161 Road Funds, User Charges and Taxes. September, 1997. WashingtonDC: Transportation Water Urban Development, World Bank.http://www.rhd.gov.bd/Documents/ExternalPublications/WorldBank/TransSectPub/ contents/documents/B23.pdf
162 Faktenblatt Nationalstrassen. June, 2013. Eidgenössisches Departementfür Umwelt, Verkehr, Energie und Kommunikation.
163 Transport Sector Strategy. October, 2013. London: European Bank forReconstruction and Development (EBRD).
164 EBRD Activities in the Water Sector. Workshop with Israeli Experts onWater Efficiency. June, 2012. London: EBRD.
165 Average loads, distances and empty running in road freight transport. October, 2007. Luxembourg: Eurostat.
166 EBRD loan, a tailwind for Izmir ferries. May, 2013. EBRD. Municipal andEnvironmental Infrastructure.
167 “How to solve traffic jams”. TED Talk, www.ted.com/talks/jonas_eliasson_how_to_solve_traffic_jams.html, 2012.
168 Road Tolls and Road Pricing Innovative Methods to Charge for the Useof Road Systems. The Louis Berger Group, Inc.
169 “When a water meter is worth more than a house”. IDB, www.iadb.org/ idbamerica/index.cfm?thisid=3917, 2006.
170 Transforming Electricity Consumers into Customers: Case Study of aSlum Electrification and Loss Reduction Project in São Paulo, Brazil . 2009.Washington DC: United States Agency for International Development(USAID).
171 Lessons Learned from PPIAF Activities: Pricing and Affordability inEssential Services. March, 2012. Public-Private Infrastructure AdvisoryFacility (PPIAF).
172 “Manila Water Company’s “Water for the Poor” Program: An Overview”.Manila Water Company, www.waterlinks.org/library/connecting-urban-poor/manila-water-company%E2%80%99s-water-poor-program-overview,2006.

7/25/2019 Strategic Infrastructure Steps Report 2014
http://slidepdf.com/reader/full/strategic-infrastructure-steps-report-2014 86/88
86 Steps to Operate and Maintain Infrastructure Efficiently and Effectively
173 Road Pricing and Congestion Charging: Implementation Challenges.Washington DC: Institution for Transportation and Development Policy.http://www.itdp.org/documents/5842_Replogle_Implementation.pdf.
174 “Yihaodian’s QR Code Marketing Turns Subway into Supermarket”.China Direct Mail Association, www.cndma.org/english/web/Flash.aspx?id=16, 2014.
175 “Virginia advances draft P3s to procurement”. Infrastructure Investor,http://www.afscmeinfocenter.org/privatizationupdate/2013/07/virginia-advances-draft-p3s-to-procurement.htm, 2013.
176 Summers, N. “Citi Bike: Citibank’s New York Marketing Coup”.Businessweek , 31 October, 2013, http://www.businessweek.com/ articles/2013-10-31/citi-bike-citibanks-new-york-marketing-coup.
177 Sharing our growth. March, 2013. Hong Kong: MTR CorporationLimited.
178 Alles Schiebung. Am Düsseldorfer Flughafen übernehmen künftigRoboter das Einparken, doch die Technik ist umstritten. In Süddeutsche
Zeitung, 2013.
179 Debrat, J., Cointe, R. Who pays what for urban transport? Handbook of good practices. Cahors: Agence Française de Développement (AFD) andthe French Ministry of Ecology, Energy, Sustainable Development and theSea, 2009.
180 “THINK Innovative Solutions – Infrastructure as an Asset – Issue 07”.HNTB, http://www.hntb.com/about/publications/think , 2011.
181 Infrastructure Asset Management Exchange – Top 10 InvestmentPriorities in 2013. March, 2013. International Quality and ProductivityCenter.
182 How to Get Started with Big Data. May, 2013. Boston: The BostonConsulting Group.
183 IBM Big Data Success Stories. 2011. Armonk: IBM.
184 Unlocking the Value of Personal Data: From Collection to Usage. 2013.Geneva: World Economic Forum.
185 “Amsterdam Smart City”. Amsterdam Smart City, http:// amsterdamsmartcity.com, 2013.
186 “Background”. CoMET and Nova Metro Benchmarking Groups, http:// cometandnova.org/background/.
187 Howe, J. W., Jacobs, C. W. “Key Issues and Experience in U.S.Water Services Privatization”. International Journal of Water ResourcesDevelopment , 21:1, pp. 89-98. 2005. “Water department re-engineeringsaves money”. American City & County, http://americancityandcounty.com/ mag/government_water_department_reengineering, 2000.
188 See: http://www.itscosts.its.dot.gov/.
189 TfL Rail and Underground Annual Benchmarking Report. June, 2012.
London: Transport for London (TfL).
190 Royal Vopak 2010 Annual Report. 2010. Rotterdam: Royal Vopak.
191 For a detailed discussion of asset management systems, refer to Uddin,Waheed et al. Public Infrastructure Asset Management. Second edition.New York: 2013.
192 Information provided by Leighton Contractors Pty Ltd.
193 Workforce planning risks and challenges in the Victorian public sectorupdate report 2011. Melbourne: Victoria State Services Authority.
194 The Making of a Talent Magnet: Lessons from Singapore’s PublicService. May, 2012. Boston: The Boston Consulting Group.
195 Good Practices in Public Water Utility Corporatization. 2006. USAID.
196 The Turnaround Artist: Craig Coy Tackles Political Influence at Massport .November, 2008. Kennedy School of Government.
197 Corporatization – Commercialization Reforms in the Water Sector in Jordan. 2002-2009. USAID.
198 East African Infrastructure. Special Report . East African InfrastructureDevelopment, Part I: The Central Corridor . November, 2013. Stratfor GlobalIntelligence.
199 “TMSA Supports Trade and Transport Facilitation Programme forCOMESA-EAC-SADC region”. TradeMark Southern Africa, http://www.trademarksa.org/about_us/programme_news/tmsa-supports-trade-and-transport-facilitation-programme-comesa-eac-sadc-reg.
200 “Single market for gas & electricity”. European Commission, http:// ec.europa.eu/energy/gas_electricity/codes/gas_en.htm.
201 “Blueprint for Integrating Technology Innovation into the National WaterProgram”. EPA, http://water.epa.gov/blueprint.cfm, 2013.
202 Interrelationship between the structural funds and the provision of services of general (economic) interest and the potential for cross-border service delivery . October, 2010. Brussels: European Parliament.
203 The Nordic State Road and Railway Infrastructure Market. 2013.Helsinki: Finnish Transport Agency.
204 Moore, M., Forster, P. “China to create largest mega city in the worldwith 42 million people”. In The Telegraph, 24 January 2011.
205 2012 Annual Report, Mapping a new direction. 2012. New York: ThePort Authority of New York and New Jersey.
206 “Infrastructure to 2030 (Volume 2): Mapping Policy for Electricity, Waterand Transport”. OECD, http://www.oecd.org/futures/infrastructureto2030/ infrastructureto2030volume2mappingpolicyforelectricitywaterandtransport.htm, 2007.
207 Water Treatment Plants by Public Private Partnerships – CentralHighlands Region Water Authority, Victoria, Australia. 2003. Efficiency Unit.
208 “Analysis: Austerity threatens EU’s competitive edge in infrastructure”.Reuters, http://www.reuters.com/article/2013/03/28/us-europe-infrastructure-slowdown-idUSBRE92R04H20130328, 2013.
209 “America is One Big Pothole: LaHood Wants to Raise the Gas Tax”. Townhall, http://townhall.com/tipsheet/heatherginsberg/2014/01/14/ lahood-wants-to-raise-the-gas-tax-n1778867, 2014.
210 Transport Sector Strategy . 2013. EBRD.
211 Based on interviews with various managers of the Panama Canal Authority.

7/25/2019 Strategic Infrastructure Steps Report 2014
http://slidepdf.com/reader/full/strategic-infrastructure-steps-report-2014 87/88

7/25/2019 Strategic Infrastructure Steps Report 2014
http://slidepdf.com/reader/full/strategic-infrastructure-steps-report-2014 88/88
The World Economic Forum is aninternational institutioncommitted to improving the stateof the world through public-private cooperation in the spirit ofglobal citizenship. It engages withbusiness, political, academic andother leaders of society to shapeglobal, regional and industryagendas.
Incorporated as a not-for-profitfoundation in 1971 andheadquartered in Geneva,Switzerland, the Forum isindependent, impartial and nottied to any interests. It cooperatesclosely with all leadinginternational organizations(www.weforum.org).