Embed Size (px)
Citation preview

Strategic Innovation and Technology Adoption in an Evolving Industry
Darren Filson and Richard T. Gretz

Motivation
Three facts have been under-emphasized in models of innovation races and industry evolution:
1. Small firms rarely grow by attempting to compete head-to-head with industry leaders
2. Firms with the “best” technologies are not always the most profitable firms or the ones with the largest market shares
3. Many resources are mobile

Our Approach
• We adapt the standard single-prize racing model to allow for product differentiation, spin-out formation, and licensing
• The model considers two types of innovations: quality improvements and new product generations
• New generations have different impacts on existing goods than quality improvements. For example, in the computer industry, mainframes, minicomputers, desktops, laptops, notebooks, and hand-held devices are all product generations
• Analytical and numerical results suggest several testable hypotheses, and tests on the rigid disk drive industry (1977-1997) provide empirical support
• The model considers only one innovation at a time. The implicit assumption is that firms do not look beyond the current race
Rigid Disk Drive Industry
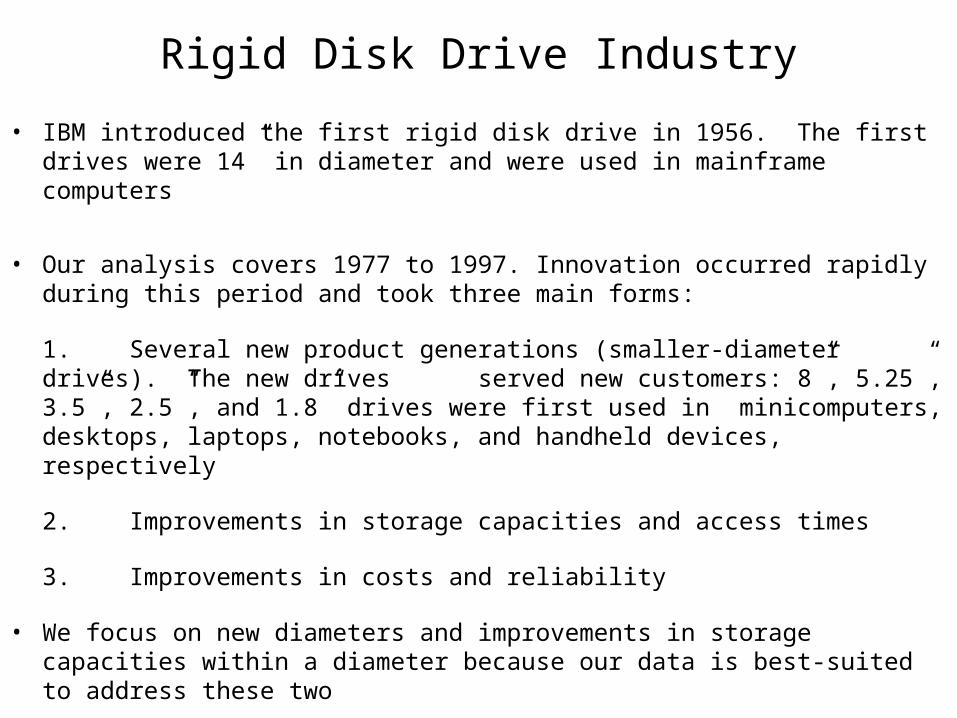
• IBM introduced the first rigid disk drive in 1956. The first drives were 14” in diameter and were used in mainframe computers
• Our analysis covers 1977 to 1997. Innovation occurred rapidly during this period and took three main forms:
1. Several new product generations (smaller-diameter drives). The new drives served new customers: 8”, 5.25”, 3.5”, 2.5”, and 1.8” drives were first used in minicomputers, desktops, laptops, notebooks, and handheld devices, respectively
2. Improvements in storage capacities and access times
3. Improvements in costs and reliability
• We focus on new diameters and improvements in storage capacities within a diameter because our data is best-suited to address these two

Main Results• Small firms market their innovations when they pioneer a new product generation
or improve quality in a young generation
• Small firms who improve quality in mature generations license or sell the improvement
• New generations pass through at most three stages:
1. A new firm or another small firm pioneers the generation
2. An old-generation leader wins the race to improve quality in the new generation or obtains a license from the winner
3. A new-generation leader wins the race or obtains a license from the winner
• The results have implications for antitrust policies on licensing and policies governing employee non-compete agreements
The Model
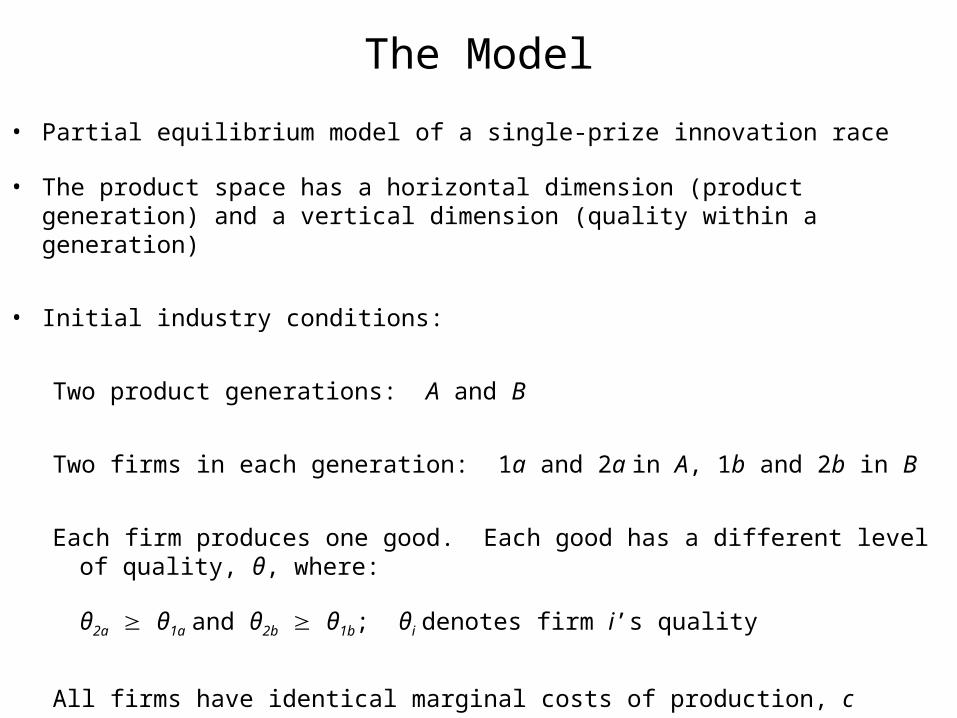
• Partial equilibrium model of a single-prize innovation race
• The product space has a horizontal dimension (product generation) and a vertical dimension (quality within a generation)
• Initial industry conditions:
Two product generations: A and B
Two firms in each generation: 1a and 2a in A, 1b and 2b in B
Each firm produces one good. Each good has a different level of quality, θ, where:
θ2a θ1a and θ2b θ1b; θi denotes firm i’s quality
All firms have identical marginal costs of production, c

Consumers
• Initially there are two groups of consumers. Some prefer goods in generation A (group A consumers) while others prefer goods in B (group B consumers)
• Each consumer purchases at most one good and may purchase none of the industry’s goods
• Consumer i in group A buys good j in generation B if doing so maximizes i’s utility:
Uij = αabθj - pj + εij
• θj and pj are the quality and price of good j, respectively
• αab is a preference parameter
• εij is an individual-specific shock

Demand
• Under standard assumptions in the discrete choice literature, the probability that a consumer in group A purchases good 1a is:
• Probabilities are similar
• na and nb are the number of consumers in group A and B
• Firm j’s profits in the initial state are:
• Firms choose prices simultaneously
bbabbbabaaaaaaaa
aaaa
pppp
p
aa eeee
e22112211
11
11,
bbbbababbabaaa 2,1,2,1,2,1,2, ,,,,,,
))((max ,,0
jbbjaajp
j nncpj

Innovation
• Generation A is old; B is young
• Beginning from the initial state, one of two possible types of opportunities for innovating occurs:
– A quality improvement in the young generation: θ3b θ2b
– The introduction of a new product generation, C (with quality θ1c). If this occurs a group of nc consumers who have no demand for A or B enter the market
• After the opportunity for innovating arrives, incumbents can enter the innovation race by paying an entry cost of fe
• In addition, new firms can enter the race. We assume new firms are spin-outs. Each incumbent can generate a single spin-out. If a spin-out forms, it pays a spin-out formation cost, fs, in addition to fe

The Race• The innovation race has three features that are standard in the literature:
1. It takes place in continuous time
2. Once one firm innovates the race is over
3. The innovation production function is memoryless
• The winner can either market the new good or license the innovation to another firm
• An incumbent marketer treats the new good as a line extension
• A firm that licenses gives up the profits from the new good in return for a one-time payment from the licensee. We assume that the licensor selects the efficient licensee in the sense that there are no further gains from trade
• If licensing occurs, the two parties divide the gains from trade (net of a transaction cost fl) according to the parameter γ

Licensing and Marketing the Innovation
• New firms never market the new good if business stealing effects are non-zero and fl is sufficiently small
• The incumbent marketer will increase the price of both its original and new goods causing the profit of every good to rise
• Numerical computations confirm that if licensing occurs, the firm that obtains the license is the one who sets the highest pI (the price of the new good)
• If we list firms in order of how high they would set pI, from highest to lowest, the firm at the top of the list is the licensee if licensing occurs
• If we begin from a high no-licensing level of fl and reduce fl, the lowest firm on the list (a new firm) licenses first, then as fl continues to fall eventually the second lowest firm licenses, and so on

The Innovation Race
• Each firm i in the race chooses its investment xi to maximize:
• Where:
r is the continuous time discount rate
t is time
hi(.) is the probability of winning the race in the next instant given that no one has won yet
Vii is the value of firm i if i wins
Vij is the value of firm i if j wins
πi0 is the value firm i receives in the initial state
0
0)(0 ])()([ dtVxhVxhxeeVij
jijj
iiiiii
txhrti
j jj

• Simplifying, we obtain:
• Maximizing Vi0 with respect to xi yields the FOC:
• The model yields the familiar replacement and efficiency effects:
and
• The replacement effect is highest for spin-outs because they have no original good
• The value terms in the efficiency effect are highest for industry leaders. They experience the highest business stealing effect if someone else markets the new product
0]))(()[()( 0
iij
ji
iijji
iiii
jjj xVVxhrVxhxhr
0i
iirV
ij
ji
iijj VVxh ))((
j jj
ij
jijj
iiiiii
i xhr
VxhVxhx
V)(
)()(0
0

Parameterization• We use information from the rigid disk drive industry to determine as many parameters as
possible
• All firms have the same innovation production function: hi(x) = x1/2 for all i. We set = .01
• fe and fs are sufficiently low that all four spin-outs form and every firm enters the innovation race
• fl = 50
• na = 100
• Relative qualities (determined using data on areal densities):
θ1a is normalized to 1, θ1b = ω * θ1a, where ω is a constant (base case: ω = 1.25)
θ2a = 2 * θ1a and θ2b = 2 * θ1b
θ3b = 1.5 * θ2b

Numerical Results
• Hypothesis are generated by:
Allowing for exogenous growth in the number of group B consumers
(increasing nb)
Improving the quality of B goods relative to A goods (increasing ω)
Approximating conditions when a new product generation is first introduced
• The effects of increasing nb on quality improvements in young generations:
nb = 1: New firms are most likely to innovate followed by the old generation leader. Licensing never occurs
As nb rises the young generation leader becomes more likely to innovate
nb = 50: The young generation leader and new firms are the most likely to innovate. Every firm licenses to the young generation leader

• The effects of increasing ω on quality improvements in young generations:
ω = 1.5: Old generation leaders are most likely to innovate followed by new firms. Licensing never occurs
ω = 1.75: Old generation leaders and new firms are still the most likely innovators. New firms license to the old generation leader
ω = 3: The young generation leader is the most likely to innovate. Every firm licenses to the young generation leader
• The effects if the innovation is a new product generation and has little impact on existing generations (nc = 1 and θ1c = θ2b):
– New firms are most likely to pioneer a new product generation followed by the laggards in each generation
– No licensing occurs
• A “know-how effect” could affect who wins the race by changing the innovation production function

Testable Hypotheses
Improvements in young product generations:
Hypothesis 1: Old and young generation leaders are the most likely incumbents to improve quality in the young generation
Hypothesis 2: Old generation leaders are more likely to innovate in the young generation early on
Hypothesis 3: Old generation leaders are more likely to innovate in the young generation when the quality in the young generation is relatively low compared to the quality in the old generation
The introduction of new product generations:
Hypothesis 4: New firms and industry laggards are the most likely pioneers of new product generations

New firm success vs. failure:
Hypothesis 5: Exit without licensing or marketing is associated with failure to innovate
Hypothesis 6: New firms are more likely to fail when attempting to improve quality in mature product generations
Hypothesis 7: Spin-outs are more likely to succeed than other new firms (due to the know-how effect)
New firm licensing vs. marketing (conditional on success):
Hypothesis 8: New firms are more likely to become large manufacturer-marketers if they pioneer a new product generation or improve quality early on in a young generation; they are more likely to license or be acquired if they improve quality in a mature generation
The role of licensing over a generation’s life:
Hypothesis 9: Licensing early on is associated with entry into the young generation
Hypothesis 10: Licensees are likely to be large manufacturer-marketers

Data
Disk/Trend Report on Rigid Disk Drives (1977-1997)
• 193 firms, 1189 firm/years, 11644 model/years
• Model characteristics, introduction dates, and annual firm-level sales
• We measure quality using the areal density (MB/(inches2)) of the firm’s best drive in each diameter. We compute z-scores in each diameter-year category
• Spin-outs are identified using several sources
• License and acquisition information is obtained from the Disk/Trend Report and press releases from Lexis-Nexis

Improvements in Young Product Generations
• We divide incumbents into old generation firms and young generation firms for each adjacent-diameter pair: 14” & 8”, 8” & 5.25”, 5.25” & 3.5”, 3.5” & 2.5”, 2.5” & 1.8”
• Firms that produced:
– The Young Generation in the previous year are coded YPG
– The Old Generation in the previous year are coded OPG
– Both Generations in the previous year are coded BOTH
• Firms that produced neither are left out of the analysis of the pair
• An innovator is a firm that introduces a higher areal density drive than the highest areal density drive in the diameter in the previous year

Independent Variables
• The firm’s quality in the previous year
• Age of the young generation
• To compare relative qualities, we compute the megabytes associated with the highest areal density drive in each generation each year. Then we compute a ratio:
for each old/young pair in each year
• As control variables, we include dummy variables for young and old generation firms and year effects
OPGYPG
YPG
MBMB
MB

The dependent variable takes the value 1 if the firm introduces a young generation drive with a higher areal density than last year’s best drive in the diameter Probit Model Equation 1 Marginal Effects Constant -0.16*** YPG Dummy -0.070* OPG Dummy 0.017 YPG * Lagged Quality 0.037*** OPG * Lagged Quality 0.014* BOTH * Lagged Quality 0.039*** YPG * Lagged Diameter Age -0.0063** OPG * Lagged Diameter Age -0.023*** BOTH * Lagged Diameter Age 0.018** YPG * Lagged Megabyte Ratio 0.33*** OPG * Lagged Megabyte Ratio -0.074 BOTH * Lagged Megabyte Ratio 0.083 Number of Observations 1934 Log Likelihood -440.49 *, **, and *** indicate significance at the 10%, 5%, and 1% levels Year Dummies are included with 1983 as the base year
Introduction of New Product Generations
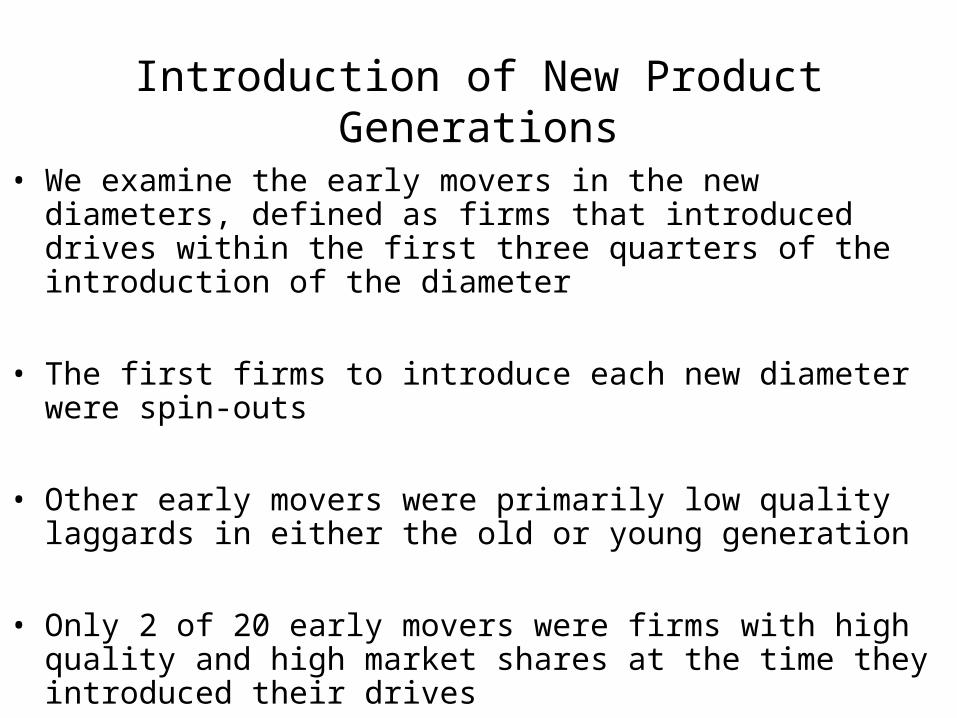
• We examine the early movers in the new diameters, defined as firms that introduced drives within the first three quarters of the introduction of the diameter
• The first firms to introduce each new diameter were spin-outs
• Other early movers were primarily low quality laggards in either the old or young generation
• Only 2 of 20 early movers were firms with high quality and high market shares at the time they introduced their drives

New Firm Success vs. Failure
• The dependent variable takes the value 1 if the new firm achieves success by becoming a large manufacturer-marketer or licensing to a large manufacturer-marketer
• Large manufacturer-marketers are firms that achieve drive sales in excess of $50 million 1983 dollars for at least three years
• Independent variables:
Quality of the firm’s first drive
The age of the product generation of the firm’s first drive
A spin-out dummy

The dependent variable takes the value 1 if the entrant becomes a large manufacturer-marketer or sells technology Probit Model Equation 2 Marginal Effects Constant -0.042 Initial Quality 0.081* Generation Age -0.11*** 14” Generation Age -0.064 Spin-Out 0.25* Number of Observations 63 Log Likelihood -31.62 *, **, and *** indicate significance at the 10%, 5%, and 1% levels

The dependent variable takes the value 1 if the entrant becomes a large manufacturer-marketer, and 0 if it sells technology – failures are excluded Probit Model Equation 2 Marginal Effects Constant 0.23 Initial Quality 0.0023 Generation Age -0.14 14” Generation Age -0.041 Spin-Out 0.11 Number of Observations 22 Log Likelihood -13.21
The Role of Licensing
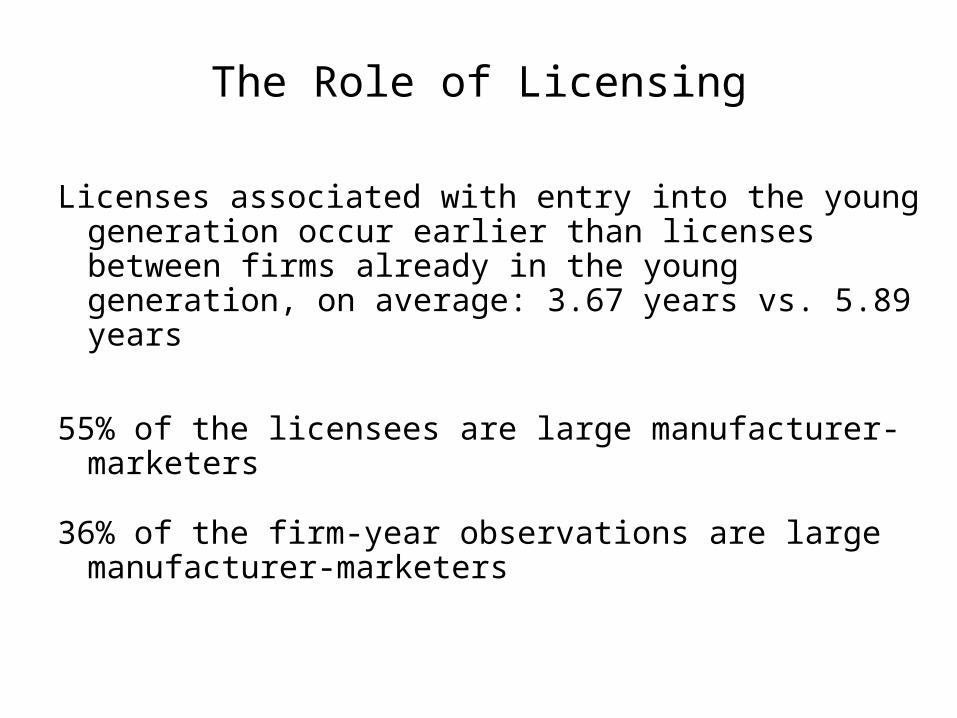
Licenses associated with entry into the young generation occur earlier than licenses between firms already in the young generation, on average: 3.67 years vs. 5.89 years
55% of the licensees are large manufacturer-marketers
36% of the firm-year observations are large manufacturer-marketers

Antitrust Policies Governing Licensing
• Antitrust policy occasionally limits licensing from potential product-market entrants to incumbents on the grounds that entry would improve product-market competition
• In our model, the welfare impacts of such policies depend on how they affect entry into the innovation race
• If allowing licensing induces entry into the race, then industry investment rises; the social benefit of faster innovation may outweigh the loss from market power in the product market
• Considering relative bargaining power yields another policy conclusion that is counter to the current approach:
U.S. Antitrust agencies view high payments from the licensee to the licensor as a sign that the licensor could have entered the product market
Our model suggests that licensing agreements where the licensor obtains a higher percentage of the gains from trade may be associated with more competition in the innovation race, greater investment in innovation, and higher welfare
The licensor with more bargaining power can appropriate more profits for itself, and this yields greater incentives to enter the race and invest

Policies Governing Employee Non-Competes
• A non-compete agreement prevents an employee from leaving an employer and competing in the same business as the employer for a particular period of time in a certain geographical location
• A small minority of states do not enforce non-competes
• The vast majority of spin-outs in the rigid disk drive industry were initially located in California, the most prominent non-enforcer. Thus, the rigid disk drive industry illustrates what can happen if employee mobility is allowed
• Most spin-outs who grew to become large manufacturer-marketers were pioneers of new product generations or early followers
• The presence of a non-compete and the possibility of its enforcement may deter employees from founding firms even when they do not intend to compete directly with their parents
Conclusion
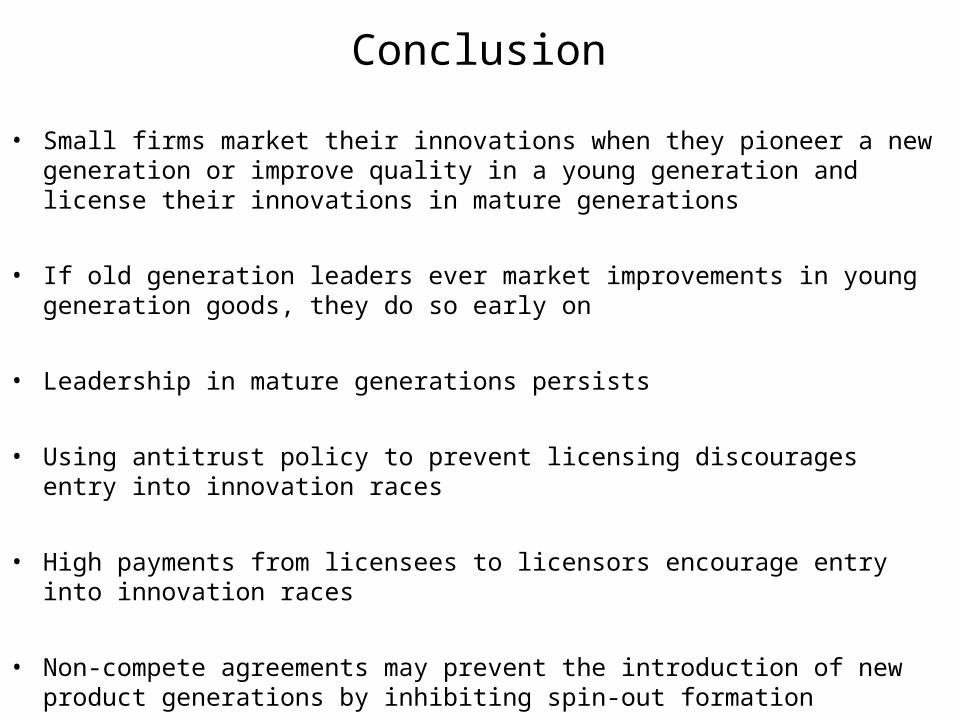
• Small firms market their innovations when they pioneer a new generation or improve quality in a young generation and license their innovations in mature generations
• If old generation leaders ever market improvements in young generation goods, they do so early on
• Leadership in mature generations persists
• Using antitrust policy to prevent licensing discourages entry into innovation races
• High payments from licensees to licensors encourage entry into innovation races
• Non-compete agreements may prevent the introduction of new product generations by inhibiting spin-out formation