Embed Size (px)
Citation preview
Strategic Management/Business Policy
Competitive Dynamics: Real
Options
Power Point Set 9b
Competitive Dynamics
Competitive dynamics: results from a series of competitive actions and competitive responses among firms competing within a particular industry.
Mutual interdependence: results when companies recognize that their strategies are not implemented in isolation from their competitors’ actions & responses.
E.g., Coke versus Pepsi
2

Competitive Dynamics
A first mover is a firm that takes an initial competitive action.
Successful actions allow a firm to earn above-average economic returns until other competitors are able to respond effectively. In addition, first movers have the opportunity to gain customer loyalty.
• For instance, Harley-Davidson has been able to maintain a competitive lead in large motorcycles due to intense customer loyalty.

Competitive Dynamics
A first mover faces potential disadvantages:
• High risk;
• High development costs; and
• High demand uncertainty
4

Competitive Dynamics
A “second mover” is a (second, third, fourth, etc.) firm that responds to a first mover’s competitive action often through imitation or a move designed to counter the effects of the initial action.
BankOne was a fast second mover in Internet banking.
New Balance is a successful second mover in the athletic shoe industry.
5

Competitive Dynamics
Second mover advantages include:
Reduction in demand uncertainty;
Market research to improve satisfying customer needs;
Learn from the first mover’s successes and shortcomings; and
Gaining time for R&D to develop a superior product.
6
Scenario Analysis -The Relationship Between Finance & Strategy
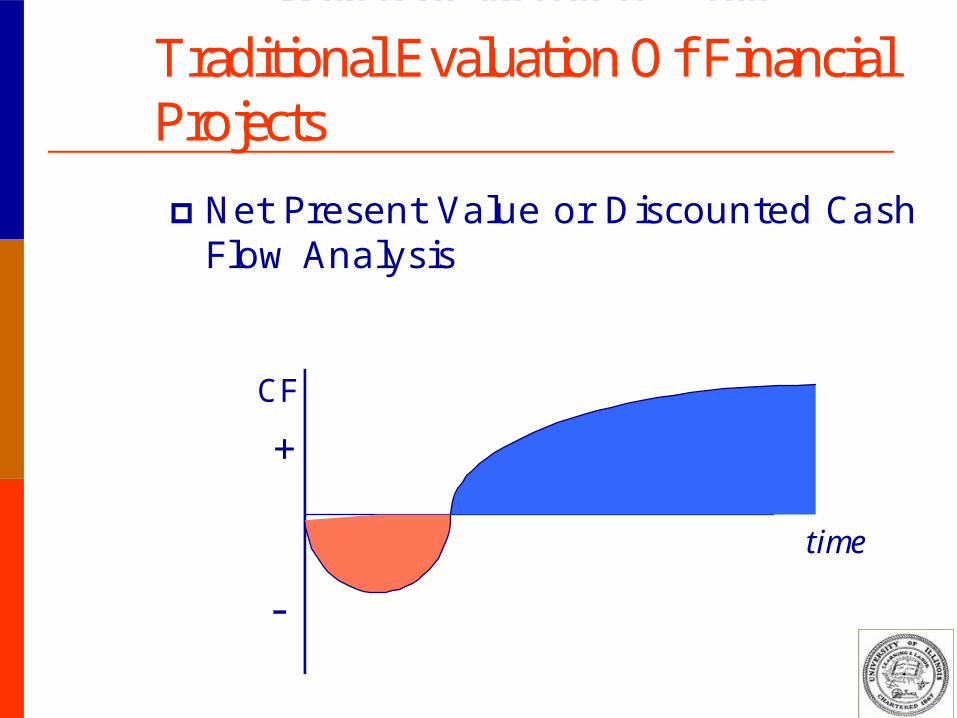
Traditional Evaluation Of Financial Projects
Net Present Value or Discounted Cash Flow Analysis
time
CF
+
-
Traditional Evaluation Of Financial Projects
Net Present Value or Discounted Cash Flow Analysis
time
CF
+
-

22
3 Basic Factors Determine 3 Basic Factors Determine C/S Market ValueC/S Market Value
1) Amount of1) Amount of
2) Timing of2) Timing of
3) Risk of3) Risk of
Expected cash flows
Discounting Cash Flows
NPV =CF1
1+r +CF2
(1+r)2 +CF3
+ …CFt
+ +
Horizon Valuet+1
NPV: Net Present Value
CFt: Cash Flow at time t
r: Discount rate
Horizon Value: Value of ongoing enterprise after time t
(1+r)3 (1+r)t (1+r)t+1
Scenario Analysis -The Relationship Between Finance & Strategy
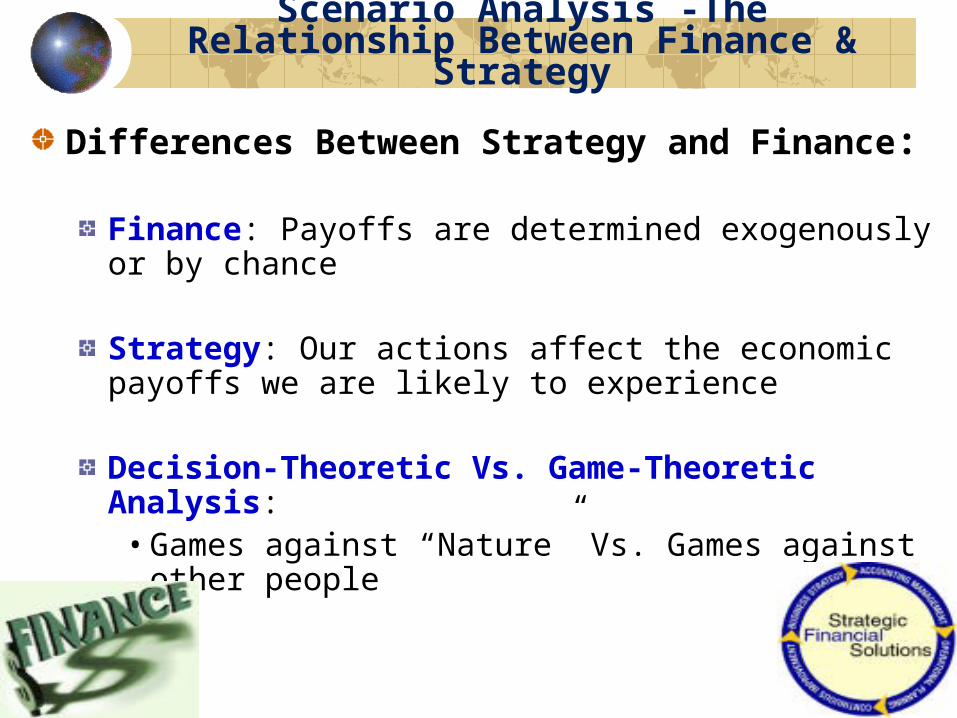
Differences Between Strategy and Finance:
Finance: Payoffs are determined exogenously or by chance
Strategy: Our actions affect the economic payoffs we are likely to experience
Decision-Theoretic Vs. Game-Theoretic Analysis:• Games against “Nature” Vs. Games against other
people

©The McGraw-Hill Companies, Inc.,2001
8- 6
Irwin/McGraw-Hill
How To Handle Uncertainty
Sensitivity Analysis - Analysis of the effects of changes in sales, costs, etc. on a project.
Scenario Analysis - Project analysis given a particular combination of assumptions.
Simulation Analysis - Estimation of the probabilities of different possible outcomes.
Break Even Analysis - Analysis of the level of sales (or other variable) at which the company breaks even.

Trigeorgis (1997): Real Options
A theoretically-accurate NPV analysis should include real options values.
The asymmetry deriving from having the right but not the obligation to exercise an option is at the heart of the real options value.
Managers making investments under uncertainty can create economic value by building in flexibility, because flexibility has economic value.
• Real Options: Managerial Flexibility and Strategy in Resource Allocation

12
Defer
Expand or contract
Abandon
Switch inputs or outputs
Grow
To wait before taking an action until more is known or timing is expected to be more favorable
To increase or decrease the scale of an operation in response to demand
To discontinue an operation and liquidate the assets
To commit investment in stages giving rise to a series of valuations and abandonment options
To alter the mix of inputs or outputs of a production process in response to market prices
Stage investment
To expand the scope of activities to capitalize on new perceived opportunities
ExamplesDescriptionOption
Adding or subtracting to a service offering, or adding memory to a computer
When to introduce a new product, or replace an existing piece of equipment
Discontinuation of a research project, or product/service line
Staging of research and development projects or financial commitments to a new venture
The output mix of telephony/internet/cellular services
Extension of brand names to new products or marketing through existing distribution channels

Real Options
Nucor Steel Mini-mill
• Stand-alone investment: NPV = -$50 million
– Abandonment Option: High (Low sunk cost)
– Growth Option: High (Follow-on investments)
13

Commitment Versus Flexibility -The Value of Time
Cost to Build Plant = $1600
Cost of Capital = 10%
Price(t=1) = $100
Price(t=0) = $200
Price(t=1) = $300
.5
.5
Price = $100
Price = $300
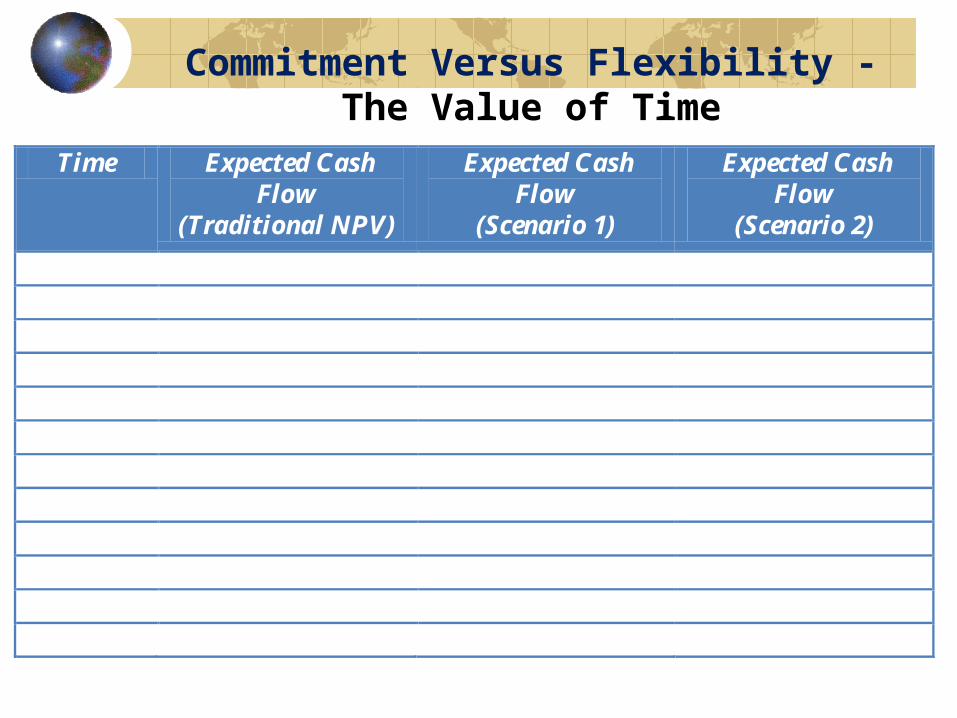
Commitment Versus Flexibility -The Value of Time
Time Expected Cash Flow
(Traditional NPV)
Expected Cash Flow
(Scenario 1)
Expected Cash Flow
(Scenario 2)
0 $ (1,400) $ - $ - 1 $ 200 $ (1,300) $ (1,500) 2 $ 200 $ 300 $ 100 3 $ 200 $ 300 $ 100 4 $ 200 $ 300 $ 100 5 $ 200 $ 300 $ 100 6 $ 200 $ 300 $ 100 7 $ 200 $ 300 $ 100 8 $ 200 $ 300 $ 100
Infinity $ 200 $ 300 $ 100
NPV $ 600 $ 1,545 $ (455)

Build now (classic NPV) versus value of waiting
NPV calculation ($1400) in year 0 .5($300) + .5($100)
= $200 for each year after
Value of $200 perpetuity=$2000
Expected NPV ($1400) + $2000=$600
Waiting Year 0 = $0 Scenario 1 (price = $300)
Yr. 1=($1300) Perpetuity of $300 NPV =$1545
Scenario 2 (price = $100) Yr. 1=($1500) Perpetuity of $100 NPV =($455)
NPV of waiting: .5($1545) + .5(0) = $773

Value of waiting one period
Expected value of building the plant in period 0 = $600
I f the firm waits a year, the uncertainty is resolved, and the firm will undertake the investment only if the price is $300
By waiting a year, the firm’s expected value is (1545*0.5 + 0* 0.5) =$773, as opposed to $600
Value of the option = 773 – 600 = $173

Competencies and Strategic Flexibility
Strategic flexibility is analogous to “having options” and commitment is analogous to the “exercise of an option.”
The greater the uncertainty the firm faces, the more valuable are its real options.
The resolution of uncertainty over time is the catalyst which induces a manager to make (sunk cost) commitments.
18
Competencies and Strategic Flexibility
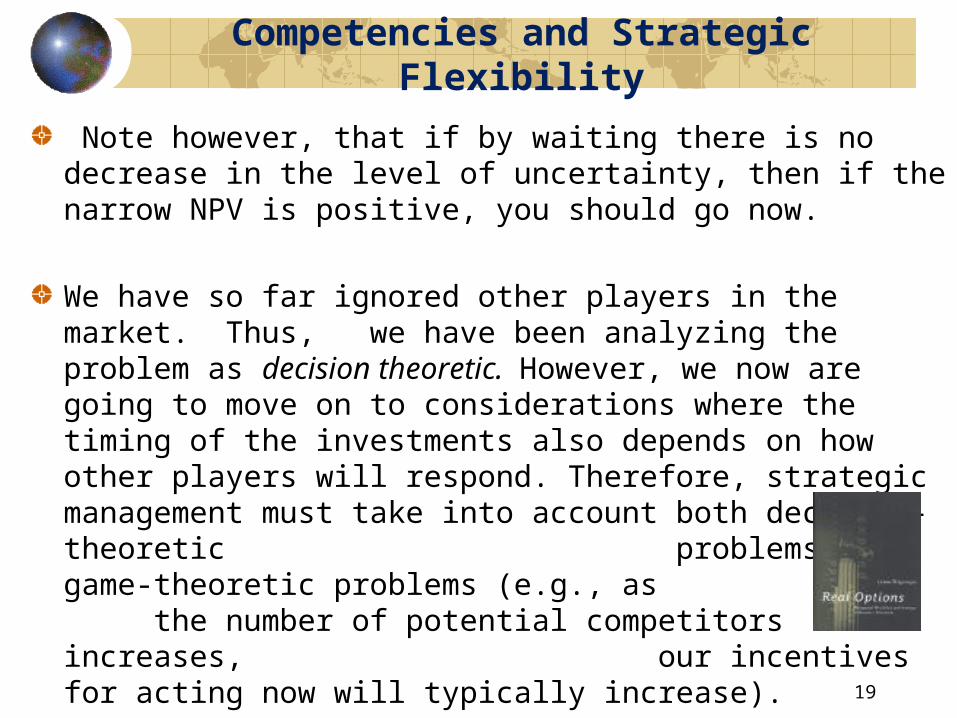
Note however, that if by waiting there is no decrease in the level of uncertainty, then if the narrow NPV is positive, you should go now.
We have so far ignored other players in the market. Thus, we have been analyzing the problem as decision theoretic. However, we now are going to move on to considerations where the timing of the investments also depends on how other players will respond. Therefore, strategic management must take into account both decision-theoretic problems and game-theoretic problems (e.g., as the number of potential competitors increases, our incentives for acting now will typically increase).
19
9
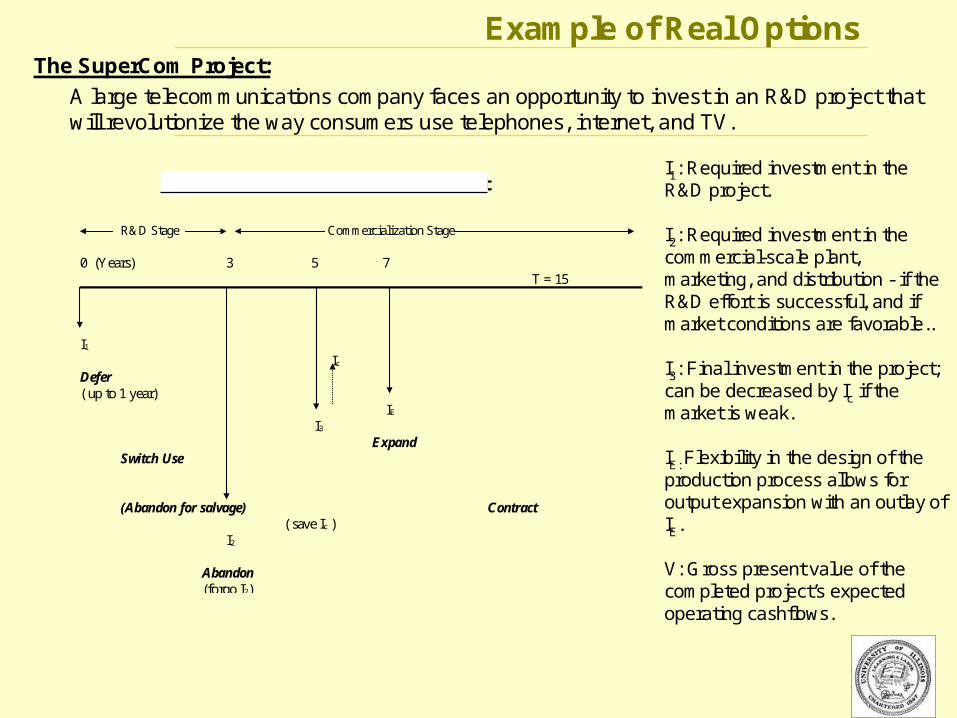
Example of Real Options The SuperCom Project:
A large telecommunications company faces an opportunity to invest in an R&D project that will revolutionize the way consumers use telephones, internet, and TV.
Real Options in the SuperCom Project
R&D Stage Commercialization Stage
0 (Years) 3 5 7 T = 15
I1
Ic
Defer( up to 1 year)
IE
I3
ExpandSwitch Use
(Abandon for salvage) Contract( save Ic )
I2
Abandon(forgo I2)
I1: Required investment in the R&D project.
I2: Required investment in the commercial-scale plant, marketing, and distribution - if the R&D effort is successful, and if market conditions are favorable..
I3: Final investment in the project; can be decreased by Ic if the market is weak.
IE: Flexibility in the design of the production process allows for output expansion with an outlay of IE.
V: Gross present value of the completed project’s expected operating cashflows.