Embed Size (px)
Citation preview

Strategic Non-disclosure of Major Customer Identity
Herita Akamah
Michael F. Price College of Business
University of Oklahoma
I appreciate my dissertation chair, Wayne Thomas, for his patience and guidance. I am grateful to my
dissertation committee (Ervin Black, Karen Hennes, Dipankar Ghosh, and Qiong Wang), Scott Judd, Ole-
Kristian Hope, the 2014 American Accounting Association (AAA) Deloitte Foundation/J. Michael Cook
Doctoral Consortium group 11 participants, and Mary Barth (consortium faculty group leader) for their
insightful feedback. I also thank Jaehan Ahn, Bryan Brockbank, Matthew Cobabe, Sydney Shu, 2015
University of Oklahoma workshop participants, 2015 AAA annual meeting conference participants, and
David Koo (conference discussant) for their valuable comments.

Strategic Non-disclosure of Major Customer Identity
Abstract
This study investigates firms’ decision to withhold the identity of their major customers. I first document
that the extent of private firms in the industry (private firm intensity) relates positively to non-disclosure of
major customer identity. I next determine whether these results are motivated by competitive cost or
agency cost concerns. Consistent with competitive cost concerns, the relation between private firm
intensity and non-disclosure increases when operations involving major customer relationships are highly
profitable. In addition, consistent with agency cost concerns, the positive relation between private firm
intensity and non-disclosure increases when operations involving major customers are highly unprofitable.
While disclosure of customer identity is mandated by the SEC, firms with unprofitable customer
relationships appear better able to conceal these identities (i.e., to avoid disclosure requirements) by using
the excuse of competitive harm from private firm intensity. As further evidence of agency cost, non-
disclosure is increasing when major customers are better able to extract rents and when managers have low
ability. As a final test, I find that non-disclosure of customer identity delays investors’ ability to assess the
impact of customer distress on the supplier’s firm value. Results from this study demonstrate the important
role that private firm intensity and customer relationship profitability jointly play in corporate disclosure
decisions.
Keywords: Major Customers, Disclosure, Private firm intensity, Agency Costs, Proprietary Costs,
Customer Bankruptcy, Customer Distress

1
Strategic Non-disclosure of Major Customer Identity
1. Introduction
Firms often claim that competitive harm from disclosure is more severe when they face private
competitors (i.e., when private firm intensity is high). Theories on informational herding and strategic
disclosures in competitive environments support these claims (e.g., Dye and Sridhar 1995 and Gigler,
Hughes, and Rayburn 1994). Specifically, firms have incentives to conceal information that can help
competitors, especially private firms who are not required to provide similar disclosures. From a practical
standpoint, private firm intensity is important because regulators more seriously consider firms’ claims
about competitive harm when this potential harm emanates from privately-held competitors. For example,
Issue #4 of the SFAS 131 Exposure Draft of 1997 dealt exclusively with complaints related to private
firm intensity. Currently, similar claims are delaying the implementation of Section 1504 of the 2010
Dodd Frank Act. Overall, firms facing high private firm intensity prefer non-disclosure due to competitive
harm concerns (proprietary cost, hereafter, referred to as the “PC motive”).
However, non-disclosure may be affected by an alternative motive. Specifically, when the
percentage of private firms is high, managers may more likely use the excuse of competitive harm to hide
unfavorable news (agency cost, hereafter, referred to as the “AC motive”). Consistent with this
perspective, prior literature states that “a plausible proprietary cost motive is necessary for the agency cost
motive to potentially exist” (Bens, Berger and Monahan 2011, pg. 418). Also, some critics claim that
firms use the excuse of competitive harm in the presence of private firm intensity when disclosure would
reveal unfavorable news. For example, investor Richard Roe recently made this claim following Yongye
International’s “competitive harm” explanation for non-disclosure of major customer names (Roe 2011).1
Therefore, non-disclosure in the face of high private firm intensity does not unambiguously identify firms
with high proprietary costs, yet numerous firms use claims of competitive harm from high private firm
intensity to obtain exemptions from mandatory disclosure requirements. I collect sales data on over one
1 Major customer refers to any customer whose existence is acknowledged by the firm in its 10-K segment reporting
footnote and/or customer concentration disclosure. The “firm” refers to the supplier.

2
million U.S. private firms and disentangle these competing explanations (agency versus proprietary cost)
for why firms with private rivals prefer not to disclose the identity of major customers.
Specifically, I distinguish firms whose non-disclosure decisions are likely motivated by
competitive harm concerns (i.e., revealing proprietary information to competitors) from those likely
motivated by concerns about the negative consequences of bad news revelation (i.e., revealing
unfavorable information to external monitors). The major customer disclosure setting is particularly
suited to this research question for four key reasons. First, the rules governing the disclosure of major
customer name provide managers with sufficient discretion. Specifically, U.S. Securities and Exchange
Commission (SEC) Regulation S-K requires firms to disclose the name of customers that generate 10% of
consolidated sales, but non-disclosure is acceptable if managers perceive the customers to be immaterial.
In practice, firms frequently acknowledge that major customers exist, but they choose not to disclose their
names (average of 42% within my sample).2
Second, there is no uncertainty about managers’ information endowment within the major
customer name disclosure setting. Firms acknowledge the existence of major customers such that the
absence of a customer’s name precisely reflects customer name concealment. In other disclosure contexts,
it is often unclear whether non-disclosure is due to strategic withholding or due to lack of reportable
information. Third, customer name disclosures are informative to both competitors and external monitors.
A customer’s name is typically disclosed with financial information that is informative about the
profitability and risks associated with the specific customer. For example, linking the customer to a
business and a geographic segment potentially provides information about segment-level profitability,
cost of goods sold, and research and development expenditures. Stakeholders can predict future levels and
2 Ellis, Fee, and Thomas (2012) study the effect of proprietary costs on firms’ decisions to withhold the names of
major customers. They report that 28% of the major customers in their 1976-2006 sample are not identified by
name. Concealment of a major customer’s name does not necessarily constitute non-compliance with major
customer disclosure rules because the 10% threshold is not a sufficient condition for determining a reportable
customer. Managers must also determine whether the loss of the customer would have a material adverse effect on
the firm. Because managers can exercise considerable discretion in defining the materiality of a customer’s effect,
observed major customer disclosures are somewhat voluntary.

3
the riskiness of the major customer segment cashflows by analyzing the customer’s financial statements,
press releases, credit ratings, analyst reports etc.
Fourth, these stakeholders significantly rely on suppliers’ 10-Ks to determine customer identity
and the associated financial information. To illustrate, out of a sample of 188 customers that are not
identified by name in Compustat, Ellis, Fee and Thomas (2012) are only able to discern the identities of
10 customers after a detailed search in Factiva.com and SEC filings. Also, business credit reporting
agencies such as Experian or trade associations are only able to reveal voluntarily reported major
customer relationships.3 Even when stakeholders can determine major customer identity from external
sources, their ability to perform meaningful analysis is restricted in the absence of major customer
disclosures: in this instance, the financial numbers reported in 10-Ks are not easily traceable to specific
customers. Overall, the major customer name disclosure setting is ideal for examining whether firms with
high private firm intensity withhold disclosures to mitigate proprietary or agency costs.
Relative to suppliers with dispersed customers, those in major customer relationships often
sacrifice profit margins for economies of scale (Irvine, Park, and Yildizhan 2014). However, despite this
norm, some suppliers in major customer relationships are still able to negotiate trade terms that yield high
financial performance. A major customer relationship can yield higher financial performance and
consequently have higher proprietary costs when it enhances working capital management and facilitates
streamlined supplier production processes (Kalwani and Narayandas 1995; Kinney and Wempe 2002;
Patatoukas 2012). I consider major customer relationships to have high proprietary costs when (1) the
supplier reports high profits relative to firms in the same industry (top quartile), and (2) the supplier
derives at least 20% of its sales from major customers.4
3 Of the more than 500,000 suppliers extending credit, only about 10,000 report (http://www.experian.com/small-
business/building-small-business-credit.jsp). I am unable to determine whether only firms that disclose major
customer names report customer information to Experian. 4 Identifying proprietary costs using benchmarked profitability is consistent with extant literature, trade
organizations, and courts (e.g., Li, Lundholm, and Minnis 2013; Hoberg and Phillips 2015). Requiring customers to
account for at least 20% of sales ensures that customers are responsible for a significant portion of firm performance
and in turn, capable of altering disclosure decisions. As the choice of 20% is somewhat arbitrary, I evaluate
sensitivity of results to alternative cutoffs of 15% and 25% and to eliminating the 20% condition.

4
Conversely, I consider major customer relationships to have high agency costs when (1) the
supplier reports low profits relative to firms in the same industry (bottom quartile), and (2) the supplier
derives at least 20% of its sales from the relationships. Consistent with economic theory, I perceive
agency problems of major customer relationships to arise when managers make decisions regarding major
customers that do not meet stakeholders’ goal of firm profit maximization. These poor decisions might be
due to low managerial ability (e.g., inability to win deals with non-rent extracting customers) or diversion
of resources for private gain (Grossman and Hart 1980; Lambert 2001). For example, low profits can arise
when suppliers, which are often smaller than their major customers, depend heavily on a few major
customers for survival. Prior research finds that major customers constitute an average of 35% of a
dependent supplier’s total sales, but those sales represent only 1% of a major customer’s cost of goods
sold (Hertzel, Li, Officer, and Rodgers 2008; Cen, Dasgupta, and Sen 2012). 5 Dominant customers can
extract rents by demanding negative net present value customer-specific investments and steep price cuts
of their suppliers. Customer name disclosure can better reveal that current low profits are not due to
circumstances beyond managerial control, and will likely persist in the future because these profits are
sourced from powerful rent-extracting customers.
I devise a test which distinguishes the proprietary cost and agency cost motives for non-disclosure
of major customer identity when firms face high private firm intensity. I partition my sample into three
groups: firms with highly profitable major customer relationships (PC-motive sample), firms with highly
unprofitable major customer relationships (AC-motive sample), and control firms with neither strong PC
nor AC motives (hereafter referred to as the “Base” sample). I use S&P Capital IQ, U.S. Census, and
LexisNexis Academic to collect sales and location data on over one million U.S. privately-held firms.
Using Compustat Customer file, I identify 32,734 unique major customer identity-labels and manually
distinguish named from unnamed customers. The final sample consists of 20,314 firm-years (3,866 firms)
from 1999 to 2013. I expect the percentage of private firms within the industry to relate positively to non-
5 As an example of agency concerns in a supplier’s customer relationship, GT Advanced Technology, a supplier
heavily dependent on Apple, recently filed for bankruptcy following Apple’s stringent contract requirements and
refusal to make an installment payment (Business Insider 2014).

5
disclosure of customer names, and this relation to become stronger for both the PC-motive and AC-
motive samples compared to the Base sample.
I find three main results. First, I establish that non-disclosure of major customer names relates
positively to the percentage of private firms in the industry. This result is consistent with either a
proprietary cost explanation or an agency cost explanation. The second main result is that the positive
association between non-disclosure of major customer names and private firm percentage is stronger
within the PC-motive sample relative to the Base sample. This result is consistent with a proprietary cost
explanation. Specifically, when customer relationships are highly profitable, firms with high private firm
percentage are more likely to conceal customer identity to protect the source of high profits from
competitors.
The third main result is that the positive relation between non-disclosure of major customer
names and private firm percentage is also stronger within the AC-motive sample relative to the Base
sample. When customer relationships are highly unprofitable, firms tend not to disclose the identity of
their major customers as the percentage of private firms increases. These results are not consistent with
proprietary cost concerns of hiding abnormally high profits. Instead, the results are consistent with
managers concealing agency costs from having an unprofitable relation with a major customer. Firms are
more likely able to use competitive harm as an excuse to avoid SEC mandated disclosure when the
percentage of private firm intensity is high. All results are robust to the use of several measures of private
firm competition, the use of alternative measures of customer relationship profitability, and additional
control variables.
I next explore the mechanisms underlying agency cost motives for non-disclosure of customer
name. Specifically, I determine whether the agency cost motive is more pronounced when there are
greater opportunities for major customers to extract rents. Accordingly, I find that the agency cost results
are more pronounced when suppliers: operate in durable goods industries, invest in more relationship-
specific investments, have low market share, are easily replaceable with other suppliers, and suffer from
greater financial distress. I also examine whether the motive is more prominent when major customer
6
relationship unprofitability is more attributable to low managerial ability rather than to circumstances
beyond managerial control. Consistent with agency cost-motivated non-disclosure, I find that results are
more pronounced when suppliers have lower managerial ability. These results help to alleviate concerns
about omitted variable bias because it becomes harder to justify why any omitted variable would explain
both the main results and the economic mechanisms underlying the results.
In another additional test, I examine the relation between non-disclosure of customer name and
supplier abnormal returns around customer distress announcements. This test provides novel evidence on
the supplier stock price implication of non-disclosure of major customer identity. Customer distress has
negative future cash flow implications for a customer and its supplier. Upon customer distress, suppliers
face a higher probability of a sharp profit decline and high switching costs from terminated customer
relationships. Hence, both suppliers and customers experience negative abnormal returns around customer
distress events (Hertzel, Li, Officer and Rodgers 2008). However, non-disclosure of customer identity is
expected to impair investors’ ability to timely determine these potential cash flow implications. If non-
disclosure does hinder investors’ ability to know major customer identities, then I predict the positive
relation between customer abnormal returns and supplier abnormal returns around customer distress
events is weaker with non-disclosure of customer name.
I use post-distress mandatory disclosure of major unsecured creditors in bankruptcy filings to
determine customers that were unnamed around pre-bankruptcy distress events (using S&P Capital IQ
bankruptcy database). Specifically, a customer announces distress at time t, and then at some point in the
future, the customer’s supplier is named as a major unsecured creditor in a bankruptcy filing. I extract the
supplier’s name from bankruptcy filings and backtrack to time t to determine whether the supplier had
disclosed the name of the bankrupt firm as a major customer. I find that while customer and supplier
cumulative market-adjusted returns around customer distress announcements exhibit a significantly
positive association, this association is weaker for suppliers that did not disclose the identity of their
major customers. This result provides evidence that outsiders cannot readily determine names of
undisclosed customers and that non-disclosure of customer name is costly to investors.
7
This study makes at least three contributions. First, the results are useful for evaluating
constituents’ response to SEC comment letters and standard setters’ exposure drafts, which are often
based on competitive harm. I find that even when rules do not allow for competitive harm exceptions,
firms facing private competitors use discretion to withhold information. Most importantly, I document
conditions under which non-disclosure given private firm intensity does not necessarily imply high
proprietary costs but instead indicates high agency costs. Consequently, for the first time, I provide
empirical evidence on investors’ speculation that non-disclosure of major customer name is designed to
hide unprofitable decisions regarding major customers (e.g., Roe 2011). The direct implication of this
finding for regulators, auditors, and investors is that they can better identify firms using private firm
intensity as an excuse for non-disclosure and demand more competitive harm proof from such firms. This
implication extends to ongoing SEC efforts to implement Section 1504 of the 2010 Dodd Frank Act,
which would require project-level disclosures of firms in the extractive industries. It is timely as the SEC
evaluates numerous claims that project-level disclosures of financial items would put companies at a
competitive disadvantage with private companies that are not required to make similar disclosures (SEC
2015).6
Second, the results highlight a potential unintended consequence of conflicting U.S. GAAP
versus SEC rules. SFAS 131 states that “firms need not disclose the name of the customer” whereas SEC
Reg S-K requires disclosure of the name. Evidence of a strong affinity for non-disclosure of customer
information by firms in unprofitable customer relationships suggests potentially costly, selective
divergence of practice when rules conflict. I illustrate evidence of these costs by providing evidence that
non-disclosure impairs investors’ ability to timely assess the impact of customer distress on supplier firm
value.
Third, this study extends three main literature streams. First, it extends studies that infer a
proprietary cost explanation from the positive relation between private firm percentage and non-
disclosure (e.g. Bens, Berger, and Monahan 2011 and Ali, Klasa, and Yeung 2014). I document that
6 https://www.sec.gov/comments/df-title-xv/resource-extraction-issuers/resource-extraction-issuers.shtml

8
agency costs are an additional explanation for this relation, implying that private firm percentage is not a
clear-cut proxy for proprietary costs. Second, this study contributes to studies on the relation between
proprietary costs, agency costs and corporate disclosures. To my knowledge, the study by Ellis, Fee, and
Thomas (2012) is the first and only study that examines motives for customer name disclosures. Their
study focuses only on proprietary costs. I extend this research to agency cost-motivated non-disclosure.
Third, I build upon emerging studies that examine supplier stock price response to named major customer
events (e.g., Hertzel, Li, Officer and Rodgers 2008). Distinct from these studies, I study customer distress
events using an approach that allows me to discern unnamed major customers (i.e., using ex-post
mandatory disclosure of customer identity). Examination of both named and unnamed customers enables
me to provide, for the first time, direct evidence on supplier stock price implications of not identifying a
major customer.
2. Regulatory Background and Hypothesis Development
2.1. Regulatory Background
SEC Regulation S-K and SFAS 131 (now ASC 280) govern major customer disclosures. SEC
Regulation S-K requires firms to disclose the existence, identity, relationship with, and sales to any
customer that comprises at least 10% of a firm’s consolidated sales revenues if the loss of the customer
would have a material adverse impact on the firm.7 This rule also requires firms to identify the segment(s)
making the sale to the major customer. Because SFAS 131 requires firms to disclose profits, sales, and
assets for each identified segment, this information is also assigned to a major customer when the
customer is identified with the segment. The main difference between Regulation S-K and SFAS 131 is
that the latter rule does not require firms to disclose the name of their material customers.
7 For a more precise description of the SEC’s regulations regarding major customer disclosures, see Regulation S-K
subpart 229.101 available at http://www.ecfr.gov/cgi-bin/text-idx?node=17:3.0.1.1.11&rgn=div5#se17.3.229_1101.
Also, see excerpts of the relevant rules on page 721 of Ellis, Fee and Thomas (2012).

9
In practice, firms frequently acknowledge major customers but choose to conceal their names
(average of 42% within my sample). The following are examples of non-disclosure and disclosure of
customer names from Sevcon’s 2006 10-K and 2013 10-K, respectively:
“In fiscal 2006 Tech/Ops Sevcon's largest customer accounted for 17% of sales …”
“In 2013 Sevcon, Inc.'s largest customer, Toyota Group, accounted for 10% of sales...”
One possible reason for non-disclosure is that U.S. GAAP and SEC rules conflict on the
requirement to disclose customer names. Regulation S-K requires customer name disclosure while SFAS
131 does not. Moreover, disclosure is required under Regulation S-K only if management determines that
the customer is material to the firm, providing managerial discretion as to the “materiality” threshold of
disclosure. Furthermore, firms often believe that non-disclosure of relevant information is acceptable if
disclosure would result in competitive harm. This perception is likely enhanced by the SEC’s provision of
competitive harm exceptions for some rules (Thompson 2011). I focus on firms’ incentives to conceal
customer name when they face many private competitors.
2.2. Private Firm Intensity and Non-disclosure
Models of informational herding and strategic disclosures in competitive environments predict
that as more firms choose not to disclose information, the more likely it is that industry rivals will choose
not to disclose information. For example, in Dye and Sridhar (1995), managers mimic the disclosure
policy of rivals in order to mitigate negative payoff externalities such as downward stock price revisions.
Since private firms are industry rivals providing very little public information, these models suggest non-
disclosure is higher in industries with a high concentration of private firms. Theories of strategic
disclosures in competitive environments also propose information withholding is prevalent when rivals do
not have to make a disclosure decision, such as private firms in the U.S. (e.g. Gigler, Hughes, and
Rayburn 1994; Hayes and Lundohlm 1996; and Hwang and Kirby 2000). Hence, these theories suggest
that public firms facing high private firm intensity prefer non-disclosure for competitive reasons.
10
As empirical evidence consistent with these theories, non-disclosure by public peers relates
positively to non-disclosure of capital expenditure forecasts (Brown, Gordon and Werners 2006) and
major customer name (Ellis, Fee and Thomas 2012). Bens, Berger and Monahan (2011) find a positive
association between private firm intensity and segment reporting non-disclosure. Ali, Klasa, and Yeung
(2014) also find that private firm intensity relates positively to non-disclosure (measured as management
forecast infrequency and poor analysts’ disclosure ratings).
Consistent with these studies, I expect firms to mimic the disclosure policy of their privately-held
competitors by concealing major customer names. I hypothesize the following:
H1: Non-disclosure of major customer names relates positively to the extent of private firms
in the industry.
Overall, firms appear to justify their non-disclosure of customer names primarily with three
reasons: (1) competitive harm, (2) immateriality, and (3) requests from customers to hide their names
(e.g., Yongye International’s press release in 2011, Cabot Oil and Gas Corp’s response to a 2009 SEC
comment letter, and Adtran Inc 2011 Q1 and Q4 conference calls).8 The first reason is most frequently
cited. Disclosure of customer names could provide valuable information to competitors by revealing key
targets or alliances. Private firms are not required to reveal their major customers. Thus, non-disclosure of
major customer names in industries with high percentage of private firms may be motivated by
proprietary cost reasons. However, non-disclosure of major customer names in industries with high
percentage of private firms may also be motivated by agency costs (distinct from proprietary costs). I
discuss both motives in detail in the following two sections.
8 Yongye(http://en.prnasia.com/pr/2011/03/24/110275311.shtml); Cabot (http://secfilings.nyse.com/filing.php?doc=1&attach=ON&ipage=7165399&rid=23); Adtran(http://seekingalpha.com/article/593241-adtran-inc-where-are-the-numbers)

11
2.3. Proprietary Costs, Profitable Major Customer Relationships, and Non-disclosure
From a theoretical perspective, the relation between proprietary costs and non-disclosure is
situation-specific, with predictions sensitive to various assumptions (Vives 1990). For example, some
models posit disclosure is more likely when the threat of competition comes from potential entry, but less
likely when the threat is from incumbents. Given the highly stylized nature of these disclosure models, it
is not surprising that empirical tests generally provide mixed evidence (Beyer, Cohen, Lys and Walther
2010).
Empirical tests document the relation between proprietary costs and disclosure using a variety of
proxies for proprietary costs. For example, regarding studies that measure competition using industry
concentration, some report a positive relation between industry concentration and non-disclosure
(segment aggregation [Harris 1998; Bens, Berger and Monahan 2011] and infrequent management
earnings forecasts [Ali, Klasa and Yeung 2010]). Conversely, others report that non-disclosure is
decreasing in industry concentration (e.g., lower propensity to redact material contracts from filings
[Verrecchia and Weber 2006]). Overall, earlier studies on proprietary costs and disclosure yield
conflicting results, leading to calls for additional research (e.g., Beyer, Cohen, Lys and Walther 2010;
Lang and Sul 2014).
A potential reason for conflicting results is the use of disclosure settings with insufficiently high
proprietary costs. Ellis, Fee, and Thomas (2012) address this concern when they provide initial evidence
on the proprietary costs of major customer name disclosure. They advance convincing arguments that
information about a firm’s major customers is proprietary (i.e., it can help rivals compete with the firm).
For example, revealing the identities of a firm’s customer can enable a rival to approach these customers
in an effort to capture the customer relationships and to estimate the productive capacity of the disclosing
firm. Competitors may also use the identity of a major customer to acquire the customer (e.g. Hart, Tirole,
Carlton, and Williamson 1990). Using this reasoning, Ellis, Fee, and Thomas (2012) find the likelihood
of concealing a major customer’s name is positively associated with proprietary cost proxies that include

12
advertising costs, research and development, and intangible assets. I extend their by introducing a
different dimension of proprietary costs (private firm competition) and by demonstrating the agency cost
incentives embedded in this dimension.
I expect firms’ incentives to conceal major customer identity for proprietary cost reasons to be
stronger when customer relationships are highly profitable. Such customers are more attractive to rivals
because they portray greater opportunities for high profits. In other words, rivals are more likely to gain a
competitive advantage from capturing the business of such customers. I suggest proprietary costs of
customer name disclosure in industries with a high proportion of private competitors will be especially
high when operations involving major customers generate abnormally high profits for the supplier. I
therefore make the following hypothesis:
H2a: The positive relation between non-disclosure of major customer names and the extent of
private firms in the industry is greater for highly profitable major customer
relationships.
2.4. Agency Costs, Unprofitable Major Customer Relationships, and Non-disclosure
Agency theory predicts disclosure can enable outsiders to monitor managers in order to ensure
that managers comply with contractual agreements (Healy and Palepu 2001; Bushman and Smith 2001).
Therefore managers with high agency costs have incentives to withhold disclosures in order to prevent
scrutiny of their activities. Despite the appeal of this theory, there is scant empirical evidence on the
agency cost motive for non-disclosure (Berger and Hann 2003). Botosan and Stanford (2005) do not find
evidence consistent with the hypothesis that agency costs motivate the aggregation of poorly performing
segments. In contrast, Berger and Hann (2007) find abnormal profit relates negatively to segment
aggregation when agency costs are high. Bens, Berger, and Monahan (2011) document unprofitable
transfer of resources across segments motivates managers to aggregate segments. Lail, Thomas, and
Winterbotham (2014) find that managers use discretion within cost allocation rules to shift expenses from
13
core segments to the corporate/other segment when firms have severe agency problems. Overall, prior
studies document a positive relation between agency costs and non-disclosure. I build on these studies by
examining whether firms use competitive harm as an excuse to disguise agency costs within the context
of major customer disclosures.
Agency cost concerns related to major customer disclosures are more likely when customer
relationships are highly unprofitable. Unprofitable major customer relationships can arise when suppliers
become dependent on major customers. This dependency sometimes forces the suppliers to concede to
demands of major customers. 9 For example, major customers can demand lower prices, potentially
generating lower profit margins than would otherwise be obtained with dispersed customers (Fee and
Thomas 2004; Hasbro Inc. 2006 10-K). Moreover, major customers often demand relationship-specific
investments from their suppliers, thus providing greater opportunities for customers to obtain price
concessions. Relationship-specific investments require modifications to standard production processes
and unique fixed assets that have a lower resale value in liquidation (Titman 1984; Kale and Shahrur
2007; Banerjee, Dasgupta, and Kim 2008). Hence, these investments bond firms to major customers, and
in turn, increase customer bargaining power and supplier incentives to comply with customers’ rent-
extracting demands.
Managers have strong incentives to conceal these relationships for two reasons. First, revelation
of the source of low profitability through customer name better highlights that poor firm performance is
more attributable to poor managerial decisions regarding customer relationships rather than to
circumstances beyond the manager’s control. 10 Second, low profits for suppliers can imply major
9 The high switching costs that characterize most major customer relationships prevent management from quickly
abandoning a relationship where the customer is extracting rents to the detriment of the firm (e.g. Banerjee,
Dasgupta, and Kim 2008). Note that customer relationship specific investments can counteract this effect since they
raise switching costs for the customer. Also, mechanisms such as vertical integration, strategic alliances, choice of
capital structure, equity ownership or board representation of a supplier in a customer firm can alleviate some of the
frictions that lead to inefficiencies in major customer relationships. However, these mechanisms are not prevalent
(e.g. Fee, Hadlock, and Thomas 2006; Dass et al. 2013). 10 Managers should be less likely to suffer negative career consequences following poor performance if poor
performance is due to circumstances beyond the manager’s control. These circumstances serve as noise in optimal
compensation contracts (e.g., Lambert 2001; Armstrong, Guay and Weber 2010). Minimizing such performance
misattribution is a major concern for corporate boards (Khurana, Rhodes-Kropf, and Yim 2013).
14
customers are generating abnormal profits. Therefore, major customers can demand that their name be
withheld in order to conceal the source of their abnormal profits from the customer’s competitors.11
Customer letters requesting that Adtran no longer disclose their name illuminate this point (Seeking
Alpha 2012).
Firms wanting to conceal the source of low profits via customer name non-disclosure may be
more likely do so when private firm percentage is high because they perceive regulators will excuse non-
disclosure when firms complain of losing competitive advantage to private firms. As support, such
complains led regulators to solicit feedback on how to level the playing field between public and private
firms while drafting SFAS 131. Specifically, Issue #4 of the SFAS 131 Exposure Draft addresses whether
privately-held firms should be required to report information about major customers even if they are
exempt from other segment reporting requirements. After requesting SFAS 131 exposure draft responses
from the FASB, I select all Issue #4 responses that are electronically searchable (seventeen responses).
Five out of the eleven responses that do not favor exemptions for private firms highlight the need to level
the playing field with private competitors as support for their position.
In summary, because a customer’s name potentially highlights customer relationship
unprofitability, managers have an agency cost motive for withholding this information. Furthermore,
firms with high private firm intensity may perceive that they have greater opportunity to withhold
information because they are more likely to convince auditors and/or regulators that non-disclosure is
necessary to prevent competitive harm.12 I therefore expect greater non-disclosure when major customer
relationships are highly unprofitable and when the firm is more likely to use the percentage of private
firms as an excuse for competitive harm Consequently, I predict the following:
11 Competitors can use this information to (re)negotiate more favorable trade terms with the supplier to the detriment
of the favored major customer and the supplier. Disentangling customer’s demand for customer name non-
disclosure from supplier’s supply of this disclosure is a task reserved for future research. 12 As a fitting analogy, “the dog ate my homework” is a more believable excuse for not doing homework for a
student that owns a dog. Manager’s perception of auditors’/regulators’ leniency towards non-disclosure when
private competition is high should be sufficient to increase non-disclosure.

15
H2b: The positive relation between non-disclosure of major customer names and the extent of
private firms in the industry is greater for highly unprofitable major customer
relationships.
3. Sample and Research Design
3.1. Sample
I collect information on the number of public and private firms in each three-digit SIC code from
Lexis Nexis Academic, S&P Capital IQ (CIQ) and the U.S. Census Bureau. Customer disclosure
information is from Compustat Customer file over the period 1999-2013.13 I retain only corporate major
customers as defined by Compustat (CTYPE = COMPANY). I exclude governmental customers because
public availability of federal contract awards weakens incentives for non-disclosure. I also retain only
major customers with positive sales (SALECS > 0) because I use customer sales information to measure
customer relationship profitability.14 Compustat does not provide any customer identifiers or standard
customer naming conventions. Therefore, I manually check each customer’s name label to determine
whether its identity was disclosed or not (32,734 unique name labels). Non-disclosure includes labels
such as “NOT REPORTED”, “CUSTOMER A”, “ONE EXPORT CUSTOMER” etc. I further eliminate
firms that are in the financial or utilities industries, firms with less than 5 Compustat firms in the three-
digit SIC industry code and firms in unclassified industries (SIC > 8999).15 The final sample consists of
20,314 firm-year observations (average of 2.23 major customers per firm-year). See Appendix A for a
breakdown of the sample selection.
13 The sample begins in 1999 in order to maintain a constant accounting standard regime (i.e., only SFAS 131). 14 Firms sometimes disclose major customers without corresponding customer sales. Compustat assigns zero or a
negative code to SALECS for these customers. 15 I require 5 Compustat firms to compute the industry-adjusted performance metrics used in constructing AC/PC. In
robustness tests, I use two- and four-digit SIC codes. In separate tests, I increase the minimum number of firms per
industry group from 5 to 10.

16
3.2. Research Design
H1 predicts that private firm percentage relates positively to non-disclosure of major customer
names. I test H1 by estimating the following logistic regression model at the firm-year level:
NOCUSTNAMEi,t = α0 + α1PRIVFIRM%i,t + βnControlsn,i,t + i,t (1)
Non-disclosure of customer name (NOCUSTNAME) is an indicator variable coded one if the supplier
does not disclose the name of any one of its major customers in year t, zero otherwise.16 I use two proxies
for private firm percentage (PRIVFIRM%). The first proxy, private sales percentage (PRIVSALES%_100)
is the percentage of private firm sales within the top 100 firms in the three-digit SIC primary industry
code.17 The rationale for using top 100 firms is that these firms are major players with potentially higher
excess capital. Excess capital enables firms to acquire a supplier’s major customer (or invest on behalf of
the customer after capturing their business). These top private firms therefore pose a more significant
threat to a public firm’s competitive advantage (Hayes and Lundohlm 1996). As an alternative measure of
private firm competition, I compute PRIVSALE%_ALL - the percentage of private firm sales within all
firms in the three-digit SIC primary industry code.
I expect α1 in equation (1) to be positive. This result would be consistent with firms’ incentives to
minimize proprietary costs by concealing efficient customer relationships from private competitors who
are not required to provide similar disclosures. This result would also be consistent with agency cost
incentives to conceal unprofitable customer relationships. High private firm intensity provides managers
the needed condition to claim competitive harm as justification for non-disclosure, even though the real
intention is to hide unprofitable customer relationships.
16 Most firms treat customer name disclosure as a policy such that they either disclose the names of all customers or
of none of the customers (Ellis, Fee, and Thomas 2012). Results are robust to analyses at the customer-firm-year
level and to retaining only the customer with the highest sales proportion. 17 It is unclear ex-ante whether firms are more concerned about losing competitive advantage to the major players in
the industry, to peers or to all firms within the industry. Arguments can be made for each scenario. Hence I
investigate all alternatives

17
To disentangle whether non-disclosure relates to proprietary costs of highly profitable customer
relationships or to agency costs of unprofitable customer relationships, I estimate the following logistic
regression at the firm-year level.
NOCUSTNAMEi,t = λ0 + λ1 PRIVFIRM%i,t + λ2 PRIVFIRM%i,t × PCi,t +
λ3 PRIVFIRM%i,t × ACi,t + βnControlsn,i,t + i,t
(2)
PC (AC) is an indicator variable that takes the value of one if the firm belongs in the PC (AC)
motive sample, zero otherwise. The PC motive sample is identified in two parts. First, the supplier’s
industry-adjusted gross profit margin is in the top quartile.18 I use gross profit margin as a suitable
indicator of major customer relationship profitability because it consists of revenue and cost of goods
sold, which are accounts directly related to the customer (Kim and Wemmerlöv 2010; Schloetzer 2012).
Second, the supplier derives at least 20% of its sales from the major customers ([SALECS/SALE] ≥
20%).19 The 20% condition is necessary to ensure that major customers account for a material portion of
firm sales and in turn, will likely influence disclosure decisions. The AC motive sample is defined
similarly. First, the supplier has an industry-adjusted gross profit margin in the bottom quartile.20 Second,
the supplier derives at least 20% of its sales from the major customers ([SALECS/SALE] ≥ 20%).
As an additional test, I use a sample of firms that meet the second condition (i.e., have a major
customer that constitutes 20% of sales). In this test, PC and AC are defined based on the first criterion
only. Therefore to test hypotheses H1 and H2, I employ a sample that uses both criteria for determining
AC/PC (20,314 firm-year observations) and another sample that uses only the first criterion but controls
for the second (14,726 firm-year observations). For both samples, I expect λ2 to be positive to be
consistent with H2a (PC motive) and λ3 to be positive to support H2b (AC motive). A positive λ3 would
18 Sensitivity tests indicate stronger (weaker) results when I use quintile (tercile) splits. 19 The capitalized, unitalized variables are labels in Compustat. 20 Ang, Cole and Lin (2000) indicate that losses attributable to inefficient resource utilization reflects high agency
costs. This loss can be due to poor investment decisions such as investing in negative net-present-value relationship
specific assets on behalf of major customers, or from management’s shirking (e.g., exerting too little effort to
identify customers that can engage in profitable major customer relationships).

18
be consistent with skeptics’ claims that some firms use their presence in industries with high private firm
percentage as an excuse to conceal unprofitable major customer relationships.
Control variables used in models (1) and (2) consists of other proprietary cost proxies and
determinants of non-disclosure of customer names. Based on prior research (e.g., Healy and Palepu 2001;
Ellis, Fee, and Thomas 2012), proprietary cost proxies include non-disclosure of customer name by
suppliers’ product market peers (NOCUSTNAME_PEER), industry concentration (CONC), research and
development scaled by sales (RD_SALE), intangible assets, net of goodwill and scaled by total assets
(INTANG_AT), and advertising expense scaled by sales (ADV_SALE). Other disclosure determinants
include the firm’s auditor size (BIGN), the log of total assets (LAT), market-to-book ratio (MTB), and long
term debt divided by total assets (LEV). As management’s use of immateriality to justify non-disclosure is
likely more difficult when customers account for a large portion of sales, I control for customer sales ratio
– customer sales scaled by total sales (CSR). Also, since customer sales ratio is a component of PC and
AC, controlling for CSR ensures the PC/AC effect is not driven by CSR. To address the possibility that
customer name disclosure might be determined by the number of customers or firm age, I control for
NCUST and LAGE, respectively. See Appendix C for variable measurements.
4. Empirical Results
4.1. Descriptive Statistics
Table 1, Panel A reports descriptive statistics for firms with available major customer
information.21 The first section presents statistics for all firms (20,314 firm-year observations) and the
second displays statistics for firms with customer sales proportion ≥ 20% (14,726 firm-year observations).
Focusing on the first section, the ratio of private firm sales within top 100 firms in the industry
(PRIVSALES%_100) is 40%. On average, private firms within all firms in each industry generate 49% of
21 All continuous variables are winsorized at the 1st and 99th percentile to reduce the effects of outliers.

19
sales (PRIVSALE%_ALL).22 Overall, the descriptive statistics for the private firm intensity measures are
consistent with prior literature (e.g. Bens, Berger, and Monahan 2011; Ali, Klasa, and Yeung 2014).
Firms withhold the names of 42% of major customers (NOCUSTNAME), 18% of firms are classified as
the PC motive sample (PC), and 19% as the AC motive sample (AC). Descriptive statistics for the
control variables are generally consistent with prior research (e.g. Ellis, Fee, and Thomas 2012).
Table 1, Panel B presents the distribution of key variables by two-digit SIC industry code for the
full sample. For brevity, I display industries with at least 50 firm-year observations. Firms that operate in
Motion Pictures, Primary Metal Industries, Transportation Services, and Furniture & Fixtures industries
have the highest private firm presence. Suppliers in these four industries have average NOCUSTNAME of
51% which closely mirrors the publicly-held peers’ average of 52%. The privately-held firms in this
group have a market share of 86% (82% within top 100). On the other end of the spectrum, those in
Industrial Machinery & Equipment, Chemical & Allied Products, Petroleum & Coal Products, and Oil &
Gas Extraction have the lowest private firm presence. Compared to suppliers in industries with the highest
private firm presence, suppliers in these five industries have lower average NOCUSTNAME (34% and
35% for peers) and drastically lower private firm market share of 27% (22% within top 100). Overall, the
higher non-disclosure of major customer name for firms with high private percentage displayed in this
table provides preliminary evidence consistent with H1.
Table 2 presents the correlation matrix of the variables used in the regression models with
Pearson correlations above the diagonal and Spearman correlations below. Providing support for H1,
private firm intensity (PRIVSALE%_100 and PRIVSALE%_ALL) significantly positively correlates with
non-disclosure of customer identity (NOCUSTNAME).
Table 3 presents bivariate test results for PC/AC using PRIVSALE%_100 and two subsamples. I
use mean splits of the measures of private firm intensity to obtain High PRIVSALE% and Low
22 As the private firm competition measures are skewed, in robustness tests, I determine that my main results hold
when I further winsorize these measures or when I normalize by taking their natural logarithm.

20
PRIVSALE%.23 The first (second) column reports the difference in average NOCUSTNAME between PC
and AC sample versus the Base sample for firms in industries with high (low) private firm intensity. The
last two columns present t-statistics for the differences in these averages. Consistent with H2a (H2b), the
PC (AC) sample indicates greater non-disclosure relative to the Base sample when private firm intensity
is high. The difference is not significant for PC firms for the full sample, but all other differences are
significant.
4.2. Tests of H1
H1 predicts that non-disclosure of major customer identity is increasing in private firm intensity.
Table 4 presents the results from estimating model (1). 24 The coefficient on PRIVSALE%_100 is
significantly positive for both samples [(0.588, t-stat = 9.712) and (0.659, t-stat = 9.184), respectively].
For easier interpretation, I evaluate predicted probabilities of customer name concealment at four levels of
PRIVSALE%_100 (0.13, 0.24, 0.42, 0.78), corresponding to the 1st through 4th quartiles, respectively),
holding all other variables at their means. In untabulated results for the full sample, the predicted
probabilities are 0.46, 0.51, 0.56 and 0.57, respectively. This means that, firms in the bottom quartile of
private firm intensity are 46% likely to conceal major customer identity. In contrast, firms in the top
quartile of private firm intensity are 57% likely to conceal major customer identity. Untabulated results
using private sales percentage for all firms in the industry (PRIVSALE%_ALL) are similar to the results
for the largest 100 firms in the industry, as presented in Table 4.25 These results provide evidence that
firms prefer non-disclosure when competing against privately-held firms. As firms might either have a
proprietary cost or an agency cost motive for this disclosure preference, I next disentangle these motives.
23 Untabulated results for median splits of private firm competition are consistent with results presented in Table 4. 24 I estimate all regressions are using logit regression with robust standard errors. 25 I find similar results when I measure private firm competition using percentage of private firms within the top 100
in the industry (PRIVFIRM%_100) and percentage of all private firms within the industry (PRIVFIRM%_ALL).

21
4.3. Tests of H2a and H2b
H2a and H2b predict that non-disclosure of major customer identity is increasing in the
interaction between private firm intensity and proprietary costs and the interaction between private firm
intensity and agency costs, respectively. Table 5 presents the results from estimating model (2). The
significantly positive coefficient on PRIVSALE%_100 (0.372 for the full sample, and 0.302 for the 20%
customer sales sample) indicates that non-disclosure of customer name is increasing in private firm
intensity for Base firms. Consistent with H2a and H2b, for both samples, the coefficients on
PRIVSALE%_100 × PC [(0.616, t-stat = 3.1) and (0.717, t-stat = 3.4), respectively] and
PRIVSALE%_100 × AC [(0.329, t-stat = 2.1) and (0.402, t-stat = 2.4), respectively] are positive.26 This
result suggests that PC and AC firms are incrementally more likely to conceal customer identity relative
to base firms when faced with high private firm intensity. In untabulated results, I evaluate predicted
probabilities of customer name concealment at four levels of PRIVSALE%_100 (0.13, 0.24, 0.42, 0.78),
corresponding to the 1st through 4th quartiles, respectively), holding all other variables at their means. The
results indicate that the difference in predicted probabilities between PC (AC) firms and base firms
increases as PRIVSALE%_100 increases. For example, moving from the 1st quartile to the 3rd (4th) quartile
of PRIVSALE%_100 increases the difference in predicted probabilities between AC and base firms by
280% (987%). Comparable increases for PC firms are 38% and 102%, respectively. The table 6 results
using private sales percentage for all firms in the industry (PRIVSALE%) are similar to the results for the
largest 100 firms in the industry, as reported in Table 5.27
26 When I estimate the main effect of PRIVFIRM% (all four measures for the full sample) separately by firm type,
(i.e., PC, AC and base motive) and use the Wald test to compare coefficients across the firm types, the AC_Base
difference is always positive and statistically significant at the 5% level or lower, the AC_PC difference is
statistically significant in most specifications. In contrast, the PC_Base difference is never positively statistically
significant. This alternative specification alleviates concerns about interaction terms in non-linear models.
Evaluation of goodness of fit for my models find a high degree of correspondence between predicted probabilities
and observed frequencies of major customer name concealment. For example, for the results presented in the first
two columns of Table 5, the average predicted probability of non-disclosure for firms in the first (tenth) decile of
predicted probability of non-disclosure is 30% (79%) compared to the average rate of non-disclosure of 26% (62%). 27 These results are robust to additional proprietary cost controls such as industry profit persistence, Hoberg and
Phillips (2015) competition measures (text-based product market concentration and product fluidity), and
concentration of industry peers around the supplier’s headquarter state. I find similar results for the AC interaction

22
Overall, the results in Tables 4 to 6 provide evidence consistent with H1, H2a, and H2b and
suggest that managers use discretion to conceal customer identities.28 Some firms facing many private
rivals have high proprietary costs. As a result, these firms protect the source of their excess profits by
concealing the identities of their major customers. Importantly, firms facing high private firm intensity
have greater opportunities to use competitive harm concern as an excuse for less transparent disclosures.
Consistent with this underlying motive, firms that earn relatively low profits from operations with major
customers frequently use discretion afforded in Regulation S-K and ASC 280 to conceal the source of this
low profitability through major customer name withholding.
4.4. Cross-Sectional Tests and Endogeneity
I next conduct a series of tests that follow from my main hypotheses. The tests have a dual benefit
in that they are informative about the mechanisms behind the main results and they address concerns
about omitted variable bias. Specifically, I split the sample into two groups based on some factor and
expect results to be predictably stronger in one group relative to the other. This design addresses concerns
about omitted variables because it is difficult to envision a scenario where these omitted variables explain
both the interaction effects predicted in H2a and H2b and the cross-sectional findings demonstrated in this
section. I focus on the agency cost results for brevity and because these results are robust to numerous
alternative measures of private firm intensity.29
when I measure private firm competition using percentage of private firms within the top 100 firms in the industry
(PRIVFIRM%_100) and percentage of all private firms within the industry (PRIVFIRM%_ALL). I do not find
support for H2a (PC interaction) when I use these measures. 28 I find support for H1 but not H2 using a Herfindahl index-based private firm concentration measure. At first
glance, the negative main effects of PC and AC are counterintuitive. However, PC (AC) positively relates to major
customer materiality (even when CSR is not part of the measure). In turn, customer materiality negatively relates to
NOCUSTNAME due to compliance with disclosure requirements. Moreover, relative to the base sample and
controlling for CSR, PC (AC) positively (negatively) relates to proprietary cost proxies from prior literature such as
intangible assets, advertising, market-to-book, sales growth, profitability and age (Lang and Sul 2014). Also,
contrary to the results in Ellis, Fee, and Thomas (2012), the coefficient on RD_SA is negative. In untabulated
analysis, I find a positive coefficient using the 1976 to 2006 sample period in Ellis, Fee, and Thomas (2012). 29 However, in untabulated tests, using PRIVSALE%_100 and PRIVSALE%_ALL, I perform similar tests related to
the PC results. Specifically, I determine whether these results are stronger when the supplier faces more intense
competitive pressure from sources other than privately-held firms. Consistent with this expectation, I find that the
PC results are largely evident when: the supplier’s product market is less concentrated, when the supplier’s products
are similar to peers’, when there is a high concentration of industry peers around the supplier’s headquarters, and

23
The discussion in section 2 suggests that the agency cost motive for withholding major customer
name should be more pronounced in two situations. First, to the extent that greater supplier dependence
on major customers facilitates rent-extraction by customers, the positive interaction effect of private firm
intensity and agency costs should be especially strong when supplier dependence is high. Second,
managers have greater career concerns when poor performance is more attributable to managerial ability
rather than to circumstances beyond managerial control (e.g., Lambert 2001; Khurana, Rhodes-Kropf, and
Yim 2013). Hence, managers have greater incentives to conceal the source of poor performance through
customer name non-disclosure when managerial ability is low. I expect the positive interaction effect of
private firm intensity and agency costs to be especially pronounced when managerial ability is low.
Consistent with prior research (e.g., Dhaliwal, Judd, Serfling, and Shaikh 2015), I identify
suppliers that are more heavily dependent upon major customers in five ways. First, suppliers in durable
goods industries often incur high sunk costs and have longer operating cycles, implying higher costs of
replacing customers. Following Banerjee, Dasgupta, and Kim (2008), firms are considered to be highly
dependent if they operate in durable goods industries (SIC 3400-3999). Second, suppliers with customer
relationship-specific investments have little value for these investments outside of the major customer
relationship. Hence, consistent with Kale and Shahrur (2007) and Raman and Shahrur (2008), I measure
high dependence as above median supplier R&D expenditures scaled by sales. The third and fourth
measures capture supplier reliance on major customers based on the ease with which customers can
switch to other suppliers. Consistent with prior research, suppliers are highly reliant if they have below
median industry market share or have above median number of product market peers (e.g., Hui, Klasa,
and Yeung 2012). As a fifth measure of supplier dependence on major customers, I consider suppliers
with below median Altman’s (1968) Z-score. These suppliers have a higher probability of default and loss
of a major customer could more easily tilt them towards bankruptcy. To test whether the positive
interaction effect of private firm intensity and agency costs is more pronounced when managerial ability
when the supplier changes products more frequently relative to product market peers. Contrary to my expectations,
the PC results are weaker when the supplier’s industry profit persistence is low.

24
is low, I consider a supplier to have low managerial ability if their managerial ability score from
Demerijian, Lev, and McVay (2012) is below median.30
Table 7 presents the results from estimating model (2) separately within a sample of suppliers
with high and low dependence on major customers, using PRIVSALE%_ALL.31 For each dependence
proxy, the first (second) column reports results for high (low) dependence. The last two columns in this
table present results for the managerial ability splits. Across all measures of supplier dependence, the first
column results indicate that within firms with high reliance on major customers, firms with highly
unprofitable major customer relationships increasingly withhold customer name as private firm intensity
increases. However, there is not a significant relation between the interaction of private firm intensity and
agency cost for suppliers with low dependence on major customers. Moreover, the p-values for test of
differences in this interaction effect across high versus low supplier dependence are all significant at the
5% level or lower.32 Summarily, these results suggest that firms’ use of private firm intensity as an excuse
to conceal unprofitable major customer relationships is more pronounced when heavy reliance on these
customers present greater opportunities for the customers to extract rents. The last two columns indicate
that firms also tend to exhibit this behavior when major customer relationship low profitability is likely
attributable to low managerial ability rather than to circumstances beyond managers’ control.33 This result
30 I obtain managerial ability scores from Demerijian, Lev, and McVay (2012), where the scores reflect how
efficiently managers use firm resources to generate revenue. These resources include cost of goods sold; net research
and development expenses; selling, general, and administrative expenses; net operating leases; net property, plant,
and equipment; purchased goodwill; and other intangible assets. Demerijian, Lev, and McVay (2012) use data
envelope analysis (DEA) to solve an optimization problem that maximizes revenue given these resources as
constraints. The resulting firm efficiency measure is purged of factors beyond managerial control such as firm size,
market share, and business complexity. The scores are then decile-ranked by year and industry such that the
managerial ability ranks are comparable across time and industries. 31 All variables displayed in Table 5 or 6 are estimated in these regressions but are excluded from Table 7 for
brevity. Unreported results are similar to those reported in this table if I instead use PRIVSALE%_100,
PRIVFIRM%_100 or PRIVFIRM%_ALL. 32 In untabulated results, I also find that consistent with theory, the AC results are more pronounced for suppliers
with more uncollectible receivables and for those with inefficient inventory management. Note that consistent with
theory, the p-value for the PC difference in Table 7is statistically significant when I split firms based on the number
of public-held firms competing with suppliers in the same product market space. Firms with many product market
peers face stiffer competition. However, inconsistent with theory, from the split based on product market share in
Table 7, the PC effect is not less pronounced for suppliers with high product market share i.e., market leaders. 33 As an alternative, I define AC using the total firm performance measure of Demerijian, Lev, and McVay (2012). I
interact this measure and a portion attributable to managers with proxies for private firm competition. Untabulated
25
is consistent with greater managerial career concerns when customer name disclosure is indicative of poor
managerial choices regarding the customer relationship.
4.5. Customer Distress
A potential concern with my conclusions related to non-disclosure is that outsiders could obtain
the identity of a major customer using sources other than the supplier’s 10-K. I investigate this concern by
studying supplier investor stock market reaction to customer distress announcements. Customer distress
has negative future cash flow implications for suppliers (Hendricks and Singhal 2005). Supplier
dependence on a major customer increases the probability that supplier cash flows will sharply decline if
the customer experiences financial distress. Moreover, if customer financial distress results in bankruptcy,
the supplier might have to terminate the relationship. Customer relationship termination will result in
high switching costs, especially for firms that invest heavily in relationship-specific investments (Kolay,
Lemmon and Tashjian 2013).
Consistent with this intuition, Hertzel, Li, Officer and Rodgers (2008) report that supplier
abnormal returns relate positively to customer abnormal returns. Building on this evidence, I expect that
around customer distress events, investors of supplier firms with undisclosed major customer names have
limited information about the effect of customers’ distress on supplier future cashflows. Consequently,
their stock price reaction to distress events is less pronounced than that of suppliers that disclose major
customer identity. Hence, the positive relation between supplier cumulative abnormal return and customer
cumulative abnormal return around customer distress events is weaker for non-disclosed customers. This
expectation should hold only if investors are truly unaware of the identity of an undisclosed major
customer when the customer makes the distress announcement.
results find an insignificant coefficient on this interaction term for the total firm performance proxy. Importantly, I
find a significant incrementally positive coefficient on this interaction term for the portion attributable to managerial
ability. This result further confirms that managers are particularly sensitive about disclosing customer name when
poor firm performance is more attributable to managerial ability rather than to circumstances beyond their control.

26
To investigate, I study distress events that occur two years before a customer files for
bankruptcy.34,35 To determine non-disclosed customers around distress events, I rely on post-distress
mandatory disclosure of major unsecured creditors in bankruptcy filings. Essentially, a customer
announces distress at time t, and then at some point in the future, the customer’s supplier is named as a
major unsecured creditor in a bankruptcy filing. I extract the supplier’s name from bankruptcy filings and
backtrack to time t to determine whether the supplier had disclosed the name of the bankrupt firm as a
major customer in its financial statements/press releases. I identify all firms in the CIQ database with
news articles about bankruptcy filings. I retain the sample of firms that mention at least one major
unsecured creditor that does not operate in financial, real estate, insurance, utilities, or employment
agencies industries in the bankruptcy press release. I consider the retained creditors to be trade creditors
(i.e., suppliers). I verify that this consideration is reasonable by ensuring that for a random sample of
bankruptcy petitions, the claims of these creditors are trade payables.36 I also retain only observations
with available CRSP information for the suppliers and customers.
I match the suppliers from the bankruptcy filings to the Compustat Customer Segment database.
By so doing, I only consider suppliers that typically disclose major customer information.
NOCUSTNAME is one if the supplier did not disclose the bankrupt customer’s name in financial
statements or CIQ announcements in the five years leading up to the customer’s distress event, zero
otherwise.37 To increase the sample size, I add suppliers that disclose names of bankrupt customers but
are not listed as major unsecured creditors to the sample of suppliers with NOCUSTNAME equals zero. I
find that suppliers identified 20% of customers with distress announcements in their 10-Ks/press releases
34 By studying the interaction between customer returns and non-disclosure rather than the main effect of non-
disclosure, I capture the importance of the distress event to the customer, and in turn, to the supplier. 35 I limit the period to two years to ensure that a trading relationship exists between the supplier and the customer at
the time of customer distress and that the sample size is sufficiently large. I also focus on pre-bankruptcy distress
events to mitigate noise introduced by supplier information leakage around the customer’s bankruptcy petition date. 36 For example, Delta Airline’s list of 20 largest unsecured creditors includes Boeing (a supplier) and Bank of New
York (not a supplier) http://bankrupt.com/delta.txt 37 Firms might stop disclosing customer names just before the distress event. Searching for disclosure of customer
name in the 5-year period preceding the distress announcement allows me to capture investors’ knowledge of such
customers. Note that this choice is conservative in that it downwardly biases my coefficient of interest.

27
prior to the distress announcements. To determine whether non-disclosure of customer names dampens
supplier stock price reaction to customer distress events, I estimate the following OLS regression:
SUPPCAR i,t = λ0 + λ1 CUSTCAR i,t + λ2 NOCUSTNAME i,t
+λ3 CUSTCAR i,t × NOCUSTNAME i,t
+ βnControlsn,i,t + i,t
(3)
SUPPCAR (CUSTCAR) is the supplier’s (customer’s) CAR around any customer’s distress date
between the date of bankruptcy filing and prior two fiscal years. Distress dates are days on which news
releases about a customer indicate distress as categorized by S&P Capital IQ.38 The final sample consists
of at most 244 bankruptcies depending on return window length, and an average of 4.9 distress events per
bankruptcy (1,196 event-bankruptcy observations). Appendix B lists the types of distress events that are
included in the sample (e.g., going concern opinions, debt defaults, credit rating downgrades etc.). CAR is
cumulative daily abnormal return computed over two windows around each distress date: (-2, +2) and (-1,
+1). Daily abnormal return is firm-specific return minus the value-weighted market return from CRSP.
Given that the sample includes multiple distress events per bankruptcy, event observations are not
independent and consequently, standard errors might be biased. I correct for this potential bias by
clustering standard errors by bankruptcy. Although market-adjusted returns control for correlation in
firms’ returns due to market-wide factors, I additionally control for economy-wide news and industry-
wide news using year and industry fixed effects, respectively. Consistent with supplier investors’ under-
reaction to customer distress in the absence of customer name disclosure, I expect λ3 to be negative.
In untabulated results for the sample of firms with CARs computed around distress dates (‒1, +1),
the correlation between supplier and customer CARs is significantly positive (Pearson=0.098) and
38 Distress events are press releases classified as “potential red flags/distress indicators” in the S&P Capital IQ key
developments database.

28
consistent with prior literature (e.g., Pandit, Wasley, and Zach 2011).39 However, this correlation reduces
to 0.004 for undisclosed customers (insignificant) and increases to 0.134 for disclosed customers
(significant). These statistics provide preliminary support for the contention that supplier investors
underreact to distress announcements of undisclosed customers because they are unaware of these
customers.
Table 8 reports the results from estimating model (3). Column 1 presents the result for CARs
computed around distress dates (‒1, +1), while column 2 presents results for dates (‒2, +2). Consistent
with prior literature (e.g., Hertzel, Li, Officer, and Rodgers 2008), the coefficients on CUSTCAR [(0.045,
t-stat = 4.6) and (0.039, t-stat = 3.5)] are positive, implying that bad news about customers as reflected in
distress announcements signify bad news about suppliers. More importantly, the coefficients on
CUSTCAR × NOCUSTNAME [(‒0.044, t-stat = ‒3.7) and (‒0.041, t-stat = ‒2.5)] are negative. Moreover,
from the last row in Table 8, the main effect of CUSTCAR for firms with undisclosed major customer
names is not significantly different from zero. These results suggest that non-disclosure of customer name
impairs supplier investors’ ability to impound customer distress news into suppliers’ stock prices. Overall,
the results in Table 8 support the contention that supplier investors cannot readily uncover the identities of
undisclosed major customers.
5. Conclusion
This study examines two competing explanations for a positive relation between customer name
non-disclosure and private firm intensity– agency costs and proprietary costs. I document that private firm
intensity relates positively to non-disclosure of major customer names. I find a stronger positive relation
between private firm intensity and non-disclosure of customer names for firms with highly profitable
major customer relationships. This result is consistent with a genuine proprietary cost motive for
withholding major customer names when firms face many private competitors. However, I also find that
39 Pandit, Wasley, and Zach (2011) report Pearson correlation coefficient of 0.066 between customer and supplier
two-day market adjusted returns around customers’ quarterly earnings announcements.

29
the positive association between private firm intensity and non-disclosure of customer names is more
pronounced for firms with highly unprofitable major customer relationships. This result provides unique
evidence of an alternative explanation for the positive relation between the extent of private firms and
non-disclosure (not proprietary costs). Rather, the result is consistent with managers reducing agency
costs from having an unprofitable relation with a major customer (agency costs). I triangulate these
results using alternative variable measurements, estimation techniques, and cross-sectional tests that are
consistent with theory. I also find that the positive relation between supplier and customer abnormal
returns around customer distress announcements is weaker for firms with non-disclosed customers. This
result suggests supplier investors do not adequately react to relevant major customer news when the
customer’s name is not disclosed.
Although this study examines incentives for customer name non-disclosure from the supplier’s
perspective, in practice, non-disclosure could be partially determined by major customers. For example,
major customers with non-arm’s length trading terms might prefer non-disclosure because rival’s
knowledge of such terms might lead to undesirable price wars. Disentangling customer’s request for
customer name non-disclosure from supplier’s incentives for non-disclosure is a task reserved for future
research. Also, my results indicate that the agency cost explanation for customer name concealment is
robust across multiple specifications whereas the proprietary cost explanation is not. While this result
suggests the agency cost motive is dominant, I hesitate to make such a definitive statement given my
research design. Specifically, the weaker results for proprietary cost might be due to an insignificant
difference in proprietary information between firms with average and firms with high major customer
relationship profitability. Future research might address this issue with finer partitions between firms with
and firms without proprietary cost motives.
Overall, results from the study support skeptics’ claims that firms use proprietary cost concerns as
an excuse to hide unprofitable major customer relationships. This practice is a potential consequence of
the conflicting disclosure requirements regarding major customer identities under ASC 280 and
Regulation S-K and flexibility in the definition of customer materiality in these rules. The results also

30
provide a unique insight regarding the positive relation between private firm intensity and non-disclosure.
Namely, this relation does not necessarily indicate proprietary costs as inferred by prior studies, but might
instead reflect agency costs. Another novel result is that an implication of non-disclosure of customer
name is impairment of investors’ ability to timely assess the effect of customer distress on supplier future
cash flow levels/risk.

31
References
Ali, A., Klasa, S., & Yeung, E. (2009). The limitations of industry concentration measures constructed
with Compustat data: Implications for finance research. Review of Financial Studies, 22(10),
3839-3871.
Ali, A., Klasa, S., & Yeung, E. (2014). Industry Concentration and Corporate Disclosure Policy. Journal
of Accounting and Economics, 58(2-3), 265-274.
Armstrong, C. S., Guay, W. R., & Weber, J. P. (2010). The role of information and financial reporting in
corporate governance and debt contracting. Journal of Accounting and Economics, 50(2), 179-234.
Banerjee, S., Dasgupta, S., & Kim, Y. (2008). Buyer–supplier relationships and the stakeholder theory of
capital structure. The Journal of Finance, 63(5), 2507-2552.
Bens, D. A., Berger, P. G., & Monahan, S. J. (2011). Discretionary disclosure in financial reporting: an
examination comparing internal firm data to externally reported segment data. The Accounting
Review, 86(2), 417-449.
Berger, P. G., & Hann, R. N. (2007). Segment profitability and the proprietary and agency costs of
disclosure. The Accounting Review, 82(4), 869-906.
Beyer, A., D. A. Cohen, T. Z. Lys, and B. R. Walther. 2010. The financial reporting environment: Review
of recent literature. Journal of Accounting and Economics 50 (203): 295-343.
Botosan, C. A., & Stanford, M. (2005). Managers' motives to withhold segment disclosures and the effect
of SFAS No. 131 on analysts' information environment. The Accounting Review, 80(3), 751-772.
Brown, N., L. Gordon, & R. Wermers (2006). “Herd Behavior in Voluntary Disclosure Decisions: An
Examination of Capital Expenditure Forecasts.” Working paper, University of Maryland, College
Park, 2006.
Business Insider (2014). Apple is Waging an ‘Unusual Unprecedented’ Battle to keep its Secrets in a
$1.5 billion Bankruptcy Case. Available at http://www.businessinsider.com/apple-and-gt-
advanced-technologies-bankruptcy-case-2014-10
Cen, L., S. Dasgupta, and R. Sen. 2012. Discipline or disruption? Stakeholder relationships and the effect
of takeover threat. Working paper, University of Toronto and HKUST.
Dhaliwal, D., Judd, J. S., Serfling, M., & Shaikh, S. (2015). Customer concentration risk and the cost of
equity capital. Journal of Accounting and Economics, forthcoming.
Dye, R., and S. Sridhar. 1995. Industry-wide disclosure dynamics. Journal of Accounting Research 33
(Spring): 157–175.
Ellis, J. A., Fee, C. E., & Thomas, S. E. (2012). Proprietary costs and the disclosure of information about
customers. Journal of Accounting Research,50(3), 685-727.
Fee, C. E., & Thomas, S. (2004). Sources of gains in horizontal mergers: evidence from customer,
supplier, and rival firms. Journal of Financial Economics, 74(3), 423-460.
Fee, C. E., Hadlock, C. J., & Thomas, S. (2006). Corporate equity ownership and the governance of
product market relationships. The Journal of Finance,61(3), 1217-1251.
Feltham, G. A., Gigler, F. B., & Hughes, J. S. (1992). The effects of line‐of‐business reporting on
competition in oligopoly settings*. Contemporary Accounting Research, 9(1), 1-23.
Gigler, F., Hughes, J., & Rayburn, J. (1994). International Accounting Standards for Line‐of‐Business
Reporting and Oligopoly Competition*. Contemporary Accounting Research, 11(1), 619-632.
Grossman, S. J., and O. D. Hart. 1986. The costs and benefits of ownership: A theory of vertical and
lateral integration. Journal of Political Economy 94: 691–719.
Harris, M. S. (1998). The association between competition and managers' business segment reporting
decisions. Journal of Accounting Research, 111-128.
Hart, O., Tirole, J., Carlton, D. W., & Williamson, O. E. (1990). Vertical integration and market
foreclosure. Brookings papers on economic activity. Microeconomics, 205-286.
Hendricks, K. B., and V. R. Singhal. 2005. Association between supply chain glitches and operating
performance. Management Science 51 (5): 695–711.

32
Hertzel, M. G., Z. Li., M. S. Officer, and K. J. Rodgers. 2008. Inter–firm linkages and the wealth effects
of financial distress along the supply chain. Journal of Financial Economics 87: 374–387.
Hoberg, G., & Phillips, G. (2015). Text-Based Network Industries and Endogenous Product
Differentiation. Journal of Political Economy, forthcoming.
Hui, K., S. Klasa, and E. Yeung. 2012. Corporate suppliers and customers and accounting conservatism.
Journal of Accounting and Economics 53 (1): 115–135.
Hwang, Y., & Kirby, A. J. (2000). Competitive effects of disclosure in a strategic entry model. Review of
Accounting Studies, 5(1), 57-85.
Irvine, P. J., Park, S. S., & Yildizhan, C. (2014). Customer-base concentration, profitability and distress
across the corporate life cycle. Available at SSRN 2347095.
Kale, J. R., & Shahrur, H. (2007). Corporate capital structure and the characteristics of suppliers and
customers. Journal of Financial Economics,83(2), 321-365.
Fisman, R. J., Khurana, R., Rhodes-Kropf, M., & Yim, S. (2013). Governance and CEO turnover: Do
something or do the right thing?. Management Science,60(2), 319-337.
Kim, Y. H., & Wemmerlöv, U. (2010). The Effect of Operations Strategy on Supplier-customer
Relationships and Suppliers' Financial Performance(Doctoral dissertation, University of
Wisconsin--Madison).
Kolay, M., Lemmon, M. L., & Tashjian, E. (2013). Distress-Related Spillover Effects in the Supply
Chain: Information Revelation or Real Economic Cost?. In AFA 2013 San Diego Meetings Paper.
Lail, B., W. B. Thomas, and G. Winterbotham. 2014. Classification Shifting Using the 'Corporate/Other'
Segment. Forthcoming, Accounting Horizons, 28(3), 455-477.
Lambert, R. A. (2001). Contracting theory and accounting. Journal of accounting and economics, 32(1),
3-87.
Lang, M., & Sul, E. (2014). Linking industry concentration to proprietary costs and disclosure:
Challenges and opportunities. Journal of Accounting and Economics.
Li, F., Lundholm, R., & Minnis, M. (2013). A Measure of Competition Based on 10‐K Filings. Journal of
Accounting Research, 51(2), 399-436.
Pandit, S., Wasley, C. E., & Zach, T. (2011). Information Externalities along the Supply Chain: The
Economic Determinants of Suppliers’ Stock Price Reaction to Their Customers’ Earnings
Announcements. Contemporary Accounting Research, 28(4), 1304-1343.
Public Company Accounting Oversigt Board (PCAOB) 2012. Proposed Auditing Standards – Related
Parties http://pcaobus.org/Rules/Rulemaking/Docket038/Release_2012-001_Related_Parties.pdf
Raman, K., & Shahrur, H. (2008). Relationship-specific investments and earnings management: Evidence
on corporate suppliers and customers. The Accounting Review, 83(4), 1041-1081.
Reuters (2012). Hon Hai's plunge exposes poor end of Apple value chain
http://www.reuters.com/article/2012/04/30/us-honhai-idUSBRE83T08K20120430
Roe, R. (2011) Yongye's Top Customers: Discrepancies and Inconsistencies. Seeking Alpha, May 5,
2011. http://seekingalpha.com/article/267983-yongyes-top-customers-discrepancies-and-
inconsistencies
Schloetzer, J. D. (2012). Process integration and information sharing in supply chains. The Accounting
Review, 87(3), 1005-1032.
Seeking Aplpha (2012). ADTRAN INC.: Where are the Numbers? Available at
http://seekingalpha.com/article/593241-adtran-inc-where-are-the-numbers?page=2
Thompson, Anne Margaret (2011). SEC Confidential Treatment Orders: Balancing Competing
Regulatory Objectives. Doctoral dissertation, Texas A&M University. Available electronically
from http : / /hdl .handle .net /1969 .1 /ETD -TAMU -2011 -08 -9742.
Titman, S. (1984). The effect of capital structure on a firm's liquidation decision.Journal of Financial
Economics, 13(1), 137-151.
Verrecchia, R. E., & Weber, J. (2006). Redacted disclosure. Journal of Accounting Research, 791-814.
Vives, X. 1990. Trade association disclosure rules, incentives to share information, and welfare. RAND
Journal of Economics 21 (3): 409-430.

33
Appendix A
Sample Selection
Observations
Firm-years Firms
Customer data from 1999 to 2013a 65,031 10,371
Customer Type=GEOREG or MKT (11,592) (1,191)
Financials and Utilities (4,160) (814)
Customer Type=GOV (3,209) (225)
Total 46,070 8,141
Noisy Industry & missing variablesb (25,756) (4,205)
Final Samplec 20,314 3,936
a Compustat Historical Segment file. The sample begins in 1999 to keep the accounting standard regime
constant. b.Noisy industries include unclassified industries (SIC >8999). Firms are required to have available data
from Compustat to compute the control variables. c The final sample consists of 20,314 firm-years; and 3,866 firms.
Appendix B
Customer Distress Events a
Auditor Changes
Discontinued Operations/Downsizings
Auditor Going Concern Doubts
Write Offs
Credit Rating Watch/Downgrade/Not-Rated Action
Index Constituent Drops
Debt Defaults
Lawsuits & Legal Issues
Delayed Earnings Announcements
Regulatory Agency Inquiries
Delayed SEC Filings
Restatements of Operating Results
Impairments Dividend Cancellation
a Distress events are press releases classified as “potential red flags/distress indicators” in the S&P Capital
IQ key developments database.

34
Appendix C
Variable Definitions
Dependent Variable (Measure of Disclosure Quality)
NOCUSTNAME = 1 (0 otherwise) if the name of the reported customer is not disclosed.
Independent Variables (Measures of Private Competition and Agency/Proprietary Costs)
PRIVSALE%_100 = Percentage of private firm sales within the top 100 firms in the industry.
PRIVSALE%_ALL = Percentage of private firm sales within all firms in the industry.
PC =1 (0 otherwise) if:
(i) Firm performance [sales (SALE) less cost of goods sold (COGS)
divided by sales (SALE)] is greater than the equal-weighted
average performance of all firms in the industry-year (top quartile
of industry-adjusted gross profit margin),
(ii) and the proportion of major customer sales to total firm sales is at
least 20%.
AC =1 (0 otherwise) if:
(i) Firm performance [sales (SALE) less cost of goods sold (COGS)
divided by sales (SALE)] is less than the equal-weighted average
performance of all firms in the industry-year (bottom quartile of
industry-adjusted gross profit margin),
(ii) and the proportion of major customer sales to total firm sales is at
least 20%.
Control Variables
NOCUSTNAME_PEER = Proportion of unidentified customers among the supplier’s product market
peers (data on product market peers available from Hoberg and Phillips
(2015).
CONC = Concentration of sales among the 100 largest firms in the industry (data
available from LexisNexis Academic)
RD_SA = Research and development expense (XRD) divided by total revenue
(REVT).
INTANG_AT = Intangible assets (INTAN) less goodwill (GDWL) divided by lagged total
assets (AT).
ADV_SA = Advertising expense (XAD) divided by lagged total revenue (REVT).
BIGN = 1 (0 otherwise) if the company is audited by a top five accounting firm or
its predecessors.
LAT = Natural log of total assets (AT).
MTB = Ratio of market value (PRCC_F × CSHO) to book value (CEQ)
LEV = Long term debt (LT) divided by total assets (AT).
CSR =major customer sales (SALECS) divided by total firm sales (SALE)

35
Appendix C
Variable Definitions (Cont’d)
Additional Control Variables
PROF_ADJ = Inverse of the speed at which profits revert to their industry mean (see
Appendix C of Ellis, Fee and Thomas (2012) for details).
Customer Distress and Non-disclosure of Distressed Customer Identity
Dependent Variable
SUPP_CAR = Supplier’s cumulative abnormal return around customers’ distress events.
Independent Variables
NOCUSTNAME = 1 (0 otherwise) if the name of a distressed customer is not disclosed.
CUST_CAR = Customer’s cumulative abnormal return around customers’ distress
events.

36
Table 1
Panel A: Descriptive Statistics
All Firms (N=20,314)
Customer Sales Proportion ≥ 20% (N=14,726)
Variable Mean S.D. Min 0.25 Mdn 0.75
Mean S.D. Min 0.25 Mdn 0.75
Dependent Variable (Measure of Disclosure Quality)
NOCUSTNAME 0.42 0.45 0.00 0.00 0.25 1.00 0.40 0.43 0.00 0.00 0.25 1.00
Independent Variables (Measures of Private Competition and Agency/Proprietary Costs)
PRIVSALE%_100 0.40 0.26 0.00 0.21 0.29 0.58
0.38 0.25 0.00 0.17 0.29 0.58
PRIVSALE%_ALL 0.49 0.25 0.02 0.31 0.42 0.71 0.47 0.25 0.02 0.25 0.42 0.68
PC 0.18 0.39 0.00 0.00 0.00 0.00
0.25 0.43 0.00 0.00 0.00 1.00
AC 0.19 0.39 0.00 0.00 0.00 0.00
0.27 0.44 0.00 0.00 0.00 1.00
Control Variables
NOCUSTNAME_PEER 0.41 0.22 0.00 0.29 0.38 0.50 0.39 0.20 0.00 0.28 0.37 0.50
CONC 0.18 0.13 0.01 0.09 0.16 0.22 0.18 0.13 0.01 0.09 0.16 0.25
RD_SA 0.28 0.77 0.00 0.00 0.03 0.18
0.33 0.86 0.00 0.00 0.04 0.21
INTANG_AT 0.05 0.09 0.00 0.00 0.00 0.05
0.05 0.09 0.00 0.00 0.00 0.05
ADV_SA 0.01 0.03 0.00 0.00 0.00 0.00
0.01 0.03 0.00 0.00 0.00 0.00
BIGN 0.89 0.32 0.00 1.00 1.00 1.00
0.88 0.32 0.00 1.00 1.00 1.00
LAT 5.20 1.93 0.02 3.81 5.08 6.53
5.08 1.91 0.02 3.72 4.98 6.34
MTB 2.28 2.56 0.48 1.09 1.55 2.51
2.34 2.66 0.48 1.10 1.56 2.57
LEV 0.15 0.20 0.00 0.00 0.05 0.25
0.15 0.21 0.00 0.00 0.04 0.24
CSR 0.42 0.28 0.00 0.18 0.37 0.61
0.53 0.24 0.20 0.33 0.49 0.71
NCUST 2.23 1.45 1.00 1.00 2.00 3.00
2.60 1.50 1.00 2.00 2.00 3.00
LAGE 2.62 0.65 0.69 2.08 2.56 3.04
2.59 0.65 0.69 2.08 2.56 3.04
Table 1 continued on next page.

37
Table 1 Panel B: Industry Distribution of Observations
SIC2 Description N NOCUSTNAME NOCUSTNAME_PEER PRIVSALE%_100 PRIVSALE%_ALL 13 Oil & Gas Extraction 1,656 30% 30% 18% 21% 16 Heavy Construction, Except Building 90 43% 42% 36% 76% 20 Food & Kindred Products 331 47% 41% 50% 54% 22 Textile Mill Products 114 35% 44% 72% 76% 24 Lumber & Wood Products 67 52% 60% 68% 78% 25 Furniture & Fixtures 81 46% 48% 77% 80% 26 Paper & Allied Products 129 56% 55% 45% 47% 27 Printing & Publishing 100 62% 50% 72% 74% 28 Chemical & Allied Products 2,704 36% 34% 25% 33% 29 Petroleum & Coal Products 80 26% 34% 18% 19% 30 Rubber & Miscellaneous Plastics Products 238 42% 44% 62% 79% 33 Primary Metal Industries 252 52% 50% 84% 87% 34 Fabricated Metal Products 154 59% 53% 57% 68% 35 Industrial Machinery & Equipment 1,478 44% 42% 27% 36% 36 Electronic & Other Electric Equipment 3,325 37% 37% 38% 46% 37 Transportation Equipment 790 30% 38% 42% 50% 38 Instruments & Related Products 2,127 42% 40% 32% 46% 39 Miscellaneous Manufacturing Industries 217 42% 41% 40% 51% 40 Railroad Transportation 71 51% 53% 49% 49% 42 Trucking & Warehousing 311 76% 73% 48% 68% 44 Water Transportation 56 48% 40% 67% 68% 45 Transportation by Air 107 28% 33% 55% 58% 47 Transportation Services 91 71% 71% 77% 85% 48 Communications 598 39% 41% 67% 70% 50 Wholesale Trade - Durable Goods 557 67% 52% 68% 78% 51 Wholesale Trade - Nondurable Goods 213 45% 45% 41% 48% 59 Miscellaneous Retail 189 60% 47% 44% 48% 73 Business Services 3,042 47% 46% 39% 55% 78 Motion Pictures 115 35% 40% 90% 92% 80 Health Services 228 29% 34% 72% 79% 87 Engineering & Management Services 604 58% 50% 72% 79%
Total 20,115 The first (second) section of Table 1, panel A, provides descriptive statistics for 20,314 (14,726) firm-year observations for all firms (firms with
customer sales proportion ≥ 20%). Table 1, panel B, provides descriptive statistics for 20,314 firm-year observations by industry, limiting to
industries with at least 50 observations. See Appendix C for variable definitions.

38
Table 2 Correlation Matrix : All Firms (N=20,314)
Variable A B C D E F G H I
A. NOCUSTNAME
0.10 0.12 ‒0.10 0.03 0.27 ‒0.02 ‒0.06 0.01 B. PRIVSALE%_100 0.12
0.98 ‒0.25 0.10 0.18 ‒0.18 ‒0.17 0.01
C. PRIVSALE%_ALL 0.12 0.98
‒0.26 0.10 0.21 ‒0.25 ‒0.18 0.01
D. PC ‒0.09 ‒0.26 ‒0.26
‒0.23 ‒0.11 0.01 0.09 0.00
E. AC 0.04 0.11 0.11 ‒0.23
0.02 0.01 0.04 ‒0.02
F. NOCUSTNAME_PEER 0.28 0.19 0.21 ‒0.12 0.03
‒0.06 ‒0.11 0.00
G. CONC ‒0.05 ‒0.39 ‒0.43 0.04 ‒0.01 ‒0.10
‒0.05 ‒0.02
H. RD_SA ‒0.11 ‒0.29 ‒0.29 0.18 ‒0.06 ‒0.15 ‒0.08
0.01
I. INTANG_AT 0.04 0.04 0.03 ‒0.05 ‒0.02 0.05 ‒0.07 0.08
J. ADV_SA 0.04 0.01 0.02 ‒0.02 ‒0.03 0.06 ‒0.02 0.09 0.19
K. BIGN ‒0.01 ‒0.03 ‒0.03 0.04 ‒0.03 ‒0.03 0.01 0.04 ‒0.03
L. LAT 0.00 0.00 0.00 ‒0.03 ‒0.03 0.01 0.03 ‒0.26 0.20
M. MTB ‒0.02 ‒0.19 ‒0.19 0.17 ‒0.10 ‒0.06 ‒0.01 0.38 0.02
N. LEV 0.01 0.04 0.02 ‒0.04 0.03 ‒0.02 0.10 ‒0.33 0.05
O. CSR ‒0.10 ‒0.15 ‒0.16 0.45 0.10 ‒0.15 0.01 0.18 ‒0.12
P. NCUST ‒0.07 ‒0.05 ‒0.05 0.29 0.06 ‒0.06 ‒0.01 0.02 ‒0.03
Q. LAGE 0.03 0.04 0.01 ‒0.06 0.01 0.04 0.04 ‒0.15 0.05
Table 2 (continued)
Correlation Matrix : All Firms (N=20,314)
Variable J K L M N O P Q A. NOCUSTNAME 0.01 ‒0.01 ‒0.02 ‒0.01 0.00 ‒0.13 ‒0.09 0.04 B. PRIVSALE%_100 ‒0.02 ‒0.01 0.01 ‒0.12 0.01 ‒0.14 ‒0.03 0.03
C. PRIVSALE%_ALL ‒0.02 ‒0.02 ‒0.01 ‒0.12 ‒0.01 ‒0.16 ‒0.03 0.02
D. PC 0.01 0.04 ‒0.03 0.11 0.00 0.41 0.23 ‒0.06
E. AC 0.01 ‒0.03 ‒0.03 ‒0.05 0.02 0.08 0.05 0.01
F. NOCUSTNAME_PEER ‒0.01 ‒0.03 0.03 ‒0.02 ‒0.03 ‒0.14 ‒0.05 0.06
G. CONC ‒0.01 0.00 0.04 ‒0.04 0.08 ‒0.01 0.00 0.04
H. RD_SA 0.02 0.05 ‒0.19 0.23 ‒0.03 0.29 0.00 ‒0.16
I. INTANG_AT 0.13 0.00 0.08 ‒0.02 0.09 ‒0.05 0.00 ‒0.04
J. ADV_SA
0.00 ‒0.03 0.07 ‒0.01 ‒0.03 ‒0.03 ‒0.05
K. BIGN ‒0.04
0.17 0.02 0.05 0.00 ‒0.01 ‒0.08
L. LAT 0.00 0.18
‒0.17 0.28 ‒0.14 0.06 0.23
M. MTB 0.07 0.05 ‒0.10
‒0.07 0.08 ‒0.04 ‒0.17
N. LEV ‒0.08 0.05 0.37 ‒0.17
‒0.02 0.02 0.04
O. CSR ‒0.13 ‒0.01 ‒0.14 0.07 ‒0.07
0.48 ‒0.13
P. NCUST ‒0.07 ‒0.02 0.04 ‒0.04 0.00 0.56
0.01
Q. LAGE 0.00 ‒0.09 0.19 ‒0.14 0.09 ‒0.12 0.00
The table finds the correlation between the variables using the sample of 20,314 firm-year observations.
Pearson correlations are reported on the top right and Spearman correlations on the bottom left. All
correlations are significant at least at the 10% level except the correlations in bold. See Appendix C for
variable definitions.

39
Table 3
Univariate Test Results
Comparison
Difference in Average NOCUSTNAME
Difference (t-stats.)
High PRIVSALE %
Low PRIVSALE %
All Firms (N=20,314)
PC vs. BASE
0.08
0.07
0.01 (0.48)
AC vs. BASE
0.11
0.07
0.04 (3.48)
Firms with Customer Sales Proportion ≥ 20% (N=14,726)
PC vs. BASE
0.08
0.05
0.03 (1.66)
AC vs. BASE
0.11
0.05
0.06 (4.96)
The table provides univariate test results. High (Low) PRIVSALE% is an indicator variable that takes the
value of 1 (0) if PRIVSALE%_100 is above (below) the mean. See Appendix C for variable definitions.

40
Table 4
Logistic Regression Estimate for Customer Identity Disclosure Decision
Test of H1
NOCUSTNAMEi,t = α0 + α1PRIVFIRM%i,t + βnControlsn,i,t + i,t
PRIVFIRM%= PRIVSALE%_100
(1)
All Firms Customer Sales
Proportion ≥20%
Variables Sign Coef. t-stat. Coef. t-stat.
PRIVSALE%_100 + 0.588*** 9.712 0.659*** 9.184
NOCUSTNAME_PEER 2.379*** 29.925 2.161*** 22.155
CONC ‒0.134 ‒1.146 ‒0.115 ‒0.815
RD_SA ‒0.109*** ‒5.099 ‒0.122*** ‒5.456
INTANG_AT 0.288* 1.780 0.363* 1.901
ADV_SA 0.839 1.473 1.213* 1.863
BIGN 0.054 1.143 0.087 1.604
LAT ‒0.016* ‒1.862 ‒0.015 ‒1.535
MTB ‒0.002 ‒0.412 ‒0.007 ‒0.998
LEV 0.093 1.228 0.103 1.192
CSR 0.058 0.876 0.134 1.620
NCUST 0.125*** 9.556 0.092*** 7.001
LAGE 0.042* 1.786 0.104*** 3.717
Constant ‒1.447*** ‒14.291 ‒1.516*** ‒12.157
N
20,314
14,726
Pseudo R2 0.056 0.048
This table presents results from estimating model (1). For each regression, the estimated coefficients
(two-sided t-statistics) are presented in the first (second) column. In the first two columns, PC and AC are
constructed with two conditions including major customer sales as a proportion of total supplier sales ≥
20%. The next two columns excludes the 20% condition for PC and AC and limits the sample to only
suppliers with major customer sales as a proportion of total supplier sales ≥ 20%. Please refer to
Appendix A for sample selection criteria and Appendix C for variable definitions. ***, **, and * indicate
significance (two-tailed) at the 1%, 5%, and 10% levels, respectively.
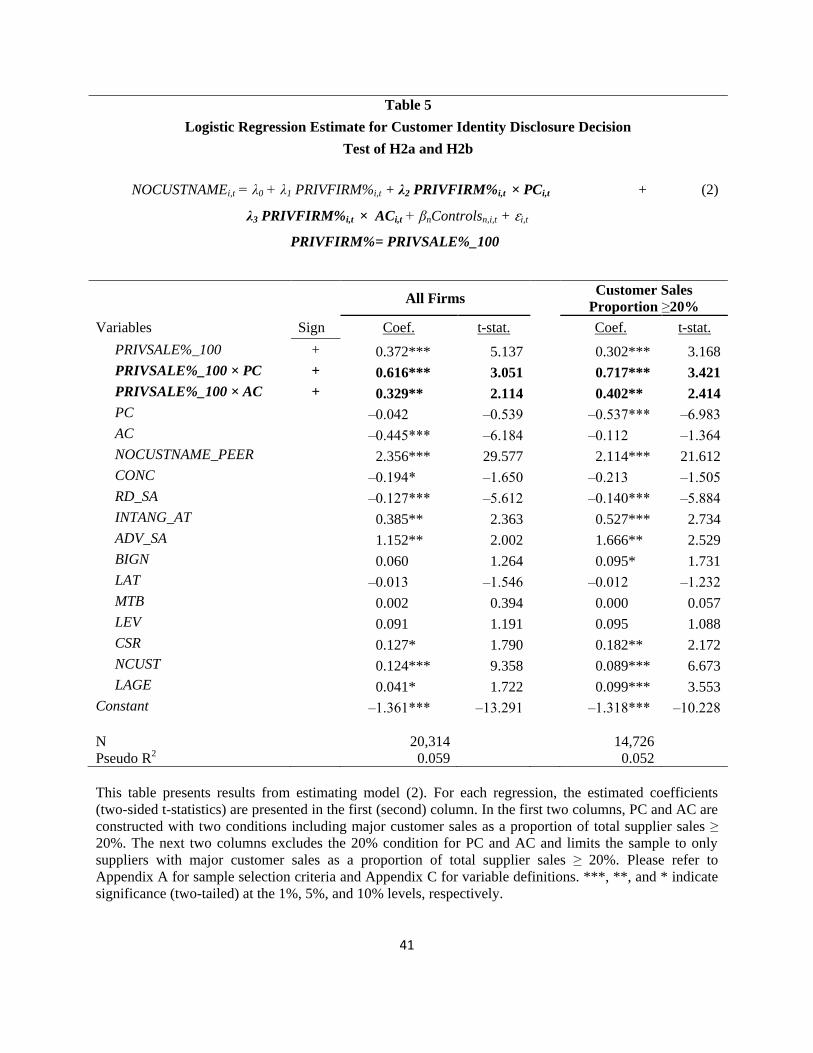
41
Table 5
Logistic Regression Estimate for Customer Identity Disclosure Decision
Test of H2a and H2b
NOCUSTNAMEi,t = λ0 + λ1 PRIVFIRM%i,t + λ2 PRIVFIRM%i,t × PCi,t +
λ3 PRIVFIRM%i,t × ACi,t + βnControlsn,i,t + i,t
PRIVFIRM%= PRIVSALE%_100
(2)
All Firms Customer Sales
Proportion ≥20%
Variables Sign Coef. t-stat. Coef. t-stat.
PRIVSALE%_100 + 0.372*** 5.137 0.302*** 3.168
PRIVSALE%_100 × PC + 0.616*** 3.051 0.717*** 3.421
PRIVSALE%_100 × AC + 0.329** 2.114 0.402** 2.414
PC ‒0.042 ‒0.539 ‒0.537*** ‒6.983
AC ‒0.445*** ‒6.184 ‒0.112 ‒1.364
NOCUSTNAME_PEER 2.356*** 29.577 2.114*** 21.612
CONC ‒0.194* ‒1.650 ‒0.213 ‒1.505
RD_SA ‒0.127*** ‒5.612 ‒0.140*** ‒5.884
INTANG_AT 0.385** 2.363 0.527*** 2.734
ADV_SA 1.152** 2.002 1.666** 2.529
BIGN 0.060 1.264 0.095* 1.731
LAT ‒0.013 ‒1.546 ‒0.012 ‒1.232
MTB 0.002 0.394 0.000 0.057
LEV 0.091 1.191 0.095 1.088
CSR 0.127* 1.790 0.182** 2.172
NCUST 0.124*** 9.358 0.089*** 6.673
LAGE 0.041* 1.722 0.099*** 3.553
Constant ‒1.361*** ‒13.291 ‒1.318*** ‒10.228
N
20,314
14,726
Pseudo R2 0.059 0.052
This table presents results from estimating model (2). For each regression, the estimated coefficients
(two-sided t-statistics) are presented in the first (second) column. In the first two columns, PC and AC are
constructed with two conditions including major customer sales as a proportion of total supplier sales ≥
20%. The next two columns excludes the 20% condition for PC and AC and limits the sample to only
suppliers with major customer sales as a proportion of total supplier sales ≥ 20%. Please refer to
Appendix A for sample selection criteria and Appendix C for variable definitions. ***, **, and * indicate
significance (two-tailed) at the 1%, 5%, and 10% levels, respectively.

42
Table 6
Logistic Regression Estimate for Customer Identity Disclosure Decision
Test of H2a and H2b
NOCUSTNAMEi,t = λ0 + λ1 PRIVFIRM%i,t + λ2 PRIVFIRM%i,t × PCi,t +
λ3 PRIVFIRM%i,t × ACi,t + βnControlsn,i,t + i,t
PRIVFIRM%= PRIVSALE%_ALL
(2)
All Firms Customer Sales
Proportion ≥20%
Variables Sign Coef. t-stat. Coef. t-stat.
PRIVSALE%_ALL + 0.507*** 6.617 0.491*** 4.927
PRIVSALE%_ALL × PC + 0.453** 2.314 0.520** 2.545
PRIVSALE%_ALL × AC + 0.410** 2.570 0.435** 2.550
PC ‒0.119 ‒1.295 ‒0.503*** ‒5.505
AC ‒0.425*** ‒4.967 ‒0.170* ‒1.751
NOCUSTNAME_PEER 2.315*** 28.943 2.071*** 21.086
CONC ‒0.175 ‒1.478 ‒0.166 ‒1.166
RD_SA ‒0.118*** ‒5.217 ‒0.130*** ‒5.492
INTANG_AT 0.378** 2.326 0.509*** 2.643
ADV_SA 1.095* 1.904 1.581** 2.401
BIGN 0.061 1.290 0.096* 1.750
LAT ‒0.009 ‒1.084 ‒0.008 ‒0.804
MTB 0.002 0.414 0.000 0.051
LEV 0.110 1.444 0.115 1.323
CSR 0.160** 2.250 0.224*** 2.661
NCUST 0.122*** 9.153 0.086*** 6.473
LAGE 0.041* 1.732 0.100*** 3.575
Constant ‒1.485*** ‒13.930 ‒1.476*** ‒10.983
N
20,314
14,726
Pseudo R2 0.060 0.053
This table presents results from estimating model (2). For each regression, the estimated coefficients
(two-sided t-statistics) are presented in the first (second) column. In the first two columns, PC and AC are
constructed with two conditions including major customer sales as a proportion of total supplier sales ≥
20%. The next two columns excludes the 20% condition for PC and AC and limits the sample to only
suppliers with major customer sales as a proportion of total supplier sales ≥ 20%. Please refer to
Appendix A for sample selection criteria and Appendix C for variable definitions. ***, **, and * indicate
significance (two-tailed) at the 1%, 5%, and 10% levels, respectively.

43
Table 7
Logistic Regression Estimate for Customer Identity Disclosure Decision
Test of H2b: Agency Cost, Supplier Dependence on Major Customers, and Managerial Ability
Variables
Durable Goods
Relationship Specific Investments
Low Market Share
PRIVSALE%_ALL× PC
0.543 0.180
0.460 0.910***
0.695** 1.023***
(1.415) (0.772)
(1.565) (3.201)
(2.390) (3.440)
PRIVSALE%_ALL × AC
0.927*** 0.061
0.784*** 0.079
1.033*** –0.199
(3.439) (0.299)
(2.686) (0.396)
(4.195) (–0.821)
Difference
P-Value
P-Value
P-Value
PC
0.418
0.271
0.430
AC 0.010
0.046
0.000
Variables
Many Product Market Peers
Financial Distress
Low Managerial Ability
PRIVSALE%_ALL × PC
0.554** –0.494
0.567** 0.290
0.561* 0.197
(2.067) (–1.462)
(2.177) (0.937)
(1.775) (0.715)
PRIVSALE%_ALL × AC
1.021*** –0.124
0.700*** –0.176
0.545** 0.135
(3.934) (–0.557)
(3.106) (–0.698)
(2.339) (0.542)
Difference
P-Value
P-Value
P-Value
PC
0.015
0.492
0.385
AC 0.001
0.010
0.231 This table presents results from estimating model (2) using 20,314 firm-year observations for all firms from 1999 to 2013. For each regression, the
estimated coefficients (the two-sided t-statistics) are presented in the top (bottom) row. The first and third (second and fourth) column of each
section presents results for suppliers with high (low) dependence on major customers. The P-Values denote statistical significance of the
difference in coefficients across high and low supplier dependence (managerial ability). Please refer to Appendix A for sample selection criteria
and Appendix C for variable definitions. ***, **, and * indicate significance (two-tailed) at the 1%, 5%, and 10% levels, respectively.

44
Table 8
Supplier Cumulative Abnormal Returns around Customer Distress Announcements
SUPPCAR i,t = λ0 + λ1 CUSTCAR i,t + λ2 NOCUSTNAME i,t
+λ3 CUSTCAR i,t × NOCUSTNAME i,t
+ βnControlsn,i,t + i,t
(3)
Window = [‒1, +1] [‒2, +2]
Variables Sign Coef. t-stat.
Coef. t-stat.
CUSTCAR + 0.045*** 3.863 0.039** 3.231
NOCUSTNAME ? –0.005 –1.532 –0.004 –1.168
CUSTCAR × NOCUSTNAME ‒ –0.044*** –3.039 –0.041* –1.940
Constant 0.027 0.360 0.030 0.304
Year FE Yes Yes
Industry FE Yes Yes
N 2,166 2,179
Adjusted R2 0.019 0.019
Coef. t-stat.
Coef. t-stat.
CUSTCAR when NOCUSTNAME=1 –0.002 –0.201
–0.005 –0.267
This table presents results from estimating model (3) using 2,166 (2,179) bankruptcy-supplier-year
observations for return window [‒1, +1] ([‒2, +2]) from 1999 to 2013. For each regression, the estimated
coefficients are presented in the first column and the two-sided t-statistics are in the second column.
Please refer to Appendix B for examples of customer distress events and Appendix C for variable
definitions. Standard errors are clustered by bankruptcy. ***, **, and * indicate significance (two-tailed)
at the 1%, 5%, and 10% levels, respectively.