Embed Size (px)
Citation preview

When the first microcontrollers with on-chip de-bugging interface appeared on the market, the first debug solutions offered were relatively simple com-pared to the prevailing in-circuit emulators. It soon became clear that pure debuggers without trigger and trace options were not adequate for developing complex embedded designs efficiently. The scope of on-chip debugging and trace interfaces has been enlarged gradually, enabling very complex test and analysis functions with today’s development tools.
Cooperation with chip manufacturersIn the past, the functionality of the on-chip de-bugging and trace logic was usually defined by the semiconductor manufacturer. Today more and more silicon vendors are interested in working closely with Lauterbach at an early stage in their development cycle to assure optimal interaction between the microcontroller and the development tools by the time their products get to market. This development is reinforced by the fact that many end customers / OEMs make Lauterbach support a requirement for new processor families. There-fore many established chip manufacturers rely on Lauterbach as a strategic partner and have signed contracts to ensure on-time availability of tools for their latest processor families.
Internationa�� committeesternationa�� committeesMany customers would like to see a higher level of standardization of the on-chip debug and trace logic as well as a reduction in pincount without any performance loss. In order to take an active role in the development of innovative debug and trace technologies, Lauterbach has been participating in various international committees over the past years:• Lauterbach has been a member of the Nexus
5001™ Forum ever since its foundation and was first to market with tools conforming to the NEXUS specification.
• In the Test & Debug Working Group of the MIPI Alliance, Lauterbach has been involved in the definition of interfaces as well as corresponding test and debug tools for mobile phones.
• Lauterbach has been an active member of the IEEE P1149.7 Working Group for the definition of new JTAG standards ever since its foundation.
In 2006 Lauterbach was able to significantly staff up its engineering departments, further strength-ening its leadership position in high performance development tools for a wide range of processor architectures.
This NEWS provides information about upcom-ing products planned for 2007 plus the latest and greatest features that were recently implemented.
PowerDebug
PowerTrace
Power- Integrator
PowerView
PowerProbe
What’s new at EmbeddedSystems Conference 2007
Contents
New IDE Links 2
Debugging of Embedded Linux 3
New Supported Processors 7
New Tools for the Cortex-M Series 8
News about ARM-ETM 10
Optimization of Energy Consumption 11
Strategic Partnership with Chip Manufacturers
www.lauterbach.com

www.lauterbach.com
DEBUGGER, REAL-TIME TRACE, LOGIC ANALYZER
NEWS 2007
�
PowerDebug
PowerTrace
Power- Integrator
PowerView
PowerProbe
Ec��ipseSince September 2006, Lauterbach has suppor-ted the link to Eclipse C / C++ Development Too- ling (CDT). Full integration into CDT is planned for October 2007.
CDT linkTRACE32 supports the CDT link as of Eclipse ver-sion 3.1.2, which means that the following features can be offered:
• The TRACE32 debugger can be started direct from Eclipse. Complex multicore / multiprocessor configurations are also supported.
• Debugger breakpoints can be set in the Eclipse source code editor.
• The user can jump to the relevant line in the Eclipse source code editor from all TRACE32 windows containing source code.
Full integrationIn preparation for full integration in the CDT debug-ger, Lauterbach is cooperating on the Debugger Ser-vice Framework (DSF). The goal of DSF is to develop a high-performance standard interface between the CDT debugger and the hardware debug back-end. Lauterbach is planning to provide full integration using DSF as an Early Adopter by October 2007.
However, full integration in the CDT debugger will not replace the Lauterbach GUI PowerView.
Windows CE P��atform Bui��derIntroduced in December 2006, TRACE32 devel-opment tools can be used in the Windows CE Platform Builder as the hardware debug back-end.For integration, a driver has been developed that uses the Extended Debugging Interface (eXDI2) to connect the TRACE32 development tools to the debugging interface of the Windows CE Platform Builder.
RhapsodyFor 2007, Lauterbach is planning integration for the Model Driven Development platform Rhapsody from I-Logix.
The following functions are planned for the first in-tegration step:
• TRACE32 development tools can be used as a hardware debug back-end in Rhapsody.
• The user can branch to the relevant Rhapsody element from all TRACE32 windows containing source code.
By summer 2007, it will also be possible to create Message Sequence Diagrams from the real-time trace recordings captured by TRACE32.
New IDE Links

Until now it has been common practice to use two different debuggers in the development of embedded Linux applications. To start up the target hardware a JTAG debugger is normally used. As soon as the essential components of embedded Linux are running on the target the process debugging continues with GDB.
At Embedded Systems Conference 2007, Lau-Lau-terbach will be presenting an integrated Linux will be presenting an integrated Linux debugger that combines these two debugging concepts. Development times for embedded Linux applications can then be reduced consid-erably since this allows the strengths of both methods to be used in a uniform user interface.
The following shows the concepts of the integrated Linux debugger using the ARM architecture as an example.
Stop Mode DebuggingA JTAG debugger works with so-called Stop Mode Debugging: The processor and thus the whole sys-tem are stopped at a breakpoint. Information about the state of the processor or the target hardware can now be read out via the JTAG interface (see Fig. 1).
Fig. 1: In Stop Mode Debugging, the processor and thus the whole system is stopped via the JTAG interface.
Some advantages of Stop Mode Debugging:
• The only requirement for Stop Mode Debugging is a functioning JTAG interface. This enables de-bugging from the reset vector.
• Debugging of the kernel and beyond process boundaries is possible using a debugger that of-fers both Linux and MMU support.
• If the software ceases to react, the processor can be stopped to find out the point in the code where the processor hung up mistakenly.
• If the processor is stopped neither the kernel or any other process can cause any disturbing ef-fects.
However, Stop Mode Debugging has a serious dis-advantage:
As soon as the processor stops, all communication interfaces are also stopped. The usual result of this is that external devices that communicate with the Linux application via Ethernet, Bluetooth or CAN will cut the connection as the application is no lon-ger responding. Therefore, stopping at a breakpoint can change the state of the overall system. Trying to continue debugging may then be meaningless.
Integrated Run & Stop Mode Debugging
www.lauterbach.com �
NEWS 2007DEBUGGER, REAL-TIME TRACE, LOGIC ANALYZER
NEWS 2007
PowerView
PowerDebug
Power- Integrator
PowerProbe
PowerTrace
Integrated Run & Stop Mode Debuggingfor Embedded Linux
Embedded Linux withGDB as debug agent
ARM Run mode debugging via DCC available
ARM Run mode debugging via Ethernet planned for Q2/2007
PowerPC Run mode debugging via Ethernet planned for Q2/2007
Symbian OS withTRK as debug agent ARM Run mode debugging via DCC available

www.lauterbach.com
DEBUGGER, REAL-TIME TRACE, LOGIC ANALYZER
NEWS 2007
�
Fig. 2: In Run Mode Debugging, the selected process is stopped while the overall system continues to run.
Run Mode DebuggingGDB works in so-called Run Mode Debugging: At a breakpoint, only the selected process is stopped, the kernel and all other processes continue to run.
However, GDB is purely a software debugger. The following is required for debugging:
• GDB server running as a Linux process on the target hardware
• debugger software – here TRACE32 – on the host (see Fig. 2)
TRACE32 communicates with the GDB server via an RS232 or Ethernet interface to query information about the currently stopped process.
Run Mode Debugging is always ideal:
• if startup of the target hardware has been com-pleted.
• if the GDB server can always be activated – that is, the communication interface is running prop-erly and the processor has not mistakenly hung up at a code point.
Quite clearly, both debugging methods have great strengths and weaknesses. For this reason, Lau-terbach now offers a debugger that combines the two methods in such a way that their strengths are fully put to use, while their weaknesses disappear completely.
Integrated Run & Stop Mode DebuggingThe TRACE32 debugger with Integrated Run & Stop Mode Debugging for embedded Linux works as follows (see Fig. 3):
1. The TRACE32 debugger is first started via the JTAG interface in Stop Mode Debugging. In a first step, the target hardware and the Run Mode Debugging (GDB) must be configured.
2. If the startup of the target hardware is the focus,
PowerTrace
Power- Integrator
PowerView
PowerProbe
Fig. 3: To test, Run Mode or Stop Mode Debugging may be used depending on requirements.
PowerDebug

Stop Mode Debugging (JTAG) is used.
3. After the hardware startup, TRACE32 can switch over to Run Mode Debugging (GDB) for applica-tion debugging. Individual processes can now be tested while the complete system is running.
4. If the connection to the GDB server is cut dur-ing Run Mode Debugging, you can switch back to Stop Mode Debugging at any time to find the cause of the problem.
Simultaneously with the implementation of Inte-grated Run & Stop Mode Debugging, the following functions have been added to Run Mode Debug-ging:
• For the ARM architecture, the Debug Communi-cations Channel (DCC) can be used as the com-munication interface in addition to ethernet and RS232. In this way, Run & Stop Mode Debug-ging can function with JTAG as the only interface (headless target).
• If required, it is possible to have simultaneous debugging of two or more processes.
DCC as communication interfaceThe JTAG interface for the ARM architecture in-cludes a so-called Debug Communications Chan-nel (DCC). In principle, information exchange via DCC should be possible between
• debugger software on the host (TRACE32)
• any application on the target system – here, with the GDB server
while the application is running on the processor.
Fig. 4: Instead of an external communication interface, you can use the DCC function of the JTAG interface as a communication channel to the GDB server.
Therefore, if TRACE32 uses the DCC function of the JTAG interface to query the GDB server for information about the currently stopped process, no external communication interface is needed for Run Mode Debugging (see Fig. 4).
Simu��taneous debugging of severa�� processes
Fig. 5: Using T32Server, a separate GDB server can be assigned to each process, enabling the simultaneous debugging of processes.
In some cases, it is necessary to debug several processes simultaneously. To be able to offer this feature, Lauterbach now provides the T32Server for Run Mode Debugging.
After T32Server has been started as a Linux pro-cess from the terminal window, the following is possible using TRACE32 commands:
• Starting processes (TASK.RUN)
• Attaching to running processes (TASK.SELect)
• Ending processes (TASK.KILL)
When a process is started/attached, a sepa-rate GDB server is assigned to each process by T32Server (see Fig. 5). Fig. 6 on the next page shows TRACE32 Run Mode Debugging using the example of a TASK.List win-dow.
SummaryIntegrated Run & Stop Mode Debugging offers an optimum basis for the efficient development of em-bedded Linux applications enabling the user to find
www.lauterbach.com �
NEWS 2007DEBUGGER, REAL-TIME TRACE, LOGIC ANALYZER
NEWS 2007
PowerView
PowerDebug
Power- Integrator
PowerProbe
PowerTrace
complex hardware and software errors quickly using a single development tool and a universal user interface. In addi-tion no modifications are needed to ei-ther the application or Linux.
Integrated Run & Stop Mode Debug-ging has been supported for the ARM architecture since November 2006 and can be used at no extra cost with every TRACE32 JTAG debugger for an ARM processor.
An implementation for PowerPC archi-tectures is planned for May 2007.
www.lauterbach.com
DEBUGGER, REAL-TIME TRACE, LOGIC ANALYZER
NEWS 2007
�
Termina�� window via DCC as the communication channe��Since July 2006, it has been possible to operate the terminal window via the Debug Communications Channel for all ARM architectures.
TRACE32 as GDB front endSince October 2006, the TRACE32 user inter-face can also be used as the front-end for GDB debugging.
The standard GDB server can be used as a debug agent to debug individual processes. The simulta-neous debugging of two or more processes is pos-sible with T32Server.
In contrast to Integrated Run & Stop Mode De-bugging, no debugger hardware is needed for the TRACE32 GDB front-end. As a pure user interface, the front-end is processor-independent and cur-rently supports ARM, PowerPC, and MIPS archi-tecture. Possible communication interfaces are RS232 and ethernet.
Further News about Linux
PowerTrace
Power- Integrator
PowerView
PowerProbe
CMX RTX für PowerPC Available
DSP/BIOS für TMS320C64xx Available
eCOS für MIPS Planned
FreeRTOS für ARM Planned
MQX 2.5 für ColdFire Available
NetBSD für PowerPC Planned
NORTi für Nios II und PowerPC Available
OS9 für PowerPC Planned
OSE Delta 5.2 Load Modules Planned
PikeOS für PowerPC Available
PrKERNEL für ARM Available
QNX 6.3.2 Available
Quadros für C16x und StarCore Available
SMX 3.7 Available
T-Kernel für MIPS Planned
ThreadX V5, auch für Nios II Available
VxWorks 6.x Available
Windows CE 6.0 Planned
µClinux für MicroBlaze Planned
µC/OS-II für MIPS Available
New Supported RTOS
Fig. 6: The hello and helloloop processes are stopped. The helloloop process is the process currently selected for debugging.
PowerDebug

www.lauterbach.com �
NEWS 2007DEBUGGER, REAL-TIME TRACE, LOGIC ANALYZER
NEWS 2007
PowerView
PowerDebug
Power- Integrator
PowerProbe
PowerTrace
Analog Devices
BlackFin® Available
ARC ARC® 600 Core Available
Freescale™ MPC8641D Available
Infineon XC800 Familie Available
Marvell ARM CPU Feroceon
Available
Mentor Graphics™
M8051EW Available
Tensilica Diamond Stan-dard ProcessorsXtensa Processors
Available
Q2/2007
TexasInstru-ments
TMS320C2000 Q2/2007
Xilinx® MicroBlaze™ Available
RISC / CISCLauterbach is seen, worldwide, as a leading manu-facturer of high-quality debugging and real-time trace tools. Traditionally, Lauterbach development tools are mainly used for debugging embedded de-signs with complex 32-bit RISC architectures. Our most successful products in 2006 were the debug-ging and trace tools for ARM9 and the MPC55xx family from Freescale.
With its debuggers, Lauterbach also supports a large number of processor architectures primarily used in designs which have a very high pressure on costs. These include the Cortex-M series from ARM as well as (new in 2007) the XC800 family from Infineon and M8051EW from Mentor Graphics.
DSPsSince 2003, Lauterbach has been increasing its
range of debuggers for digital signal processors (DSPs). This is how Lauterbach was able to follow the increased usage of DSPs in multicore proces-sors.
In addition to the debuggers for DSPs from Texas Instruments, the development tools for the Star-Core DSPs and the DSPs from Ceva have all dem-onstrated strong growth in 2006.
SoftcoresIn 2005, Lauterbach launched the first debugging and real-time trace tools for a softcore. Profes-sional tools were developed for the NIOS II from Altera incorporating the following functions: JTAG debugger for single and multiprocessor designs, on-chip and off-chip real-time trace for recording the program and data flow.
Since August 2006, a high-performance debugger for the Xilinx MicroBlaze has been available. An off-chip real-time trace for this core is scheduled for 2007.
Configurab��e coresWith the debugger for the ARC600 core family, Lauterbach now supports a so-called configurable core for the first time. Providers of configurable cores are offering their customers the possibility of developing SoCs (system on chip) that are optimal-ly customized for the end application. For example the user can configure the number of core registers, the arithmetic library, the cache structure and size, the internal processor bus and many other areas of the core.
Configurable cores represent two new challenges for debuggers:
1. From the configuration description stored in the core, all available resources must be identified accurately in order to guarantee the debugging performance.
2. User instructions specifically developed for the end application must be specified for the disas-sembler.
Support for configurable Xtensa processors from Tensilica is planned for 2007.
New Architectures
New Supported Processors

www.lauterbach.com
DEBUGGER, REAL-TIME TRACE, LOGIC ANALYZER
NEWS 2007
�
From Spring 2007, Lauterbach will be delivering a new version of the Cortex-M family debug cable. The most important innovation is that the debug cable not only supports standard JTAG but also the 2-pin debugging interfaces, cJTAG and SW-DP.
cJTAGcJTAG (IEEE P1149.7) is an on-chip debugging in-terface defined by MIPI Alliance Inc. As an alterna-tive to the 5-pin standard JTAG interface, a 2-pin interface has been defined consisting of a clock line and a bidirectional data line (see Fig. 7 on page 9).
Seria�� Wire Debug Port (SW-DP)In the case of SoCs (system on chip) where the de-bugging and trace functionality is based on Core-Sight technology, the external debugger no longer communicates directly with the TAP controllers of the individual cores but via a so-called Debug Ac-cess Port (DAP). The task of the DAP is to distribute the debugging commands to the individual cores. Depending on the implementation of on-chip de-bugging in the individual core, communication takes place as follows:
PowerTrace
Power- Integrator
PowerView
PowerProbe
AMCC PPC405
- PPC405EZ
PPC44x
- PPC440 EPx / GRx
Broadcom MIPS64
- BCM1250 / BCM1480
Ceva TeakLite / OAK- XpertTeakLite-II
Ceva-X- Ceva-X1622 / X1641
Freescale™ MCS08
- MC9S08AW / DZ
S12X
- S12XE / S12FR
MPC5500
- MPC551x
PowerQUICC II
- MPC831x
ARM11 / StarCore
- MXC91231 / MXC91321
- MXC91331
IBM PPC74x / 75x
- PPC750CL
Infineon Tricore
- TC111x / TC116x
Marvell XScale
- PXA3xx
MIPS MIPS32
- MIPS34
NEC V850- V850ES / Dx3 / Fx3 /Sx3
Renesas H8S- H8SX
StarCore LLC StarCore- SC2000 / SC3000
TexasInstruments
TMS320C55X- C55x+
TMS320C64X- C64x+
TMS320C67X- C67x+
New Derivatives
New Debug Cab��e for Cortex-M Series
New Supported Processors (cont.)
PowerDebug

• Cores with a memory mapped debug register are controlled with the help of bus accesses. Cortex-M, for example, works with this mechanism.
• Cores that work with a tradi-tional TAP controller for de-bugging are still controlled using JTAG sequences.
Either standard JTAG or the 2-pin-wide Serial Wire Debug Port specified by ARM is used as the interface between the debugger and the DAP (see Fig. 8).
Fig. 7: The cJTAG interface, here for multichip target hardware
Fig. 8: The Serial Wire Debug Port as a 2-pin interface between the debugger and the DAP
To achieve fast download rates for the 2-pin de-bugging interfaces, the on-chip debugging inter-face works with frequencies of up to 100 MHz. To exclude reflections by the debugging cable at high frequencies, the termination of the debugging sig-nals has been moved to the target hardware con-nector.
www.lauterbach.com �
NEWS 2007DEBUGGER, REAL-TIME TRACE, LOGIC ANALYZER
NEWS 2007
PowerView
PowerDebug
Power- Integrator
PowerProbe
PowerTrace
CombiProbe – Debugger/Trace for Cortex-M
Fig. 9: PowerDebug Module and CombiProbe as low-priced development tools for the Cortex-M series
In August 2007, Lauterbach will launch a low-priced development tool for the Cortex-M family from ARM.The new development tool consists of the univer-sal debugger hardware PowerDebug and a Combi-
Probe. The most important components of the CombiProbe are:
• Probe hardware with 128-Mbyte trace memory
• 34-pin high-speed plug for target hardware
• Adapter cable for adapting the 34-pin high-speed plug to the debugging / trace interface on the target hardware
Debugging interfacesBesides standard JTAG, the CombiProbe also sup-ports the 2-pin debugging interfaces cJTAG (see Fig. 7) and Serial Wire Debug Port (see Fig. 8).
Trace interfacesUsing the CombiProbe system the following trace logs can be recorded and analyzed:
• 4-bit ETM in continuous mode
• CoreSight Single Wire Viewer (SWV)
The maximum trace frequency is 200 MHz.

To implement very large trace-port bandwidths with only a few transmission lines, Lauterbach is working on a concept for the serial transmis-sion of ETM data. Data rates of up to 6.25 Gbit / s are being targeted in the first generation. Many manufacturers are already offering Gbit-PHY transceivers on their ASICs, so it is logical that these could be used for the trace port as well. This enables the trace-port bandwidth to be increased and / or the number of pins to be reduced.
In consultation with ASIC manufacturers, the seri-alization of ETM data on the ARM-SoC is planned based on the Xilinx Aurora Protocol.
The serial preprocessor on the development tool side will receive data by means of a multi-Gbit transceiver and handles the de-serialization and clock recovery. The parallel ETM data recovered in
this way is then saved as usual in the trace RAM of the PowerTrace II.
The current version of PowerTrace II can be used with the serial preprocessor without any modifica-tion, thus once again demonstrating the flexibility of the modular concept designed into all Lauterbach tools.
At the start of 2007, Lauterbach will launch a new preprocessor version for the ARM-ETM. Together with PowerTrace II, AutoFocus II has been successfully tested with frequencies over 500 MHz.
The AutoFocus technology has been further refined to enable optimized sampling of trace signals for trace-port data rates at the boundary of what is technically feasible:
• 64 clock and 24 data delays with a resolution of 78 ps
• Low signal skew on all 40 trace channels
• Decoupling of the termination of clock and data channels
In addition to the existing comprehensive mecha-nisms for automatic preprocessor configuration and the self-test, there is now a three-dimensional eye finder for checking the quality of the ETM channels on the target hardware. This shows the data eyes for all ETM channels with timing error range of - 1.8 to + 4.9 ns as well as a voltage range from 0 to 3.3 volts. The third dimension is the channel number. The user can either analyze individual channels or see all channels superimposed. If the result of this check is that individual ETM channels have a smaller data eye than average, the hardware layout should be checked to see if these signals show any unusual features. Long lines, stub lines, and weak drivers can be some of the reasons for poor signal quality.
www.lauterbach.com
DEBUGGER, REAL-TIME TRACE, LOGIC ANALYZER
NEWS 2007
10
ARM-ETM Preprocessor AutoFocus II
PowerDebug
Power- Integrator
PowerView
PowerProbe
Seria�� ETM
PowerTrace
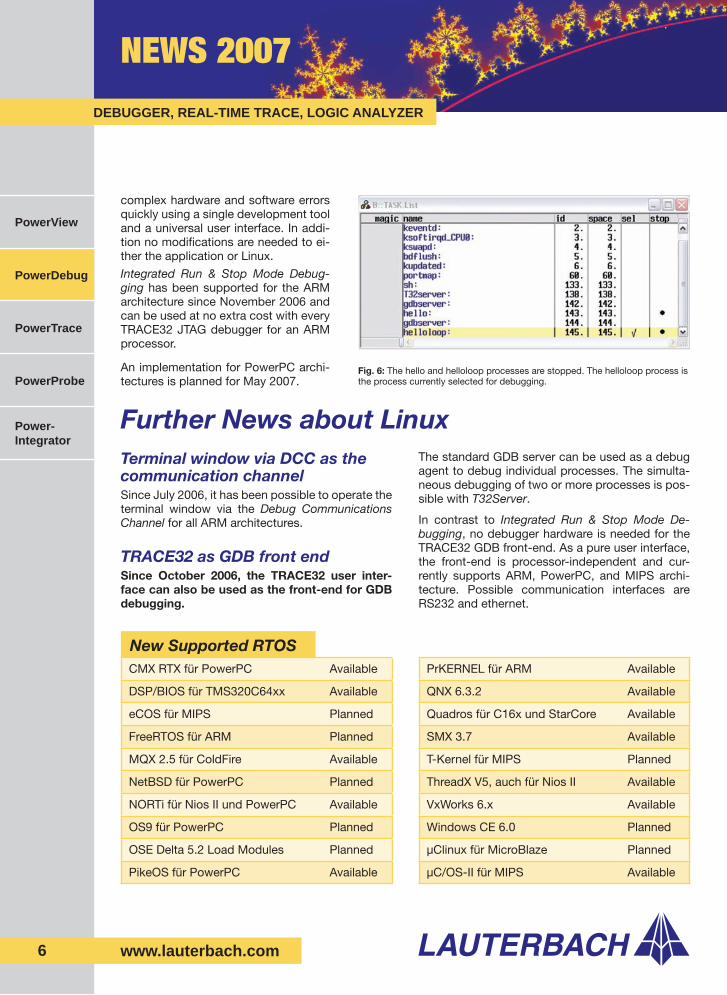
Since July 2006, PowerTrace II can be used not only to record the program and data flow but also to record up to 17 digital data channels or 4 voltage / 3 current channels.The following probes can be connected with the Logic Analyzer Probe connector of PowerTrace II (see picture):
• Standard Probe for recording up to 17 digital data channels
• Analog Probe for recording 4 voltage or 3 current channels
The real-time trace system of the PowerTrace II contains:
• Up to 2 Gigabytes of trace memory for recording the program and data flow
• A 512 k trace-entry memory for recording the ad-ditional digital or analog signals
Since the timestamps for the two trace memories are generated by the same 48-bit timer, the time correlation can be clearly displayed between the program and data flow and the additional recorded channels. The analysis of the behaviour over time of the additional channels can be made quickly and intuitively using tables or charts. If required the channel data can be easily exported as a file for further processing by external software.
www.lauterbach.com 11
NEWS 2007DEBUGGER, REAL-TIME TRACE, LOGIC ANALYZER
NEWS 2007
PowerView
PowerDebug
PowerProbe
PowerTrace
Optimization of Energy Consumption
Logic Ana��yzer Probe for PowerTrace II
• 17 digital data channels• Voltage range 0 - 5 Volt• Transient recording of up to 200 MHz
• 4 voltage channels 0 - 5 Volt• 3 current channels (shunt resistor on the target hardware)• 12-bit resolution• 625 kHz sampling rate
Standard Probe Data
Ana��og Probe Data
Reducing energy consumption is becoming ever more important in the development of battery-powered de-vices. Factors such as standby time or operating time are important parts of the specification in the market-ing of mobile phones.For this reason, comprehensive measures for reduc-ing energy consumption have become an integral part of the hardware design of battery-powered devices. However, these measures can only be effective if the software that controls the equipment consistently ex-ploits all possible power-saving features of the hard-ware.
The following questions must be asked:
• Does the program always switch the microcon-troller to the right power-saving mode?
• How do program changes affect power con-sumption?
• Are there any unexpected power peaks?
To answer these questions a system is needed that measures and records the voltage and current as well as the program and data flow and can then display all this information in a user friendly format. (continued on page 12).
Power- Integrator

We have significantly increased the size of our development group so that Lauterbach can con-tinue to lead in offering the highest performance development tools for a wide range of processor architectures. A new company building is under
construction, due for completion in 2008 to provide room for the continued growth that is planned for the next few years.
http://www.arcone-tec.de
Optimization of Energy Consumption (cont.)
www.lauterbach.com
DEBUGGER, REAL-TIME TRACE, LOGIC ANALYZER
NEWS 2007
1�
PowerView
PowerProbe
If you would like us to remove your name from our mailing list, send an e-mail to: [email protected]
Further growth p��anned
P��ease inform us:
At Embedded Systems Conference 2007, Lauterbach will demonstrate such a system.
This consists of:
• A debugger and a real-time trace
• An analog probe and a logic analyzer
As logic analyzer, either the logic analyzer in the
PowerTrace II or the PowerIntegrator can be used.
In this measuring arrangement both the current/volt-age usage and the program flow can be marked with synchronous timestamps, this means the correlation between control software and current / power con-sumption can be easily displayed and analyzed.
Fig. 11: Our planned headquarters near Munich / Germany
Fig. 10: Statistical analyses of the energy consumption of functions run by the control software
PowerDebug
PowerTrace
Power- Integrator