Embed Size (px)
Citation preview

Feasibility Studies on Joint Crediting Mechanism Projects towards Environmentally Sustainable Cities in Asia
Strategic Promotion of Recovery and Destruction of
Fluorocarbons
(English)
March 2015
E&E Solutions Inc.


Contents Outline of the Study .................................................................................... 1 Chapter 1
1. Implementation Policies and Objectives of the Survey .......................................... 2
1.1 Implementation policies and objectives of the overall project ..................................... 2
1.2 Survey implementation structure ............................................................................. 2
Results of the Study in Thailand ..................................................................... 3 Chapter 2
1. Overview of the Target Country .............................................................................. 4
1.1 Measures against climate change ............................................................................. 4
1.2 Fluorocarbon measures .......................................................................................... 6
2. Fact-finding Survey in Industrial Facilities ............................................................ 8
2.1 Overview of the fact-finding survey ........................................................................ 8
2.2 Fact-finding survey ................................................................................................ 9
3. Survey on Prevalence of Energy Saving Equipment at Commercial Facilities ... 10
3.1 Overview of the survey ........................................................................................ 10
4. Study on Recovery of Fluorocarbons and Collection of Fluorocarbon-Containing
Equipment ...................................................................................................................... 11
4.1 Current situation of recovery of fluorocarbons and collection of fluorocarbon-containing
equipment ..................................................................................................................... 11
4.2 Study on proper disposal of fluorocarbons and fluorocarbon-containing equipment .... 11
4.3 Study on logistics of fluorocarbons and fluorocarbon-containing equipment .............. 13
5. Survey on Fluorocarbon Destruction ..................................................................... 14
5.1 Current situation of fluorocarbon destruction .......................................................... 14
5.2 Study on fluorocarbon destruction ......................................................................... 14
6. Study on Collection System ................................................................................... 17
7. Confirmation of Project Implementation Structure and Finance Scheme ........... 19
7.1 Japanese food manufacturer .................................................................................. 19
7.2 Convenience store ............................................................................................... 22
8. Examination of MRV Methodologies ..................................................................... 27
8.1 Japanese food manufacturer .................................................................................. 27
8.2 Convenience store ............................................................................................... 30
8.3 Evaluation methods of fluorocarbon destruction effects ........................................... 35
Results of the Study in Malaysia .................................................................... 37 Chapter 3
1. Overview of the Target Country ............................................................................ 38
1.1 Measures against climate change ........................................................................... 38
1.2 Fluorocarbon measures ........................................................................................ 40
2. Fact-Finding Survey of Energy Saving Equipment Use ....................................... 43

2.1 Overview of the survey ........................................................................................ 43
2.2 Questionnaire survey ........................................................................................... 43
2.3 Fact-finding survey .............................................................................................. 44
3. Study on Logistics and Collection of Fluorocarbons ............................................. 48
3.1 Current situation of recovery of fluorocarbons ........................................................ 48
3.2 Current situation of destruction of fluorocarbons .................................................... 48
4. Study of Collection system ..................................................................................... 51
5. Examination of Implementation Structure and Finance Scheme ........................ 52
5.1 National hospital (M-1) ........................................................................................ 52
5.2 Commercial facility (M-2) .............................................................................. 55
5.3 University (M-3) ................................................................................................. 57
6. Examination of MRV Methodologies ..................................................................... 59
6.1 Examination of MRV Methodologies ..................................................................... 59
6.2 Evaluation methods of fluorocarbon destruction effects ........................................... 60

1
Outline of the Study Chapter 1
2
1. Implementation Policies and Objectives of the Survey
1.1 Implementation policies and objectives of the overall project
The aim of the feasibility studies on large-scale JCM (Joint Crediting Mechanism) projects is to
establish environmentally sustainable cities in Asia by discovering and forming GHG
emissions reduction projects in a large scale.
The refrigerant is used in the refrigeration and air conditioning system among high-power
consumption equipment that are installed at commercial facilities and plants of some sectors (food
manufacturing, etc.). In Southeast Asian countries including Thailand and Malaysia, fluorocarbons
such as CFC, HCFC and HFC that have a high global warming potential are mainly used. Even if
such equipment is replaced with an energy saving one and energy consumption is reduced, discharge
of refrigerant with a high global warming potential may offset the energy-saving effects. Also,
discharge of CFC and HCFC in the conventional equipment is not recommendable for ozone layer
protection. However, no system to properly treat fluorocarbons in end-of-life equipment has been
well established in Southeast Asian countries. Against the backdrop, it is critical to establish a proper
refrigerant recovery and destruction system while reducing energy consumption by replacing the
equipment.
1.2 Survey implementation structure
The Project was carried out jointly by E&E Solutions Inc., Dowa Eco-System Co., Ltd., and the
Institute for Global Environmental Strategies. The energy-efficiency diagnosis was performed in
collaboration with NTT Data Institute of Management Consulting, Inc., and NTT GP-ECO
Communications Inc. Understanding of local situations and coordination among relevant local
parties was performed in collaboration with Waste Management Siam (WMS) (Thailand) and
Universiti Teknologi Malaysia (Malaysia).

3
Results of the Study in Thailand Chapter 2

4
1. Overview of the Target Country
1.1 Measures against climate change
1.1.1 Greenhouse gas (GHG) emissions
(1) Trend of CO2 emissions
The CO2 emissions in Thailand are shown in FigureFigure 2.1.1. It illustrates the increase in the
emissions in line with economic growth. By sector, three sectors—electricity and heat-derived,
industrial, and transportation—account for a large portion of emissions. Equipment that uses
fluorocarbons (such as chillers and air conditioning systems), that are the target of the study,
consumes much electricity and curving their power consumption is critical as it contributes to CO2
emissions reduction in Thailand.
Source: Compiled based on IEA (International Energy Agency) data
Figure 2.1.1 Trend of CO2 Emissions in Thailand
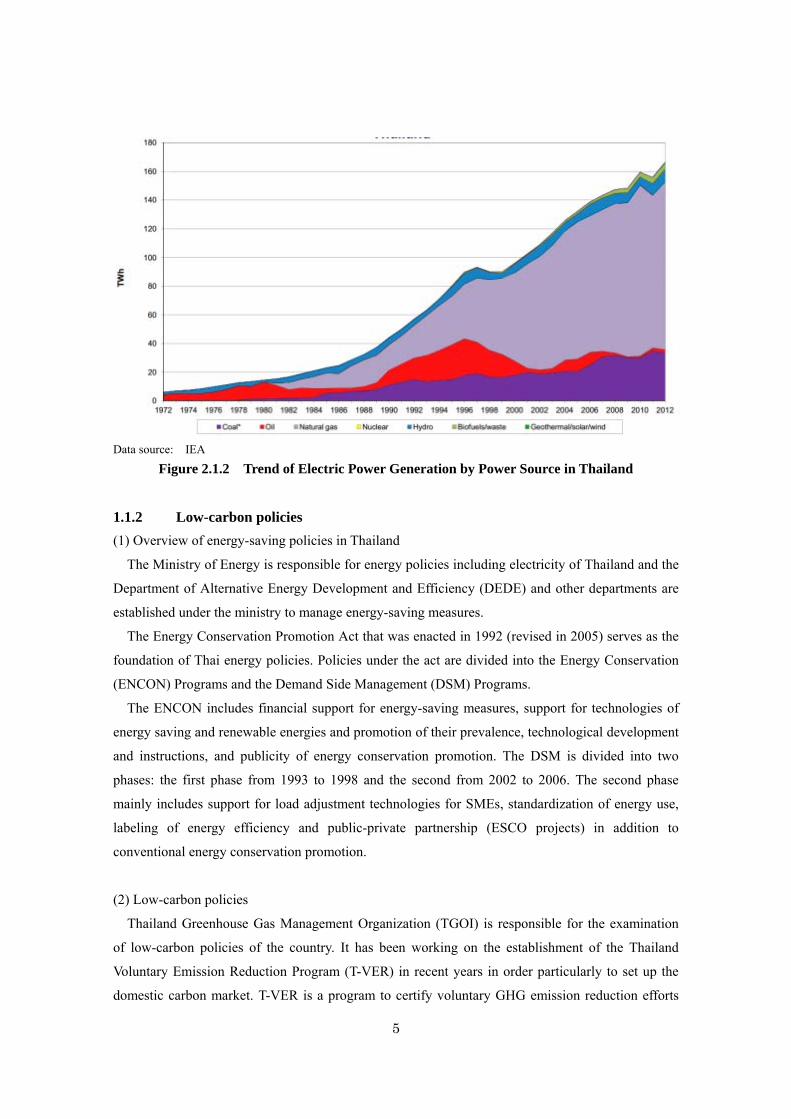
(2) Trend by power source
The electricity sector accounts for more than 30% of CO2 emissions in Thailand and the trend of
power generation by power source (fuel) is summarized in Figure 2.1.2. Natural gas accounts for
approximately 70% of power generation and coal accounts for 20%. The grid emission factor shows
that low-carbon dependence of electricity has been in progress recently in the country. When
compared with that in 2010, the ratio of natural gas-fired power generation increased and coal-fired
power generation decreased after 2012,. In consideration of this, the CO2 emission basic unitis
believed to have improved, compared with the figures announced by the government in 2010.
0
50
100
150
200
250
300
1971
1973
1975
1977
1979
1981
1983
1985
1987
1989
1991
1993
1995
1997
1999
2001
2003
2005
2007
2009
2011
CO2 emissions [m
illion tons of CO2]
5
Data source: IEA
Figure 2.1.2 Trend of Electric Power Generation by Power Source in Thailand
1.1.2 Low-carbon policies
(1) Overview of energy-saving policies in Thailand
The Ministry of Energy is responsible for energy policies including electricity of Thailand and the
Department of Alternative Energy Development and Efficiency (DEDE) and other departments are
established under the ministry to manage energy-saving measures.
The Energy Conservation Promotion Act that was enacted in 1992 (revised in 2005) serves as the
foundation of Thai energy policies. Policies under the act are divided into the Energy Conservation
(ENCON) Programs and the Demand Side Management (DSM) Programs.
The ENCON includes financial support for energy-saving measures, support for technologies of
energy saving and renewable energies and promotion of their prevalence, technological development
and instructions, and publicity of energy conservation promotion. The DSM is divided into two
phases: the first phase from 1993 to 1998 and the second from 2002 to 2006. The second phase
mainly includes support for load adjustment technologies for SMEs, standardization of energy use,
labeling of energy efficiency and public-private partnership (ESCO projects) in addition to
conventional energy conservation promotion.
(2) Low-carbon policies
Thailand Greenhouse Gas Management Organization (TGOI) is responsible for the examination
of low-carbon policies of the country. It has been working on the establishment of the Thailand
Voluntary Emission Reduction Program (T-VER) in recent years in order particularly to set up the
domestic carbon market. T-VER is a program to certify voluntary GHG emission reduction efforts

6
within Thailand and it was set up with J-VER as a model and introduced by the Thai Government in
October 2013.
According to the interview with TGO (September 19, 2014), the main target of T-VER is
energy-derived GHG and the target gases are CO2, CH4 and N2O. HFC and other fluorocarbons that
are designated under the Kyoto Protocol are not included, which makes it difficult for Thai business
operators to regard their reduction as direct Co-Benefit. On the other hand, they believe that
technical transfer of fluorocarbon recovery and destruction and its contribution to its domestic
economy is attractive as Co-Benefit. In this sense, the recovery and destruction scheme of R22, etc.,
that is much contained in old equipment is likely to be considered as Co-Benefit in the country.
1.2 Fluorocarbon measures
1.2.1 Flow of fluorocarbons used as refrigerant
The flow of fluorocarbons that are used as refrigerant is shown below. It is assumed that
manufacturers (particularly Japanese manufacturers) keep or partially destroy the used refrigerant
that is discharged in the manufacturing process on their premises under their own responsibility. On
the other hand, the refrigerant contained in equipment during its use is often managed by the
distributors and maintenance service providers and sections. However, it is believed that most of
fluorocarbons in end-of-life equipment go to informal flow.
Source: Compiled based on interview results
Figure 2.1.3 Flow of Fluorocarbons Used as Refrigerant

7
1.2.2 Relevant regulations
Fluorocarbons are regulated as hazardous substances or hazardous waste in Thailand and thus the
related regulations are applied. For example, fluorocarbons are required to be destroyed at
incineration facilities of hazardous waste, which differs Japanese or Malaysian situations.
As for fluorocarbons used as refrigerant of products in the manufacturing process, the volume of
imports, storage and usage is managed under the Notification of MOI B.E.2546 List of Hazardous
Substances under the Hazardous Substance Act B.E.2535 under the jurisdiction of the Pollution
Control Department (PCD) of the Ministry of Natural Resources and Environment. When they are
discharged for disposal, they are controlled by the manifest based on the Notification of MOI on
Disposal of Wastes or Unusable Materials B.E. 2548 (2005) under the Factory Act under the
jurisdiction of the Ministry of Industry. On the other hand, although fluorocarbons used as
refrigerant in end-of-life equipment are designated as hazardous substances, there is no requirement
related to recovery or disposal of fluorocarbons.
End-of-life equipment is managed under the Public Sanitation Act if it is discharged from
household (including commercial facilities) and local governments are responsible for waste
disposal. Waste from industrial facilities is managed under the Factory Act.
The competent authority under the Montreal Protocol and Basel Convention is DIW (PCD is the
focal point.) and the Ozone Protection Unit of the DIW is in charge of matters related to the
protocol. In relation to the permits for destruction and exports of fluorocarbons, the Ozone
Protection Unit serves as a reference for opinions based on the protocol. The Industrial Waste
Management Bureau of the DIW is in charge of it based on the Factory Act and the Hazardous
Waste Act.

8
2. Fact-finding Survey in Industrial Facilities
2.1 Overview of the fact-finding survey
We conducted fact-finding survey in Bangpoo Industrial Estate, mainly forcusing on food
manufacturing plants where energy consumption for refrigeration is high. We conducted
questionnaire survey about the facilities they own and walk-through survey to understand the facility
conditions.
Figure 2.2.1 Flow of Fact-Finding Survey
We obtained responses of the questionnaire from 7 plants in the Bangpoo Industrial Estate. We
compared the results about the following indicators and selected potential facilities for a JCM
project:
<Selection criteria>
Freezers were installed many years ago. (There will be much room for energy saving.)
Relatively big scale.
Have interest in replacement.
We selected one food manufacturing facility as potential facility based on the above selection
criteria and conducted survey.
Selection of target area
Questionaaire survey
Sector/facility condition/
use of refrigerant/ replacement plan, etc.
Walk-through survey
Actual facility condition/operation/type
and volume of refrigerant/
electricity contract and other peripheral
information, etc.

9
2.2 Fact-finding survey
(1) Interview survey results
We confirmed the following in interview survey:
It has interest in the JCM financing program by the Ministry of Environment.
It uses R-22 for the compressor of the facility and is considering changing refrigerant type as its
use is prohibited in the future.
Four of five compressors are 75kW and the compressors are 24-hour operation when the plant
is in operation. However, it operates only one unit on holidays.
It needs to replace the compressor and indoor equipment together when it changes the
refrigerant type.
It will replace them when it suspends the operation during Thai new year holidays and other
long suspension period.
Container refrigerator Refrigeration compressor
Refrigerant storage cylinder Outdoor unit for air conditioning system (made
in Thailand)
10
3. Survey on Prevalence of Energy Saving Equipment at Commercial Facilities
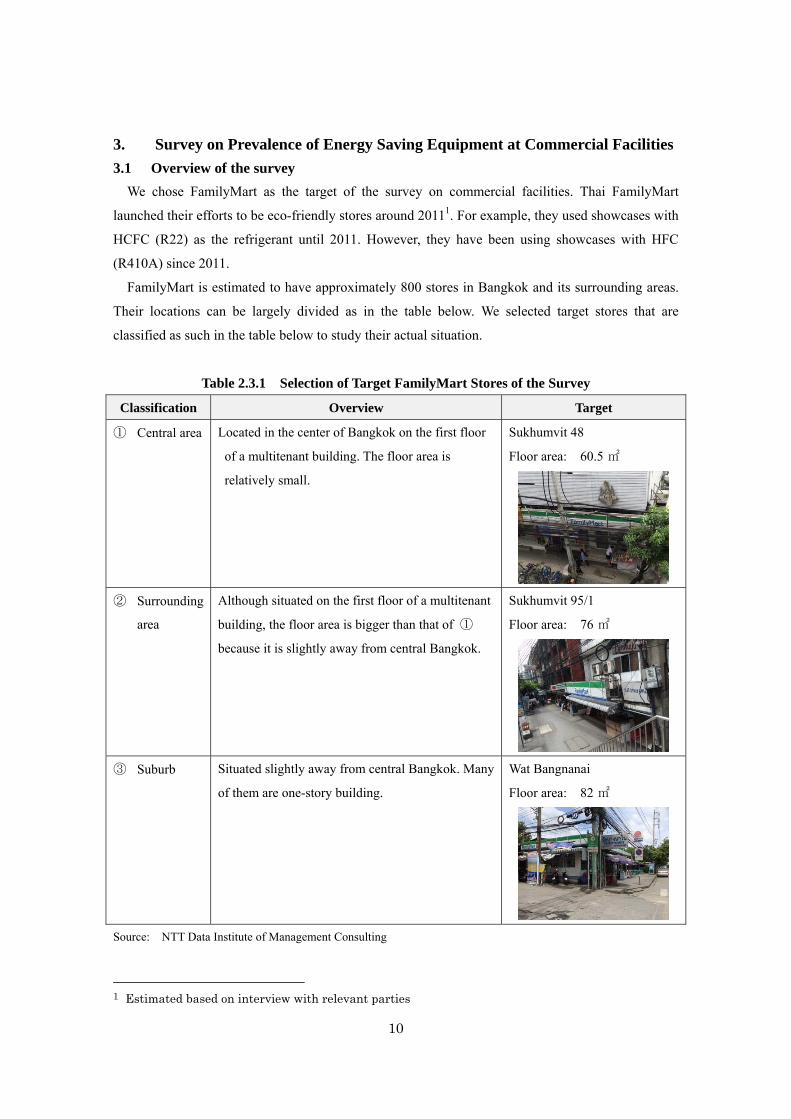
3.1 Overview of the survey
We chose FamilyMart as the target of the survey on commercial facilities. Thai FamilyMart
launched their efforts to be eco-friendly stores around 20111. For example, they used showcases with
HCFC (R22) as the refrigerant until 2011. However, they have been using showcases with HFC
(R410A) since 2011.
FamilyMart is estimated to have approximately 800 stores in Bangkok and its surrounding areas.
Their locations can be largely divided as in the table below. We selected target stores that are
classified as such in the table below to study their actual situation.
Table 2.3.1 Selection of Target FamilyMart Stores of the Survey
Classification Overview Target
① Central area Located in the center of Bangkok on the first floor
of a multitenant building. The floor area is
relatively small.
Sukhumvit 48
Floor area: 60.5 ㎡
② Surrounding
area
Although situated on the first floor of a multitenant
building, the floor area is bigger than that of ①
because it is slightly away from central Bangkok.
Sukhumvit 95/1
Floor area: 76 ㎡
③ Suburb Situated slightly away from central Bangkok. Many
of them are one-story building.
Wat Bangnanai
Floor area: 82 ㎡
Source: NTT Data Institute of Management Consulting
1 Estimated based on interview with relevant parties
11
4. Study on Recovery of Fluorocarbons and Collection of
Fluorocarbon-Containing Equipment
4.1 Current situation of recovery of fluorocarbons and collection of
fluorocarbon-containing equipment
Although there are numerous facilities of waste sorting, landfilling or reuse and recycling in
Thailand, there are very few large-scale recyclers that dismantle equipment and they basically handle
IT device including valuable resources. The government offers no regular engineer training on
fluorocarbon recovery, although it has provided several sessions in the past.
ESBEC was built as a final landfill facility for non-hazardous waste in 2000 and has disposed of
more than 1 million tons of waste by landfill. It began recycling WEEE in 2010 in response to the
request from IT manufacturers. It uses know-how of DOWA Group. Although it began to dismantle
freezers used by foreign food manufacturers at convenience stores several years ago, the
manufacturers recover the fluorocarbons by themselves.
4.2 Study on proper disposal of fluorocarbons and fluorocarbon-containing equipment
We performed fluorocarbon recovery test and fluorocarbon-containing equipment dismantle test at
ESBEC in order to acquire proper fluorocarbon recovery technology and understand the cost of the
recovery and dismantle. The testing methods and test results are summarized below.
4.2.1 Fluorocarbon recovery test
(1) Recovery test method
Test site: ESBEC (DOWA Group’s waste disposal facility)
Target equipment: 5 ice cream freezers at convenience stores (provided by the manufacturer
for testing)
Fluorocarbon recovery method: Performed based on Japanese relevant guidelines and
practices at Japanese recycling facilities. Japan-based supplier of the equipment supported by
giving instructions.
※The compressors oil was not removed because the recovery machine with no oil separator was
used in the fluorocarbon recovery test in the Project.
Data to be recorded: The data below was recorded in the fluorocarbon recovery tests.
・ Time required
・ Weight of freezers before and after recovery (estimate the amount of removed refrigerant)
・ Weight of cylinders before and after recovery (estimate the amount of recovered
refrigerant)

12
(2) Test results
The fluorocarbon recovery test results of five target units are summarized below. The average
weight of recovered refrigerant is 130g to 140kg per unit, the average time required for the recovery
is approximately 13 minutes, and the average recovery rate is 93%. When no recovery of the
compressor oil is considered (the oil contains some dissolved fluorocarbons), the recovery rate is
relatively high.
Obtaining the results, including the reflection of Japanese knowledge on recovery, it was the first
step towards the realization of proper recovery methods in Thailand. When it is continued to be
implemented in a future Project, it will contribute to proper fluorocarbon management in Thailand
through further improvement by such efforts as dispatch of Japanese experts.
Table 2.4.1 Fluorocarbon Recovery Test Results
Freezer
ID
Refrigerant
type
Time
required
(min)
Cylinder weight
difference before
and after recovery
(kg) ①
Freezer weight
difference before
and after recovery
(kg) ②
Recovery rate
(%)
(①÷②)
1 R134a 12 0.08 0.08 100
2 R134a 10 0.16 0.18 89
3 R134a 22 0.12 0.12 100
4 R134a 14 0.16 0.16 100
5 R134a 11 0.12 0.16 75
Average - 13 0.13 0.14 93
4.2.2 Fluorocarbon-containing equipment dismantle test
(1) Equipment to be dismantled
Test site: ESBEC (DOWA Group’s waste disposal facility)
Target equipment: Equipment from which fluorocarbons are recovered in recovery tests
Dismantle test method: The company workers dismantle fluorocarbon-containing equipment
in regular operation.
Data to be recorded: The data below was recorded in the fluorocarbon-containing equipment
dismantle tests.
・ Time required
・ Weight of valuable resource (recyclable metal, etc.)
・ Weight of waste (landfall or incinerated)

13
(2) Dismantle test results
As a result of dismantle of five target units, it required an average of 20 minute per unit and
approximately 85% of the freezers in weight was recovered as valuable resource.
Table 2.4.2 Fluorocarbon-Containing Equipment Dismantle Test Results
Freezer
ID
Time
required
(min)
Weight of valuable resource (kg) Waste weight (kg)
Steel Aluminum
+ plastic
Copper
pipe
Compressor Insulator Refrigerant
1 15 30.8 3.5 4.9 10.8 6.1 0.08
2 25 30.5 1.7 3 12 10.3 0.16
3 25 27 1.4 2.9 11.9 9 0.12
4 15 36.8 - 5.4 9.5 8.1 0.16
5 22 32.1 - 4.7 11.2 7 0.12
Average 20 31.4 1.3 4.2 11.1 8.1 0.13
4.3 Study on logistics of fluorocarbons and fluorocarbon-containing equipment
WMS of DOWA Group has transfer stations of waste across Thailand. It also set up transport
bases (collection base) in each region for efficient waste collection. There are four bases: NTS in
the northern region (Chingmai), LTS in the central region (Lad Krabang), ATS in the eastern region
(Amata Nakorn), and STS in the southern region (Songkla). In the future, the collection network can
be used to collect end-of-life equipment and transport it to ESBEC where fluorocarbons are removed
and end-of-life equipment is dismantled.

14
5. Survey on Fluorocarbon Destruction
5.1 Current situation of fluorocarbon destruction
There are two facilities that perform fluorocarbon destruction in Thailand. The only one hazardous
waste incineration facility in the country has performed the destruction on the commercial basis and
an air conditioning system manufacturer performs it in-house in their plant.
5.1.1 Hazardous waste incineration facility
Akkhie Prakarn Public Company Limited is established in Bangpoo Industrial Estate, led by DIW,
for disposing of hazardous waste in Thailand. It is the only one hazardous waste incineration facility
in the country. It is the only one facility that is licensed to commercially destroy fluorocarbons that
are brought in from outside.
5.1.2 In-house disposal facility of a Japanese manufacturer
The manufacturer originally examined fluorocarbon destruction at an existing incineration facility
and conducted destruction tests at the facility introduced by the government. However, it refused
continuous destruction because of the damage to the furnace and odor. It then introduced in-house
hydrolytic destruction facility. It mainly destroys fluorocarbons that are discharged in repairing
off-spec products produced on the plant line and fluorocarbons that are discharged every morning in
the inspection of refrigerant filling machine. With the current permission, it is allowed to perform
fluorocarbon destruction it generates in-house and it is not permitted to accept fluorocarbons from
external companies or plants or destroy them.
5.2 Study on fluorocarbon destruction
5.2.1 Destruction in existing facilities
Fluorocarbons defined as hazardous waste can be disposed of in the hazardous waste incineration
facility in Bangpoo Industrial Estate in Thailand. Further consultations are needed to involve the
facility in the Project, in order to guarantee traceability and examine the GHG reduction capacity in
relation to the fluorocarbon destruction of the Project.
5.2.2 Other options of fluorocarbon destruction
(1) Existing waste disposal facility
BPEC of DOWA Group is one of incineration facilities in Thailand and it started as NEDO’s
model facility project for effective use of waste from industrial estates in Thailand. The incinerator is
a fluid bed furnace with the daily capacity is 100 tons. Although it was originally operated based on
the US (Waste Management) standards, DOWA Ecosystem purchased the holding company. It is
licensed to incinerate non-hazardous waste only. In the Japanese classification, it is allowed to

15
dispose of general business waste and industrial waste (excluding the specially controlled waste).
The facility operation rate has increased since it became a DOWA Group company and there is
almost no facility that maintains such a high operation rate stably in Thailand. Although there
remains the licensing issue, it can be a candidate site of practicing fluorocarbon destruction using
Japanese technologies and operational know-how.
The following was conducted in the Project with the assumption of future destruction by BPEC
and destruction tests for it:
<Matters related to fluorocarbon destruction tests at BPEC>
IEAT director needs to decide whether to permit the destruction tests at BPEC based on
opinions of the DIW.
In order to submit a proposal to IEAT, provide ① information on Japanese regulations and
guidelines, ② data of facilities that are actually in operation in Japan, and ③ information on
environmental impacts to be caused by the tests.
An outline of the destruction tests at BPEC was considered as followins:
・ Destruction time: approximately 6 hours in total
・ Destruction volume (for testing): destroy approximately 120kg of fluorocarbons in total.
・ Additional facility and cost: piping and other equipment, flow meter, and installation
cost, etc.
・ Note: It is desirable that engineers be dispatched from Japan for exhaust gas analysis.
(2) Cement company
The cement company we interviewed in the Project does not perform fluorocarbon destruction and
we did not see their intension of performing it in the future. It accepts and uses wastes as alternative
materials and fuels not as waste disposal and it plans to enhance RDF use in the near future.
(3) Other options
Other options of destruction include introduction of portable fluorocarbon destruction facility
and destruction by importing in Japan. Their outline and problems related to each options are
summarized below.
a) Portable fluorocarbon destruction facility (example of a manufacturer)
Past overseas delivery of portable dissolution unit: 1 unit each in Argentina, Ecuador and
China
Destruction in other countries: unknown (because involved only in facility introduction)
Problems related to overseas development:
No laws or regulations on fluorocarbon destruction in the target country
16
High installation cost (over 10 million yen per unit with no subsidy)
Low destruction capacity (2kg per hour in standard (approximately 3 air-conditioners))
(5 tons per year if operated 2,400 hours a year)
Although it is portable, connection with various utilities is required and it cannot be
moved or operated easily.
b) Imports to Japan for destruction
They cannot be imported to Japan for destruction because of the ozone layer protection law.
(no provision in the law)
Although imports for testing or use as raw materials are allowed as special cases, the surplus
is returned to the origin, not being destroyed in Japan.
DIW staff who attended the later mentioned workshop that was organized under the project made
the following comments on the imports:
Is it possible to export used fluorocarbons from Thailand to Japan to have them destroyed
there?
Although they can be destroyed at hazardous waste disposal facility in Thailand, they see the
advantage of quick disposal in Japan where there are many destruction facilities (and
destruction capacity).
Although there seems to be demand for fluorocarbon destruction in Thailand and imports will
remain as an alternative to domestic destruction, there are problems related to imports to Japan as
described above. And its exports (not limited to Japan) from Thailand were examined as literature2
shows and it was not realized because of import and export procedural problems including the
procedures under the Basel Convention because they are hazardous waste. Agreements on
intergovernmental cooperation on fluorocarbon exports and imports will be needed for its
realization.
2International survey on CFC distribution and its recovery and destruction methods (March 2013), Nomura Research Institute, Ltd.
17
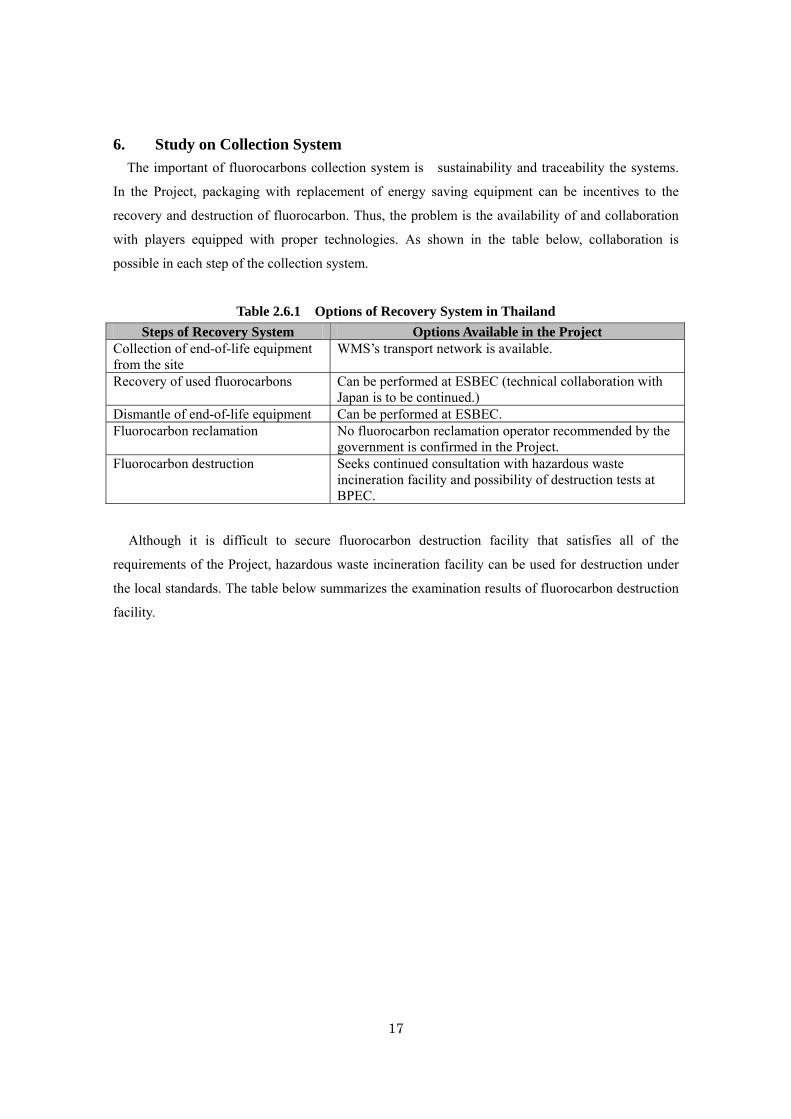
6. Study on Collection System
The important of fluorocarbons collection system is sustainability and traceability the systems.
In the Project, packaging with replacement of energy saving equipment can be incentives to the
recovery and destruction of fluorocarbon. Thus, the problem is the availability of and collaboration
with players equipped with proper technologies. As shown in the table below, collaboration is
possible in each step of the collection system.
Table 2.6.1 Options of Recovery System in Thailand
Steps of Recovery System Options Available in the Project Collection of end-of-life equipment from the site
WMS’s transport network is available.
Recovery of used fluorocarbons Can be performed at ESBEC (technical collaboration with Japan is to be continued.)
Dismantle of end-of-life equipment Can be performed at ESBEC. Fluorocarbon reclamation No fluorocarbon reclamation operator recommended by the
government is confirmed in the Project. Fluorocarbon destruction Seeks continued consultation with hazardous waste
incineration facility and possibility of destruction tests at BPEC.
Although it is difficult to secure fluorocarbon destruction facility that satisfies all of the
requirements of the Project, hazardous waste incineration facility can be used for destruction under
the local standards. The table below summarizes the examination results of fluorocarbon destruction
facility.

18
Table 2.6.2 Fluorocarbon Destruction Facility in Thailand
Survey Results Availability Traceability
Existing facility
Waste incineration facility (hazardous): The only one facility that is licensed to destroy fluorocarbons on the commercial basis can be used. However, the destruction condition and traceability need to be confirmed.
○
In-house disposal facility: Although a Japan-based manufacturer has introduced fluorocarbon disposal facility for its own plant, it is not allowed to accept the substance from outside.
× -
Other options of fluorocarbon destruction
Waste disposal facility (non-hazardous): DOWA Group has a non-hazardous waste incineration facility (BPEC). It needs to obtain a license for hazardous waste to destroy fluorocarbons that are hazardous.
Confirm procedures of destruction tests.
○
Cement company: It has no interest in fluorocarbon destruction.
× -
Portable facility: When the introduction cost is taken into consideration, there is no fluorocarbon disposal program and thus the cost is not covered by subsidies, etc., and thus it is difficult to introduce it in the country.
× -
Imports to Japan: Under the current situation, tt is difficult because of import procedures of Japan side.
× -

19
7. Confirmation of Project Implementation Structure and Finance Scheme
We examined energy saving equipment introduction projects as shown below based on the
survey results in Thailand described above. The “Financing Program for JCM Model Project” of
the Ministry of Environment is assumed to be used because of the nature of the possible scheme
and target equipment. Thus, “Financing Program” below refers to the “Financing Program for JCM
Model Project” of the Ministry of Environment.
Source: Recent Development of The Joint Crediting Mechanism (JCM), January 2015
Figure 2.7.1 Financing Program for JCM Model Project
7.1 Japanese food manufacturer
7.1.1 Project overview
(1) Tentative schedule
Based on the fact-finding survey, compressors for the refrigeration system (75kW × 5 units, 55kW
× 1 unit) can be the target facility of the JCM project. In consideration of the current facility layout,
it will be difficult to replace all the six compressors individually and thus it is realistic to suspend the
operation of the entire plant to replace all of them at once. The replacement plan needs to be
formulated in accordance with the plant operation schedule.

20
Table 2.7.1 Project Schedule (Proposal) (T-1)
Time Contents
FY2014 Proposal of outline of energy-efficiency improvement
FY 2015 or later
Year 1
PS implementation
Adjustment of details of equipment specifications
Formulation of facility replacement plan in line with the plant
operation schedule
Year 2 Facility replacement
Replacement of compressors and motors
Assumed to be replaced with equipment that contains HFC
R404A refrigerant
Year 3 Monitoring
Monitoring of energy consumption, etc.
(2) Main technologies to be introduced and project cost
【Efficiency improvement of compressors for refrigeration system】
・ The existing refrigeration systemuses HCFC-22. Since it is a concentrated heat source, the
compressor needs to be in operation even during partial operation. Even when the number of
units in operation is controlled for energy saving, the rated power consumption of the individual
compressor is large.
・ Individually packaged refrigeration units are installed in individual refrigerating rooms and it is
operated in line with the use of each room. This will not require power that will be wasted. As
recent models are equipped with inverters and are highly efficient, they can be operated with
less energy than existing systems.
・ As for the project cost, the introduction of energy saving facility is estimated to be an average
of 11 million yen per system based on the interview survey with facility suppliers under the
condition that the equipment is introduced to the facility. Since 20 systems are considered to be
introduced, the total project cost is estimated to be 220 million yen.
・ In order to introduce the system and apply to Financing Program, equipment of Japanese
manufacturer needs to be available. However, none of several Japanese manufacturers we
interviewed with have introduced the system in Thailand.

21
(2) Main technologies to be introduced and project cost
Figure 2.7.2 Image of Freezer Introduction
(3) Implementation structure
The project implementation structure is provided in the figure below. Entities and their roles in the
figure are currently under coordination and the scheme herein is a tentative.
The verification of fluorocarbon recovery and destruction is also an important element of the
Project.
Figure 2.7.3 Tentative Project Implementation Structure (T-1)

22
7.1.2 CO2 reduction
The CO2 reduction after the replacement with energy saving equipment based on the technology
introduced in 7.1.1 is estimated as below.
7.2 Convenience store
7.2.1 Project overview
(1) Tentative schedule
The T-2 project schedule is examined for both replacement of facility at the refurbishment of
stores and introduction of facility to new stores. As described earlier, Thai FamilyMart began efforts
to transform themselves into eco-friendly stores in 2011 and refrigeration showcases with HFC as
the refrigerant have been introduced to new stores that opened after 2011. As of 2014, the ratio of
HCFC to HFC (based on the number of stores) is estimated to be 6 to 4. On the other hand, most of
the stores that opened before 2011 and that are target of refurbishment under the Project are believed
to be using HCFC and the ratio of stores that use HFC will increase every year. It is decided that
three-year project schedule is examined here, with the fluorocarbon recovery and destruction scheme
regardless of the fluorocarbon type.
Based on the assumption that there will be a total of 1,700 FamilyMart stores in 20173, 200 stores
are estimated to open every year. The number of stores to be refurbished is assumed to be 50 per
year4.
3 It is assumed based on various media information and interviews. 4 It is assumed based on interviews at several stakeholders.

23
Table 2.7.2 Tentative Project Schedule (T-2)
Time Contents
FY2014 Proposal of outline of energy-efficiency improvement
FY 2015 or later
Year 1
Facility replacement
Refurbishment of 50 stores
200 new stores
Year 2 Facility replacement
Refurbishment of 50 stores
200 new stores
Year 3 Facility replacement
Refurbishment of 50 stores
200 new stores
(2) Main technologies to be introduced
Since the application of the fluorocarbon recovery and destruction scheme is envisioned, energy
saving by replacement of refrigeration showcases and air conditioning systems (or new introduction
for new stores) is studied. Efforts are also made to save energy of lightings.
Since approximately 60% of current air conditioning systems are non-inverter type, they are
assumed to be replaced with inverter control-packaged systems. Replacement of the refrigeration
showcases with inverter showcases is also considered. The lighting apparatus is assumed to be Hf
fluorescent or LED lamps.
Economic performance of this replacement was studied later separately.
(3) Project cost
The cost of energy saving and conventional air conditioning systems, refrigeration showcases, and
lighting are studied here.
The introduction cost of energy saving equipment is approximately 1 million baht (approximately
3.3 million yen) per store and this can be regarded as the project cost. However, because air
conditioning systems, refrigeration showcases, and lighting are essential equipment to be introduced
when convenience stores are newly opened or refurbished even it is not for improving energy
efficiency, the project cost can also be the difference with the cost of introduction of conventional
equipment (823,000 baht or approximately 2.72 million yen per store) (additional cost). The project
cost herein is estimated based on the latter idea.
The additional cost for the introduction of energy saving equipment is 186,400 baht
(approximately 615,000 yen) per convenience store. Since there are 250 target stores annually under

24
the abovementioned introduction schedule, the annual project cost is estimated to be 47 million baht
(154 million yen).
(4) Tentative project implementation structure
The tentative project implementation structure is shown in the figure below. Entities and their
roles in the figure are currently under coordination and the scheme herein is a proposal.
Figure 2.7.4 Project Implementation Structure (Proposal) (T-2)
7.2.2 CO2 reduction
(1) CO2 reduction
The CO2 reduction per store is estimated based on the following assumption:
<Preconditions of estimation>
① Power consumption per store is 100,000kWh per year.
② 75% of power consumption is used for air-conditioning, refrigeration and lighting.
③ Replacement with energy saving air conditioning systems, refrigeration systems, and lighting
equipment results in 35% reduction of power consumption. It is 26% reduction (75% x 35%) for
the entire store.
④ The CO2 emission basic unit requirement of grid power is 0.55t-CO2/MWh. It is obtained based
on the assumption that it is slightly improved because the ratio of coal thermal power generation
has declined as the ratio of natural gas power generation has increased, although the figure
announced by the Thai Government in 2010 was approximately 0.58 t-CO2/MWh.

25
With the assumption above, CO2 emissions are estimated to decrease by 14tCO2/y
(100,000kWh×26%×0.55tCO2/MWh) per store. If 250 stores introduce the energy saving equipment
annually, the reduction amount is estimated to be 3,500tCO2/y in total. (See below figure.)
Figure 2.7.5 Estimated CO2 Emissions Reduction in T-2 Project
Cost effectiveness on subsidy is calculated to be 3,700 Yen/tCO2 (77 million Yen/3,500 tCO2/6
durable years).
Figure 2.7.6 Cost Effectiveness in T-2 Project

26
(2) HFC recovery and destruction volume
The HFC recovery and destruction volume of existing stores is also estimated. Approximately
15kg of HFC (R404A) is estimated to be used per store5. The amount is converted into 60tCO2 per
store (=15kg×3920:R404A GWP) among refurbished stores. In other words, 60tCO2 of GHG
reduction is added per store, as the ratio of HFC stores increases in T-2 project.
5 According to interview with manufacturers, etc.

27
8. Examination of MRV Methodologies
8.1 Japanese food manufacturer
The GHGs subject to reduction in the Project includes HFC that is designated under the Kyoto
Protocol in addition to CO2. Thus, evaluation methods of fluorocarbon destruction effects was also
studied in addition to the methodology for CO2 emissions reduction. The study for establishing the
calculation method of CO2 emissions reduction is described herein.
Although the target of the Project is the replacement of refrigeration system of food manufacturers
in Thailand, the methodology was examined to make it as general as possible so that the method
can be used widely for the replacement of similar industrial refrigeration system.
The JCM methodologies (proposal) described herein was developed as the outcome of the study
and its application under the joint crediting mechanism is not officially approved.
(1) Definition of terms
The energy saving method of the Project is the replacement of refrigeration equipment. The
emissions reduction is estimated by multiplying the gap of power that is (assumed to be) consumed
by the project refrigeration equipment and reference refrigeration equipment by the GHG emission
basic unit requirement of grid power. The terms used herein are defined as described in the table
below.
Partly because the refrigeration equipment has long service life in general, existing refrigeration
equipment may be used continuingly without the JCM project in some cases. Thus, the definition of
the reference refrigeration equipment is classified into two—one is when there is an equipment
replacement plan without the JCM project and the other is when there is no such plan without the
project.
Table 2.8.1 Definitions (T-1)
Term Definition
Refrigeration
equipment
Heat source facility that generates cold air by transferring heat based on
the heat pump principle
Project refrigeration
equipment
Refrigeration equipment that is introduced in the JCM project
Reference refrigeration
equipment
<There is an equipment replacement plan without the JCM project.>
Refrigeration equipment that (are believed to) has the biggest market
share in the target country at the time of replacement or refrigeration
equipment with functions that are average of several major
manufacturers that distribute their products in the target country
<There is no equipment replacement plan without the JCM project.>

28
Existing refrigeration equipment that becomes the target of the
replacement in the Project
Coefficient of
performance
Refrigerating capacity [kW] / main motor input power [kW]
(2) Eligibility criteria
Although the Project targets a specific plant (food manufacturer) as described above, refrigeration
equipment are widely used at other industrial plants and their replacement, which includes recovery
and destruction of fluorocarbons as refrigerant, can happen in other sectors. Thus, the criterias were
examined without limiting the use and characteristics of the target facility so they can be applied to
other facilities that include plants of other sectors, hospitals, and commercial facilities.
Possible eligibility criteria include the following:
Criteria 1: Refrigeration equipment that consumes electricity only and generates cold air
Criteria 2: It is the replacement of existing facility.
Criteria 3: Electricity supplied to the reference and project refrigeration equipment is grid
power from a power company in the country.
Inclusion of another requirement that the fluorocarbons contained as the refrigerant be the
substance designated under the Kyoto Protocol was also considered as a eligibility criteria. However,
as it is pointed out in the Montreal Protocol, the proper recovery and destruction is meaningful even
they are not substances designated by the Kyoto Protocol (HCFC, etc.). Thus, it was decided that it
is not included as a requirement herein and that is treated as CO-Benefit.
(3) Reduction volume calculation method (proposal)
The calculation method at each facility is decided based on the flow chart below.

29
Figure 2.8.1 Flow of Calculation Method Selection (T-1)
The efficiency of reference and project refrigeration equipment used in calculation methods 1 to 4
is provided in the table below.
Table 2.8.2 Efficiency Assumption Method of Calculation Methods 1 to 4
Estimation
Method
Efficiency of Reference Freezer Efficiency of Project Freezer
1 Use actual values. Use actual values.
2 Use actual values. Use catalogue values.
3 Use catalogue values. Use actual values.
4 Use catalogue values. Use catalogue values.
The reference emissions (RE) and project emissions (PE) in Year “y” are estimated based on the
following formula:
RE = Q/Rη/(3.6×10-3)×EF
RE: reference emissions [t-CO2/y]
Q: cold air volume generated in Year y [GJ/y]
Rη: efficiency of reference refrigeration equipment
EF: emission factor of grid power in the target country in Year y [t-CO2/kWh]

30
PE = Q/Rη/(3.6×10-3)×EF
RE: project emissions [t-CO2/y]
Q: cold air volume generated in Year y [GJ/y]
Pη: efficiency of project freezer
EF: emission factor of grid power in the target country in Year y [t-CO2/kWh]
The destruction effects of fluorocarbons designated under the Kyoto Protocol, contained as the
refrigerant of the project refrigeration equipment, are not included herein. The evaluation methods is
examined later separately.
8.2 Convenience store
The target GHG reduction in the project include the fluorocarbon (HFC) that is designated as
GHG under the Kyoto Protocol in addition to CO2. Thus, the evaluation methods of fluorocarbon
destruction effects were also examined in addition to the methodologies for CO2 emissions reduction.
The study for establishing the calculation method of CO2 emissions reduction is described herein.
Since MRV methodologies for CO2 for the energy-saving projects of refrigeration showcases,
air-conditioning systems and lighting of convenience stores in Thailand have been developed to
some degree through past survey and research, the concept is employed and partial changes are
made.
The JCM methodologies (proposal) described herein were developed as the outcome of the study
and its application under the joint crediting mechanism is not officially approved.
(1) Idea of the methodologies
The energy-efficiency improvement measures for convenience stores in the Project are the
replacement of refrigeration showcases, air-conditioning systems and lighting and their
introduction to new stores. Possible methods of calculating the reduction amount are to accumulate
the effects of each equipment (build-up method) and to estimate it based on the total power
consumption of the store (total index method). As convenience stores are standardized, it is more
realistic to use a method of utilizing the characteristics of them.
An overview of the characteristics and advantages and disadvantages of the methods are described
in the table below. Although the disadvantage of the total index method is lowering of accuracy
when the facility specifications vary, its impact is likely to be small as convenience stores are
standardized and thus it is more realistic to use the method.

31
Table 2.8.3 Overview of Build-Up Method and Total Index Method
Method Overview Advantage Disadvantage
Estimation by
accumulating
equipment (build-up
method)
Estimate the reduction
volume from measured power
consumption of target
equipment of each facility.
Can be
estimated
accurately.
High cost;
complicated; and
consume additional
energy with
monitoring equipment
Estimation from total
store power
consumption (total
index method)
Estimate the reduction from
the gap of power
consumption of baseline
facility and project facility.
Simple, low
cost
Accuracy deteriorates
when store
specifications differ.
Source: Compiled based on the Feasibility Study on Green Convenience Stores with High- Efficiency Equipment in Thailand and Vietnam FY2012, NEDO
(2) Eligibility criteria
The criterias below need to be met to use the total index method. One criteria of the target of the
Project is that they need to introduce high-efficiency air-conditioning system and refrigeration
showcases among the three equipment (air-conditioning system, refrigeration showcases and
lighting). It is because the purpose of the Project includes recovery and destruction of refrigerant
fluorocarbons and the two equipment use the refrigerant. The lighting is not regarded as a criteria
because it is not in the scheme and the introduction of at least the two equipment, if not all of the
three, will enable sufficiently accurate calculation based on past survey and research.
Table 2.8.4 Criteria for Application of Total Index Method
Category Requirement for Application
Definition of “store” Small store whose style and operation are standardized and whose total
power consumption can be obtained from the bill of the power company
Target of the Project At least air-conditioning system and refrigeration showcase are
high-efficiency equipment among those two and lighting. (Two or more
is sufficient enough to estimate satisfactory level of accuracy because the
ratio of power consumption of the three equipment to the total
consumption is stable among stores.)
Environmental
condition
Illuminance and room temperature serve as benchmarks and they do not
fluctuate more than 10% from before the refurbishment if it is a
refurbished store, and from the manual of the operator for new stores
(set to be 10% in reference to the existing study results (source).
Validity needs to be examined by gathering data.)

32
Implementation
condition
As the number of samples, there are more than 100 stores in one country
and one climate zone. (The number of samples of small-scale CDM
methodology AMS- II-AE is also more than 100.) Source: Compiled based on the Feasibility Study on Green Convenience Stores with High- Efficiency Equipment in Thailand and Vietnam FY2012, NEDO
(3) Calculation method
The calculation methods are selected based on the three conditions: existing or new store
(existing store ⇒ calculation method 1); if it is a new store, model formula can be created
(calculation method 2) or default value is used (calculation method 3). The calculation method of
reference power consumption differs among the calculation methods 1 to 3 and their overview is
shown in Table 2.8.5.
Table 2.8.5 Overview of Reference Annual Power Consumption Calculation Methods 1 to 3
Calculation
Method
Calculation Method of Reference Annual Power Consumption
1 Actual data of store before refurbishment (minimum value of annual power
consumption for 3 years before refurbishment)
2 Calculation using model formula
<Model formula>
Reference power consumption
= a× store floor area + b× number of customers
+ c× number of lighting apparatus
+ d× number of air-conditioning system
+ e×number of showcase + ・・・
3 Default value (specific consumption)×store floor area
Default value (specific consumption): annual power consumption per area
Actual figures of Japan Franchise Association are used. Source: Compiled based on the Feasibility Study on Green Convenience Stores with High- Efficiency Equipment in Thailand and Vietnam FY2012, NEDO
The estimation formula of reference emissions (RE) and project emissions (PE) in Year “y” of
calculation methods 1 to 3 is shown below.

33
<Estimation method 1>
REy = ΣRECi,y × EFCO2,elec
Rey: reference CO2 emissions in Year y[t-CO2/y]
REC i,y: annual power consumption of target store i before refurbishment[MWh/y]
EFCO2,elec: CO2 emissions factor of grid power[t-CO2/MWh]
PEy = ΣPECi,y × EFCO2,elec
PEy: project CO2 emissions in Year y[t-CO2/y]
PEC i,y: annual power consumption of project store i in Year y[MWh/y]
※Project store herein refers to store after refurbishment.
EFCO2,elec: CO2 emissions factor of grid power[t-CO2/MWh]
<Estimation method 2>
REy = RECy × EFCO2,elec
Rey: Reference CO2 emissions in Year y[t-CO2/y]
RECy: Reference annual power consumption[MWh/y]
EFCO2,elec: CO2 emissions factor of grid power[t-CO2/MWh]
RECy is shown in the multiple regression model6 with power consumption as the objective
variable and the parameter of store floor area as the explanatory variable.
RECy =Σi (ECi,m,y – SEy )
ECi,m,y = a × SAi,y + b × NCi,y + c × ODi,y + Σj(dj × Xi,j,y)+ e
RECy: reference annual power consumption[MWh/y]
ECi,m,y: power consumption of quasi reference store in Year y, obtained with the multiple
regression model based on conditions of project store i[MWh/y]
SEy: standard error of average of reference annual power consumption with 90% reliability
SAi,y: store floor area of project store i in Year y[㎡]
NCi,y: number of annual customers of project store i in Year y[person/y]
ODi,y: date of opening or refurbishment of project store i in Year y[yyyy/mm/dd]
Xi,j,y: Value of other explanatory variable of project store i in Year y
a,b,c,dj,e: invariable of each explanatory variable of multiple regression model
6 Feasibility Study on Green Convenience Stores with High- Efficiency Equipment in Thailand and Vietnam FY2012, NEDO

34
PEy = PECy × EFCO2,elec
PEy: project CO2 emissions in Year y[tCO2/y]
PECy: annual total power consumption of target project store[MWh/y]
EFCO2,elec: CO2 emissions factor of grid power[tCO2/MWh]
PECy =Σ( PECi,y )
PECi,y : annual power consumption of project store i in Year y[MWh/y]
<Estimation method 3>
REy = RECy × EFCO2,elec
Rey: reference CO2 emissions in Year y[t-CO2/y]
RECy: Reference annual power consumption[MWh/y]
EFCO2,elec: CO2 emissions factor of grid power[t-CO2/MWh]
RECy is obtained with the default value of the annual power consumption per area. One method
of setting the default value is to use the annual power consumption per area of convenience stores
in Japan, which is estimated to be 1103.76kWh/m2・y base on the actual figure of 0.126kWh/m2・h
in FY2009, which is released by Japan Franchise Association. The updated value shall be used
when the association releases new figures.
RECy =Σi( ECD × SAi,y )
ECD: annual power consumption per area (default value)[MWh/m2・y]
SAi,y: store floor area of project store i in Year y[m2]
PEy = PECy × EFCO2,elec
PEy: project CO2 emissions in Year y[tCO2/y]
PECy: annual power consumption of all target project stores[MWh/y]
EFCO2,elec: CO2 emissions factor of grid power[tCO2/MWh]
PECy =Σ( PECi,y )
PECi,y : annual power consumption of project store i in Year y[MWh/y]

35
8.3 Evaluation methods of fluorocarbon destruction effects
The following needs to be clarified to evaluate the effects of fluorocarbon destruction in the
Project as GHG emissions reduction:
① Agreement to evaluate the effects of fluorocarbon reduction (HFC in particular) by the joint
committee (Thai T-VER does not include HFC in the target gases.)
② Guarantee of traceability in each process of recovery and destruction
As for ①, GtoG negotiation results are waited for and as for ②, it needs to be examined
continuingly, including that of how to guarantee the traceability, in Thailand.
With the assumption that the above two issues are clarified, the methods to evaluate the effects of
fluorocarbon destruction were studied. Further close study is needed to include the effects of
fluorocarbon destruction as the GHG emissions reduction of the Project.
8.3.1 Existing methodologies
CDM small-scale methodologies that include AMS-III.X. (Energy Efficiency and HFC-134a
Recovery in Residential Refrigerators), AMS-III.AB.(Avoidance of HFC emissions in Standalone
Commercial Refrigeration Cabinets) have been developed and approved as existing methodologies
to estimate GHG reduction effects through recovery and destruction of refrigerant fluorocarbons
(alternative fluorocarbons) and insulation fluorocarbons or replacement with refrigerantof low global
warming potential. US Climate Action Reserve that is a carbon credit certification program provides
the protocol to evaluate the effect of fluorocarbon destruction.
In reference to the idea of existing methodologies, the evaluation methods of effects of
fluorocarbon recovery and destruction are likely to be implemented based on the following policies:
GHGs that are emitted at destruction process are taken into consideration. Energy consumption
of reclamation is assumed to be low.
New demand for alternative refrigerant is taken into consideration when the refrigerant which is
otherwise reclaimed or traded in market is destroyed.

36
Table 2.8.6 Examination of Evaluation Methods of Effects of Fluorocarbon Recovery and
Destruction
Item Montreal Protocol Kyoto Protocol
CFC HCFC HFC
Situation in target
country
Completely abolished
by 2010.
Gradually reduced from
2015 and completely
abolished by 2040.
Conversion from ODS
is in progress and there
is no reduction target in
the consumption side.
International
policy
Production and
consumption are
completely abolished.
Reclamation and other
measures are needed to
reduce production.
There is no policy on
the production side.
Recovery is needed to
prevent emissions.
Application
conditions
Project contents are not
mandatory under laws
or regulations.
Recovery is not a legal
requirement and it has
not spread.
Recovery of HFC is not
a legal requirement and
it has not spread.
Reclaimable
refrigerant
※by formal
reclamation
operator
Amount of destruction
is evaluated.
(consideration)
・Emissions by destruction
Amount of reclamation
is evaluated.
Amount of reclamation
is evaluated.
Refrigerant that
cannot be
reclaimed
Amount of destruction
is evaluated.
(consideration)
・Emissions by destruction
Amount of destruction
is evaluated.
(consideration)
・Emissions by destruction
Amount of destruction
is evaluated.
(consideration)
・Emissions by destruction
Destruction of
refrigerant that is
otherwise
reclaimed and
traded in the
market
Amount of destruction
is evaluated.
(consideration)
・Emissions by destruction
Amount of destruction
is evaluated.
(consideration)
・Emissions by destruction
・Amount of alternative
refrigerant
Amount of destruction
is evaluated.
(consideration)
・Emissions by destruction
・Amount of alternative
refrigerant
37
Results of the Study in Malaysia Chapter 3

38
1. Overview of the Target Country
1.1 Measures against climate change
1.1.1 Greenhouse gas (GHG) emissions
(1) Trend of CO2 emissions
The trend of CO2 emissions in Malaysia are shown in FigureFigure 3.1.1. It illustrates the increase
in the emissions in line with economic growth. By sector, CO2 emissions from electricity and
heat-derived sector accounts for nearly 50 percent of the total emissions. Equipment that uses
fluorocarbons (chiller and air conditioning system) that are the target of the survey consumes much
electricity and curving their power consumption is critical as it contributes to CO2 emissions
reduction in Malaysia.
Source: Compiled based on IEA (International Energy Agency) data データより作成
Figure 3.1.1 Trend of CO2 Emissions in Malaysia
(2) Trend by power source
The electricity sector accounts for nearly 50% of CO2 emissions in Malaysia and the trend of
power generation by power source (fuel) is summarized in Data source: IEA
Figure 3.1.2. Although natural gas accounted for approximately 70% of power generation until
around 2000, the ratio of coal has increased sharply recently.
The grid power CO2 emission factor has been on the rise recently in the country in line with the
increase in the ratio of coal-fired power and the value on the Malay Peninsula exceeded
0.7tCO2/MWh in 2012.
0
50
100
150
200
250
300
1971
1973
1975
1977
1979
1981
1983
1985
1987
1989
1991
1993
1995
1997
1999
2001
2003
2005
2007
2009
2011
CO2 emissions [m
illion tons of CO2]

39
Data source: IEA
Figure 3.1.2 Trend of Electric Power Generation by Power Source in Malaysia
1.1.2 Low-carbon policies
(1) Overview of environmental policies
The Environmental Quality Act 1974 was enacted in 1974 in Malaysia and the Ministry of
Science, Technology and Environment released the national environmental policy (NPE) that
incorporates the idea of aiming at sustainable development in all development plans in 2002. Vision
2020 that aims to be a member of developed nations in economic, political, social, mental,
psychological and cultural aspects and the Malaysia Plan that sets macroeconomic growth target of
every five years serve as guidelines for socioeconomic development at the national level. The current
10th plan (2011 to 2015) contains a plan to launch a GHG emissions reduction program in the five
domains, promotion of investment in renewable energies, promotion of energy saving by improving
energy use efficiency, improvement of solid waste management, forest conservation, and reduction
of pollution emissions towards improvement of air pollution.
(2) Low-carbon policies
Prime Minister Najib Razak established the Ministry of Energy, Green Technology and Water
Malaysia after he assumed the post in April 2009 and he launched the National Green Technology
Policy in July in the same year as electricity and energy policies. The policy contains five goals:
economic growth accompanied by reduction of energy consumption rate, growth of green
technology industry and its contribution to national economy, technological improvement for green
technology development and reform and enhancement of global competitiveness, securing
sustainable development and environmental conservation for future generations, and raising

40
awareness of green technology and promotion of its utilization. The government launched the Green
Technology Financing Scheme in January 2010 and provides low-interest loans of up to 50 million
Ringgit (up to 15 years) for companies that supply green technology and up to 10 million Ringgit
(up to 10 years) for companies that use it. Green technology in the National Green Technology
Policy is supposed to meet the following criteria:
1)Minimize environmental deterioration.
2)Control GHG emissions to zero or a low level.
3)Promise safe use and healthy and higher-quality environment for all styles of living.
4)Save use of energy and natural resources.
5)Promote use of renewable energies.
(3) Renewable energy policies
The Ministry of Energy, Green Technology and Water formulated a program for small-scale
renewable energy in 2001, which enabled power plants of 10MW or less capacity that use
renewable energies as resources to sell electricity to the electricity grid. The country also
introduced the feed in tariff in April 2010 as an incentive policy for renewable energies and it
required Tenaga Nasional Berhad (TNB), Sabah Electricity Sdn Bhd (SESB) and other companies
that are authorized to transmit and distribute electricity to purchase electricity generated with
biomass, biogas, small-scale water power and solar power by individuals or companies that are
certified by the Sustainable Energy Development Authority (EDA) at a fixed price.
The government has set a goal of raising the ratio of renewable energies that was below 1% of all
power generation in 2009 to 5.5% by 2015, 11% by 2020 and 17% by 2030 in the National
Renewable Energy Policy and Action Plan. The government, led by the Ministry of Energy, Green
Technology and Water, plans to establish a renewable energy fund to be operated by a sustainable
energy development agency for implementing the plan.
1.2 Fluorocarbon measures
1.2.1 Flow of fluorocarbons used as refrigerant
The flow of fluorocarbons that are used as refrigerant, which was learned from the results of Year
1 project and project of this fiscal year, is shown below. In Malaysia, refrigerant itself is not
designated as a hazardous substance, although its intentional discharge into the air is prohibited. It is
assumed that the used refrigerant generated in the manufacturing process is commissioned to be
disposed of or reclaimed at external destruction facility under the responsibility of manufacturers
(particularly Japanese manufacturers). On the other hand, most of the refrigerant inequipment during
its use is managed by distributors and maintenance operators or sectors. Although some maintenance

41
operators reclaim the refrigerant they collect, most of it, including refrigerant in end-of-life
equipment, is believed to go into an informal flow.
Source: Compiled based on interview results
Figure 3.1.3 Flow of Fluorocarbons Used as Refrigerant
1.2.2 Relevant regulations
As is the casein Thailand, there are two types of regulatory programs: one is to regulate
fluorocarbons directly and the other is to regulate end-of-life equipment. Although fluorocarbons are
not designated as hazardous substances in Malaysia, their discharge into the air is prohibited by the
Environmental Quality (Refrigerant Management) Regulations 1999 (which is regulations on
imports, consumption, use and recovery). Currently, the target of the regulation is limited to CFC
only and it mainly regulates emissions by the service sector. In the revision that aims at its
implementation in July 2015, provision on HCFC and provision on destruction (disposal of used
fluorocarbons at certified facilities) are planned to be added. As for approval of destruction facilities,
requirements related to destruction in the Montreal Protocol Handbook are supposed to be referred
to.
In Malaysia, end-of-life equipment (E-waste) is designated as schedule waste (SW110) under the
Environmental Quality (Scheduled Wastes) Regulations, 2005, and it is required to be disposed of by

42
business operators with SW110 license. Industrial E-waste that is the target of the Project needs to be
delivered to licensed business operators. As for equipment for household use, E-waste itself is under
the supervision of the DOE. However, the MHLG is responsible for collection and disposal of waste
from households and the DOE and the MHLG are examining the collection method of E-waste.

43
2. Fact-Finding Survey of Energy Saving Equipment Use
2.1 Overview of the survey
We carried out fact-finding survey of energy saving equipment use of commercial and public facilities
and plants around Johor Bahru as the study in Malaysia. We conducted questionnaire survey and then
walk-through survey to understand the facility conditions as we did in Thailand.
Figure 3.2.1 Flow of Fact-Finding Survey (Malaysia)
2.2 Questionnaire survey
We conducted questionnaire survey with commercial or institutional buildings (hotel, hospital,
shopping mall) as well as some industrial facilities in Johor Bahru on their use of refrigeration
equipment and we obtained responses from 13 facilities. We compared the results about the
following indicators and selected potential facilities for a JCM project.
<Selection criteria>
Refrigeration equipment were installed many years ago. (There will be much room for energy
saving.)
Relatively big scale.
Have interest in replacement.
Have understanding of and interest in the purpose of the project.
Selection of target facilities (cooperation of UTM)
Questionnaire survey (cooperation of UTM)
Sector/ owned facility condition/
Use of refrigerant/ replacement plan, etc.
Walk-through survey
Actual facility condition/operation/type and
volume of refrigerant/electricity contract and
other peripheral information, etc.
*cooperation of UTM to arrange
appointment, etc.

44
We selected a hospital, a shopping mall, and a university as potential facilities based on the above
selection criteria.
2.3 Fact-finding survey
2.3.1 National hospital (M-1)
(1) Interview survey results
There are five chillers, 114 AHU units, and 100 FCU units in the main building.
Maintenance work of the chillers is performed monthly internally.
The chillers are operated in a cycle of two weeks by operating two chillers continuingly for two
weeks. One chiller is out of order (Unit 5) and one is under repairment (Unit 1).
Although a BAS (Building Automation System) is installed, it is not used as it is not capable of
controlling the chiller system.
The primary chiller pump has no inverter and the secondary pump is inverter control.
Figure 3.2.2 Fluctuations of Monthly Power Consumption (2011 to 2014)
A model of appearance Chiller

45
Cooling water pump Pump inverter
Refrigerant for stock (R-134a) AHU
2.3.2 Commercial facility (M-2)
(1) Interview survey results
The chiller for the air conditioning system of the building has not been replaced since its
completion in 1988.
One chiller is usually in operation for the air conditioning system. Installation of four chillers
seems excessive. It is because residence and hotel were originally planned to be built together
but only the residence was built partially in reality.
The chiller for the air conditioning system operates in a cycle of three weeks from 11 a.m. to
10p.m. daily. Maintenance work is performed monthly.
As the secondary cold water pumps, there is one 45kW unit (ECON SAVE system) and three
110kW units (SPB systems 1 to 3) and one unit is in operation continuingly in each system. No
primary cold water pump is introduced. One 78kW cooling water pump is in operation
continuingly.

46
Model of facility exterior Chiller
Cold water pump Cooling water pump

47
2.3.3 University (M-3)
(1) Interview survey results
Sultan Iskandar Hall (commonly called DSI building) has a capacity for 500 persons and one
chiller was in operation on the day of interview (100% load factor).
One chiller of C16 building was in operation on the day (57% load factor). The chiller of the
building operates five days a week from 7:30 a.m. to 4:30 p.m. daily. The chiller was replaced
from CFC-11 to HCFC-123 and the cooling capacity reduced from 300TR to 240TR. 5 units of
50TR module chillers are planned to be installed newly.
Module chiller Chiller (DSI building)
Cold water pump (DSI building) Chiller (C16 building)

48
3. Study on Logistics and Collection of Fluorocarbons
3.1 Current situation of recovery of fluorocarbons
As for collection and disposal of end-of-life equipment, business operators with an SW110 license
authorized to dispose of E-waste are divided into two categories, full-license and partial-license
holders. Full-license holders crush and sort E-waste and recover metals. Partial-license holders only
crush and sort E-waste and are required to outsource for further treatment to full-license holders.
As for recovery of fluorocarbons, the recovery service operators are required to receive training
on handling of fluorocarbons and obtain a license under the Environmental Quality (Refrigerant
Management) Regulations 1999. The Authorized Training Center (ATC) of Malaysia provides
legally required CFC training and it plans to launch HCFC training. The ATC distributes recycling
machines to remove water and other impurities in end-of-life refrigerant to the service sector. Since
the training is provided for the service sector and thus no disposal stage is assumed, few SW110
operators are likely to have received it.
As for the logistics, partial- and full-SW110 license holders described above are allowed to
transport E-waste and they are also authorized to transport fluorocarbon-containing equipment. They
exist in certain numbers in each state and they have their own collection system and thus it will be
possible to use them in the Project.
3.2 Current situation of destruction of fluorocarbons
3.2.1 Existing facility
Fluorocarbon disposal facilities that are in operation in Malaysia are Texcarrier (reclamation) and
Kualiti Alam (destruction).
① Texcarrier
Main business of the company is to import fluorocarbons and sell them to distributors in the
country. It also receives used fluorocarbons from refrigeration system service operators, removes
impurities, reclaims them and sells as the reclaimed products. It began recycling and reclamation of
refrigerant about eight years ago in Malaysia.
It can receive used fluorocarbons if proper mixtures or impurities are less than 0.5% and it
instructs proper recovery methods to service operators. As of 2014, 60% to 70% of the amount they
received was R-22. If they cannot be reclaimed and thus they need to be destroyed, it outsources the
disposal to later described Kualiti Alam when it accumulates a certain amount. The amount of used
fluorocarbons it receives from service operators is small compared with the amount of virgin
fluorocarbons it handles. The amount of the used fluorocarbons received generally depends on the
price of the virgin fluorocarbons.

49
② Kualiti Alam
Kualiti Alam, established in 1991, is the only hazardous waste incineration facility in Malaysia. It
is equipped with rotary kilns and exhaust gas is treated with the dry scrubber, bug filter, and wet
scrubber. Two kilns are in operation and one of them is for hazardous waste treatment with a daily
capacity of 120 tons. Solids stay in the kiln for approximately 40 minutes. The other kiln is for
medical waste with a daily capacity of 30 tons to 40 tons. The bottom of the landfill is protected with
the clay layer and impermeable liner and leachate is collected.
In response to the request from the DOE, it began destruction of fluorocarbons in 2009. It
destroys about 10 tons of fluorocarbons annually. It uses a rotary kiln with a daily capacity of 120
tons for fluorocarbon destruction. The combustion temperature is 1,000 to 1,100℃ and the gas stays
two to three seconds in the kiln. It does not monitor or calculate the destruction capacity specifically
of fluorocarbons. However, it controls the input volume under 5psi and can input approximately
600kg to 700kg of fluorocarbons in 24 hours. The disposal fee differs in accordance with the amount
of fluorocarbons, although it is 12 MYR/kg (approximately 400 yen/kg) for large-volume
fluorocarbon emitters (1 ton level). Kualiti Alam destroys R-22 (approximately 73%), R-410a
(approximately 18%) and others (below 2% each). Most of the fluorocarbons it destroys is the
refrigerant discharged by air conditioning system manufacturers.
3.2.2 Other options of fluorocarbon destruction
① Cement company
Lafarge and YTL that are cement companies show their interest in the destruction of
fluorocarbons and they visited Holcim (performs the destruction) in Indonesia together with the
DOE. Both companies are considering performing the destruction as CSR activities. Although they
have no technological problem, they have concerns on the introduction of a destruction permit
program and that they will not be able to collect a sufficient amount of fluorocarbons that will match
the facility investment. Lafarge assumes that it will be able to establish destruction facility without
thinking about the supply volume if they can receive subsidies for the investment from international
organizations, etc. YTL estimated the destruction capacity and believes that it is capable of
destruction of 385 tons annually. Although the destruction cost differs case by case, both companies
believe that it is lower than that of Kualiti Alam. They are required to obtain DOE permit for
destruction and take environmental impact assessment (EIA) procedures to perform the destruction.
② EU fluorocarbon destruction project in Southeast Asia
The UNEP works in collaboration with various countries under the Montreal Protocol and we
interviewed officials in charge of Southeast Asia. They introduced a fluorocarbons destruction
project in the region. It is a project in which EU provides funds and works in collaboration with

50
other international organizations to promote fluorocarbon destruction in the region. However, they
face a problem of fluorocarbon recovery for the destruction and they also showed interest in the
Project. The Montreal Protocol emphasizes phase-out of fluorocarbon production and consumption
and they recognize the problem of used fluorocarbon disposal. However, they are capable of
implementing limited measures due to budgetary restrictions.
Efficient recovery and destruction of fluorocarbons can be achieved in the Project in collaboration
with other destruction projects including the one introduced above.

51
4. Study of Collection system
As is in the case of Thailand, sustainability of the recovery system is important for the collection
system. Since the revision of the fluorocarbon management regulation in July 2015 in Malaysia
provides fluorocarbon disposal at certified facilities, slight progress is expected to be made. However,
it is likely to take time to develop a sustainable recovery system. Particularly, the cost-bearing issue
will remain to be a big challenge. Packaging with the replacement with energy saving equipment in
the Project will serve as the incentive for fluorocarbon recovery and destruction.
Collaboration in each step of the collection system described in the below table is options of the
Project.
Table 3.4.1 Options of Collection System in Malaysia
Step of Collection System Available Option in the Project
Collection of end-of-life equipment
from the site
Use collection network of SW110-licensed business
operator.
Recovery of used fluorocarbons Receive training on fluorocarbon handling and utilize
qualified service providers or SW110-licensed operators.
Dismantle of end-of-life equipment Can be performed by SW110-licensed operator.
※Proper operators need to be selected depending on the
target equipment.
Reclamation of fluorocarbons Texcarrier can reclaim them if the impurities content of
recovered refrigerant is below 0.5%.
Destruction of fluorocarbons Hazardous waste incineration facility can be used. When a
cement company introduces fluorocarbon destruction
facility, collaboration with the company can be an option.
Traceability, guarantee of proper disposal, and destruction
cost, etc, will be taken into consideration to decide the
destruction service operator.

52
5. Examination of Implementation Structure and Finance Scheme
5.1 National hospital (M-1)
5.1.1 Project overview
(1) Tentative schedule
Based on the fact-finding survey results, chillers (2 of 5 700RT units) for the air conditioning
system are the target facility of the JCM project. Since two units are in operation continuously (2
weeks per unit), they can be replaced individually. Thus, we can examine a replacement plan (1 or 2
units per year) in accordance with the budget allocation. The tentative schedule is based on the
assumption of replacement of one unit per year.
Table 3.5.1 Tentative Project Schedule (M-1)
Time Contents
FY2014 Proposal of outline of energy-efficiency improvement
FY 2015 or later
Year 1
PS implementation
Adjustment of details of equipment specifications
Discussions of implementation structure
Year 2 Facility replacement
Replacement of 1st chiller for air conditioning system
Year 3 Monitoring
Replacement of 2nd chiller for air conditioning system
Monitoring of energy consumption, etc., of 1st unit
Year 4 Monitoring of energy consumption, etc.
(2 )Main technologies to be introduced and project cost
【Efficiency improvement of heat source equipment】
A refrigeration equipment manufacturer estimates that replacement of a refrigeration equipment
that was produced 10 years ago with the latest high-efficiency equipment will lead to 36% electricity
cost reduction (estimation in Japan) and 24% reduction of CO2 emissions.

53
If the current type of HCFC-123 refrigerant is replaced with HFC-134a or HFC-245fa, ODP will
become zero although GWP increases. As for the GWP increase, global warming risk can be
suppressed through proper recovery and destruction of refrigerant at replacement and maintenance.
As for the project cost, the additional cost for the introduction of energy saving equipment is
estimated to be 38 million yen per refrigeration equipment according to the interview result with
manufacturers, etc. Since one unit is to be replaced per year in the project, the annual project cost
and total project cost are estimated to be 38 million yen and 76 million yen, respectively.
(3) Tentative implementation structure
The tentative project implementation structure is shown in the figure below. Entities and their
roles in the figure are currently under coordination and the scheme herein is a proposal.
New Previous Chiller New Previous Chiller

54
Figure 3.5.1 Project Implementation Structure (proposal) (M-1)
5.1.2 CO2 reduction
The CO2 reduction after the replacement with energy saving equipment based on the technology
introduced in 5.1.1 is estimated as below.

55
5.2 Commercial facility (M-2)
5.2.1 Project overview
(1) Tentative schedule
Based on the fact-finding survey results, chillers (2 of 4 720RT units) for the air conditioning
system are the target facility of the JCM project. Since two units are in operation continuously (3
weeks per unit), they can be replaced individually. Thus, we can examine a replacement plan (1 or 2
units per year) in accordance with the budget allocation. The tentative schedule is based on the
assumption of replacement of one unit per year.
Table 3.5.2 Tentative Project Schedule (M-2)
Time Contents
FY2014 Proposal of outline of energy-efficiency improvement
FY 2015 or later
Year 1
PS implementation
Adjustment of details of equipment specifications
Discussions of implementation structure
Year 2 Facility replacement (Unit 1)
Replacement of 1st chiller for air conditioning system
Year 3 Facility replacement (Unit 2)
Replacement of 2nd chiller for air conditioning system
Monitoring of energy consumption of 1st unit
Year 4 Monitoring of energy consumption, etc.
(2) Main technologies to be introduced and project cost
Main technologies to be introduced are same as those described in M-1 project. As for the project
cost, however, the additional cost for the introduction of energy saving equipment to the facility is
estimated to be 40 million yen per refrigeration equipment based on the interview results with
manufacturers. As one unit is to be replaced per year in the Project, the annual project cost and total
project cost are estimated to be 40 million yen and 80 million yen, respectively.
(3) Tentative implementation structure
The tentative project implementation structure is shown in the figure below. Entities and their
roles in the figure are currently under coordination and the scheme herein is a proposal.
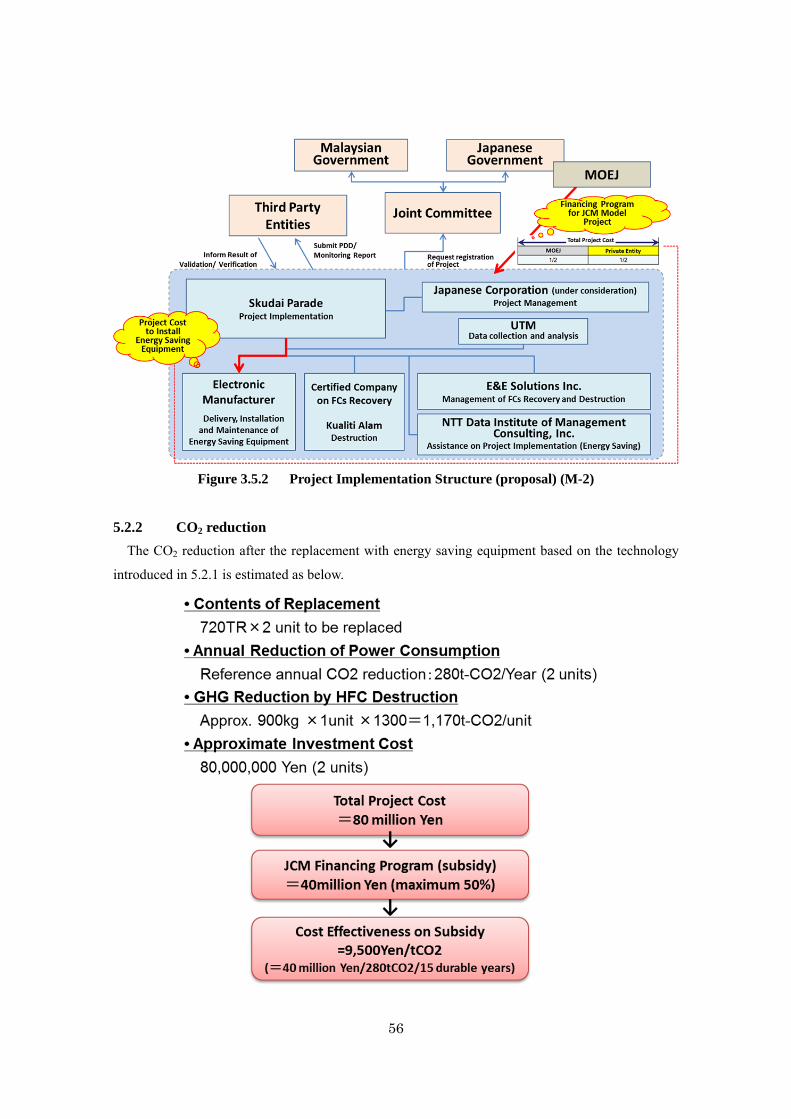
56
Figure 3.5.2 Project Implementation Structure (proposal) (M-2)
5.2.2 CO2 reduction
The CO2 reduction after the replacement with energy saving equipment based on the technology
introduced in 5.2.1 is estimated as below.

57
5.3 University (M-3)
5.3.1 Project overview
(1) Tentative schedule
Based on the fact-finding survey results, the following equipment is the target equipment of the
JCM project:
・2 units of 300TR chillers for air conditioning system for C16 building
・2 units of 250TR chillers for air conditioning system for DSI building
Since one unit is in operation continuously in both buildings, they can be replaced individually.
Thus, we can examine a replacement plan (1 or 2 units per year) in accordance with the budget
allocation. The tentative schedule is based on the assumption of replacement of one unit per year.
Table 3.5.3 Tentative Project Schedule (M-3)
Time Contents
FY2014 Proposal of outline of energy-efficiency improvement
FY 2015 or later
Year 1
PS implementation
Adjustment of details of equipment specifications
Discussions of implementation structure
Year 2 Facility replacement (Unit 1)
Replacement of 1st chiller for air conditioning system of C16
building
Replacement of 1st chiller for air conditioning system of DSI
building
Year 3 Facility replacement (Unit 2)
Replacement of 2nd chiller for air conditioning system of C16
building
Replacement of 1st chiller for air conditioning system of DSI
building
Monitoring of 1st unit of both buildings
Year 4 Monitoring of energy consumption, etc.
(2) Main technologies to be introduced and project cost
Main technologies to be introduced are same as those described in M-1 project. As for the project
cost, however, the additional cost for the introduction of energy saving equipment to the facility is
estimated to be 98 million yen for four refrigeration equipment based on the interview results with
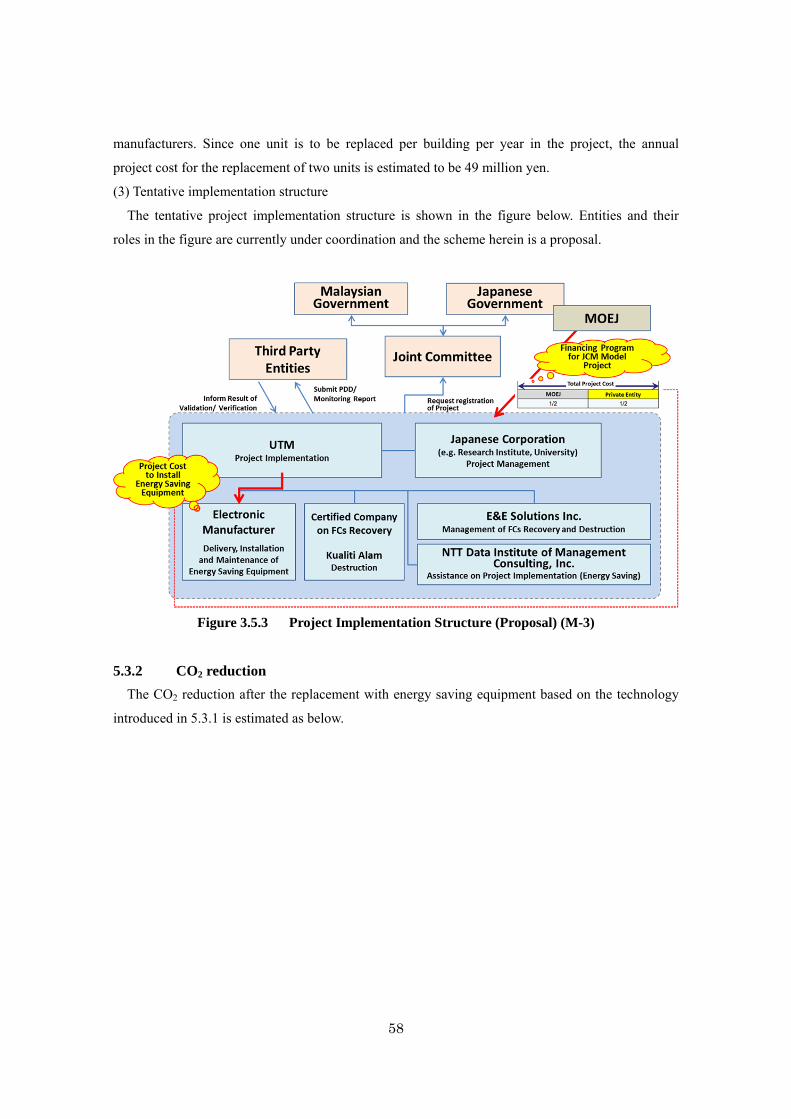
58
manufacturers. Since one unit is to be replaced per building per year in the project, the annual
project cost for the replacement of two units is estimated to be 49 million yen.
(3) Tentative implementation structure
The tentative project implementation structure is shown in the figure below. Entities and their
roles in the figure are currently under coordination and the scheme herein is a proposal.
Figure 3.5.3 Project Implementation Structure (Proposal) (M-3)
5.3.2 CO2 reduction
The CO2 reduction after the replacement with energy saving equipment based on the technology
introduced in 5.3.1 is estimated as below.

59
6. Examination of MRV Methodologies
6.1 Examination of MRV Methodologies
The GHGs subject to reduction in the project includes HFC that is designated under the Kyoto
Protocol in addition to CO2. Thus, evaluation methods of fluorocarbon destruction effects was also
studied in addition to the methodologies for CO2 emissions reduction. The study for establishing the
calculation method of CO2 emissions reduction is described herein.
Although the target of the Project is the replacement of chillers for air conditioning systems of a
hospital, a shopping mall and a research and educational institute in Malaysia, the methodology was
examined to make it as general as possible so that the method can be used widely for the
replacement of similar chillers for air conditioning systems used at similar business-use buildings.
The JCM methodologies (proposal) described herein was developed as the outcome of the study
and its application under the joint crediting mechanism is not officially approved.
(1) Eligibility criteria
Although the Project targets specific business-use facilities as described above, chillers for air
conditioning systems are widely used at other business-purpose buildings and plants and their
replacement, which includes recovery and destruction of fluorocarbons as refrigerant, can happen in
other sectors. Thus, the requirements were examined without limiting the use and characteristics of
the target facility so they can be applied to plants of other sectors.
60
Possible eligibility criterias include the following:
Criteria 1: Chiller for the air conditioning system, which consumes electricity only
Criteria 2: It is the replacement of existing facility.
Criteria 3: Electricity supplied to the reference and project chillers is grid power from a power
company in the country.
Criteria 4: Power consumption data for one year before the project implementation of the
chiller subject to the replacement can be obtained.
Inclusion of another requirement that the fluorocarbons contained as the refrigerant be the
substance designated under the Kyoto Protocol was also considered as a eligibility criteria. However,
as it is pointed out in the Montreal Protocol, the proper recovery and destruction is meaningful even
they are not substances designated by the Kyoto Protocol (HCFC, etc.).Thus, it was decided that it is
not included as a requirement herein and that it is treated as CO-Benefit.
(2) Reduction volume calculation method (proposal)
The reference emissions (REy) and project emissions (PEy) in Year “y” are propose to be
estimated based on the following formula:
REy = ECRE × EFy
ECREy = ECm × Hy / Hm
ECRey: reference power consumption in Year y [kWh/y]
ECREm: actually measured power consumption of reference in the monitoring year [kWh/y]
Hy: chiller operation hours in Year y [hrs/y]
Hm: actually measured operation hours in the monitoring year [kWh/y]
EF: emission factor of grid power of the target country in Year y [t-CO2/kWh]
PEy = REy × Rη / Pη
Rη: efficiency of reference chiller (coefficient of performance)
Pη: efficiency of project chiller (coefficient of performance)
The destruction effects of fluorocarbons designated under the Kyoto Protocol, contained as the
refrigerant of the project chiller, are not included herein. The calculation methods are examined later
separately.
6.2 Evaluation methods of fluorocarbon destruction effects
The evaluation method of destruction efficiency of fluorocarbons presented in the survey results
in Thailand is used.