Embed Size (px)
Citation preview
Strategic QbD for the Analytical Laboratory
Paul Smith
EMEAI Laboratory Compliance
Productivity Specialist
1
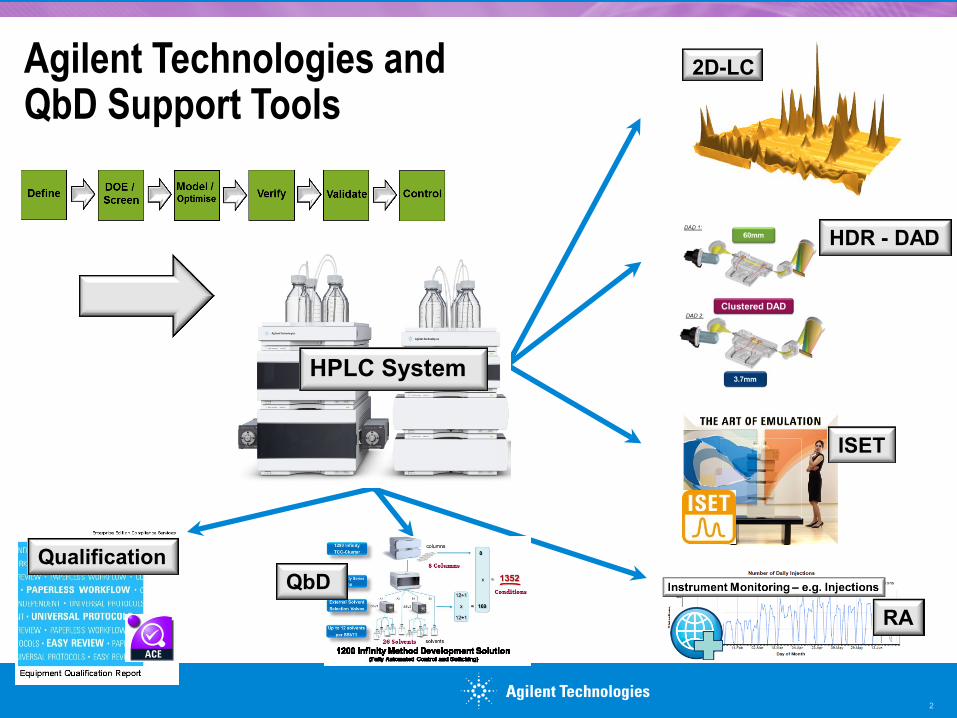
Agilent Technologies and QbD Support Tools
2
2D-LC
HDR - DAD
ISET
RA
Qualification
HPLC System
QbD
3
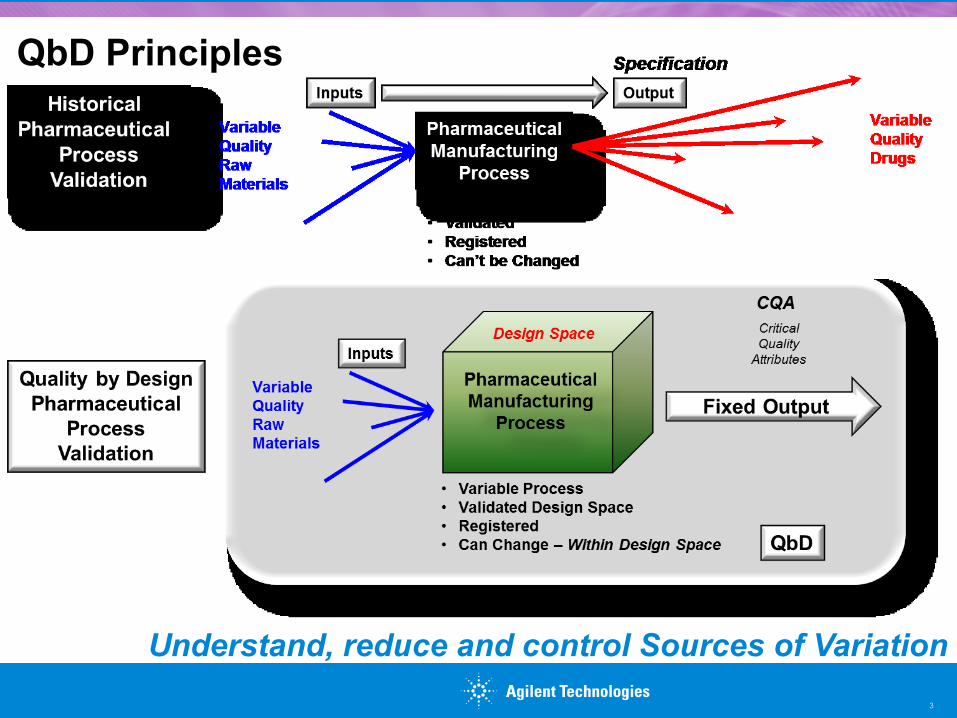
QbD Principles
Understand, reduce and control Sources of Variation
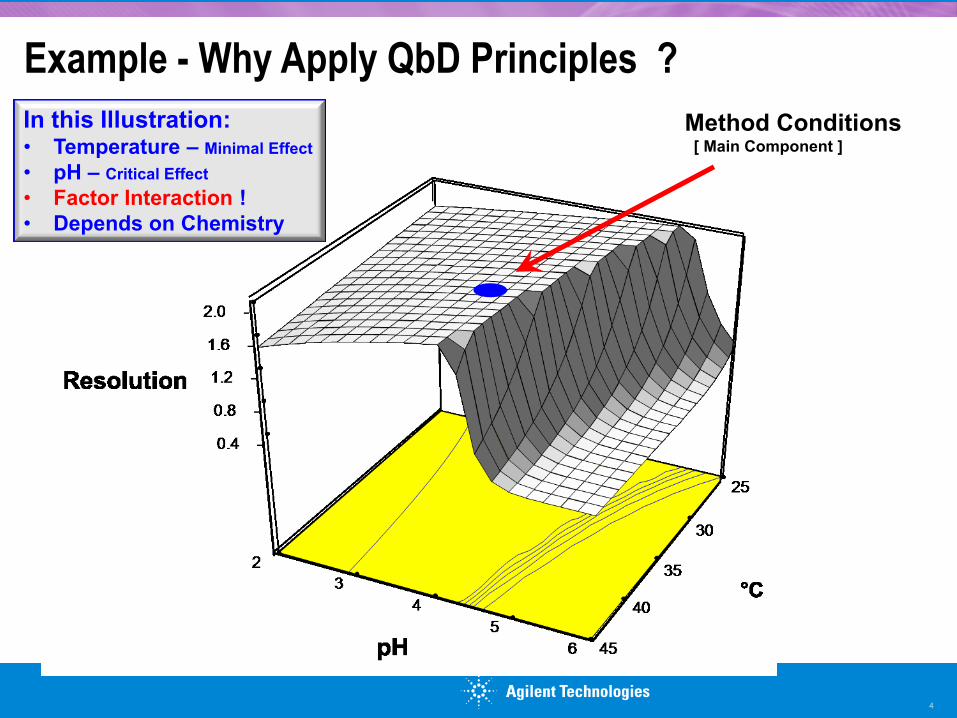
Example - Why Apply QbD Principles ?
4
Method Conditions [ Main Component ]
In this Illustration: • Temperature – Minimal Effect
• pH – Critical Effect
• Factor Interaction !
• Depends on Chemistry
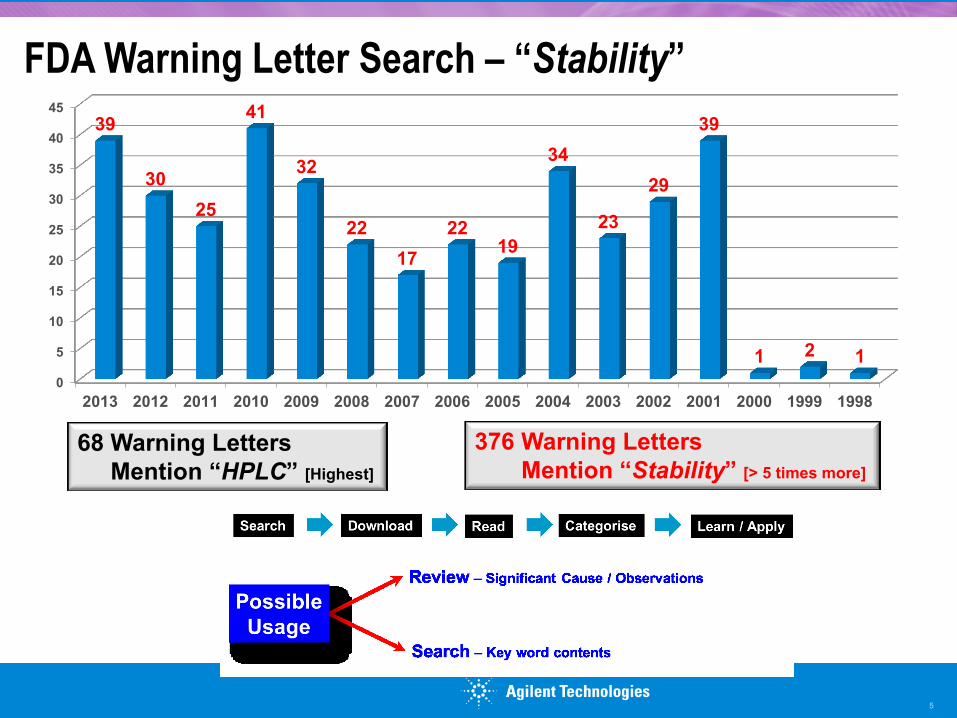
FDA Warning Letter Search – “Stability”
5
0
5
10
15
20
25
30
35
40
45
2013 2012 2011 2010 2009 2008 2007 2006 2005 2004 2003 2002 2001 2000 1999 1998
39
30
25
41
32
22
17
22 19
34
23
29
39
1 2 1
68 Warning Letters
Mention “HPLC” [Highest]
376 Warning Letters
Mention “Stability” [> 5 times more]
6
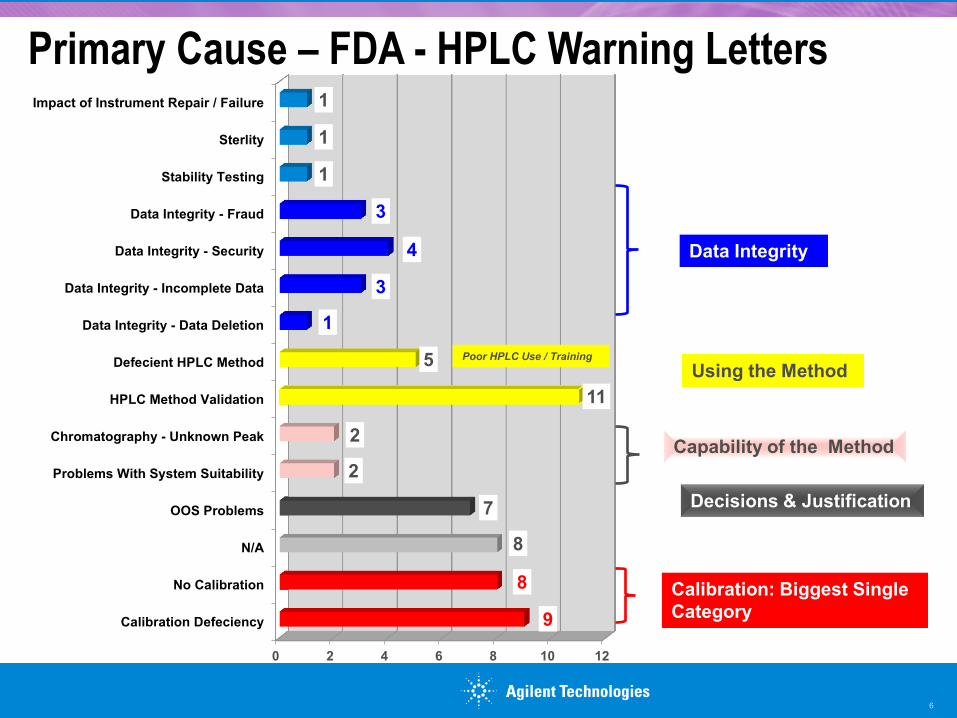
Primary Cause – FDA - HPLC Warning Letters
0 2 4 6 8 10 12
Calibration Defeciency
No Calibration
N/A
OOS Problems
Problems With System Suitability
Chromatography - Unknown Peak
HPLC Method Validation
Defecient HPLC Method
Data Integrity - Data Deletion
Data Integrity - Incomplete Data
Data Integrity - Security
Data Integrity - Fraud
Stability Testing
Sterlity
Impact of Instrument Repair / Failure
9
8
8
7
2
2
11
5
1
3
4
3
1
1
1
Calibration: Biggest Single
Category
Decisions & Justification
Using the Method
Data Integrity
Capability of the Method
Poor HPLC Use / Training
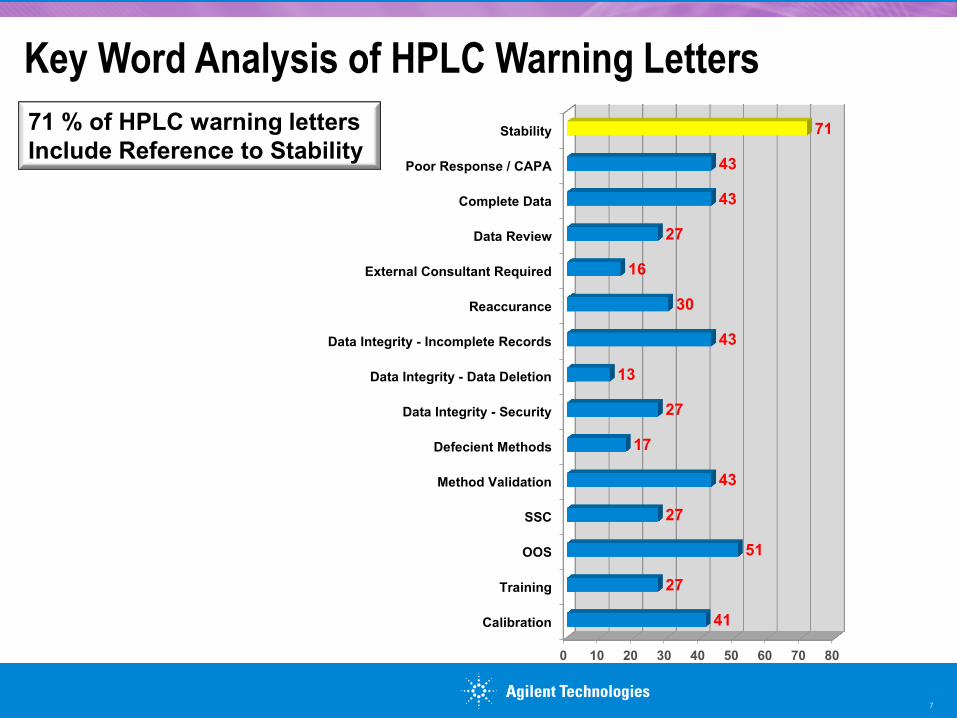
Key Word Analysis of HPLC Warning Letters
7
71 % of HPLC warning letters
Include Reference to Stability
0 10 20 30 40 50 60 70 80
Calibration
Training
OOS
SSC
Method Validation
Defecient Methods
Data Integrity - Security
Data Integrity - Data Deletion
Data Integrity - Incomplete Records
Reaccurance
External Consultant Required
Data Review
Complete Data
Poor Response / CAPA
Stability
41
27
51
27
43
17
27
13
43
30
16
27
43
43
71
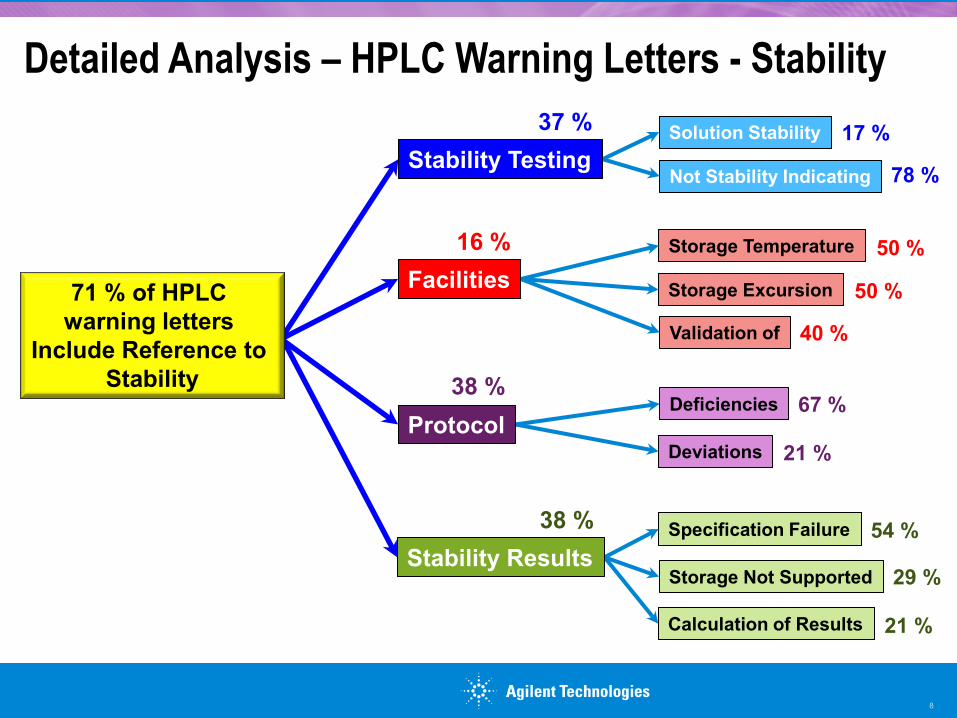
Detailed Analysis – HPLC Warning Letters - Stability
8
Solution Stability
Not Stability Indicating
Storage Temperature
Storage Excursion
Validation of
Deficiencies
Deviations
Specification Failure
Storage Not Supported
Calculation of Results
Stability Testing
Facilities
Protocol
Stability Results
37 %
16 %
38 %
38 %
17 %
78 %
50 %
50 %
40 %
67 %
21 %
54 %
29 %
21 %
71 % of HPLC
warning letters
Include Reference to
Stability
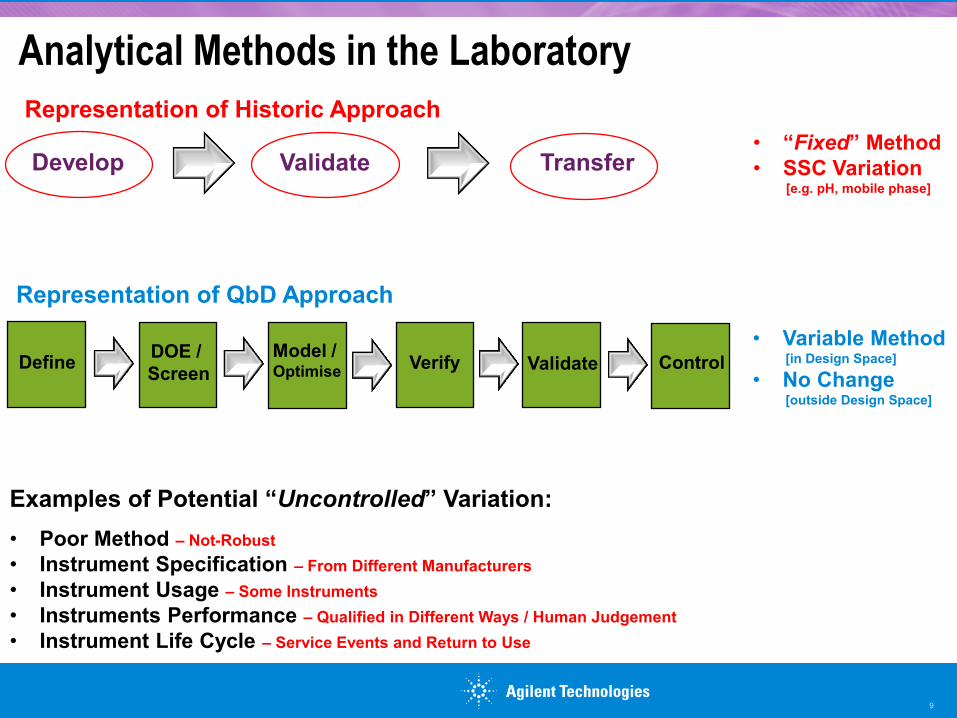
Analytical Methods in the Laboratory
9
Develop Validate Transfer
Representation of Historic Approach
Define DOE /
Screen
Model / Optimise
Verify Validate Control
Representation of QbD Approach
• “Fixed” Method
• SSC Variation [e.g. pH, mobile phase]
• Variable Method [in Design Space]
• No Change [outside Design Space]
Examples of Potential “Uncontrolled” Variation:
• Poor Method – Not-Robust
• Instrument Specification – From Different Manufacturers
• Instrument Usage – Some Instruments
• Instruments Performance – Qualified in Different Ways / Human Judgement
• Instrument Life Cycle – Service Events and Return to Use
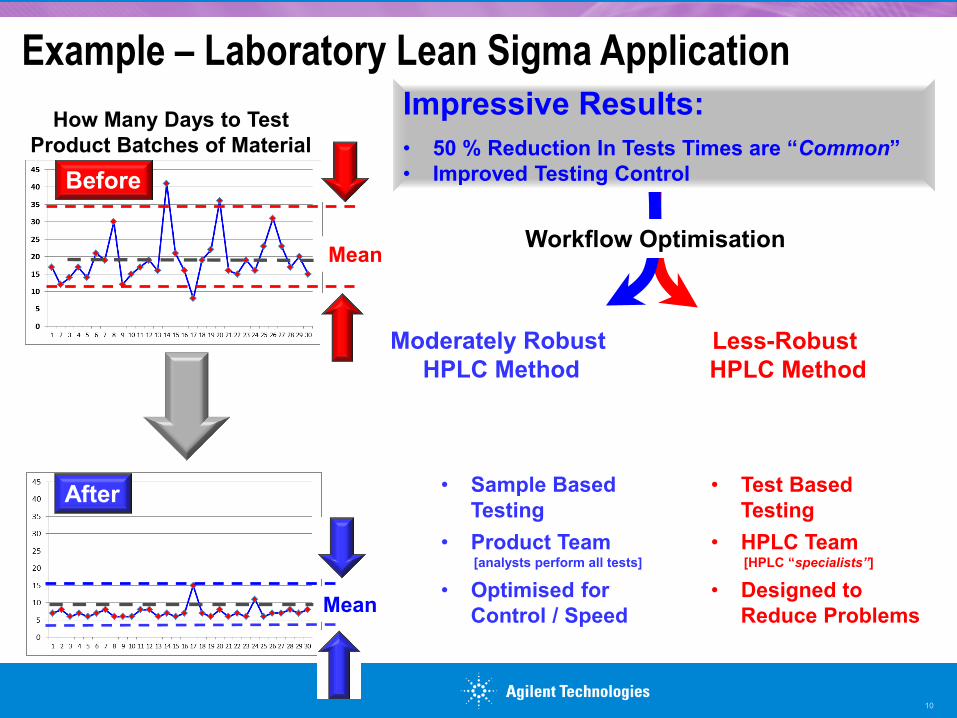
Example – Laboratory Lean Sigma Application
10
How Many Days to Test
Product Batches of Material
Before
Mean Workflow Optimisation
After
Mean
Impressive Results:
• 50 % Reduction In Tests Times are “Common”
• Improved Testing Control
Moderately Robust
HPLC Method
• Sample Based
Testing
• Product Team [analysts perform all tests]
• Optimised for
Control / Speed
Less-Robust
HPLC Method
• Test Based
Testing
• HPLC Team [HPLC “specialists”]
• Designed to
Reduce Problems
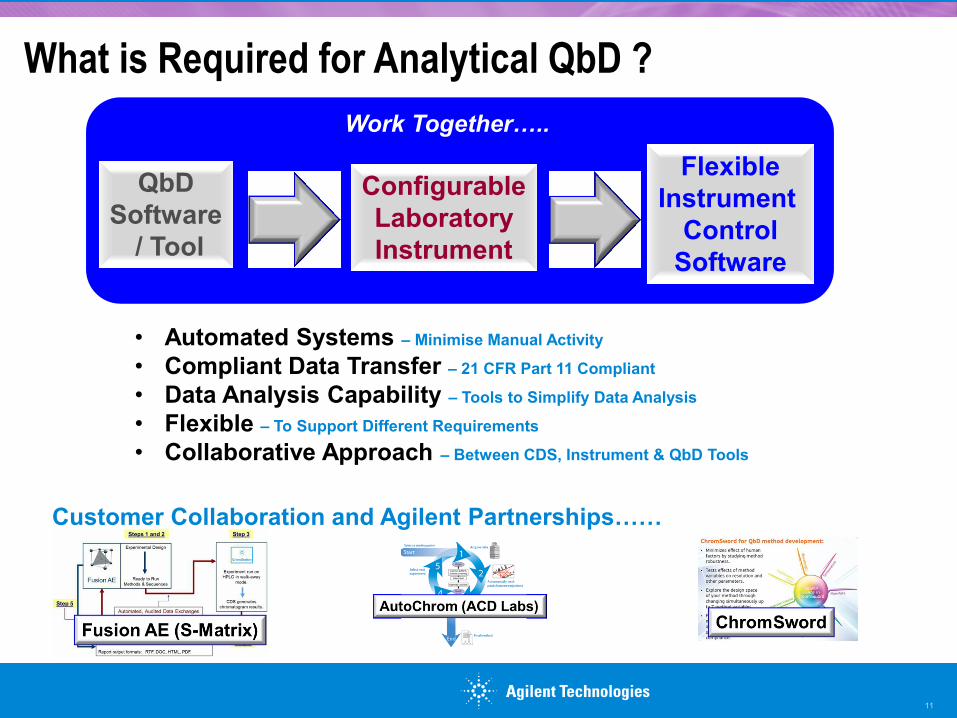
What is Required for Analytical QbD ?
11
• Automated Systems – Minimise Manual Activity
• Compliant Data Transfer – 21 CFR Part 11 Compliant
• Data Analysis Capability – Tools to Simplify Data Analysis
• Flexible – To Support Different Requirements
• Collaborative Approach – Between CDS, Instrument & QbD Tools
QbD
Software
/ Tool
Configurable
Laboratory
Instrument
Flexible
Instrument
Control
Software
Work Together…..
Customer Collaboration and Agilent Partnerships……
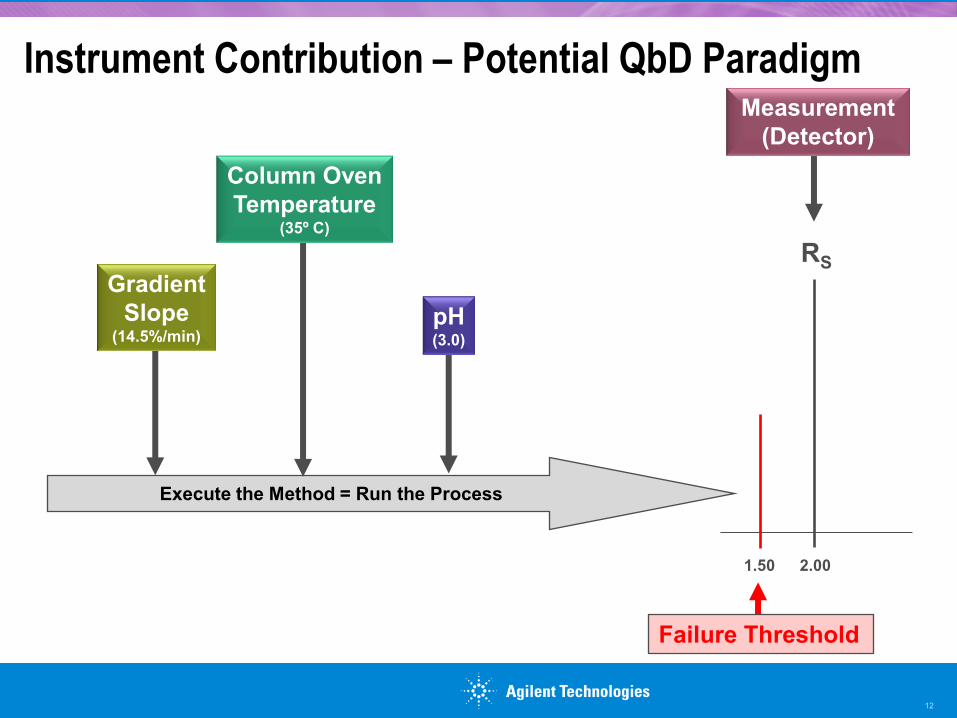
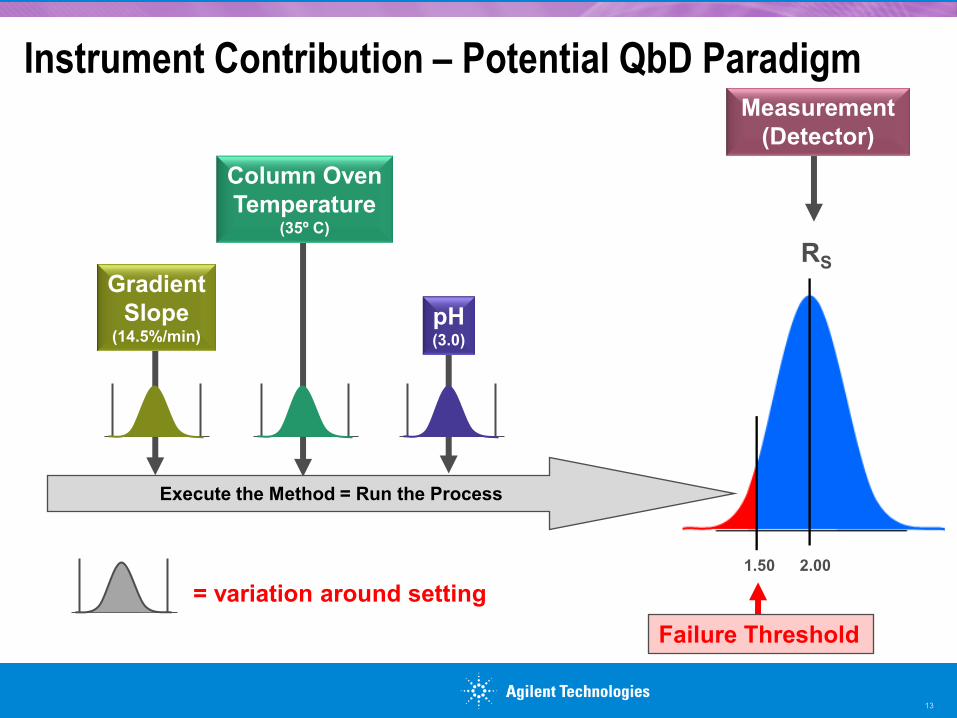
Instrument Contribution – Potential QbD Paradigm
12
Execute the Method = Run the Process
Gradient
Slope (14.5%/min)
pH (3.0)
Measurement
(Detector)
RS
2.00
Failure Threshold
1.50
Column Oven
Temperature (35º C)
Instrument Contribution – Potential QbD Paradigm
13
Gradient
Slope (14.5%/min)
pH (3.0)
Measurement
(Detector)
2.00
Failure Threshold
1.50
Column Oven
Temperature (35º C)
= variation around setting
RS
Execute the Method = Run the Process
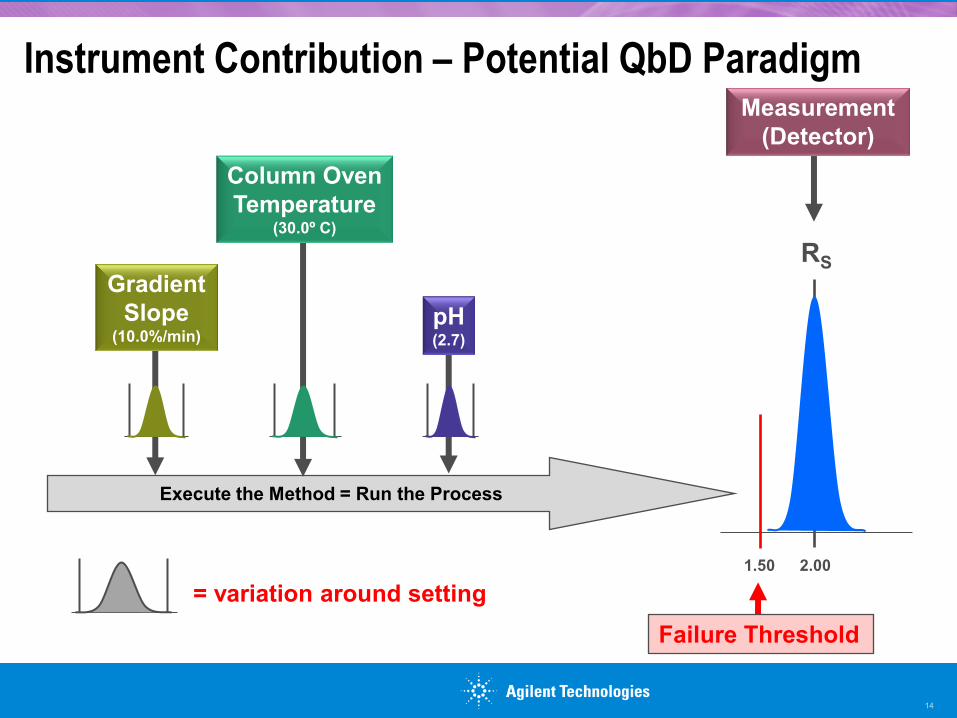
Instrument Contribution – Potential QbD Paradigm
14
Execute the Method = Run the Process
Gradient
Slope (10.0%/min)
pH (2.7)
Measurement
(Detector)
2.00
Failure Threshold
1.50
Column Oven
Temperature (30.0º C)
= variation around setting
RS
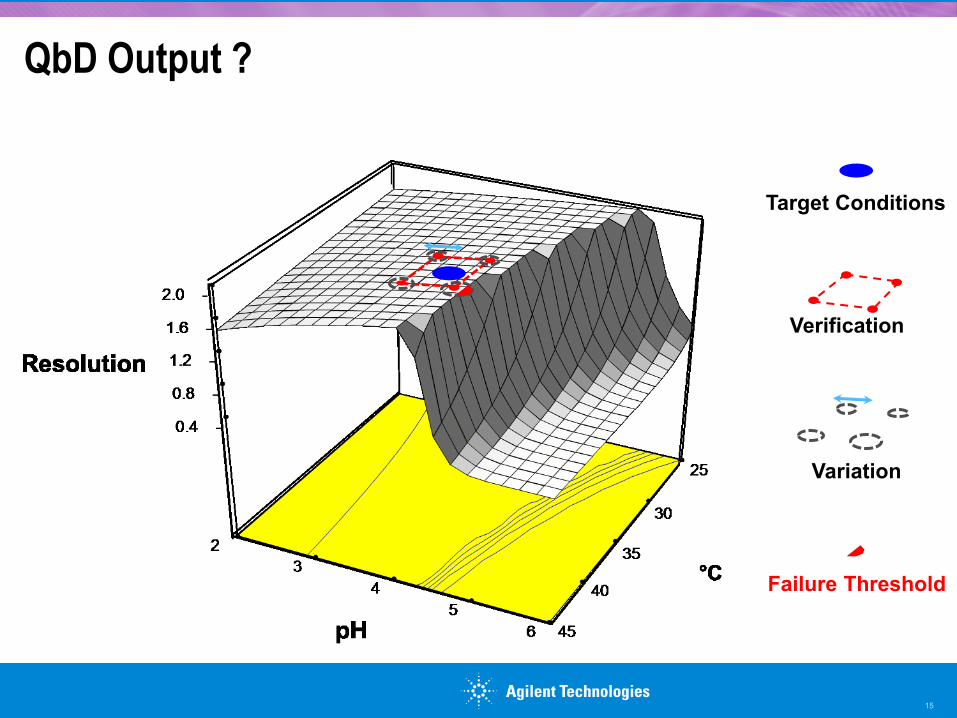
QbD Output ?
15
Target Conditions
Verification
Variation
Failure Threshold

Failure Threshold Example
16
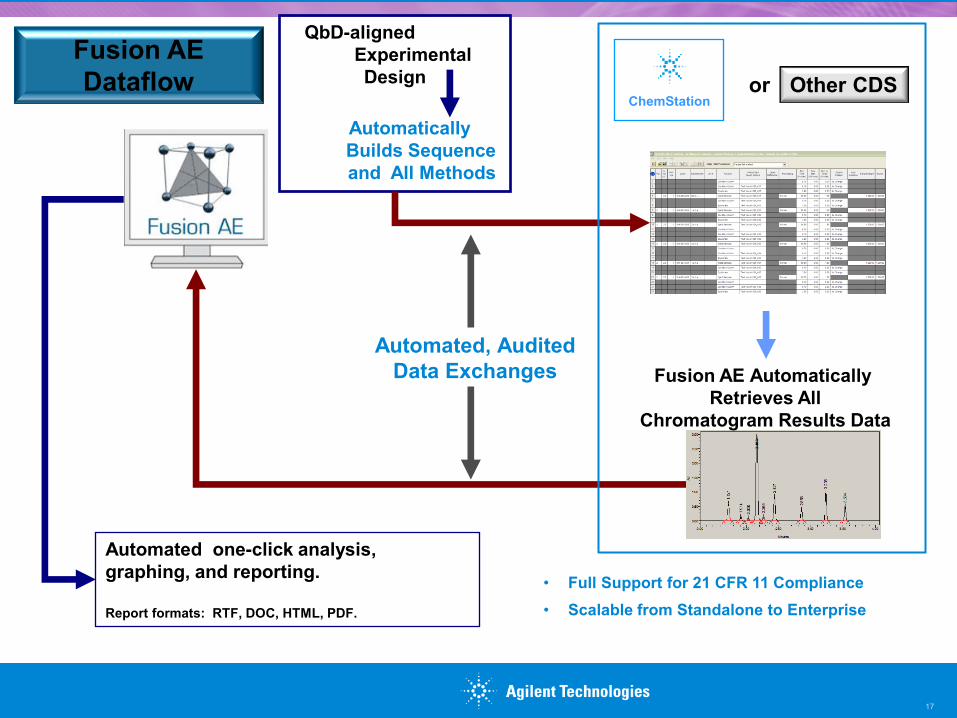
Automated, Audited
Data Exchanges
Automated one-click analysis,
graphing, and reporting.
Report formats: RTF, DOC, HTML, PDF.
• Full Support for 21 CFR 11 Compliance
• Scalable from Standalone to Enterprise
Fusion AE
Dataflow
QbD-aligned
Experimental
Design
Automatically
Builds Sequence
and All Methods
17
Fusion AE Automatically
Retrieves All
Chromatogram Results Data
ChemStation or Other CDS
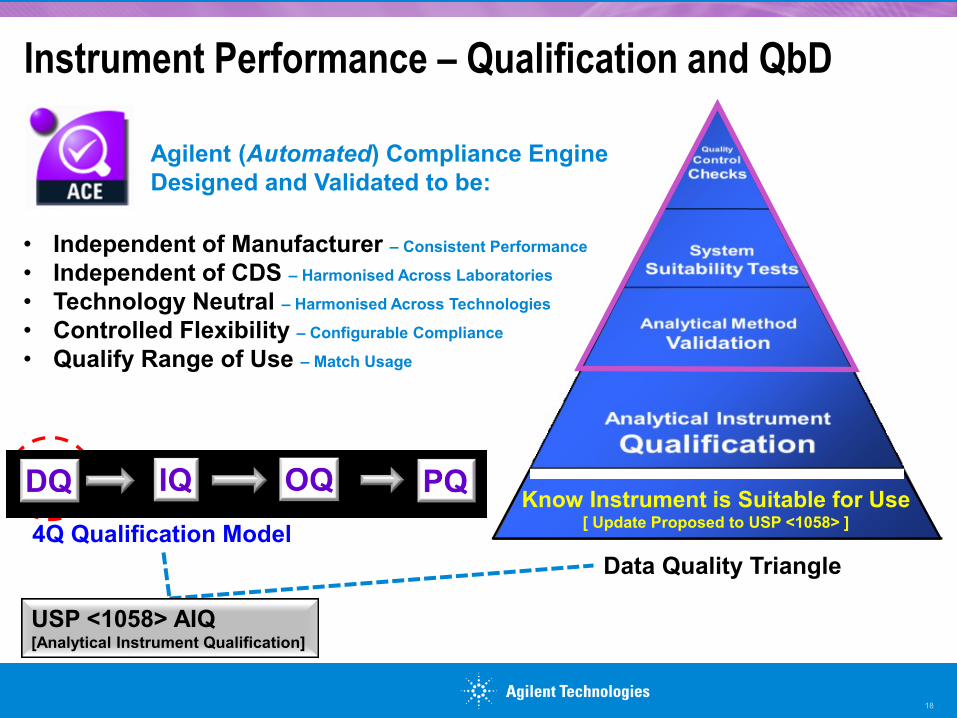
Know Instrument is Suitable for Use [ Update Proposed to USP <1058> ]
Instrument Performance – Qualification and QbD
18
• Independent of Manufacturer – Consistent Performance
• Independent of CDS – Harmonised Across Laboratories
• Technology Neutral – Harmonised Across Technologies
• Controlled Flexibility – Configurable Compliance
• Qualify Range of Use – Match Usage
Agilent (Automated) Compliance Engine
Designed and Validated to be:
Data Quality Triangle
4Q Qualification Model
USP <1058> AIQ [Analytical Instrument Qualification]
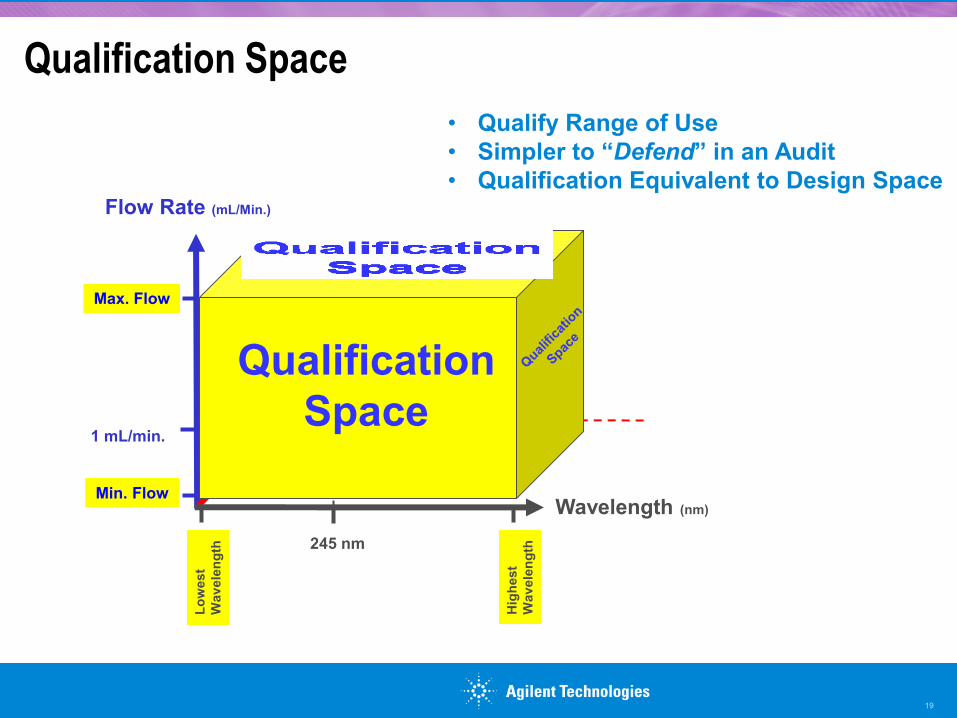
Qualification Space
19
Wavelength (nm)
Oven Temperature (oC)
Flow Rate (mL/Min.)
245 nm
45 oC
1 mL/min.
Min. Flow
Max. Flow
Lo
west
Wav
ele
ng
th
Hig
hest
Wav
ele
ng
th
Highest Temp.
Lowest Temp.
Qualification
Space
• Qualify Range of Use
• Simpler to “Defend” in an Audit
• Qualification Equivalent to Design Space
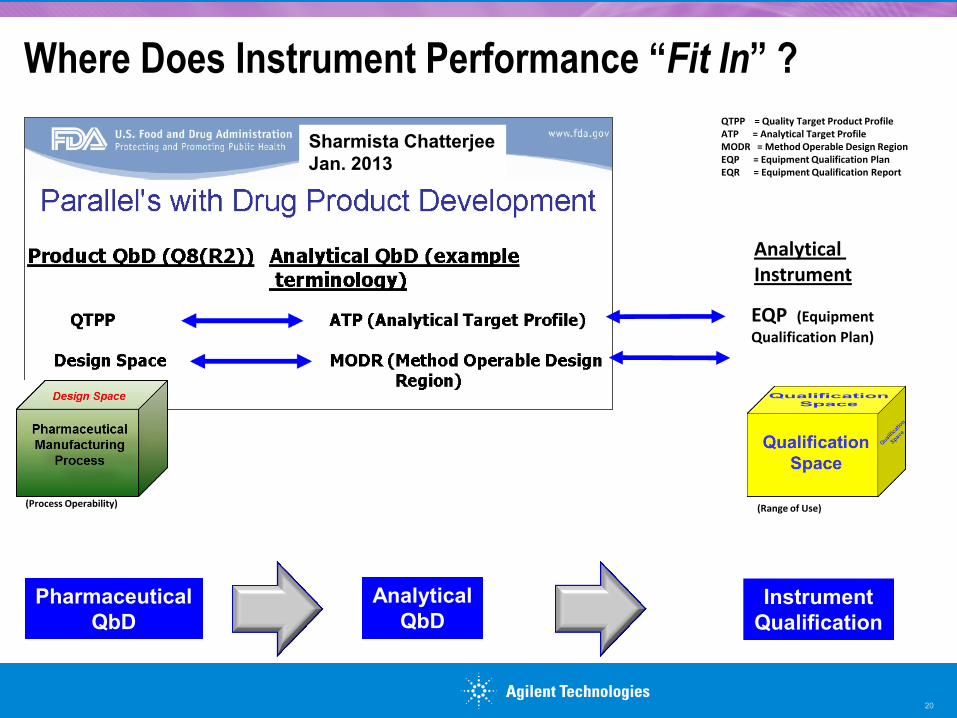
Where Does Instrument Performance “Fit In” ?
20
Pharmaceutical
QbD
Analytical
QbD
(Process Operability)
Sharmista Chatterjee
Jan. 2013
EQP (Equipment
Qualification Plan)
Instrument
Qualification
Analytical Instrument
(Range of Use)
QTPP = Quality Target Product Profile ATP = Analytical Target Profile MODR = Method Operable Design Region EQP = Equipment Qualification Plan EQR = Equipment Qualification Report
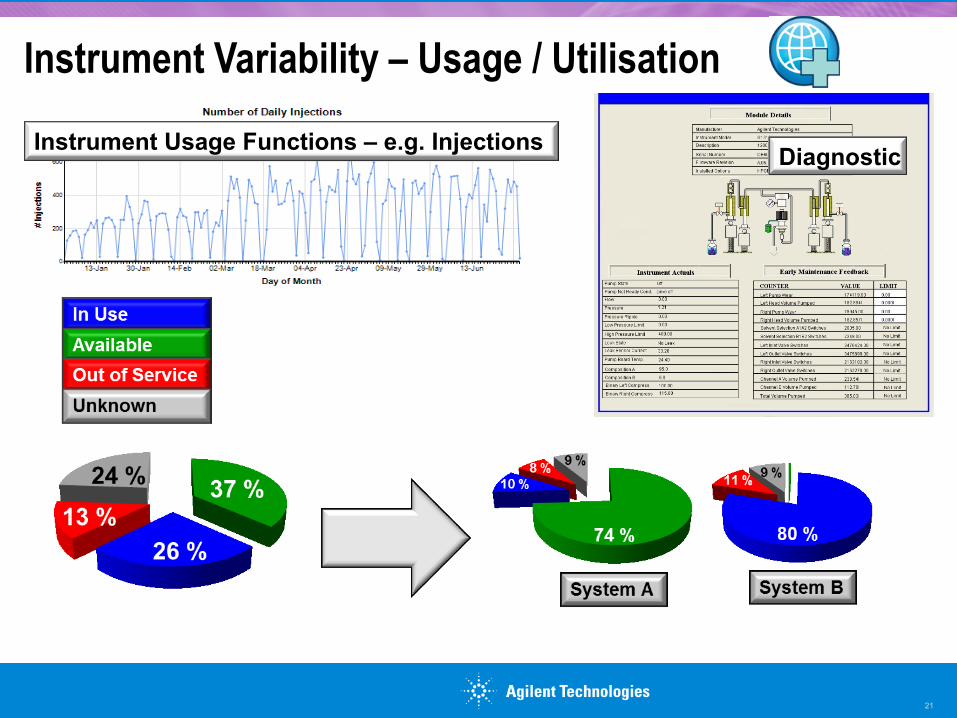
Instrument Variability – Usage / Utilisation
21
Diagnostic Instrument Usage Functions – e.g. Injections
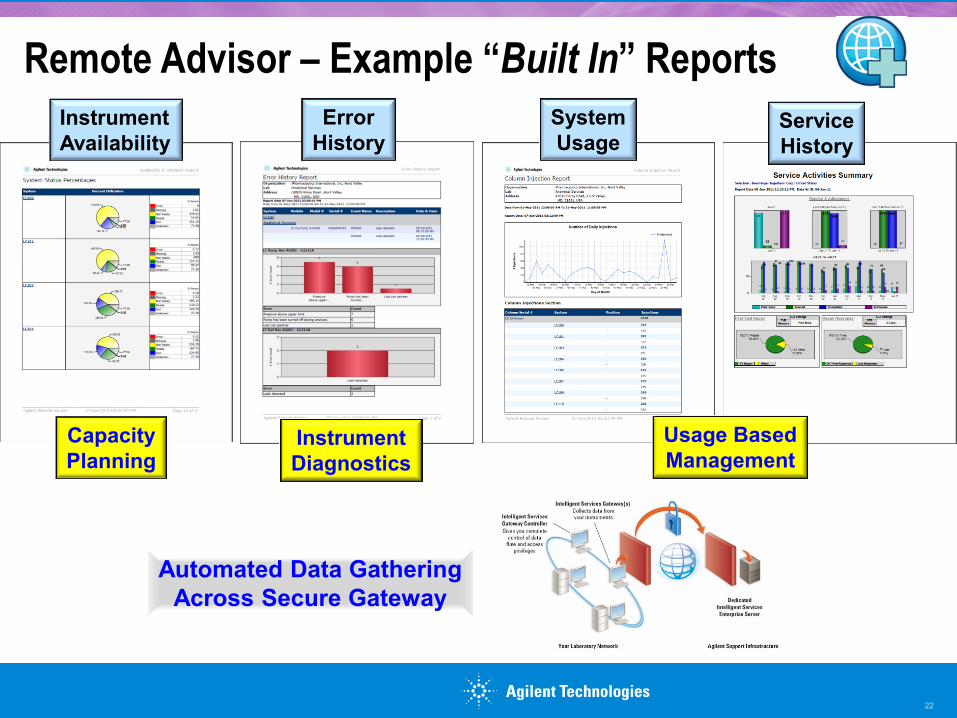
Remote Advisor – Example “Built In” Reports
22
Instrument
Availability
Error
History
System
Usage Service
History
Capacity
Planning Instrument
Diagnostics
Usage Based
Management
Automated Data Gathering
Across Secure Gateway
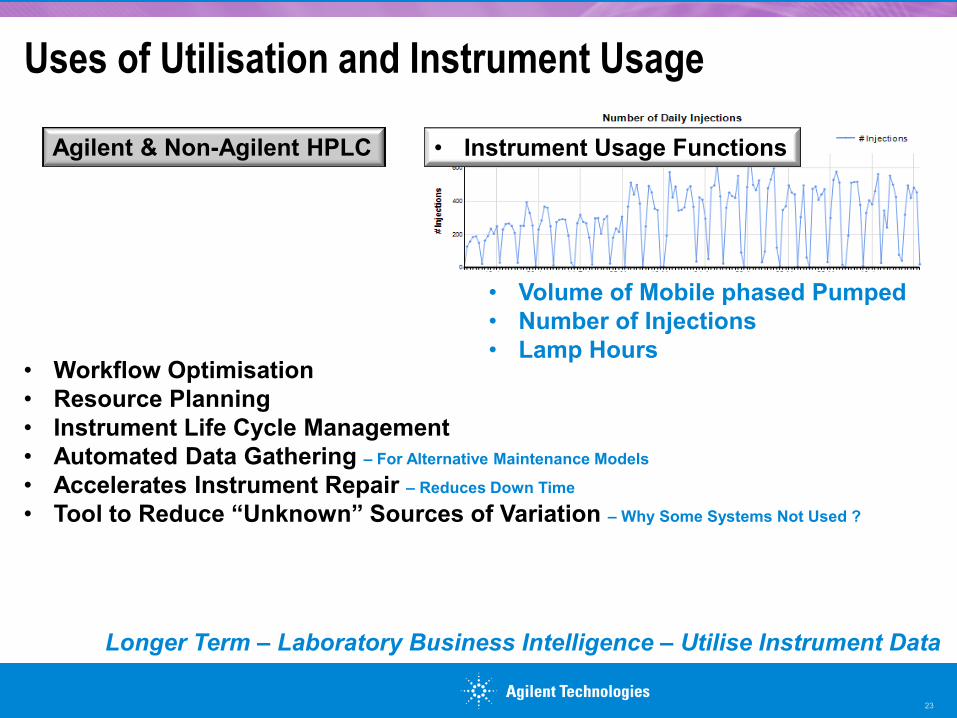
Uses of Utilisation and Instrument Usage
23
• Instrument Usage Functions
• Workflow Optimisation
• Resource Planning
• Instrument Life Cycle Management
• Automated Data Gathering – For Alternative Maintenance Models
• Accelerates Instrument Repair – Reduces Down Time
• Tool to Reduce “Unknown” Sources of Variation – Why Some Systems Not Used ?
Agilent & Non-Agilent HPLC
• Volume of Mobile phased Pumped
• Number of Injections
• Lamp Hours
Longer Term – Laboratory Business Intelligence – Utilise Instrument Data
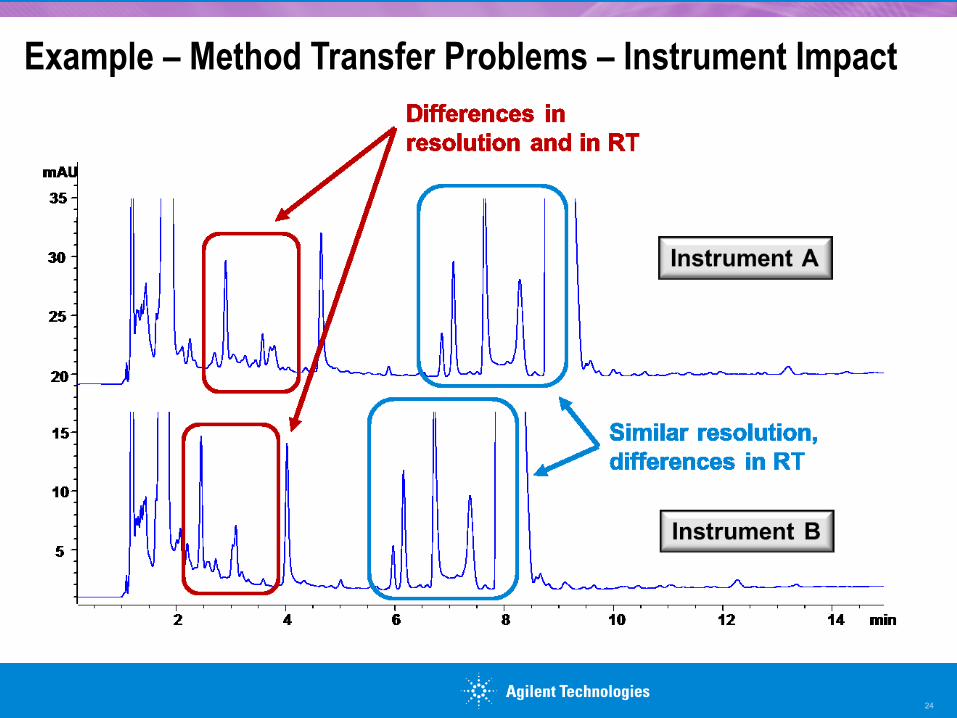
Example – Method Transfer Problems – Instrument Impact
24
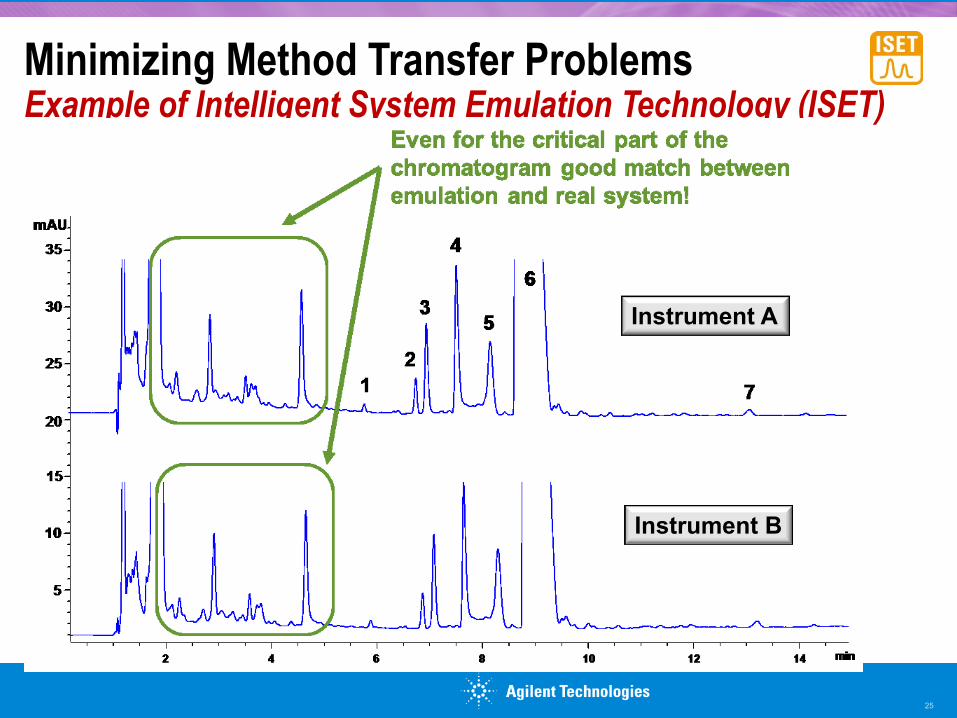
Minimizing Method Transfer Problems Example of Intelligent System Emulation Technology (ISET)
25
Instrument A
Instrument B
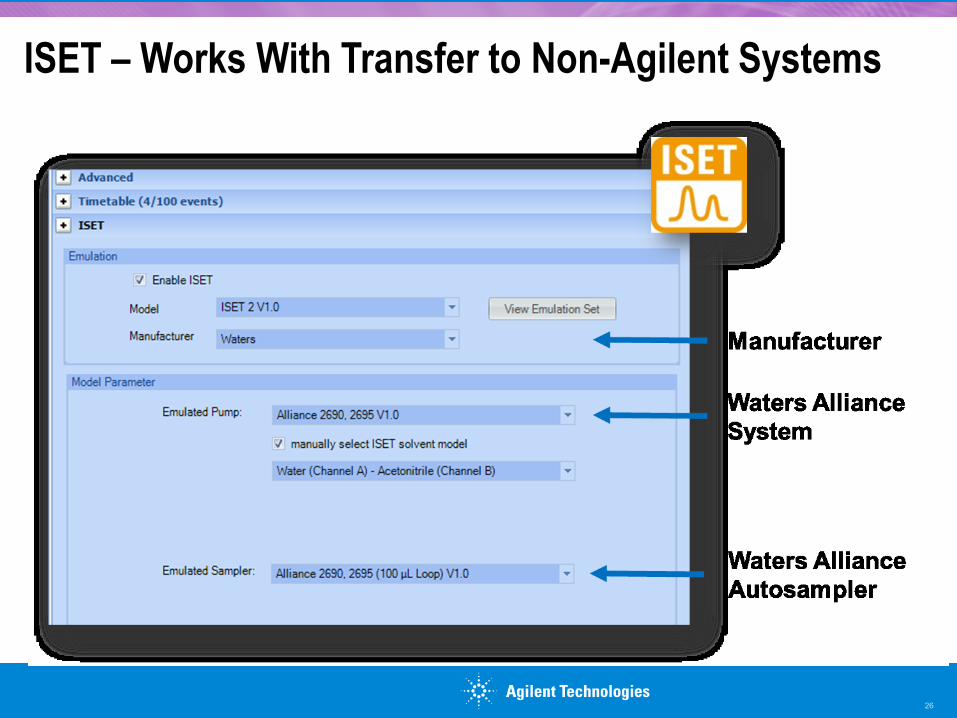
ISET – Works With Transfer to Non-Agilent Systems
26

27