Embed Size (px)
Citation preview

Other informationGovernance
73Wolseley plc Annual Report and Accounts 2016
Strategic report Financials
74 Group income statement
75 Group statement of comprehensive income
75 Group statement of changes in equity
76 Group balance sheet
77 Group cash flow statement
78 Notes to the consolidated financial statements
114 Independent auditor’s report to the members of Wolseley plc (in respect of the consolidated and the Company’s financial statements)
118 Company profit and loss account
118 Company statement of changes in equity
119 Company balance sheet
120 Notes to the Company financial statements
Financials

Wolseley plc Annual Report and Accounts 201674
Group income statement
Year ended 31 July 2016
Notes
2016Before
exceptional items
£m
2016Exceptional
items (note 4)
£m
2016Total
£m
2015Before
exceptional items
£m
2015Exceptional
items (note 4)
£m
2015Total
£m
Revenue 2 14,430 – 14,430 13,332 – 13,332
Cost of sales (10,350) (1) (10,351) (9,604) – (9,604)
Gross profit 4,080 (1) 4,079 3,728 – 3,728
Operating costs:
amortisation of acquired intangible assets (53) – (53) (56) – (56)
impairment of goodwill and acquired intangible assets (94) – (94) (238) – (238)
other (3,164) (1) (3,165) (2,874) (4) (2,878)
Operating costs 3 (3,311) (1) (3,312) (3,168) (4) (3,172)
Operating profit 2, 3 769 (2) 767 560 (4) 556
Finance income – – – 1 – 1
Finance costs 5 (40) – (40) (27) (22) (49)
Profit before tax 729 (2) 727 534 (26) 508
Tax 6 (232) 1 (231) (184) (3) (187)
Profit from continuing operations 497 (1) 496 350 (29) 321
Profit/(loss) from discontinued operations 7 2 152 154 (1) (107) (108)
Profit for the year 499 151 650 349 (136) 213
Attributable to:
Shareholders of the Company 508 151 659 349 (136) 213
Non-controlling interests (9) – (9) – – –
499 151 650 349 (136) 213
Earnings per share 10
Continuing operations and discontinued operations
Basic earnings per share 256.4p 82.1p
Diluted earnings per share 254.8p 81.9p
Continuing operations only
Basic earnings per share 195.6p 123.8p
Diluted earnings per share 194.4p 123.4p
Non-GAAP performance measures
Trading profit from ongoing operations 2 917 857
Trading loss from non-ongoing operations 2 (1) (3)
Trading profit from continuing operations 2, 9 916 854
EBITDA before exceptional items 9 1,056 971
Profit before tax, exceptional items and the amortisation and impairment of acquired intangible assets 9 876 828
Headline earnings per share 10 247.7p 230.2p
Headline diluted earnings per share 10 246.2p 229.4p

Governance Other information
Wolseley plc Annual Report and Accounts 2016 75
Strategic report Financials
Group statement of comprehensive income
Notes2016
£m 2015
£m
Profit for the year 650 213
Other comprehensive income:
Items that may be reclassified subsequently to profit or loss:
Exchange gain on translation of overseas operations1 495 10
Exchange loss on translation of borrowings and derivatives designated as hedges of overseas operations1 (107) (46)
Cumulative currency translation differences on disposals1 (125) 26
Tax charge on items that may be reclassified to profit or loss2 6 (7) –
Items that will not be reclassified subsequently to profit or loss:
Actuarial loss on retirement benefit plans2 25 (120) (61)
Tax credit on items that will not be reclassified to profit or loss2 6, 25 25 15
Other comprehensive income/(expense) for the year 161 (56)
Total comprehensive income for the year 811 157
Total comprehensive income/(expense) attributable to:
Continuing operations 781 276
Discontinued operations 30 (119)
Total comprehensive income for the year 811 157
1 Impacting the translation reserve.
2 Impacting the profit and loss reserve account.
Group statement of changes in equity
Reserves
Notes
Share capital
£m
Share premium
£m
Translation reserve
£m
Treasury shares
£m
Own shares
£m
Profit and loss
account £m
Non- controlling
interest£m
Total equity
£m
Shareholders’ equity at 1 August 2014 29 41 127 – (93) 2,782 – 2,886
Profit for the year – – – – – 213 – 213
Other comprehensive expense – – (10) – – (46) – (56)
Total comprehensive income – – (10) – – 167 – 157
New share capital subscribed – 1 – – – – – 1
Purchase of own shares by Employee Benefit Trusts 26 – – – – (15) – – (15)
Issue of own shares by Employee Benefit Trusts 26 – – – – 45 (40) – 5
Credit to equity for share-based payments 27 – – – – – 20 – 20
Tax relating to share-based payments 6 – – – – – 10 – 10
Purchase of Treasury shares 26 – – – (250) – – – (250)
Disposal of Treasury shares 26 – – – 10 – (2) – 8
Dividends paid 8 – – – – – (222) – (222)
Changes in non-controlling interest in subsidiaries – – – – – – 7 7
Shareholders’ equity at 31 July 2015 29 42 117 (240) (63) 2,715 7 2,607
Profit for the year – – – – – 659 (9) 650
Other comprehensive income/(expense) – – 263 – – (102) – 161
Total comprehensive income – – 263 – – 557 (9) 811
Purchase of own shares by Employee Benefit Trusts 26 – – – – (14) – – (14)
Issue of own shares by Employee Benefit Trusts 26 – – – – 20 (19) – 1
Credit to equity for share-based payments 27 – – – – – 20 – 20
Purchase of Treasury shares 26 – – – (300) – – – (300)
Disposal of Treasury shares 26 – – – 24 – (10) – 14
Dividends paid 8 – – – – – (238) – (238)
Shareholders’ equity at 31 July 2016 29 42 380 (516) (57) 3,025 (2) 2,901
Year ended 31 July 2016

Wolseley plc Annual Report and Accounts 201676
Group balance sheet
Notes2016
£m2015
£m
Assets
Non-current assets
Intangible assets: goodwill 12 902 816
Intangible assets: other 13 202 195
Property, plant and equipment 14 1,434 1,164
Financial assets 23 16
Retirement benefit assets 25 – 57
Deferred tax assets 15 127 115
Trade and other receivables 16 212 172
Derivative financial assets 17 20 24
2,920 2,559
Current assets
Inventories 2,017 1,688
Trade and other receivables 16 2,207 1,915
Current tax receivable – 4
Derivative financial assets 17 11 10
Cash and cash equivalents 18 940 1,105
5,175 4,722
Assets held for sale 19 56 201
Total assets 8,151 7,482
Liabilities
Current liabilities
Trade and other payables 20 2,634 2,281
Current tax payable 101 58
Bank loans and overdrafts 21 701 1,001
Obligations under finance leases 23 4 4
Derivative financial liabilities 17 – 1
Provisions 24 88 78
Retirement benefit obligations 25 9 8
3,537 3,431
Non-current liabilities
Trade and other payables 20 163 125
Bank loans 21 1,175 913
Obligations under finance leases 23 27 25
Deferred tax liabilities 15 65 53
Provisions 24 133 128
Retirement benefit obligations 25 138 64
1,701 1,308
Liabilities held for sale 19 12 136
Total liabilities 5,250 4,875
Net assets 2,901 2,607
Equity
Share capital 26 29 29
Share premium account 42 42
Reserves 2,832 2,529
Equity attributable to shareholders of the Company 2,903 2,600
Non-controlling interest (2) 7
Total equity 2,901 2,607
The accompanying notes are an integral part of these consolidated financial statements. The consolidated financial statements on pages 74 to 113 were approved by the Board of Directors on 26 September 2016 and were signed on its behalf by
John Martin Group Chief Executive
As at 31 July 2016

Governance Other information
Wolseley plc Annual Report and Accounts 2016 77
Strategic report Financials
Group cash flow statement
Notes2016
£m2015
£m
Cash flows from operating activities
Cash generated from operations 28 1,019 937
Interest received 2 2
Interest paid (41) (45)
Tax paid (193) (210)
Net cash generated from operating activities 787 684
Cash flows from investing activities
Acquisition of businesses (net of cash acquired) 29 (113) (105)
Disposals of businesses (net of cash disposed of) 30 9 35
Purchases of property, plant and equipment (187) (205)
Proceeds from sale of property, plant and equipment and assets held for sale 56 20
Purchases of intangible assets (31) (26)
Disposals of financial assets – 31
Net cash used in investing activities (266) (250)
Cash flows from financing activities
Proceeds from the issue of shares to shareholders 26 – 1
Purchase of own shares by Employee Benefit Trusts 26 (14) (15)
Purchase of Treasury shares 26 (300) (250)
Proceeds from the sale of shares by Employee Benefit Trusts 26 1 5
Proceeds from the sale of Treasury shares 26 14 8
Proceeds from borrowings and derivatives 585 533
Repayments of borrowings (591) (324)
Finance lease capital payments (4) (4)
Dividends paid to shareholders 8 (238) (222)
Net cash used by financing activities (547) (268)
Net cash (used)/generated (26) 166
Effects of exchange rate changes 18 (77)
Net (decrease)/increase in cash, cash equivalents and bank overdrafts (8) 89
Cash, cash equivalents and bank overdrafts at the beginning of the year 256 167
Cash, cash equivalents and bank overdrafts at the end of the year 248 256
2016 £m
2015 £m
Cash, cash equivalents and bank overdrafts at the end of the year in the Group balance sheet 31 248 257
Bank balances and overdrafts in liabilities held for sale 19 – (1)
Cash, cash equivalents and bank overdrafts at the end of the year 248 256
Year ended 31 July 2016

Wolseley plc Annual Report and Accounts 201678
Notes to the consolidated financial statements
1 – Accounting policies and critical estimates and judgements
Basis of preparationThe consolidated financial statements have been prepared in accordance with International Financial Reporting Standards (“IFRS”) as adopted by the European Union, including interpretations issued by the International Accounting Standards Board (“IASB”) and its committees.
The consolidated financial statements have been prepared under the historical cost convention as modified by the revaluation of financial assets and liabilities held for trading.
The Company is incorporated in Jersey under the Companies (Jersey) Law 1991 and is headquartered in Switzerland.
Accounting developments and changesA summary of the principal accounting policies applied by the Group in the preparation of the consolidated financial statements is set out in note 36(i) on pages 106 to 108.
The following standards have been published, but not yet applied:
• IFRS 9 “Financial Instruments” – applicable from year ending 31 July 2019;
• IFRS 15 “Revenue from Contracts with Customers” – applicable from year ending 31 July 2019; and
• IFRS 16 “Leases” – applicable from year ending 31 July 2020.
The Directors do not expect the adoption of IFRS 9 and IFRS 15 will have a material impact on the financial statements of the Group in future periods.
The adoption of IFRS 16 will have a significant impact on the Group’s balance sheet and reported results because of the value of operating lease commitments the Group has (note 33). The application of IFRS 16 will not reflect any changes in the underlying economics of the business. Beyond the information above, it is not practicable to provide a reasonable estimate of the effect of these standards until a detailed review has been completed. As at the date of this report IFRS 9, IFRS 15 and IFRS 16 have not been endorsed by the EU.
No other issued standard or interpretation would have a material impact on the consolidated financial statements.
Choices permitted by IFRSThe Group has elected to apply hedge accounting to some of its financial instruments.
Accounting policiesNote 36 details the principal accounting policies applied in the preparation of the consolidated financial statements.
Critical accounting estimates and judgements Several of the Group’s accounting policies require management to make estimates and assumptions that affect reported amounts. The following accounting policies all include an element of judgement or estimation.
Valuation of inventoriesInventory comprises finished goods. Provisions are made against slow-moving, obsolete and damaged inventories for which the net realisable value is estimated to be less than the cost. Inventories which are damaged or obsolete are written down as identified. The risk of obsolescence of slow-moving inventory is assessed by comparing the level of inventory held to future sales projected on the basis of historical experience. The actual realisable value of inventory may differ materially from the estimated value on which the provision is based. The Group held provisions in respect of inventory balances at 31 July 2016 amounting to £124 million (2015: £103 million).
The gross value of inventory is reduced to reflect Supplier Rebates where the inventory has not been sold. As at 31 July 2016, this deduction to gross inventory amounted to £214 million (2015: £181 million).
Impairment of assetsThe Group reviews assets that have an indefinite useful life at least annually to assess whether their recoverable amount exceeds their carrying value. The recoverable amount is defined as the higher of fair value less disposal costs and value in use, which in turn is the present value of the future cash flows expected to be generated from the asset. Where carrying value exceeds the recoverable amount a provision for the impairment is established with a charge included in the income statement.
The recoverable amount of goodwill and acquired intangible assets is assessed on the basis of the value in use estimate for the cash generating unit (“CGU”) to which they are attributed. The Group considers that, for the purposes of impairment testing, a CGU is a business unit because independent cash flows cannot be identified below this level. The estimate of value in use, and hence the outcome of the impairment test, is sensitive to the assumptions made for compound average revenue growth rate, long-term growth rate of their market and the discount rate considered appropriate to reflect the time value of money and any risks specific to the CGU that are not reflected in the cash flows. Sensitivity analyses have been performed on all these assumptions. There has been an impairment charge in respect of goodwill and other intangible assets of £94 million in the year ended 31 July 2016 (2015: £238 million) (note 12).
Supplier rebatesIn line with industry practice, the Group has agreements (“Supplier Rebates”) with a number of its suppliers whereby volume-based rebates, marketing support and other discounts are received in connection with the purchase of goods for resale from those suppliers.
Volume-based rebatesVolume-based rebates are recognised based on purchase volumes in accordance with the supplier contract and are calculated by applying a contractually agreed percentage to the gross purchase price of the goods as specified in the supplier’s invoice. An amount due in respect of Supplier Rebates is not recognised within the income statement until all the relevant performance criteria, where applicable, have been met and the goods have been sold to a third party.
The majority of volume-based rebates are determined by reference to guaranteed rates of rebate. These are calculated through a mechanical process with minimal judgement required to determine the amount recorded in the income statement. A small proportion of volume-based rebates are subject to stepped targets where the rebate percentage increases as volumes purchased reach agreed targets within a set period of time. The majority of rebate agreements apply to purchases in a calendar year and therefore, for stepped rebates, judgement is required to estimate the rebate amount recorded in the income statement at the end of the period. The Group assesses the probability that targeted volumes will be achieved in the year based on forecasts which are informed by historical trading patterns, current performance and trends. This judgement is exercised consistently and prudently with historically insignificant true-ups at the end of the period.
Marketing supportMarketing support, which represents a smaller element of the Group’s overall Supplier Rebates, is recognised in the income statement when all performance conditions have been fulfilled.
Cost of salesRebates relating to the purchase of goods for resale are accrued as earned and are recorded initially as a deduction in inventory with a subsequent reduction in cost of sales when the related product is sold.
Supplier rebates receivableJudgement is also required over the recoverability of receivables relating to stepped target rebates. This risk of misstatement of the estimate is mitigated by regular invoicing and timely collection of amounts receivable.
Where supplier rebates are netted off the amounts owing to that supplier, any outstanding amount at the balance sheet date is included within trade payables. Where the Supplier Rebates are not offset against amounts owing to a supplier, the outstanding amount is included within prepayments and accrued income. The carrying value of inventory is reduced by the relevant amount where the inventory has not been sold by the balance sheet date.
Year ended 31 July 2016

Governance Other information
Wolseley plc Annual Report and Accounts 2016 79
Strategic report Financials
1 – Accounting policies and critical estimates and judgements continued
ProvisionsProvisions for self-insured risks, legal claims, environmental restoration and onerous leases are recognised when the Group has a present legal or constructive obligation as a result of past events, it is more likely than not that an outflow of resources will be required to settle the obligation, and the amount can be reliably estimated. Such provisions are measured at the present value of management’s best estimate of the expenditure required to settle the present obligation at the balance sheet date. The discount rate used to determine the present value reflects current market assessments of the time value of money. Provisions are not recognised for future operating losses.
Provisions for self-insured risksThe Group retains layers of certain of its insurable risks, principally US casualty and global property damage, which are managed by a wholly owned captive insurance company, Wolseley Insurance Limited. Certain of the retained risks are subject to an annual actuarial assessment. The provision for self-insured risks represents an estimate, based on historical experience, of the ultimate cost of settling outstanding claims and claims incurred but not reported. The actual cost of settling these liabilities may differ materially from the estimated amounts on which the provision is based. At 31 July 2016, the provision for claims arising from this insurance was £53 million (2015: £41 million).
Provisions for legal, environmental and related exposures and contingent liabilitiesThe Group provides for known and potential legal claims and environmental and other matters, including asbestos-related litigation and product liability claims, where an outflow of resources is considered probable and a reliable estimate can be made of the likely outcome of the dispute or matter. In establishing such provisions the Group takes into account the relevant facts and circumstances of each matter and considers the advice of its legal and other professional advisers. The ultimate liability for potential legal claims and other matters may be dependent upon the discovery of facts that are currently uncertain, the outcome of litigation proceedings and possible settlement negotiations, and the actual cost of settlement may differ materially from the estimated amounts on which the provisions are based.
At 31 July 2016, legal, environmental and other provisions amounted to £140 million (2015: £133 million). Where the Group has insurance cover that it is virtually certain will settle a provision, it recognises an equivalent asset in trade and other receivables.
The Group may also become involved in legal proceedings or commercial disputes in respect of which it is not possible to make a reliable estimate of the financial effect, if any, that will result from ultimate resolution of the proceedings or disputes. In these cases, where material, appropriate disclosure is included in the financial statements but no provision is made where the contingent liability cannot be quantified.
TaxThe Group is subject to income taxes in numerous jurisdictions. Judgement is sometimes required in determining the worldwide provision for income taxes. There may be transactions and calculations for which the ultimate tax determination is uncertain and may be challenged by the tax authorities. The Group recognises liabilities for anticipated or actual tax audit issues based on estimates of whether additional taxes will be due. The principal audits are predominantly in the UK and the USA. Where a tax liability is probable and the Group can make a reliable estimate of the outcome of the dispute, the Group provides for the best estimate of the liability. Where the final outcome of these matters is different from the amounts that were initially recorded, such differences will impact the current and deferred income tax assets and liabilities in the period in which such determination is made. The Group believes it has made adequate provision for the liabilities likely to arise from open audits.
Pensions and other post-retirement benefitsThe Group operates defined benefit pension plans in the United Kingdom and in a number of overseas locations that are accounted for using methods that rely on actuarial assumptions to estimate costs and liabilities for inclusion in the financial statements. These actuarial assumptions include discount rates, expected salary and pension increases, inflation and life expectancy and are disclosed in note 25. The Group takes advice from independent actuaries relating to the appropriateness of the assumptions which include life expectancy of members, expected salary and pension increases and inflation. The defined benefit obligation is calculated annually for each plan by using the Projected Unit Credit Method with actuarial valuations. The Group’s liability recognised on the balance sheet is the present value of the defined benefit obligation at the balance sheet date, less the fair value of the plan assets. The discount rate used is the yield at the valuation date on high quality corporate bonds that have a maturity approximating to the terms of the pension obligations. Remeasurement comprising actuarial gains and losses are recognised immediately in the balance sheet with a charge or credit to the statement of comprehensive income. The net interest amount is calculated by applying the discount rate used to measure the defined benefit net asset or liability at the beginning of the period. The pension plan net interest is presented as finance income or expense.
Whilst the Group believes that the actuarial assumptions are appropriate, any significant changes to those used would affect the balance sheet and income statement. The Group considers that the most sensitive assumptions are the discount rate, inflation and life expectancy.
The table below shows the impact of the sensitivities on the defined benefit plan net liability.
Assumptions at 31 July 2016
Change %
UK£m
Non-UK£m
Discount rate +0.25 68 13
(0.25) (71) (14)
Inflation +0.25 (61) (2)
(0.25) 52 2
Assumptions at 31 July 2015
Change %
UK£m
Non-UK£m
Discount rate +0.25 61 10
(0.25) (65) (11)
Inflation +0.25 (49) (3)
(0.25) 50 3
An increase in life expectancy of one year would increase the defined benefit obligation by £57 million in the UK and by £9 million in non-UK plans (2015: £48 million and £7 million, respectively).

Wolseley plc Annual Report and Accounts 201680
Notes to the consolidated financial statements continued
2 – Segmental analysis
The Group’s reportable segments are the operating businesses overseen by distinct divisional management teams responsible for their performance. All reportable segments derive their revenue from a single business activity, the distribution of plumbing and heating products and building materials.
The Group’s business is not highly seasonal and the Group’s customer base is highly diversified, with no individually significant customer.
Canada and Central Europe represent less than 10 per cent of the Group’s operating profit and do not meet other quantitative thresholds and therefore do not represent a reportable segment. They have been reported on a combined basis and all comparatives have been restated for the purposes of consistency and comparability.
The changes in revenue and trading profit for continuing operations between the years ended 31 July 2015 and 31 July 2016 include changes in exchange rates, disposals, acquisitions and organic change.
Where businesses are disposed in the year, the difference between the revenue and trading profit in the current year up to the date of disposal and the revenue and trading profit in the equivalent portion of the prior year is included in organic change.
Revenue by reportable segment for continuing operations is as follows:
Analysis of change in revenue2015
£mExchange
£mDisposals
£mAcquisitions
£m
Organic change
£m2016
£m
USA 8,343 569 (6) 173 377 9,456
UK 1,987 – – 53 (44) 1,996
Nordic 1,864 3 (1) 5 10 1,881
Canada and Central Europe 1,138 (20) (25) 14 (10) 1,097
Group 13,332 552 (32) 245 333 14,430
Trading profit/(loss) (note 9) by reportable segment for continuing operations is as follows:
Analysis of change in trading profit/(loss) (note 9)2015
£mExchange
£mDisposals
£mAcquisitions
£m
Organic change
£m2016
£m
USA 681 47 2 3 42 775
UK 90 – – 1 (17) 74
Nordic 71 – – – (12) 59
Canada and Central Europe 55 (1) – 2 (3) 53
Central and other costs (43) – – – (2) (45)
Group 854 46 2 6 8 916
The reconciliation between trading profit/(loss) (note 9) and operating profit/(loss) by reportable segment for continuing operations is as follows:
2016 2015
Trading profit/(loss)
£m
Exceptional items
£m
Amortisation and
impairment of acquired
intangible assets
£m
Operating profit/(loss)
£m
Trading profit/(loss)
£m
Exceptional items
£m
Amortisation and
impairment of acquired
intangible assets
£m
Operating profit/(loss)
£m
USA 775 2 (34) 743 681 6 (27) 660
UK 74 (9) (106) (41) 90 2 (13) 79
Nordic 59 2 (5) 56 71 (2) (249) (180)
Canada and Central Europe 53 – (2) 51 55 (9) (5) 41
Central and other costs (45) 3 – (42) (43) (1) – (44)
Group 916 (2) (147) 767 854 (4) (294) 556
Finance income – 1
Finance costs (40) (49)
Profit before tax 727 508

Governance Other information
Wolseley plc Annual Report and Accounts 2016 81
Strategic report Financials
2 – Segmental analysis continued
In 2015 and 2016, a number of Group businesses or groups of branches have been disposed of, closed or are classified as held for sale. The revenue and trading profit of the Group’s segments excluding those businesses and branches (“ongoing segments”) are analysed in the following table. This is non-GAAP information.
RevenueTrading
profit
2016 £m
2015 £m
2016 £m
2015 £m
Ongoing segments
USA 9,456 8,337 775 683
UK 1,996 1,987 74 90
Nordic 1,881 1,863 60 72
Canada and Central Europe 1,097 1,113 53 55
Central and other costs – – (45) (43)
Total ongoing segments 14,430 13,300 917 857
Entities disposed of, closed or classified as held for sale – 32 (1) (3)
Continuing operations 14,430 13,332 916 854
Other information on assets and liabilities by segment is set out in the tables below:
2016 2015
Segment assets and liabilities
Segment assets
£m
Segment liabilities
£m
Segment net assets/(liabilities)
£m
Segment assets
£m
Segment liabilities
£m
Segment net assets/
(liabilities) £m
USA 4,268 (1,645) 2,623 3,451 (1,345) 2,106
UK 856 (508) 348 1,046 (510) 536
Nordic 1,243 (620) 623 1,032 (520) 512
Canada and Central Europe 599 (265) 334 478 (195) 283
Central and other costs 18 (103) (85) 19 (86) (67)
Discontinued 69 (36) 33 198 (164) 34
Total 7,053 (3,177) 3,876 6,224 (2,820) 3,404
Tax assets and liabilities 127 (166) (39) 119 (111) 8
Net cash/(debt) 971 (1,907) (936) 1,139 (1,944) (805)
Group assets/(liabilities) 8,151 (5,250) 2,901 7,482 (4,875) 2,607
2016 2015
Additions to goodwill
£m
Additions to other
acquired intangible
assets £m
Additions to non-acquired
intangible assets
£m
Additions to property, plant and
equipment £m
Additions to goodwill
£m
Additions to other
acquired intangible
assets £m
Additions to non-acquired
intangible assets
£m
Additions to property, plant and
equipment £m
USA 34 25 17 123 24 28 12 125
UK – – 5 15 29 14 6 24
Nordic – – 6 33 – 1 3 33
Canada and Central Europe 6 3 2 18 4 2 3 8
Central and other costs – – 1 1 – – 2 1
Discontinued – – – – – – – 16
Group 40 28 31 190 57 45 26 207
Wolseley plc Annual Report and Accounts 201682
Notes to the consolidated financial statements continued
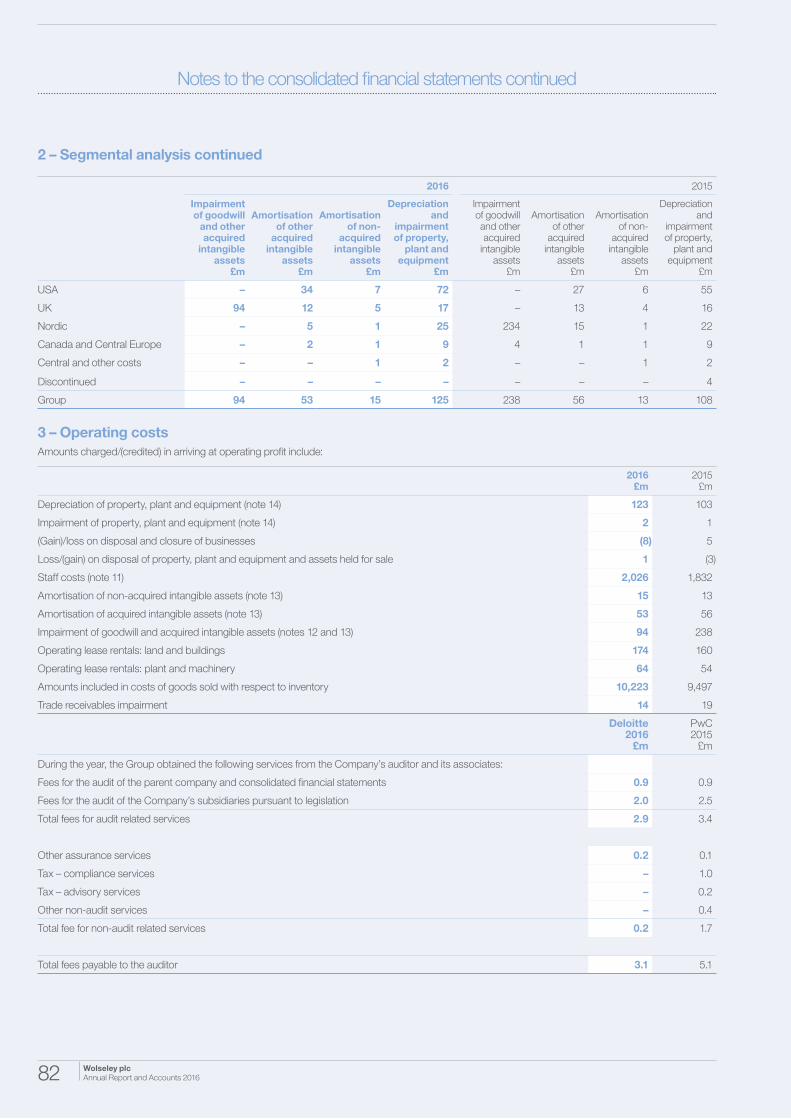
2 – Segmental analysis continued
2016 2015
Impairment of goodwill
and other acquired
intangible assets
£m
Amortisation of other
acquired intangible
assets £m
Amortisation of non-
acquired intangible
assets £m
Depreciation and
impairment of property,
plant and equipment
£m
Impairment of goodwill and other acquired
intangible assets
£m
Amortisation of other
acquired intangible
assets £m
Amortisation of non-
acquired intangible
assets £m
Depreciation and
impairment of property,
plant and equipment
£m
USA – 34 7 72 – 27 6 55
UK 94 12 5 17 – 13 4 16
Nordic – 5 1 25 234 15 1 22
Canada and Central Europe – 2 1 9 4 1 1 9
Central and other costs – – 1 2 – – 1 2
Discontinued – – – – – – – 4
Group 94 53 15 125 238 56 13 108
3 – Operating costs
Amounts charged/(credited) in arriving at operating profit include:
2016 £m
2015 £m
Depreciation of property, plant and equipment (note 14) 123 103
Impairment of property, plant and equipment (note 14) 2 1
(Gain)/loss on disposal and closure of businesses (8) 5
Loss/(gain) on disposal of property, plant and equipment and assets held for sale 1 (3)
Staff costs (note 11) 2,026 1,832
Amortisation of non-acquired intangible assets (note 13) 15 13
Amortisation of acquired intangible assets (note 13) 53 56
Impairment of goodwill and acquired intangible assets (notes 12 and 13) 94 238
Operating lease rentals: land and buildings 174 160
Operating lease rentals: plant and machinery 64 54
Amounts included in costs of goods sold with respect to inventory 10,223 9,497
Trade receivables impairment 14 19
Deloitte2016
£m
PwC2015
£m
During the year, the Group obtained the following services from the Company’s auditor and its associates:
Fees for the audit of the parent company and consolidated financial statements 0.9 0.9
Fees for the audit of the Company’s subsidiaries pursuant to legislation 2.0 2.5
Total fees for audit related services 2.9 3.4
Other assurance services 0.2 0.1
Tax – compliance services – 1.0
Tax – advisory services – 0.2
Other non-audit services – 0.4
Total fee for non-audit related services 0.2 1.7
Total fees payable to the auditor 3.1 5.1

Governance Other information
Wolseley plc Annual Report and Accounts 2016 83
Strategic report Financials
4 – Exceptional items
Exceptional items are those which are considered significant by virtue of their nature, size or incidence, and are presented separately in the income statement to enable a full understanding of the Group’s financial performance. If provisions have been made for exceptional items in previous years, then any reversal of those provisions is shown as exceptional.
Exceptional items included in operating profit from continuing operations are analysed by purpose as follows:
2016 £m
2015 £m
Gain/(loss) on disposal and closure of businesses 8 (5)
Other exceptional items (10) 1
Total included in operating profit (2) (4)
For the year ended 31 July 2016, the gain on disposal principally relates to the release of provisions from prior year disposals in the USA, UK and Central Europe. Other exceptional items in the year represent restructuring costs incurred in the UK during phase 1 of the UK turnaround strategy. In September 2016, phase 2 of the strategy for the UK was approved and this is expected to reduce the number of operational locations and employees by at least 10 per cent and will continue into the next financial year.
The net cash outflow from exceptional items was £3 million (2015: £1 million).
Exceptional items relating to discontinued operations are detailed in note 7 and exceptional items relating to finance costs are detailed in note 5.
5 – Finance costs
2016 £m
2015 £m
Interest payable
– Bank loans and overdrafts 48 39
– Unwind of fair value adjustment to senior unsecured loan notes (9) (12)
– Finance lease charges 2 2
Net interest income on defined benefit obligation (note 25) – (2)
Valuation gains on financial instruments
– Derivatives held at fair value through profit and loss (1) –
40 27
Exceptional finance expense – 22
Total finance costs 40 49
The £22 million exceptional finance expense in 2015 relates to the recycling of deferred foreign exchange translation losses in accordance with IAS 21 “The Effects of Changes in Foreign Exchange Rates”, following the liquidation of a number of dormant financing companies. Finance income from discontinued operations is detailed in note 7.
6 – Tax
The tax charge for the year comprises:2016
£m2015
£m
Current year tax charge 234 215
Adjustments to tax charge in respect of prior years (7) (8)
Total current tax charge 227 207
Deferred tax charge/(credit): origination and reversal of temporary differences 4 (20)
Total tax charge 231 187
An exceptional tax credit of £1 million was recorded in relation to exceptional items in 2016 (2015: charge £3 million). The deferred tax charge of £4 million (2015: credit £20 million) includes a charge of £5 million (2015: credit £2 million) resulting from changes in tax rates.
Tax on items credited/(charged) to the statement of other comprehensive income:2016
£m2015
£m
Deferred tax credit on actuarial loss on retirement benefits 25 14
Current tax credit on actuarial loss on retirement benefits – 1
Deferred tax charge on losses (7) –
Total tax on items credited to other comprehensive income 18 15
£1 million (2015: £nil) of the £18 million credit relates to changes in tax rates.

Wolseley plc Annual Report and Accounts 201684
Notes to the consolidated financial statements continued
6 – Tax continued
Tax on items credited/(charged) to equity:2016
£m2015
£m
Current tax credit on share-based payments 6 8
Deferred tax (charge)/credit on share-based payments (6) 2
Total tax on items credited to equity – 10
2016 2015
Tax reconciliation: £m % £m %
Weighted average tax rate 243 33 143 28
Prior year amounts (7) (1) 2 1
Non-taxable amortisation, impairment and exceptional items 19 2 31 6
Tax rate change 5 1 (2) (1)
Other non-deductible and non-taxable items (29) (3) 13 3
Total tax charge/tax rate on profit before tax 231 32 187 37
The 5 per cent increase in the weighted average tax rate is primarily due to the increase in the share of profit generated in the USA.
7 – Discontinued operations
As at 31 July 2015, the Group’s remaining business and property assets in France (“the disposal group”) were classified as discontinued in accordance with IFRS 5 “Non-current Assets Held for Sale and Discontinued Operations”. On 7 March 2016, the remaining French building materials business was sold. The Group is in the process of selling its remaining property assets in France. The results from discontinued operations, which have been included in the Group income statement, are set out below.
2016 2015
Before exceptional
items £m
Exceptional items
£mTotal
£m
Before exceptional
items £m
Exceptional items
£mTotal
£m
Revenue 255 – 255 587 – 587
Cost of sales (179) – (179) (411) – (411)
Gross profit 76 – 76 176 – 176
Operating costs:
gain/(loss) on disposal of businesses – 139 139 – (59) (59)
impairment of net assets – – – – (67) (67)
other (76) 14 (62) (178) 3 (175)
Operating costs (76) 153 77 (178) (123) (301)
Operating profit/(loss) – 153 153 (2) (123) (125)
Finance income 2 4 6 1 16 17
Profit/(loss) before tax 2 157 159 (1) (107) (108)
Attributable tax expense – (5) (5) – – –
Profit/(loss) from discontinued operations 2 152 154 (1) (107) (108)
Basic earnings/(loss) per share 0.8p 60.0p 60.8p (0.4p) (41.3p) (41.7p)
Diluted earnings/(loss) per share 0.8p 59.6p 60.4p (0.4p) (41.1p) (41.5p)
A tax charge of £5 million (2015: £nil) was generated from discontinued operations in the current year. During the year, discontinued operations used cash of £16 million (2015: generated £17 million) in respect of operating activities, generated £41 million (2015: £22 million) in respect of investing activities and generated £27 million (2015: £15 million) in respect of financing activities.
Governance Other information
Wolseley plc Annual Report and Accounts 2016 85
Strategic report Financials
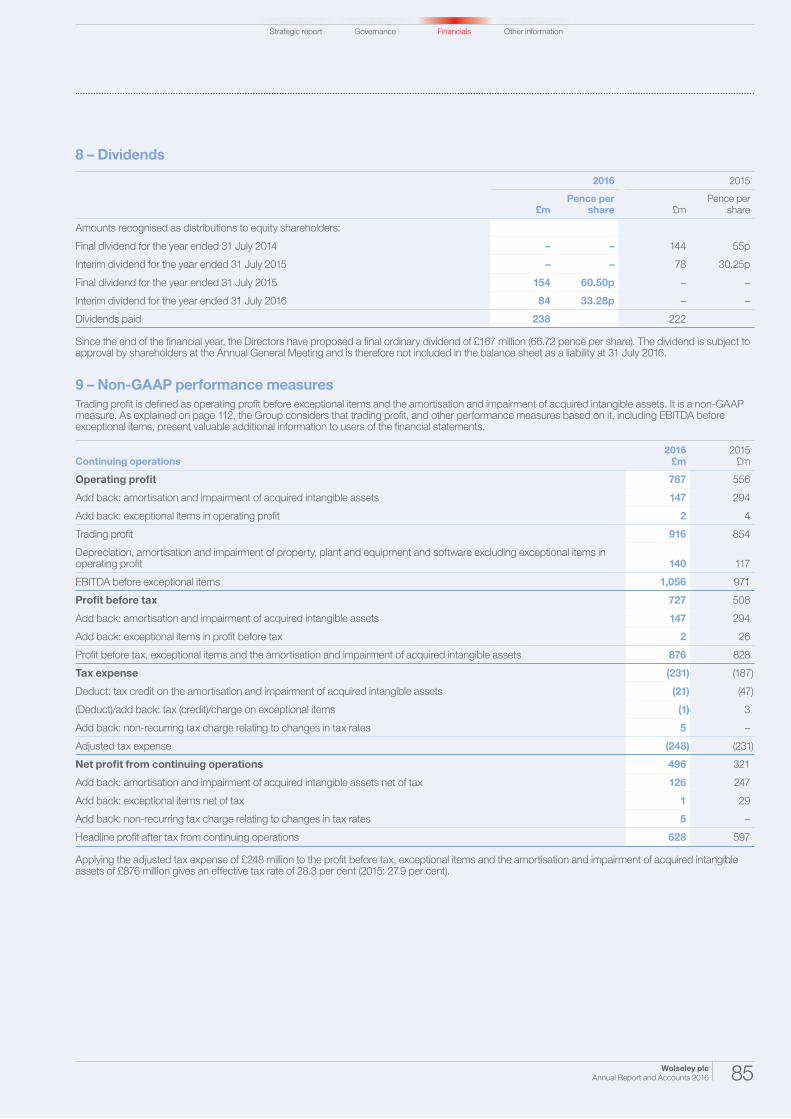
8 – Dividends
2016 2015
£mPence per
share £mPence per
share
Amounts recognised as distributions to equity shareholders:
Final dividend for the year ended 31 July 2014 – – 144 55p
Interim dividend for the year ended 31 July 2015 – – 78 30.25p
Final dividend for the year ended 31 July 2015 154 60.50p – –
Interim dividend for the year ended 31 July 2016 84 33.28p – –
Dividends paid 238 222
Since the end of the financial year, the Directors have proposed a final ordinary dividend of £167 million (66.72 pence per share). The dividend is subject to approval by shareholders at the Annual General Meeting and is therefore not included in the balance sheet as a liability at 31 July 2016.
9 – Non-GAAP performance measures
Trading profit is defined as operating profit before exceptional items and the amortisation and impairment of acquired intangible assets. It is a non-GAAP measure. As explained on page 112, the Group considers that trading profit, and other performance measures based on it, including EBITDA before exceptional items, present valuable additional information to users of the financial statements.
Continuing operations2016
£m2015
£m
Operating profit 767 556
Add back: amortisation and impairment of acquired intangible assets 147 294
Add back: exceptional items in operating profit 2 4
Trading profit 916 854
Depreciation, amortisation and impairment of property, plant and equipment and software excluding exceptional items in operating profit 140 117
EBITDA before exceptional items 1,056 971
Profit before tax 727 508
Add back: amortisation and impairment of acquired intangible assets 147 294
Add back: exceptional items in profit before tax 2 26
Profit before tax, exceptional items and the amortisation and impairment of acquired intangible assets 876 828
Tax expense (231) (187)
Deduct: tax credit on the amortisation and impairment of acquired intangible assets (21) (47)
(Deduct)/add back: tax (credit)/charge on exceptional items (1) 3
Add back: non-recurring tax charge relating to changes in tax rates 5 –
Adjusted tax expense (248) (231)
Net profit from continuing operations 496 321
Add back: amortisation and impairment of acquired intangible assets net of tax 126 247
Add back: exceptional items net of tax 1 29
Add back: non-recurring tax charge relating to changes in tax rates 5 –
Headline profit after tax from continuing operations 628 597
Applying the adjusted tax expense of £248 million to the profit before tax, exceptional items and the amortisation and impairment of acquired intangible assets of £876 million gives an effective tax rate of 28.3 per cent (2015: 27.9 per cent).

Wolseley plc Annual Report and Accounts 201686
Notes to the consolidated financial statements continued
10 – Earnings per share
2016 2015
Earnings £m
Basic earnings
per share pence
Diluted earnings
per share pence
Earnings £m
Basic earnings
per share pence
Diluted earnings
per share pence
Headline profit after tax from continuing operations 628 247.7 246.2 597 230.2 229.4
Exceptional items (net of tax) (1) (0.4) (0.4) (29) (11.2) (11.1)
Amortisation and impairment of acquired intangible assets (net of tax) (126) (49.7) (49.4) (247) (95.2) (94.9)
Non-recurring tax charge relating to changes in tax rates (5) (2.0) (2.0) – – –
Profit from continuing operations 496 195.6 194.4 321 123.8 123.4
Profit/(loss) from discontinued operations 154 60.8 60.4 (108) (41.7) (41.5)
Profit from continuing and discontinued operations 650 256.4 254.8 213 82.1 81.9
The weighted average number of ordinary shares in issue during the year, excluding those held by Employee Benefit Trusts and those held by the Company as Treasury shares, was 253.5 million (2015: 259.3 million). The impact of all potentially dilutive share options on earnings per share would be to increase the weighted average number of shares in issue to 255.1 million (2015: 260.2 million).
11 – Employee information and Directors’ remuneration
2016 £m
2015 £m
Wages and salaries 1,804 1,630
Social security costs 132 116
Pension costs – defined contribution plans 65 59
Pension costs – defined benefit plans (note 25) 5 7
Share-based payments (note 27) 20 20
Total staff costs 2,026 1,832
Further details of Directors’ remuneration and share options are set out in the Remuneration Report on pages 58 to 72, which form part of these financial statements. The aggregate emoluments for all key management are set out in note 32.
The total staff cost including discontinued operations was £2,071 million (2015: £1,934 million).
Average number of employees 2016 2015
USA 22,468 21,239
UK 6,208 6,081
Nordic 5,906 6,021
Canada and Central Europe 3,489 3,605
Central and other 104 108
Group 38,175 37,054
The average number of employees including discontinued operations was 39,717 (2015: 40,375).

Governance Other information
Wolseley plc Annual Report and Accounts 2016 87
Strategic report Financials
12 – Intangible assets – goodwill
2016 £m
2015 £m
Cost
At 1 August 1,404 1,663
Exchange rate adjustment 266 (76)
Acquisitions 40 57
Adjustment to fair value on prior year acquisitions 1 (16)
Disposal of businesses – (43)
Reclassification as held for sale – (181)
At 31 July 1,711 1,404
Accumulated impairment losses
At 1 August 588 751
Exchange rate adjustment 135 (85)
Impairment charge for the year 86 138
Disposal of businesses – (35)
Reclassification as held for sale – (181)
At 31 July 809 588
Net book amount at 31 July 902 816
Goodwill and intangible assets acquired during the year have been allocated to the individual cash generating units or aggregated cash generating units (together “CGUs”) which are deemed to be the smallest identifiable group of assets generating independent cash inflows. CGUs have been aggregated in the disclosure below at a segmental level except for certain CGUs in the USA which are considered to be significant (more than 10 per cent of the current year goodwill balance). Impairment reviews were performed for each individual CGU during the year ended 31 July 2016.
2016 2015
Long-term growth rate
%
Post-tax discount rate
%
Pre-tax discount rate
%Goodwill
£m
Long-term growth rate
%
Post-tax discount rate
%
Pre-tax discount rate
%Goodwill
£m
Blended Branches 314 264
B2C 89 62
Waterworks 127 105
Rest of USA 113 81
USA 2.2 8.2 13.4 643 2.0 9.1 14.9 512
UK 2.0 8.2 10.2 32 2.0 8.8 11.0 118
Nordic 2.2 7.5 9.7 91 1.1 7.2 9.3 77
Canada 2.0 8.0 10.8 88 2.0 8.7 11.8 68
Central Europe 1.0 6.6 8.4 48 1.0 7.2 9.1 41
Total 902 816
The relevant inputs to the value in use calculations of each CGU were:
Cash flow forecasts for years one to three are derived from the most recent Board approved strategic plan. The forecast for year five represents an estimate of “mid-cycle” trading performance for the CGU based on historic analysis. Year four is calculated as the average of the final year of the strategic plan and year five’s mid-cycle estimate. The other inputs include a risk-adjusted, pre-tax discount rate, calculated by reference to the weighted average cost of capital (“WACC”) of each country and the 30-year long-term growth rate by country, as published by the IMF in April 2016.
The strategic plan is developed based on analyses of sales, markets and costs at a regional level. Consideration is given to past events, knowledge of future contracts and the wider economy. It takes into account both current business and future initiatives.
Management has performed a sensitivity analysis across all CGUs which have goodwill and acquired intangible assets using the following key impairment review assumptions: compound average revenue growth rate, post-tax discount rate and long-term growth rate, keeping all other assumptions constant.
UKThe impairment review for the UK has resulted in an impairment charge in the year of £94 million. In allocating the impairment charge we have considered the impairment of all assets as well as goodwill. An impairment trigger arose for the UK businesses due to the continuing challenging market conditions and uncertainty over performance. Expectations of future profitability for the UK businesses were therefore significantly reduced, resulting in impairment charges for Plumb, Parts & Drain, Pipe & Climate, Infrastructure and Soak.com. The Soak.com business was acquired in February 2015 and has incurred losses despite generating good revenue growth. We do expect the business to generate future profits and it remains an important part of the Group’s European B2C strategy but due to the uncertainty of the timing of profitability an impairment charge has been made against the carrying value of its goodwill.

Wolseley plc Annual Report and Accounts 201688
Notes to the consolidated financial statements continued
12 – Intangible assets – goodwill continued
The UK impairment charge has been incurred as follows:
CGUGoodwill
£m
Acquired intangible
assets£m
Total£m
Impairment£m
Remaining balance
£m
Post-tax discount
rate%
Pre-tax discount
rate%
Plumb, Parts & Drain 7 – 7 (7) – 8.2 10.2
Pipe & Climate 26 – 26 (26) – 8.2 10.2
Infrastructure 29 8 37 (37) – 8.2 10.2
Soak.com 24 – 24 (24) – 8.2 10.2
Total 86 8 94 (94) – 8.2 10.2
13 – Intangible assets – other
Acquired intangible assets
Software £m
Trade names and brands
£m
Customer relationships
£mOther
£mTotal
£m
Cost
At 1 August 2014 109 289 464 51 913
Exchange rate adjustment (1) (28) (11) 3 (37)
Acquisitions – 3 36 6 45
Adjustment to fair value on prior year acquisitions – – 12 1 13
Additions 26 – – – 26
Disposal of businesses (2) – (9) – (11)
Disposals and transfers (4) – (3) – (7)
Reclassification as held for sale (3) – (8) – (11)
At 31 July 2015 125 264 481 61 931
Exchange rate adjustment 15 51 86 11 163
Acquisitions – 7 16 5 28
Additions 31 – – – 31
Disposals and transfers (19) – (2) – (21)
At 31 July 2016 152 322 581 77 1,132
Accumulated amortisation and impairment losses
At 1 August 2014 76 162 358 31 627
Exchange rate adjustment (2) (22) (13) 2 (35)
Amortisation charge for the year 13 13 39 4 69
Impairment charge for the year (note 12) – 81 19 – 100
Disposal of businesses (1) – (9) – (10)
Disposals and transfers (2) – (3) – (5)
Reclassification as held for sale (2) – (8) – (10)
At 31 July 2015 82 234 383 37 736
Exchange rate adjustment 10 45 72 7 134
Amortisation charge for the year 15 8 40 5 68
Impairment charge for the year (note 12) – 2 6 – 8
Disposals and transfers (14) – (2) – (16)
At 31 July 2016 93 289 499 49 930
Net book amount at 31 July 2016 59 33 82 28 202
Net book amount at 31 July 2015 43 30 98 24 195

Governance Other information
Wolseley plc Annual Report and Accounts 2016 89
Strategic report Financials
14 – Property, plant and equipment
Land and buildingsPlant
machinery and
equipment £m
Total £m
Freehold £m
Finance lease
£m
Operating leasehold
improvements £m
Cost
At 1 August 2014 1,180 51 273 707 2,211
Exchange rate adjustment (61) – 12 6 (43)
Acquisitions 6 – – 3 9
Adjustment to fair value on prior year acquisitions 3 – – – 3
Additions 72 – 37 98 207
Disposal of businesses (25) (2) (3) (46) (76)
Disposals and transfers 16 (18) (24) (53) (79)
Reclassification as held for sale (115) (3) (17) (78) (213)
At 31 July 2015 1,076 28 278 637 2,019
Exchange rate adjustment 193 4 43 91 331
Acquisitions 9 – – 2 11
Additions 85 1 12 92 190
Disposals and transfers (1) (1) (7) (39) (48)
Reclassification as held for sale (3) – – – (3)
At 31 July 2016 1,359 32 326 783 2,500
Accumulated depreciation
At 1 August 2014 255 12 177 541 985
Exchange rate adjustment (9) – 7 5 3
Depreciation charge for the year 28 1 17 61 107
Impairment charge for the year 1 – – – 1
Disposal of businesses (13) – (1) (34) (48)
Disposals and transfers (1) (5) (4) (57) (67)
Reclassification as held for sale (42) (1) (14) (69) (126)
At 31 July 2015 219 7 182 447 855
Exchange rate adjustment 42 – 28 63 133
Depreciation charge for the year 30 1 20 72 123
Impairment charge for the year 2 – – – 2
Disposals and transfers – – (7) (39) (46)
Reclassification as held for sale (1) – – – (1)
At 31 July 2016 292 8 223 543 1,066
Owned assets 1,067 – 103 232 1,402
Assets under finance leases – 24 – 8 32
Net book amount – 31 July 2016 1,067 24 103 240 1,434
Owned assets 857 – 96 182 1,135
Assets under finance leases – 21 – 8 29
Net book amount – 31 July 2015 857 21 96 190 1,164
At 31 July 2016, the book value of property, plant and equipment that had been pledged as security for liabilities was £591 million (2015: £491 million).
The depreciation charge for the year includes £nil (2015: £4 million) relating to discontinued operations.

Wolseley plc Annual Report and Accounts 201690
Notes to the consolidated financial statements continued
15 – Deferred tax assets and liabilities
The deferred tax assets and liabilities shown in the balance sheet are analysed as follows:
Deferred tax2016
£m2015
£m
Deferred tax assets 127 115
Deferred tax liabilities (65) (53)
62 62
The following are the major deferred tax assets and liabilities recognised by the Group and movements thereon during the current and prior reporting year:
Goodwill and intangible
assets £m
Share-based payments
£m
Property, plant and
equipment £m
Retirement benefit
obligations £m
Inventory £m
Tax losses £m
Other £m
Total £m
At 1 August 2014 (74) 18 3 30 (74) 97 26 26
Credit/(charge) to income 35 (1) 4 3 5 (27) 1 20
Credit to other comprehensive income – – – 14 – – – 14
Credit to equity – 2 – – – – – 2
Acquisitions (8) – – – – – 1 (7)
Transfers between categories – – – (4) – (11) 15 –
Exchange rate adjustment – 2 9 2 (6) (1) 1 7
At 31 July 2015 (47) 21 16 45 (75) 58 44 62
Credit/(charge) to income 5 – (13) 2 9 (2) (5) (4)
Credit/(charge) to other comprehensive income – – – 25 – (7) – 18
Charge to equity – (6) – – – – – (6)
Acquisitions (2) – – – – – – (2)
Exchange rate adjustment (8) 3 (10) 12 (12) 2 7 (6)
At 31 July 2016 (52) 18 (7) 84 (78) 51 46 62
Legislation has been enacted in the UK to reduce the standard rate of UK corporation tax from 20 per cent to 19 per cent with effect from 1 April 2017 and to 18 per cent with effect from 1 April 2020. Accordingly the UK deferred tax assets and liabilities have predominantly been calculated based on a 19 per cent tax rate which materially reflects the rate for the period in which the deferred tax assets and liabilities are expected to reverse.
A further change to the UK corporation tax rate was announced in the Chancellor’s Budget on 16 March 2016 to reduce the standard rate to 17 per cent from 1 April 2020. As this change had not been substantively enacted at the balance sheet date its effects are not included in these financial statements. The overall effect of this further rate change, if it had applied to the UK deferred tax balances at the balance sheet date, would be to reduce the deferred tax assets balance by £3 million and to increase the tax expense by the same amount.
Deferred tax assets in the UK have been recognised on the basis that the UK is forecast to have sufficient taxable profits in the future to enable these to be utilised.
There are other potential deferred tax assets in relation to tax losses totalling £68 million (2015: £77 million) that have not been recognised on the basis that their future economic benefit is uncertain. The losses are in the UK relating to capital disposals and France relating to asset impairments that have not been recognised on the basis that France is not forecasting to have sufficient taxable profits in the future to utilise them.
No deferred tax liability has been recognised in respect of temporary differences associated with investments in subsidiaries. However, tax may arise on £253 million (2015: £200 million) of temporary differences but the Group is in a position to control the timing of their reversal and it is probable that such differences will not reverse in the foreseeable future.
Governance Other information
Wolseley plc Annual Report and Accounts 2016 91
Strategic report Financials
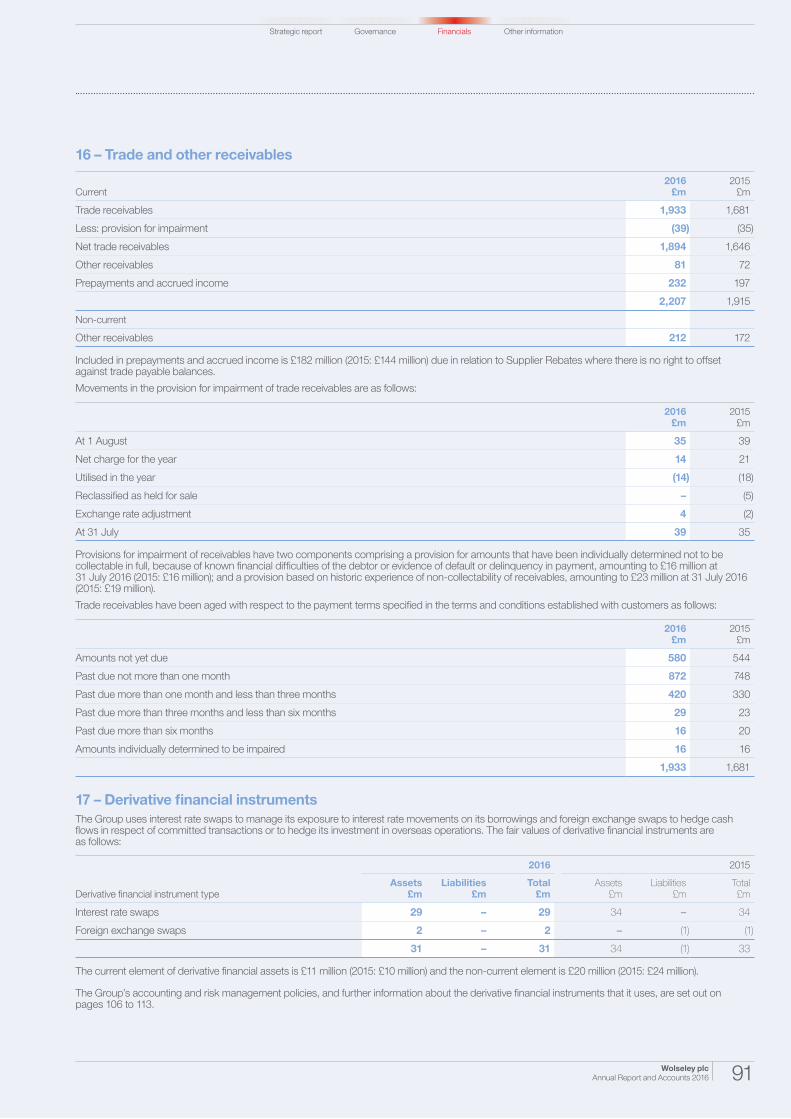
16 – Trade and other receivables
Current2016
£m2015
£m
Trade receivables 1,933 1,681
Less: provision for impairment (39) (35)
Net trade receivables 1,894 1,646
Other receivables 81 72
Prepayments and accrued income 232 197
2,207 1,915
Non-current
Other receivables 212 172
Included in prepayments and accrued income is £182 million (2015: £144 million) due in relation to Supplier Rebates where there is no right to offset against trade payable balances.
Movements in the provision for impairment of trade receivables are as follows:
2016 £m
2015 £m
At 1 August 35 39
Net charge for the year 14 21
Utilised in the year (14) (18)
Reclassified as held for sale – (5)
Exchange rate adjustment 4 (2)
At 31 July 39 35
Provisions for impairment of receivables have two components comprising a provision for amounts that have been individually determined not to be collectable in full, because of known financial difficulties of the debtor or evidence of default or delinquency in payment, amounting to £16 million at 31 July 2016 (2015: £16 million); and a provision based on historic experience of non-collectability of receivables, amounting to £23 million at 31 July 2016 (2015: £19 million).
Trade receivables have been aged with respect to the payment terms specified in the terms and conditions established with customers as follows:
2016 £m
2015 £m
Amounts not yet due 580 544
Past due not more than one month 872 748
Past due more than one month and less than three months 420 330
Past due more than three months and less than six months 29 23
Past due more than six months 16 20
Amounts individually determined to be impaired 16 16
1,933 1,681
17 – Derivative financial instruments
The Group uses interest rate swaps to manage its exposure to interest rate movements on its borrowings and foreign exchange swaps to hedge cash flows in respect of committed transactions or to hedge its investment in overseas operations. The fair values of derivative financial instruments are as follows:
Derivative financial instrument type
2016 2015
Assets£m
Liabilities£m
Total£m
Assets£m
Liabilities£m
Total£m
Interest rate swaps 29 – 29 34 – 34
Foreign exchange swaps 2 – 2 – (1) (1)
31 – 31 34 (1) 33
The current element of derivative financial assets is £11 million (2015: £10 million) and the non-current element is £20 million (2015: £24 million).
The Group’s accounting and risk management policies, and further information about the derivative financial instruments that it uses, are set out on pages 106 to 113.

Wolseley plc Annual Report and Accounts 201692
Notes to the consolidated financial statements continued
18 – Cash and cash equivalents
2016 £m
2015 £m
Cash and cash equivalents 940 1,105
Included in the balance at 31 July 2016 is an amount of £606 million (2015: £786 million) which is part of the Group’s cash pooling arrangements where there is an equal and opposite balance included within bank overdrafts (note 21). These amounts are subject to a master netting arrangement.
At 31 July 2016, cash and cash equivalents included £60 million which is used to collateralise letters of credit on behalf of Wolseley Insurance Limited.
Restricted cash held by the Group at the balance sheet date amounted to £3 million (2015: £7 million) and is recorded in other receivables.
19 – Assets and liabilities held for sale
2016 £m
2015 £m
Properties awaiting disposal 10 28
Assets of disposal groups held for sale 46 173
Assets held for sale 56 201
Liabilities of disposal groups held for sale 12 136
During the previous year, the Group announced its decision to sell its remaining businesses in France. As at 31 July 2016, the sales process for the remaining French property assets was continuing and accordingly these properties are classified as held for sale.
The assets and liabilities of disposal groups held for sale consist of:
2016 £m
2015 £m
Property, plant and equipment 42 54
Inventories – 16
Trade and other receivables 4 93
Tax receivables – 10
Bank balances and overdrafts – (1)
Finance leases – (12)
Trade and other payables (7) (105)
Provisions and retirement benefit obligations (1) (14)
Tax payables (4) (4)
34 37
20 – Trade and other payables
Current2016
£m2015
£m
Trade payables 2,121 1,829
Tax and social security 88 85
Other payables 71 67
Accruals 346 293
Deferred income 8 7
Total trade and other payables 2,634 2,281
Non-current2016
£m2015
£m
Other payables 163 125
Trade payables are stated net of £15 million (2015: £23 million) due from suppliers with respect to Supplier Rebates where an agreement exists that allows these to be net settled.

Governance Other information
Wolseley plc Annual Report and Accounts 2016 93
Strategic report Financials
21 – Bank loans and overdrafts
2016 2015
Current£m
Non-current£m
Total£m
Current£m
Non-current £m
Total£m
Bank overdrafts 692 – 692 848 – 848
Bank loans 1 224 225 – 613 613
Senior unsecured loan notes 8 951 959 153 300 453
Total bank loans and overdrafts 701 1,175 1,876 1,001 913 1,914
Included in bank overdrafts at 31 July 2016 is an amount of £606 million (2015: £786 million) which is part of the Group’s cash pooling arrangements where there is an equal and opposite balance included within cash and cash equivalents (note 18).
£130 million of bank loans are secured against the Group’s freehold property (2015: £109 million). No bank loans were secured against trade receivables at 31 July 2016 (2015: £384 million) as the trade receivables facility of £454 million was undrawn as at 31 July 2016.
Non-current loans are repayable as follows:
2016 £m
2015 £m
Due in one to two years 124 8
Due in two to three years 4 489
Due in three to four years 4 4
Due in four to five years 215 4
Due in over five years 828 408
Total 1,175 913
The carrying value of the senior unsecured loan notes of £959 million comprises a par value of £936 million and a fair value adjustment of £23 million (2015: £453 million, £425 million and £28 million respectively). The fair value adjustment arose before 30 November 2011 when the loan notes were hedged by a series of interest rate swaps. From 30 November 2011, the hedge relationship was de-designated and the fair value adjustment is being released to the income statement on an amortised cost basis and the fair value hedge is based on a recalculated effective interest rate at the date when hedge accounting was discontinued. The adjustment will be fully amortised at the point the unsecured loan notes mature.
There have been no significant changes during the year to the Group’s policies on accounting for, valuing and managing the risk of financial instruments. These policies are summarised on pages 106 to 113.
22 – Financial instruments and financial risk management
Capital structureTo assess the appropriateness of its capital structure based on current and forecast trading, the Group’s principal measure of financial gearing is the ratio of net debt to EBITDA before exceptional items. The Group aims to operate with investment grade credit metrics and ensure this ratio remains within 1 to 2 times. The Group’s main borrowing facilities contain a financial covenant limiting the ratio of net debt to EBITDA before exceptional items to 3.5:1. The reconciliation of opening to closing net debt is detailed in note 31.
In order to maintain or adjust the capital structure, the Group may return capital to shareholders, repurchase its own shares, issue new shares or sell assets to reduce debt.
LiquidityDuring the year ended 31 July 2016, the Group’s £800 million revolving credit facility has been extended by one year and matures in September 2021. As at 31 July 2016, £95 million was drawn under the £800 million facility and the US$600 million trade receivables facility was undrawn. The Group’s undrawn facilities are as follows:
2016 £m
2015 £m
Less than one year – –
Between one and two years – –
Between two and three years 454 –
Between three and four years – –
Between four and five years – –
Greater than five years 705 680
Total 1,159 680
On 1 September 2015 the Group issued US$800 million of US Private Placement bonds at an average fixed interest rate of 3.7 per cent in three tranches: US$250 million expiring in September 2022, US$400 million expiring in September 2025 and US$150 million expiring in September 2027. As at 31 July 2016 exchange rates, these bonds translate to £605 million comprising of £189 million, £303 million and £113 million tranches, respectively.

Wolseley plc Annual Report and Accounts 201694
Notes to the consolidated financial statements continued
22 – Financial instruments and financial risk management continued
Foreign currencyNet debt by currency was as follows:
As at 31 July 2016
Interest rate swaps
£m
Finance lease
obligations £m
Cash, overdrafts and bank
loans £m
Currency bought/
(sold) forward
£mTotal
£m
Pounds sterling – (3) (60) 65 2
US dollars 29 (6) (789) (151) (917)
Euro, Danish kroner and Swedish kronor – – (102) 88 (14)
Other currencies – (22) 15 – (7)
Total 29 (31) (936) 2 (936)
As at 31 July 2015
Interest rate swaps
£m
Finance lease
obligations £m
Cash, overdrafts and bank
loans £m
Currency (sold)/bought
forward £m
Total £m
Pounds sterling – (3) (208) (127) (338)
US dollars 34 (7) (529) – (502)
Euro, Danish kroner and Swedish kronor – – (57) 126 69
Other currencies – (19) (15) – (34)
Total 34 (29) (809) (1) (805)
Currency bought/(sold) forward comprises short-term foreign exchange swaps which were designated and effective as hedges of overseas operations.
Interest ratesThe interest rate profile of the Group’s net debt including the effect of interest rate swaps is set out in the following tables:
As at 31 July
2016 2015
Floating £m
Fixed £m
Total £m
Floating £m
Fixed £m
Total £m
Pounds sterling 5 (3) 2 (335) (3) (338)
US dollars 48 (965) (917) (76) (426) (502)
Euro, Danish kroner and Swedish kronor 113 (127) (14) 175 (106) 69
Other currencies 15 (22) (7) (15) (19) (34)
Total 181 (1,117) (936) (251) (554) (805)
Fixed rate borrowings at 31 July 2016 carried a weighted average interest rate of 3.2 per cent fixed for a weighted average duration of 7.6 years (31 July 2015: 2.5 per cent for 6.5 years). Floating rate cash at 31 July 2016 carried a weighted average interest rate of 0.4 per cent (31 July 2015: 0.5 per cent). Floating rate borrowings at 31 July 2016 carried a weighted average interest rate of 0.9 per cent (31 July 2015: 0.9 per cent).

Governance Other information
Wolseley plc Annual Report and Accounts 2016 95
Strategic report Financials
23 – Obligations under finance leases
Gross 2016
£m
Gross 2015
£m
Net 2016
£m
Net 2015
£m
Due within one year 5 5 4 4
Due in one to five years 10 11 7 8
Due in over five years 25 20 20 17
40 36 31 29
Less: future finance charges (9) (7)
Present value of finance lease obligations 31 29
Current 4 4
Non-current 27 25
Total obligations under finance leases 31 29
It is the Group’s policy to lease certain of its property, plant and equipment under finance leases. Finance lease obligations included above are secured against the assets concerned.
24 – Provisions
Environmental and legal
£m
Wolseley Insurance
£mRestructuring
£m
Other provisions
£mTotal
£m
At 1 August 2014 85 41 55 66 247
Adjustment to fair value on prior year acquisitions (2) – – – (2)
Utilised in the year (12) (13) (22) (6) (53)
Amortisation of discount (3) – – – (3)
Charge for the year 6 11 4 3 24
Acquisition of businesses – – – 1 1
Disposal of businesses and reclassified as held for sale (7) – (4) 2 (9)
Exchange rate adjustment 3 2 (1) (3) 1
At 31 July 2015 70 41 32 63 206
Utilised in the year (7) (12) (12) (4) (35)
Amortisation of discount 3 – – – 3
Charge for the year 5 18 8 7 38
Disposal of businesses and reclassified as held for sale (7) – (1) (11) (19)
Exchange rate adjustment 11 6 1 10 28
At 31 July 2016 75 53 28 65 221
Provisions have been analysed between current and non-current as follows:
At 31 July 2016
Environmental and legal
£m
Wolseley Insurance
£mRestructuring
£m
Other provisions
£mTotal
£m
Current 23 14 16 35 88
Non-current 52 39 12 30 133
Total provisions 75 53 28 65 221
At 31 July 2015
Environmental and legal
£m
Wolseley Insurance
£mRestructuring
£m
Other provisions
£mTotal
£m
Current 16 14 18 30 78
Non-current 54 27 14 33 128
Total provisions 70 41 32 63 206
Wolseley plc Annual Report and Accounts 201696
Notes to the consolidated financial statements continued
24 – Provisions continued
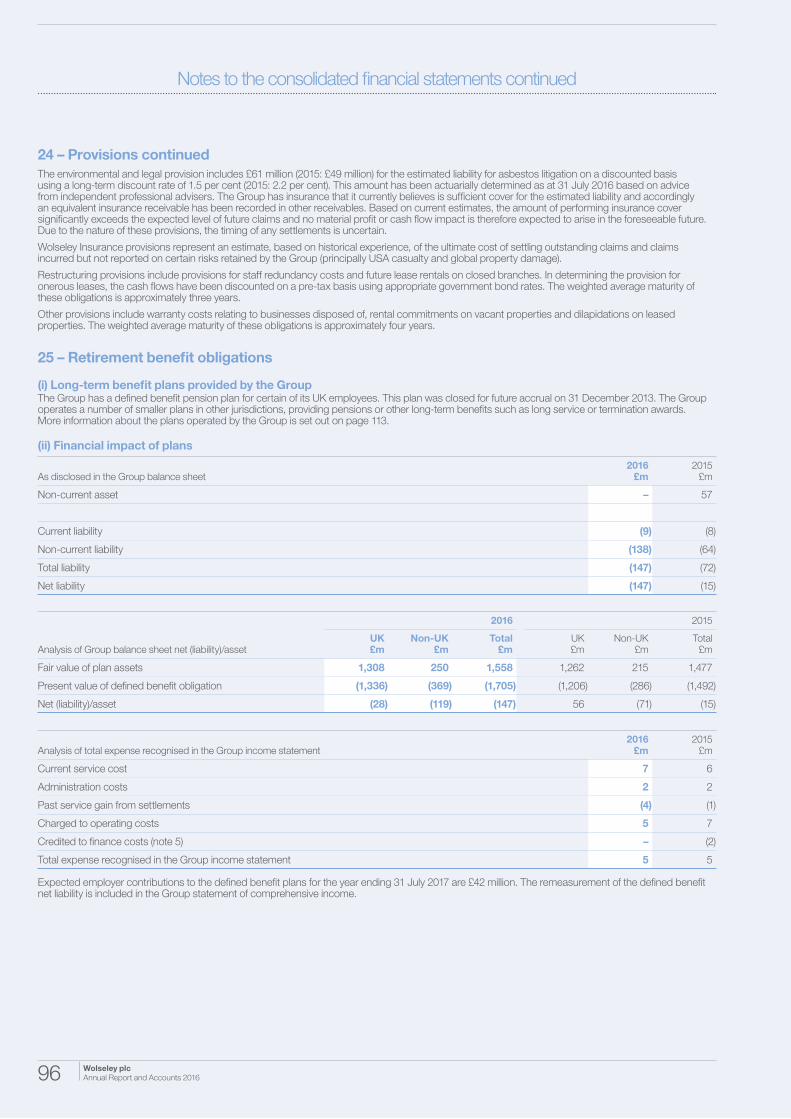
The environmental and legal provision includes £61 million (2015: £49 million) for the estimated liability for asbestos litigation on a discounted basis using a long-term discount rate of 1.5 per cent (2015: 2.2 per cent). This amount has been actuarially determined as at 31 July 2016 based on advice from independent professional advisers. The Group has insurance that it currently believes is sufficient cover for the estimated liability and accordingly an equivalent insurance receivable has been recorded in other receivables. Based on current estimates, the amount of performing insurance cover significantly exceeds the expected level of future claims and no material profit or cash flow impact is therefore expected to arise in the foreseeable future. Due to the nature of these provisions, the timing of any settlements is uncertain.
Wolseley Insurance provisions represent an estimate, based on historical experience, of the ultimate cost of settling outstanding claims and claims incurred but not reported on certain risks retained by the Group (principally USA casualty and global property damage).
Restructuring provisions include provisions for staff redundancy costs and future lease rentals on closed branches. In determining the provision for onerous leases, the cash flows have been discounted on a pre-tax basis using appropriate government bond rates. The weighted average maturity of these obligations is approximately three years.
Other provisions include warranty costs relating to businesses disposed of, rental commitments on vacant properties and dilapidations on leased properties. The weighted average maturity of these obligations is approximately four years.
25 – Retirement benefit obligations
(i) Long-term benefit plans provided by the GroupThe Group has a defined benefit pension plan for certain of its UK employees. This plan was closed for future accrual on 31 December 2013. The Group operates a number of smaller plans in other jurisdictions, providing pensions or other long-term benefits such as long service or termination awards. More information about the plans operated by the Group is set out on page 113.
(ii) Financial impact of plans
As disclosed in the Group balance sheet2016
£m2015
£m
Non-current asset – 57
Current liability (9) (8)
Non-current liability (138) (64)
Total liability (147) (72)
Net liability (147) (15)
2016 2015
Analysis of Group balance sheet net (liability)/assetUK£m
Non-UK£m
Total£m
UK£m
Non-UK£m
Total£m
Fair value of plan assets 1,308 250 1,558 1,262 215 1,477
Present value of defined benefit obligation (1,336) (369) (1,705) (1,206) (286) (1,492)
Net (liability)/asset (28) (119) (147) 56 (71) (15)
Analysis of total expense recognised in the Group income statement2016
£m2015
£m
Current service cost 7 6
Administration costs 2 2
Past service gain from settlements (4) (1)
Charged to operating costs 5 7
Credited to finance costs (note 5) – (2)
Total expense recognised in the Group income statement 5 5
Expected employer contributions to the defined benefit plans for the year ending 31 July 2017 are £42 million. The remeasurement of the defined benefit net liability is included in the Group statement of comprehensive income.

Governance Other information
Wolseley plc Annual Report and Accounts 2016 97
Strategic report Financials
25 – Retirement benefit obligations continued
(ii) Financial impact of plans continued
Analysis of amount recognised in the Group statement of comprehensive income2016
£m2015
£m
The return on plan assets (excluding amounts included in net interest expense) 40 70
Actuarial gain arising from changes in demographic assumptions 17 5
Actuarial loss arising from changes in financial assumptions (200) (149)
Actuarial gain arising from experience adjustments 23 13
Tax 25 15
Total amount recognised in the Group statement of comprehensive income (95) (46)
The cumulative amount of actuarial losses recognised in the Group statement of comprehensive income is £369 million (2015: £249 million).
The fair value of plan assets is as follows:
2016 2015
Fair value of plan assetsUK £m
Non-UK £m
Total £m
UK £m
Non-UK £m
Total £m
At 1 August 1,262 215 1,477 1,167 217 1,384
Interest income 45 6 51 48 8 56
Employer’s contributions 2 7 9 18 7 25
Participants’ contributions – 3 3 – 3 3
Benefit payments (45) (15) (60) (34) (12) (46)
Settlement payments – – – – (12) (12)
Insurance premiums – – – – (1) (1)
Remeasurement gain/(loss):
Return on plan assets (excluding amounts included in net interest expense) 44 (4) 40 63 7 70
Currency translation – 38 38 – (2) (2)
At 31 July 1,308 250 1,558 1,262 215 1,477
Actual return on plan assets 89 2 91 111 15 126
Employer’s contributions included no special funding contribution (2015: £16 million).
At 31 July 2016, the plan’s assets were invested in a diversified portfolio that consisted predominantly of equity and debt securities. The assets in the plans were:
2016 2015
Value at 31 JulyUK£m
Non-UK£m
Total£m
UK£m
Non-UK£m
Total£m
Equity type assets quoted 663 85 748 709 73 782
Government bonds quoted 356 22 378 216 20 236
Corporate bonds quoted 147 75 222 171 65 236
Real estate 4 24 28 – 22 22
Cash 12 10 22 61 6 67
Other including insurance policies 126 34 160 105 29 134
Total market value of assets 1,308 250 1,558 1,262 215 1,477
There were no unquoted plan assets in either the current or previous year.

Wolseley plc Annual Report and Accounts 201698
Notes to the consolidated financial statements continued
25 – Retirement benefit obligations continued
(ii) Financial impact of plans continued
2016 2015
Present value of defined benefit obligationUK £m
Non-UK £m
Total £m
UK £m
Non-UK £m
Total £m
At 1 August 1,206 286 1,492 1,071 306 1,377
Current service cost (including administrative costs) 2 7 9 2 6 8
Past service gain (2) (2) (4) (1) – (1)
Interest cost 41 10 51 45 9 54
Benefit payments (45) (15) (60) (34) (12) (46)
Settlement and curtailment payments – – – – (13) (13)
Participants’ contributions – 3 3 – 3 3
Insurance premiums – – – – (1) (1)
Remeasurement (gain)/loss:
Actuarial (gain)/loss arising from changes in demographic assumptions (14) (3) (17) (6) 1 (5)
Actuarial loss arising from changes in financial assumptions 174 26 200 137 12 149
Actuarial (gain)/loss arising from experience adjustments (26) 3 (23) (8) (5) (13)
Disposals and reclassified as held for sale – – – – (11) (11)
Currency translation – 54 54 – (9) (9)
At 31 July 1,336 369 1,705 1,206 286 1,492
Analysis of present value of defined benefit obligation2016
£m2015
£m
Amounts arising from wholly unfunded plans 44 42
Amounts arising from plans that are wholly or partly funded 1,661 1,450
1,705 1,492
(iii) Valuation assumptionsThe financial assumptions used to estimate defined benefit obligations are:
2016 2015
UK Non-UK UK Non-UK
Discount rate 2.4% 2.2% 3.6% 2.9%
Inflation rate 2.8% 1.4% 3.2% 1.6%
Increase to deferred benefits during deferment 1.7% 1.8% 2.2% 2.0%
Increases to pensions in payment 2.5% 1.8% 2.9% 2.0%
Salary increases 1.7% 1.8% 3.2% 1.9%
The life expectancy assumptions used to estimate defined benefit obligations are:
2016 2015
UK Non-UK UK Non-UK
Current pensioners (at age 65) – male 22 22 22 22
Current pensioners (at age 65) – female 24 24 24 24
Future pensioners (at age 65) – male 25 24 24 23
Future pensioners (at age 65) – female 27 26 27 26
The weighted average duration of the defined benefit obligation is 21.2 years (2015: 21.4 years).

Governance Other information
Wolseley plc Annual Report and Accounts 2016 99
Strategic report Financials
26 – Share capital
(i) Ordinary shares in issue
Authorised numbersAllotted and issued
numbers
2016 2015 2016 2015
Number of ordinary 10 53∕66 pence shares in the Company (million) 463 463 267 267
Nominal value of ordinary 10 53∕66 pence shares in the Company (£ million) 50 50 29 29
All the allotted and issued shares, including those held by Employee Benefit Trusts and in Treasury are fully paid or credited as fully paid.
A summary of the movements in the year is detailed in the following table:
2016 2015
Number of ordinary shares 10 53⁄66 pence ordinary shares in the Company in issue at 1 August 266,592,678 266,531,797
New shares issued to settle share options 43,428 60,881
Number of 10 53⁄66 pence ordinary shares in the Company in issue at 31 July 266,636,106 266,592,678
Consideration received, net of transaction costs, in respect of shares issued to participants in the long term incentive plans and all-employee sharesave plans amounted to £nil (2015: £1 million). Additional information on the allotment of ordinary shares can be found in note 36(iv).
(ii) Treasury sharesDuring the year, the Group completed a share buyback programme totalling £300 million (2015: £250 million). The shares purchased under the Group’s buyback programme have been retained in issue as Treasury shares and represent a deduction from equity attributable to owners of the parent.
A summary of the movement in Treasury shares in the year is detailed in the following table:
Treasury shares
2016 2015
Number of shares
Cost£m
Number of shares
Cost£m
As at 1 August 7,105,842 240 – –
Treasury shares purchased 7,862,836 300 7,407,837 250
Disposal of Treasury shares to settle share options (709,402) (24) (301,995) (10)
As at 31 July 14,259,276 516 7,105,842 240
Consideration received in respect of shares transferred to participants in the long term incentive plans and all-employee sharesave plans amounted to £14 million (2015: £8 million).
(iii) Own sharesTwo Employee Benefit Trusts have been established in connection with the Company’s discretionary share option plans and long term incentive plans.
A summary of the movement in own shares held in Employee Benefit Trusts is detailed in the following table below:
Own shares
2016 2015
Number of shares
Cost£m
Number of shares
Cost£m
As at 1 August 2,019,377 63 2,961,394 93
New shares purchased 368,441 14 430,000 15
Exercise of share options (625,161) (20) (1,372,017) (45)
As at 31 July 1,762,657 57 2,019,377 63
Consideration received in respect of shares transferred to participants in the discretionary share option plans and long term incentive plans amounted to £1 million (2015: £5 million). At 31 July 2016, the shares held in the trusts had a market value of £74 million (2015: £86 million).
Dividends due on shares held by the Employee Benefit Trusts are waived in accordance with the provisions of the trust deeds.

Wolseley plc Annual Report and Accounts 2016100
Notes to the consolidated financial statements continued
27 – Share-based payments
Analysis of charge to income statement2016
£m2015
£m
Executive share option plans 2 2
Ordinary share plan 14 13
All-employee sharesave plans 2 3
Long term incentive plans 2 2
20 20
The number and weighted average exercise price of outstanding and exercisable share options and share awards are detailed below:
2016 2015
Number of shares/options
000’s
Weighted average
exercise price £
Number of shares/ options
000’s
Weighted average
exercise price £
Outstanding at 1 August 4,423 13.91 5,680 13.37
Granted 1,022 9.80 1,268 15.51
Options exercised or shares vested (1,438) 11.89 (1,890) 8.92
Surrendered or expired (279) 18.65 (635) 27.11
Outstanding at 31 July 3,728 13.21 4,423 13.91
Exercisable at 31 July 696 18.35 942 16.55
2016 2015
Weighted average fair value per share/option granted during the year (£) 24.28 18.26
At 31 July 2016 and 31 July 2015, all of the shares and options outstanding had an exercise price which was below the market price. The market price at 31 July 2016 was £42.09 (2015: £42.56). For executive share option plans and all-employee sharesave plans, the range of exercise prices for shares and options outstanding at 31 July 2016 was £7.01 to £33.62 (2015: £7.01 to £33.62). For the ordinary share plan and long term incentive plans, all share options outstanding at 31 July 2016 had an exercise price of £nil (2015: £nil).
For shares and options outstanding at 31 July 2016, the weighted average remaining contractual life was four years (2015: four years).
The fair value at the date of grant of options awarded during the year has been estimated using the binomial methodology for all plans except the portion of the grants awarded under the long term incentive plan that are subject to a relative Total Shareholder Return (“TSR”) performance condition, for which a Monte Carlo simulation was used.
The fair value of shares granted under the ordinary share plan (for more information please refer to page 113) was calculated as the market price of the shares at the date of grant reduced by the present value of dividends expected to be paid over the vesting period.The principal assumptions required by these methodologies were:
Executive share options Employee share optionsLong term
incentive plans
2016 2015 2016 2015 2016 2015
Risk free interest rate n/a 1.6% 0.6% 0.8% 0.7% 1.0%
Expected dividend yield n/a 3.3% 2.7% 2.5% 2.2% 0.0%
Expected volatility n/a 32% 25% 22% 23% 23%
Expected life n/a 5.7 years 1-6 years 1-6 years 3 years 3 years
There were no executive share options granted in the period.
Expected volatility has been estimated on the basis of historical volatility over the expected term, excluding the effect of extraordinary volatility due to the Group’s capital reorganisation and rights issue in 2009. Expected life has been estimated on the basis of historical data on the exercise pattern.
The principal assumptions for the ordinary share plan are an expected dividend yield of approximately 3.0 per cent and an expected life of three years.

Governance Other information
Wolseley plc Annual Report and Accounts 2016 101
Strategic report Financials
28 – Reconciliation of profit to cash generated from operations
Profit for the year is reconciled to cash generated from operations as follows:
2016 £m
2015 £m
Profit for the year 650 213
Net finance costs 34 31
Tax expense 236 187
(Gain)/loss on disposal and closure of businesses and revaluation of disposal groups (147) 129
Depreciation and impairment of property, plant and equipment 125 108
Amortisation and impairment of non-acquired intangible assets 15 13
Amortisation and impairment of goodwill and acquired intangible assets 147 294
Profit on disposal of property, plant and equipment and assets held for sale (18) (3)
Increase in inventories (36) (113)
Increase in trade and other receivable assets (21) (54)
Increase in trade and other payables 13 159
Increase/(decrease) in provisions and other liabilities 1 (47)
Share-based payments 20 20
Cash generated from operations 1,019 937
Trading profit is reconciled to cash generated from operations as follows:
2016 £m
2015 £m
Trading profit 916 854
Exceptional items in operating profit (2) (4)
(Gain)/loss on disposal and closure of businesses and revaluation of disposal groups (147) 129
Operating profit/(loss) from discontinued operations (note 7) 153 (125)
Depreciation and impairment of property, plant and equipment 125 108
Amortisation and impairment of non-acquired intangible assets 15 13
Profit on disposal of property, plant and equipment and assets held for sale (18) (3)
Increase in inventories (36) (113)
Increase in trade and other receivable assets (21) (54)
Increase in trade and other payables 13 159
Increase/(decrease) in provisions and other liabilities 1 (47)
Share-based payments 20 20
Cash generated from operations 1,019 937

Wolseley plc Annual Report and Accounts 2016102
Notes to the consolidated financial statements continued
29 – Acquisitions
The Group acquired the following 16 businesses in the year ended 31 July 2016. All these businesses are engaged in the distribution of plumbing and heating products and building materials. All transactions have been accounted for by the purchase method of accounting except for the 50 per cent acquisition of BraByggare Sverige AB, which has been accounted for as a joint venture.
Date of acquisitionCountry of
incorporationShares/
asset deal % acquired
Central Pipe & Supply August 2015 USA Asset 100
Living Direct, Inc October 2015 USA Shares 100
Atlantic American Fire Equipment Co October 2015 USA Asset 100
Renwes Appliances, Inc October 2015 USA Asset 100
Action Fire Fab & Supply, Inc November 2015 USA Asset 100
Professional Cleaning Service and Supply Corporation January 2016 USA Asset 100
Medallion Pipe Supply Ltd February 2016 Canada Asset 100
Underground Specialties, Inc March 2016 Canada Asset 100
BraByggare Sverige AB March 2016 Sweden Shares 50
Andrews Lighting Gallery, Inc April 2016 USA Asset 100
The Bath & Beyond April 2016 USA Asset 100
Dealernet, LLC April 2016 USA Asset 100
Bruce-Rogers Company May 2016 USA Shares 100
Michigan Pipe & Valve-Flint, Inc June 2016 USA Asset 100
Michigan Pipe & Valve-Lansing, Inc June 2016 USA Asset 100
Michigan Meter Technology Group, Inc July 2016 USA Asset 100
The assets and liabilities acquired and the consideration for all acquisitions in the period are as follows:
Book values acquired
£m
Fair value adjustments
£m
Provisional fair values
acquired £m
Intangible assets
– Customer relationships – 16 16
– Trade names and brands – 7 7
– Other – 5 5
Property, plant and equipment 11 – 11
Inventories 30 (4) 26
Receivables 20 – 20
Cash, cash equivalents and bank overdrafts 2 – 2
Payables (13) – (13)
Deferred tax – (2) (2)
Total 50 22 72
Goodwill arising 40
Consideration 112
Satisfied by:
Cash 94
Deferred consideration 18
Total consideration 112
The fair value adjustments are provisional figures, being the best estimates currently available. Further adjustments may be necessary when additional information is available for some of the judgemental areas.
The goodwill arising on these acquisitions is attributable to the anticipated profitability of the new markets and product ranges to which the Group has gained access and additional profitability and operating efficiencies available in respect of existing markets.
The acquisitions contributed £110 million to revenue, £6 million to trading profit and £6 million to the Group’s operating profit for the period between the date of acquisition and the balance sheet date. It is not practicable to disclose profit before and after tax, as the Group manages its borrowings as a portfolio and cannot attribute an effective borrowing rate to an individual acquisition.

Governance Other information
Wolseley plc Annual Report and Accounts 2016 103
Strategic report Financials
29 – Acquisitions continued
If each acquisition had been completed on the first day of the financial year, Group revenue would have been £14,517 million and Group trading profit would have been £921 million. It is not practicable to disclose profit before tax or profit attributable to equity shareholders, as stated above. It is also not practicable to disclose operating profit as the Group cannot estimate the amount of intangible assets that would have been acquired at a date other than the acquisition date.
The net outflow of cash in respect of the purchase of businesses is as follows:
2016 £m
2015 £m
Purchase consideration 94 100
Deferred and contingent consideration in respect of prior year acquisitions 21 8
Cash consideration 115 108
Cash acquired (2) (3)
Net cash outflow in respect of the purchase of businesses 113 105
30 – Disposals
In the year ended 31 July 2016, the Group disposed of the following businesses:
Name Country Date of disposal Shares/asset deal
Bois & Matériaux SAS France March 2016 Shares
Guimier SAS France March 2016 Shares
Wolseley France Logistique SAS France March 2016 Shares
Duomat SAS France March 2016 Shares
Helatukku Finland Oy Finland May 2016 Shares
AS Puukeskus Estonia July 2016 Shares
The Group recognised a total gain on current year disposals of £136 million. This primarily arose from the sale of the remaining French building materials business which is disclosed in note 7 as a discontinued exceptional gain on disposal.
Continuing operations
£m
Discontinued operations
£m
Group 2016
£m
Consideration received 4 10 14
Net (assets)/liabilities disposed of (2) 4 2
Disposal costs – (5) (5)
Recycling of deferred foreign exchange gains – 125 125
Gain on disposal 2 134 136
Details of assets and liabilities disposed of are provided in the following table:
Continuing operations
£m
Discontinued operations
£m
Group2016
£m
Inventory 2 – 2
Receivables 3 – 3
Net liabilities held for sale – (4) (4)
Payables (3) – (3)
Total net assets/(liabilities) disposed of 2 (4) (2)
The net inflow of cash in respect of the disposal of businesses is as follows:
Continuing operations
£m
Discontinued operations
£m
Group2016
£m
Cash consideration received for current year disposals (net of cash disposed of) 4 – 4
Cash consideration received for prior year disposals – 10 10
Disposal costs paid – (5) (5)
Net cash inflow 4 5 9

Wolseley plc Annual Report and Accounts 2016104
Notes to the consolidated financial statements continued
31 – Reconciliation of opening to closing net debt
For the year ended 31 July 2016
At 1 August
2015 £m
Cash flows
£m
Acquisitions and new finance leases
£m
Disposal of businesses
£m
Fair value and other
adjustments £m
Held for sale movements
£m
Exchange movement
£m
At 31 July
2016 £m
Cash and cash equivalents 1,105 940
Bank overdrafts (848) (692)
257 (28) 2 – – (1) 18 248
Derivative financial instruments 33 (10) – – 1 – 7 31
Bank loans (1,066) 16 – 27 9 – (170) (1,184)
Obligations under finance leases (29) 4 (2) – – – (4) (31)
Net debt (805) (18) – 27 10 (1) (149) (936)
For the year ended 31 July 2015
At 1 August
2014 £m
Cash flows
£m
Acquisitions and new
finance leases £m
Disposal of businesses
£m
Fair value and other
adjustments £m
Reclassified as held for
sale£m
Exchange movement
£m
At 31 July
2015 £m
Cash and cash equivalents 240 1,105
Bank overdrafts (73) (848)
167 173 3 (10) – 1 (77) 257
Derivative financial instruments 42 (12) – – (1) – 4 33
Bank loans (877) (197) (13) 15 12 – (6) (1,066)
Obligations under finance leases (43) 4 (3) 1 – 12 – (29)
Net debt (711) (32) (13) 6 11 13 (79) (805)
32 – Related party transactions
There are no related party transactions requiring disclosure under IAS 24 “Related Party Disclosures” other than the compensation of key management personnel which is set out in the following table.
Key management personnel compensation (including Directors)2016
£m2015
£m
Salaries, bonuses and other short-term employee benefits 8 9
Termination and post-employment benefits 1 2
Share-based payments 4 4
Total compensation 13 15
More detailed disclosures on the remuneration of the Directors are provided in the Remuneration Report on pages 58 to 72.

Governance Other information
Wolseley plc Annual Report and Accounts 2016 105
Strategic report Financials
33 – Operating lease commitments
Future minimum lease payments under non-cancellable operating leases for the following periods are:
2016 £m
2015 £m
Within one year 253 219
Later than one year and less than five years 457 414
After five years 143 143
Total operating lease commitments 853 776
Operating lease payments mainly represent rents payable for properties. Some of the Group’s operating lease arrangements have renewal options and rental escalation clauses. No arrangements have been entered into for contingent rental payments.
The commitments shown above include commitments for onerous leases which have already been provided for. At 31 July 2016, provisions include an amount of £25 million (2015: £29 million) in respect of minimum lease payments for such onerous leases net of sublease income expected to be received. The total minimum sublease income expected to be received under non-cancellable subleases at 31 July 2016 is £8 million (2015: £7 million).
The commitments above include no operating lease commitments (2015: £20 million) for discontinued operations.
Operating lease commitments as at 31 July 2015 have been updated to reflect the non-cancellable minimum lease payments.
34 – Contingent liabilities
Group companies are, from time to time, subject to certain claims and litigation arising in the normal course of business in relation to, among other things, the products that we supply, contractual and commercial disputes and disputes with employees. Provision is made if, on the basis of current information and professional advice, liabilities are considered likely to arise. In the case of unfavourable outcomes, the Group may benefit from applicable insurance protection.
Warranties and indemnities in relation to business disposalsOver the past few years, the Group has disposed of a number of non-core businesses and various Group companies have provided certain standard warranties and indemnities to acquirers and other third parties. Provision is made where the Group considers that a liability is likely to crystallise, though it is possible that claims in respect of which no provision has been made could crystallise in the future. Group companies have also made contractual commitments for certain property and other obligations which could be called upon in an event of default. As at the date of this report, there are no significant outstanding claims in relation to business disposals.
Environmental liabilitiesThe operations of certain Group companies are subject to specific environmental regulations. From time to time, the Group conducts preliminary investigations through third parties to assess potential risks including potential soil or groundwater contamination of sites. Where an obligation to remediate contamination arises then this is provided for, though future liabilities could arise from sites for which no provision is made.
Outcome of claims and litigationThe outcome of claims and litigation to which Group companies are party cannot readily be foreseen as, in some cases, the facts are unclear, further time is needed to assess properly the merits of the case, or they are part of continuing legal proceedings. However, based on information currently available, the Directors consider that the cost to the Group of an unfavourable outcome arising from such litigation is not expected to have a material adverse effect on the financial position of the Group.
35 – Post-balance sheet events
In August 2016, the Group acquired two businesses for total consideration of £187 million with combined annualised revenue of £92 million. Clawfoot Supply, LLC (trading as Signature Hardware) is a B2C distributor of high-end, private label products. 100 per cent of this company was acquired to grow B2C and online presence in the USA. The Group also acquired the net assets of Westfield Lighting. As at the date of this report, the accounting for these acquisitions has not been finalised.
In September 2016, we completed a six month review of our operational strategy in the UK and expect to reduce the number of operational locations and employees by at least 10 per cent. Restructuring costs in relation to these actions will continue into the next financial year.

Wolseley plc Annual Report and Accounts 2016106
Notes to the consolidated financial statements continued
36 – Additional information
(i) Group accounting policiesA summary of the principal accounting policies applied by the Group in the preparation of the consolidated financial statements is set out below. The accounting policies have been applied consistently throughout the current and preceding year.
Exceptional itemsExceptional items are those which are considered significant by virtue of their nature, size or incidence. These items are presented as exceptional within their relevant income statement category to assist in the understanding of the trading and financial results of the Group. In addition, management presents trading profit, headline profit and headline earnings per share to provide additional useful information on underlying trends to shareholders.
Examples of such items that are considered by the Directors for designation as exceptional items include, but are not limited to:
• material restructuring and other expenses relating to the integration of an acquired business;
• gains or losses on disposal of businesses; and
• costs arising as a result of material and non-recurring regulatory and litigation matters.
ConsolidationThe consolidated financial information includes the results of the parent company and entities controlled by the company (its subsidiary undertakings and controlling interests) drawn up to 31 July 2016.
The trading results of business operations are included in profit from continuing operations from the date of acquisition or up to the date of sale.
Intra-group transactions and balances and any unrealised gains and losses arising from intra-group transactions are eliminated on consolidation, with the exception of gains or losses required under relevant IFRS accounting standards.
Discontinued operationsWhen the Group has disposed of or intends to dispose of a business component that represents a separate major line of business or geographical area of operations, it classifies such operations as discontinued. The post-tax profit or loss of the discontinued operations is shown as a single line on the face of the income statement, separate from the other results of the Group.
Foreign currenciesItems included in the financial statements of each of the Group’s subsidiary undertakings are measured using the currency of the primary economic environment in which the subsidiary undertaking operates (the “functional currency”). The consolidated financial statements are presented in sterling, which is the presentational currency of the Group and the functional currency of the parent company.
The trading results of overseas subsidiary undertakings are translated into sterling using the average rates of exchange ruling during the relevant financial period. The balance sheets of overseas subsidiary undertakings are translated into sterling at the rates of exchange ruling at the period end. Exchange differences arising between the translation into sterling of the net assets of these subsidiary undertakings are recognised in the currency translation reserve (as are exchange differences on foreign currency borrowings to the extent that they are used to finance or provide a hedge against foreign currency net assets).
Changes in the fair value of derivative financial instruments, entered into to hedge foreign currency net assets and that satisfy the hedging conditions of IAS 39, are recognised in the currency translation reserve (see the separate accounting policy on derivative financial instruments).
In the event that a subsidiary undertaking which has a non-sterling functional currency is disposed of, the gain or loss on disposal recognised in the income statement is determined after taking into account the cumulative currency translation differences that are attributable to the subsidiary undertaking concerned.
Foreign currency transactions entered into during the year are translated into sterling at the rates of exchange ruling on the dates of the transactions. Monetary assets and liabilities denominated in foreign currencies are retranslated at the rate of exchange ruling at the balance sheet date. All currency translation differences are taken to the income statement with the exception of differences on foreign currency net borrowings to the extent that they are used to finance or provide a hedge against foreign currency net assets as detailed above.
Business combinationsThe cost of an acquisition is measured as the fair value of the assets given, equity instruments issued and liabilities incurred or assumed at the date of exchange. Identifiable assets acquired and liabilities and contingent liabilities assumed in a business combination are measured initially at their fair values at the acquisition date, irrespective of the extent of any non-controlling interest. Acquisition-related costs are expensed as incurred.
The excess of the cost of acquisition over the fair value of the Group’s share of the identifiable net assets acquired is recorded as goodwill. If the cost of acquisition is less than the fair value of the Group’s share of the net assets of the subsidiary acquired, the difference is recognised directly in the income statement.
Non-controlling interestsNon-controlling interests in subsidiaries are identified separately from the Group’s equity. The interests of non-controlling shareholders are initially measured at fair value. Subsequent to acquisition the carrying amount of non-controlling interests is the amount of those interests at initial recognition plus the non-controlling interests’ share of subsequent changes in equity. Total comprehensive income is attributed to non-controlling interests even if this results in the non-controlling interests showing a deficit balance.
RevenueRevenue is the amount receivable for the provision of goods and services falling within the Group’s ordinary activities, excluding intra-group sales, estimated and actual sales returns, trade and early settlement discounts, value added tax and similar sales taxes.
The Group acts as principal for direct sales which are delivered directly to the customer by the supplier.
Revenue from the provision of goods is recognised when the risks and rewards of ownership of goods have been transferred to the customer. The risks and rewards of ownership of goods are deemed to have been transferred when the goods are shipped to, or picked up by, the customer.
Revenue from services is recognised when the service provided to the customer has been completed.
Customer loyalty credits are accounted for as a separate component of the sales transaction in which they are granted. A portion of the fair value of the consideration received is allocated to the loyalty credits and recognised in the period that loyalty credits are redeemed.
Revenue from the provision of goods and services is only recognised when the amounts to be recognised are fixed or determinable and collectability is reasonably assured.
Cost of salesCost of sales includes purchased goods, the cost of bringing inventory to its present location and condition and labour and overheads attributable to assembly and construction services.
Intangible assets
GoodwillGoodwill represents the excess of the cost of an acquisition over the fair value of the Group’s share of the net identifiable assets of the acquired subsidiary undertaking at the date of acquisition. Goodwill on acquisitions of subsidiary undertakings is included within intangible assets. Goodwill is allocated to cash generating units or aggregations of cash generating units (together “CGUs”) where synergy benefits are expected. CGUs are independent sources of income streams and represent the lowest level within the Group at which the associated goodwill is monitored for management purposes. For goodwill impairment testing purposes, no CGU is larger than the reporting segments determined in accordance with IFRS 8 “Operating Segments”.
Goodwill is not amortised but is tested annually for impairment and carried at cost less accumulated impairment losses. Gains and losses on the disposal of an entity include the carrying amount of goodwill relating to the entity sold.

Governance Other information
Wolseley plc Annual Report and Accounts 2016 107
Strategic report Financials
36 – Additional information continued
(i) Group accounting policies continued
Other intangible assetsAn intangible asset, which is an identifiable non-monetary asset without physical substance, is recognised to the extent that it is probable that the expected future economic benefits attributable to the asset will flow to the Group and that its cost can be measured reliably. The asset is deemed to be identifiable when it is separable or when it arises from contractual or other legal rights.
Intangible assets, primarily brands, trade names and customer relationships, acquired as part of a business combination are capitalised separately from goodwill and are carried at cost less accumulated amortisation and accumulated impairment losses. Amortisation is calculated using the reducing balance method for customer relationships and the straight-line method for other intangible assets. The cost of the intangible assets is amortised over their estimated useful lives as follows:
Customer relationships 4–25 years
Trade names and brands 1–15 years
Other 1–4 years
Computer software that is not integral to an item of property, plant and equipment is recognised separately as an intangible asset and is carried at cost less accumulated amortisation and accumulated impairment losses. Costs include software licences and external and internal costs directly attributable to the development, design and implementation of the computer software. Costs in respect of training and data conversion are expensed as incurred. Amortisation is calculated using the straight-line method so as to charge the cost of the computer software to the income statement over its estimated useful life of between three and five years.
Property, plant and equipment (“PPE”)PPE is carried at cost less accumulated depreciation and accumulated impairment losses, except for land and assets in the course of construction, which are not depreciated and are carried at cost less accumulated impairment losses. Cost includes expenditure that is directly attributable to the acquisition of the items. In addition, subsequent costs are included in the asset’s carrying amount or recognised as a separate asset, as appropriate, only when it is probable that future economic benefits associated with the item will flow to the Group and the cost of the item can be measured reliably. All other repairs and maintenance costs are charged to the income statement during the financial period in which they are incurred.
Assets are depreciated to their estimated residual value using the straight-line method over their useful lives as follows:
Freehold buildings and long leaseholds 20–50 years
Operating leasehold improvements over the period of the lease
Plant and machinery 7–10 years
Computer hardware 3–5 years
Fixtures and fittings 5–7 years
Motor vehicles 4 years
The residual values and useful lives of PPE are reviewed and adjusted if appropriate at each balance sheet date.
Borrowing costs directly attributable to the long-term construction or production of an asset are capitalised as part of the cost of the asset.
Leased assetsAssets held under finance leases, which are leases where substantially all the risks and rewards of ownership of the asset have transferred to the Group, are capitalised in the balance sheet and depreciated over the shorter of the lease term or their useful lives. The asset is recorded at the lower of its fair value and the present value of the minimum lease payments at the inception of the lease. The capital elements of future obligations under finance leases are included in liabilities in the balance sheet and analysed between current and non-current amounts. The interest elements of future obligations under finance leases are charged to the income statement over the periods of the leases and represent a constant proportion of the balance of capital repayments outstanding in accordance with the effective interest rate method.
Leases where the lessor retains substantially all the risks and rewards of ownership are classified as operating leases. The cost of operating leases (net of any incentives received from the lessor) is charged to the income statement on a straight-line basis over the period of the leases.
Assets and disposal groups held for sale Assets are classified as held for sale if their carrying amount will be recovered by sale rather than by continuing use in the business. Where a group of assets and their directly associated liabilities are to be disposed of in a single transaction, such disposal groups are also classified as held for sale. For this to be the case, the asset or disposal group must be available for immediate sale in its present condition, and management must be committed to and have initiated a plan to sell the asset or disposal group which, when initiated, was expected to result in a completed sale within 12 months. Assets that are classified as held for sale are not depreciated. Assets or disposal groups that are classified as held for sale are measured at the lower of their carrying amount and fair value less costs to sell.
InventoriesInventories, which comprise all goods purchased for resale, are stated at the lower of cost and net realisable value. Cost is determined using the first-in, first-out (“FIFO”) method or the average cost method as appropriate to the nature of the transactions in those items of inventory. The cost of goods purchased for resale includes import and custom duties, transport and handling costs, freight and packing costs and other attributable costs less trade discounts, rebates and other subsidies. It excludes borrowing costs. Net realisable value is the estimated selling price in the ordinary course of business, less applicable variable selling expenses.
Trade receivablesTrade receivables are recognised initially at fair value and measured subsequently at amortised cost using the effective interest method, less provision for impairment. A provision for impairment of trade receivables is established when there is objective evidence that the Group will not be able to collect all amounts due according to the original terms of the receivables. The amount of the loss is recognised in the income statement. Trade receivables are written off against the provision when recoverability is assessed as being remote. Subsequent recoveries of amounts previously written off are credited to the income statement.
Retirement benefit obligationsContributions to defined contribution pension plans and other post-retirement benefits are charged to the income statement as incurred.
For defined benefit pension plans and other retirement benefits, the cost of providing benefits is determined annually using the Projected Unit Credit Method by independent qualified actuaries. The current service cost of defined benefit plans is recorded within operating profit. Past service costs are recognised immediately in income. Actuarial gains and losses arising from experience adjustments and changes in actuarial assumptions are charged or credited to equity in other comprehensive income in the period in which they arise. The liability/asset recognised in the balance sheet in respect of defined benefit pension plans is the fair value of plan assets less the present value of the defined benefit obligation at the end of the reporting period.

Wolseley plc Annual Report and Accounts 2016108
Notes to the consolidated financial statements continued
36 – Additional information continued
(i) Group accounting policies continued
TaxCurrent tax represents the expected tax payable (or recoverable) on the taxable income (or losses) for the year using tax rates enacted or substantively enacted at the balance sheet date and taking into account any adjustments arising from prior years.
Deferred tax is provided in full, using the liability method, on temporary differences arising between the tax bases of assets and liabilities and their carrying amounts in the consolidated financial statements. Deferred tax is not accounted for if it arises from initial recognition of an asset or liability in a transaction, other than a business combination, that at the time of the transaction affects neither accounting nor taxable profit or loss.
Deferred tax is determined using tax rates (and laws) that have been enacted or substantively enacted by the balance sheet date and are expected to apply when the related deferred tax asset is realised or the deferred tax liability is settled. Deferred tax assets are recognised to the extent that it is probable that future taxable profit will be available against which the temporary differences can be utilised.
Deferred tax is provided on temporary differences arising on investments in subsidiaries except where the timing of the reversal of the temporary difference is controlled by the Group and it is probable that the temporary difference will not reverse in the foreseeable future.
Share capitalIncremental costs directly attributable to the issue of new shares or options are shown in equity as a deduction from the proceeds, net of tax.
Where any Group company purchases the Company’s equity share capital (Treasury shares), the consideration paid, including any directly attributable incremental costs (net of tax), is deducted from equity attributable to the Company’s equity holders until the shares are cancelled, reissued or disposed of. Where such shares are subsequently sold or reissued, any consideration received, net of any directly attributable incremental transaction costs and the related tax effects, is included in equity attributable to the Company’s equity holders.
Share-based paymentsShare-based incentives are provided to employees under the Group’s executive share option plan, long term incentive plan, all-employee sharesave plan and ordinary share plan. The Group recognises a compensation cost in respect of these plans that is based on the fair value of the awards, measured using Binomial and Monte Carlo valuation methodologies. For equity-settled plans, the fair value is determined at the date of grant (including the impact of any non-vesting conditions such as a requirement for employees to save) and is not subsequently remeasured unless the conditions on which the award were granted are modified. For cash-settled plans, the fair value is determined at the date of grant and is remeasured at each balance sheet date until the liability is settled. Generally, the compensation cost is recognised on a straight-line basis over the vesting period. Adjustments are made to reflect expected and actual forfeitures during the vesting period due to the failure to satisfy service conditions or non-market performance conditions.
Dividends payableDividends on ordinary shares are recognised in the Group’s financial statements in the period in which the dividends are approved by the shareholders of the Company or paid.
Cash and cash equivalentsCash and cash equivalents includes cash in hand, deposits held at call with banks, other short-term highly liquid investments with original maturities of three months or less, and bank overdrafts. Bank overdrafts are shown within borrowings in current liabilities on the balance sheet to the extent that there is no legal right of offset and/or no practice of net settlement with cash balances.
Cash, which is not freely available to the Group, is disclosed as restricted cash.
Derivative financial instrumentsDerivative financial instruments, in particular interest rate swaps and foreign exchange swaps, are used to manage the financial risks arising from the business activities of the Group and the financing of those activities. There is no trading activity in derivative financial instruments.
At the inception of a hedging transaction entailing the use of derivative financial instruments, the Group documents the relationship between the hedged item and the hedging instrument together with its risk management objective and the strategy underlying the proposed transaction. The Group also documents its assessment, both at the inception of the hedging relationship and subsequently on an ongoing basis, of the effectiveness of the hedge in offsetting movements in the fair values or cash flows of the hedged items.
Derivative financial instruments are recognised as assets and liabilities measured at their fair values at the balance sheet date. Where derivative financial instruments do not fulfil the criteria for hedge accounting contained in IAS 39, changes in their fair values are recognised in the income statement. When hedge accounting is used, the relevant hedging relationships are classified as fair value hedges, cash flow hedges or net investment hedges. Where the hedging relationship is classified as a fair value hedge, the carrying amount of the hedged asset or liability is adjusted by the increase or decrease in its fair value attributable to the hedged risk and the resulting gain or loss is recognised in the income statement where, to the extent that the hedge is effective, it will be offset by the change in the fair value of the hedging instrument. If the hedge no longer meets the criteria for hedge accounting, the adjustment to the carrying amount of a hedged item for which the effective interest method is used is amortised to profit or loss over the period to maturity. Where the hedging relationship is classified as a cash flow hedge or as a net investment hedge, to the extent the hedge is effective, changes in the fair value of the hedging instrument arising from the hedged risk are recognised directly in equity. When the hedged item is recognised in the financial statements, the accumulated gains and losses recognised in equity are either recycled to the income statement or, if the hedged item results in a non-financial asset, are recognised as adjustments to its initial carrying amount. When a hedging instrument expires or is sold, or when a hedge no longer meets the criteria for hedge accounting, any cumulative gain or loss existing in equity at that time remains in equity and is recognised when the forecast transaction is ultimately recognised in the income statement. When a forecast transaction is no longer expected to occur, the cumulative gain or loss that was reported in equity is immediately transferred to the income statement.
BorrowingsBorrowings are recognised initially at the fair value of the consideration received net of transaction costs incurred. Borrowings are subsequently stated at amortised cost with any difference between the proceeds (net of transaction costs) and the redemption value being recognised in the income statement over the period of the borrowings using the effective interest method. Borrowings are classified as current liabilities unless the Group has an unconditional right to defer settlement of the liability for at least 12 months after the balance sheet date.

Governance Other information
Wolseley plc Annual Report and Accounts 2016 109
Strategic report Financials
36 – Additional information continued
(ii) Additional information about financial instruments
Financial instruments by measurement basisFinancial instruments in the category “fair value through profit and loss” are measured in the balance sheet at fair value. Fair value measurements can be classified in the following hierarchy:
• quoted prices (unadjusted) in active markets for identical assets or liabilities (level 1);
• inputs other than quoted prices included within level 1 that are observable for the asset or liability, either directly or indirectly (level 2); and
• inputs for the asset or liability that are not based on observable market data (that is, unobservable inputs) (level 3).
The following tables present the Group’s assets and liabilities that are measured at fair value at 31 July 2016 and 31 July 2015:
2016 2015
Level 1 £m
Level 2 £m
Level 3 £m
Total £m
Level 1 £m
Level 2 £m
Level 3 £m
Total £m
Derivatives at fair value through profit and loss – 31 – 31 – 34 – 34
Loan notes held at fair value through profit and loss – – 23 23 – – 16 16
Total assets – 31 23 54 – 34 16 50
As at 31 July 2016 there were no derivative liabilities held at fair value through profit and loss (2015: £1 million at level 2).
No transfers between levels occurred during the current or prior year.
The fair value of financial instruments traded in active markets is based on quoted market prices at the balance sheet date. The fair value of financial instruments that are not traded in an active market (such as over-the-counter derivatives) is determined by using valuation techniques. The Group’s other financial instruments are measured on bases other than fair value. Other receivables include an amount of £60 million (2015: £48 million) which has been discounted at a rate of 1.5 per cent (2015: 2.2 per cent) due to the long-term nature of the receivable. Because other current assets and liabilities are either of short maturity or bear floating rate interest, their fair values approximate to book values. The only non-current financial assets or liabilities for which fair value does not approximate to book value are the senior unsecured loan notes, which had a book value of £959 million (2015: £453 million) and a fair value of £1,027 million (2015: £474 million).
Financial instruments: disclosure of offsetting arrangementsThe financial instruments that have been offset in the financial statements are disclosed below:
At 31 July 2016 Notes
Gross balances
(a) £m
Offset amounts
(b) £m
Financial statements
(c) £m
Cash pooling
amounts (d)
£m
Net total (e)
£m
Financial assets
Non-current assets
Derivative financial assets 17 51 (31) 20 – 20
Current assets
Derivative financial assets 17 24 (13) 11 – 11
Cash and cash equivalents 18 940 – 940 (606) 334
1,015 (44) 971 (606) 365
Financial liabilities
Current liabilities
Derivative financial liabilities 17 13 (13) – – –
Bank loans and overdrafts 21 701 – 701 (606) 95
Finance leases 23 4 – 4 – 4
Non-current liabilities
Derivative financial liabilities 17 31 (31) – – –
Bank loans 21 1,175 – 1,175 – 1,175
Finance leases 23 27 – 27 – 27
1,951 (44) 1,907 (606) 1,301
Closing net debt 31 (936) – (936) – (936)

Wolseley plc Annual Report and Accounts 2016110
Notes to the consolidated financial statements continued
36 – Additional information continued
(ii) Additional information about financial instruments continued
Financial instruments: disclosure of offsetting arrangements continued
At 31 July 2015 Notes
Gross balances
(a) £m
Offset amounts
(b) £m
Financial statements
(c) £m
Cash pooling amounts
(d)£m
Net total(e)
£m
Financial assets
Non-current assets
Derivative financial assets 17 49 (25) 24 – 24
Current assets
Derivative financial assets 17 18 (8) 10 – 10
Cash and cash equivalents (f) 18 1,109 (4) 1,105 (786) 319
1,176 (37) 1,139 (786) 353
Financial liabilities
Current liabilities
Derivative financial liabilities 17 9 (8) 1 – 1
Bank loans and overdrafts (f) 21 1,005 (4) 1,001 (786) 215
Finance leases 23 4 – 4 – 4
Non-current liabilities
Derivative financial liabilities 17 25 (25) – – –
Bank loans 21 913 – 913 – 913
Finance leases 23 25 – 25 – 25
1,981 (37) 1,944 (786) 1,158
Closing net debt 31 (805) – (805) – (805)
(a) The gross amounts of the recognised financial assets and liabilities under a master netting agreement, or similar arrangement.
(b) The amounts offset in accordance with the criteria in IAS 32.
(c) The net amounts presented in the Group balance sheet.
(d) The amounts subject to a master netting arrangement, or similar arrangement, not included in (c).
(e) The net amount after deducting the amounts in (e) from the amounts in (d).
(f) Cash and cash equivalents and overdrafts as at 31 July 2015 have been restated for accounts whose balances are held on a net basis due to cash sweeping arrangements. This has no impact on net debt but reduces the gross value of cash and cash equivalents and reduces the gross value of overdrafts by £113 million.
Financial instruments: risk management policiesThe Group is exposed to market risks arising from its international operations and the financial instruments which fund them. The main risks arising from the Group’s financial instruments are foreign currency risk, interest rate risk and liquidity risk. The Group has well-defined policies for the management of interest rate, liquidity, foreign exchange and counterparty exposures, which have been consistently applied during the financial years ended 31 July 2016 and 31 July 2015. By the nature of its business, the Group also has trade credit and commodity price exposures, the management of which is delegated to the operating businesses. There has been no change since the previous year in the major financial risks faced by the Group.
Policies for managing each of these risks are regularly reviewed and are summarised below. When the Group enters into derivative transactions (principally interest rate swaps and foreign exchange contracts), the purpose of such transactions is to hedge certain interest rate and currency risks arising from the Group’s operations and its sources of finance. It is, and has been throughout the period under review, the Group’s policy that no trading in financial instruments or speculative transactions be undertaken.
Capital risk managementThe Group’s sources of funding currently comprise cash flows generated by operations, equity contributed by shareholders and borrowings from banks and other financial institutions. In order to maintain or adjust the capital structure, the Group may pay a special dividend, return capital to shareholders, repurchase its own shares, issue new shares or sell assets to reduce debt.

Governance Other information
Wolseley plc Annual Report and Accounts 2016 111
Strategic report Financials
36 – Additional information continued
(ii) Additional information about financial instruments continued
Liquidity riskThe Group maintains a policy of ensuring sufficient borrowing headroom to finance all investment and capital expenditure included in its strategic plan, with an additional contingent safety margin.
The Group has estimated its anticipated contractual cash outflows (excluding interest income and income from derivatives) including interest payable in respect of its trade and other payables and bank borrowings on an undiscounted basis. The principal assumptions are that floating rate interest is calculated using the prevailing interest rate at the balance sheet date and cash flows in foreign currency are translated using spot rates at the balance sheet date. These cash flows can be analysed by maturity as follows:
As at 31 July
2016 2015
Trade and other
payables £m
Debt £m
Interest on debt
£mTotal
£m
Trade and other
payables £m
Debt £m
Interest on debt
£mTotal
£m
Due in less than one year 2,280 5 44 2,329 1,976 141 31 2,148
Due in one to two years 19 122 40 181 15 3 37 55
Due in two to three years 12 2 37 51 11 103 34 148
Due in three to four years 14 1 37 52 7 2 31 40
Due in four to five years 8 215 31 254 9 1 31 41
Due in over five years 110 847 116 1,073 83 814 113 1,010
Total 2,443 1,192 305 3,940 2,101 1,064 277 3,442
Foreign currency riskThe Group has significant overseas businesses whose revenues are mainly denominated in the currencies of the countries in which the operations are located. Approximately 65 per cent of the Group’s revenue is in US dollars. Within each country it operates, the Group does not have significant transactional foreign currency cash flow exposures. However, those that do arise may be hedged with either forward contracts or currency options. The Group does not normally hedge profit translation exposure since such hedges have only a temporary effect.
The Group’s policy is to adjust the currencies in which its net debt is denominated materially to match the currencies in which its trading profit is generated. Details of average exchange rates used in the translation of overseas earnings and of year-end exchange rates used in the translation of overseas balance sheets for the principal currencies used by the Group are shown in the five-year summary on page 123. The net effect of currency translation was to increase revenue by £552 million (2015: increase by £101 million) and to increase trading profit by £46 million (2015: increase by £19 million). These currency effects primarily reflect a movement of the average sterling exchange rate against US dollars, euro and Canadian dollars as follows:
2016 (Weakening)/
strengthening of sterling
2015 (Weakening)/
strengtheningof sterling
US dollars (6.8%) (5.3%)
Euro (0.8%) 9.0%
Canadian dollars 4.1% 5.2%
The Group has net financial liabilities denominated in foreign currencies which have been designated as hedges of the net investment in its overseas subsidiaries. The principal value of those financial liabilities designated as hedges at the balance sheet date was £1,636 million (2015: £1,000 million). The loss on translation of these financial instruments into sterling of £107 million (2015: loss of £46 million) has been taken to the translation reserve.
Net investment hedgingExchange differences arising from the translation of the net investment in foreign operations are recognised directly in equity. Gains and losses on those hedging instruments designated as hedges of the net investments in foreign operations are recognised in equity to the extent that the hedging relationship is effective; these amounts are included in exchange differences on translation of foreign operations as stated in the Group statement of changes in equity. Gains and losses relating to hedge ineffectiveness are recognised immediately in the income statement for the period. Gains and losses accumulated in the translation reserve are included in the income statement when the foreign operation is disposed of.

Wolseley plc Annual Report and Accounts 2016112
Notes to the consolidated financial statements continued
36 – Additional information continued
(ii) Additional information about financial instruments continued
Interest rate riskAt 31 July 2016, 92 per cent of loans were at fixed rates. The Group borrows in the desired currencies principally at rates determined by reference to short-term benchmark rates applicable to the relevant currency or market, such as LIBOR. Rates which reset at least every 12 months are regarded as floating rates and the Group then, if appropriate, considers interest rate swaps to generate the desired interest rate profile.
The Group reviews deposits and borrowings by currency at Treasury Committee and Board meetings. The Treasury Committee gives prior approval to any variations from floating rate arrangements.
During November 2011, the Group entered into interest rate swap contracts comprising fixed interest payable on US$729 million of notional principal. The residual contracts of US$438 million now expire between November 2017 and November 2020 and the fixed interest rates range between 2.06 per cent and 2.94 per cent. These contracts have been held since inception at fair value through profit and loss. With effect from 1 December 2011, interest rate swap contracts comprising fixed interest receivable on an original notional principal of US$729 million and as at 31 July 2016, residual contracts of US$438 million have been classified as held at fair value through profit and loss. The contracts expire between November 2017 and November 2020 and the fixed interest rates range between 5.18 per cent and 5.32 per cent (2015: 5.05 per cent and 5.32 per cent).
The table below shows the income statement movement on interest rate swaps at fair value through profit and loss.
At fair value through profit and loss (hedge accounting not applied)
2016 £m
2015 £m
At 1 August 34 42
Settled (11) (12)
Valuation gain credited to income statement 1 –
Exchange 5 4
At 31 July 29 34
There are no fixed rate interest borrowings that form part of a hedge relationship.
Monitoring interest rate and foreign currency riskThe Group monitors its interest rate and foreign currency risk by reviewing the effect on financial instruments over various periods of a range of possible changes in interest rates and exchange rates. The Group has estimated that an increase of one percentage point in the principal interest rates to which it is exposed would result in a charge to the income statement of £1 million (2015: £5 million). The Group has estimated that a weakening of sterling by 10 per cent against gross borrowings denominated in foreign currency in which the Group does business would result in a charge to equity of £177 million (2015: £157 million).
The Group does not require operating businesses to adhere to a formalised risk management policy in respect of trade credit risk or commodity price risk and does not consider that there is a useful way of quantifying the Group’s exposure to any of the macroeconomic variables that might affect the collectability of receivables or the prices of commodities.
Credit riskThe Group provides sales on credit terms to most of its customers. There is an associated risk that customers may not be able to pay outstanding balances. At 31 July 2016, the maximum exposure to credit risk was £2,187 million (2015: £1,890 million).
Each of the Group’s businesses have established procedures in place to review and collect outstanding receivables. Significant outstanding and overdue balances are reviewed on a regular basis and resulting actions are put in place on a timely basis. In some cases, protection is provided through credit insurance arrangements. All of the major businesses use professional, dedicated credit teams, in some cases field-based. Appropriate provisions are made for debts that may be impaired on a timely basis. Concentration of credit risk in trade receivables is limited as the Group’s customer base is large and unrelated. Accordingly, the Group considers that there is no further credit risk provision required above the current provision for impairment.
The Group has cash balances deposited for short periods with financial institutions, and enters into certain contracts (such as interest rate swaps) which entitle the Group to receive future cash flows from financial institutions. These transactions give rise to credit risk on amounts due from counterparties with a maximum exposure of £237 million (2015: £233 million). This risk is managed by setting credit and settlement limits for a panel of approved counterparties. The limits are approved by the Treasury Committee and ratings are monitored regularly.
(iii) Additional information about non-GAAP measures and performanceTrading profit is defined as operating profit before exceptional items and the amortisation and impairment of acquired intangible assets. It is a non-GAAP measure. Exceptional items are defined in note 36(i). The Group believes that trading profit provides valuable additional information for users of the financial statements in assessing the Group’s performance since it provides information on the performance of the business that local managers are more directly able to influence and on a basis consistent across the Group. The Group uses trading profit and certain key performance indicators calculated by reference to trading profit for planning, budgeting and reporting purposes and for its internal assessment of the operating performance of individual businesses within the Group.
(iv) Additional information on the allotment of equity securities for cashDuring the year, the Company issued 43,428 (2015: 60,881) ordinary shares with a nominal value of 10 53/66 pence per share (2015: 10 53/66 pence per share) to participants in the long term incentive plans and all-employee sharesave plans. The terms of issue were fixed on the respective dates of grant. The relevant dates of grants were between April 2008 and April 2015 and the market price on those dates was between £7.01 and £40.65.

Governance Other information
Wolseley plc Annual Report and Accounts 2016 113
Strategic report Financials
36 – Additional information continued
(v) Additional information about pensions and other long-term employee benefits
Description of plansThe principal UK defined benefit plan is the Wolseley Group Retirement Benefits Plan which provides benefits based on final pensionable salaries. This plan was closed to new entrants in 2009. The assets are held in separate trustee administered funds. The Group contribution rate is calculated on the Projected Unit Credit Method and agreed with an independent consulting actuary. The Group Retirement Benefits Plan was closed to future accrual on 31 December 2013 and was replaced by a defined contribution plan.
The principal plans operated for USA employees are defined contribution plans, which are established in accordance with US 401k rules. Companies contribute to both employee compensation deferral and profit sharing plans. The Group also operates two defined benefit plans in the United States which are closed to new entrants. One of the plans is funded and the majority of assets are held in trustee administered funds independent of the assets of the companies. The closed plans now provide a minimum pension guarantee in conjunction with a defined contribution plan. The contribution rate is calculated on the Projected Unit Credit Method as agreed with independent consulting actuaries.
In Canada, defined benefit plans and a defined contribution plan are operated. Most of the Canadian defined benefit plans are funded. The contribution rate is calculated on the Projected Unit Credit Method as agreed with independent consulting actuaries.
In Europe, both defined contribution and defined benefit plans are operated. Liabilities arising under defined benefit plans are calculated in accordance with actuarial advice.
Investment policyThe Group’s investment strategy for its funded post-employment plans is decided locally and, if relevant, by the trustees of the plan and takes account of the relevant statutory requirements. The Group’s objective for the investment strategy is to achieve a target rate of return in excess of the increase in the liabilities, while taking an acceptable amount of investment risk relative to the liabilities.
This objective is implemented by using specific allocations to a variety of asset classes that are expected over the long term to deliver the target rate of return. Most investment strategies have significant allocations to equities, with the intention that this will result in the ongoing cost to the Group of the post-employment plans being lower over the long term and within acceptable boundaries of risk.
For the UK plan, the strategy is to invest approximately 70 per cent of the assets in growth assets (comprising 50 per cent in equities and 20 per cent in other diversified growth assets) and 30 per cent in bonds. The investment strategy is subject to regular review by the plan trustees in consultation with the Company. For the overseas plans the investment strategy involves the investment in defined levels of predominantly equities with the remainder of the assets being invested in cash and bonds.
Investment riskThe present value of the UK defined benefit plan liability is calculated using a discount rate determined by reference to high quality corporate bond yields; if the actual return on plan assets is below this rate, it will decrease a net surplus or increase a net pension liability. Currently, the plan has a relatively balanced investment in equity securities, debt instruments and property. Due to the long-term nature of the plan liabilities, the trustees of the pension plan consider it appropriate that a reasonable portion of the plan assets should be invested in equity securities to leverage the return generated by the fund.
Interest riskA decrease in the bond interest rate will increase the UK plan liability and this will be partially offset by an increase in the value of the plan’s debt investments.
Longevity riskThe present value of the defined benefit obligation is calculated by reference to the best estimate of the mortality of the UK plan participants both during and after their employment. An increase in the life expectancy of the plan participants will increase the plan’s liability.
(vi) Additional information about share-based payment plansThe Group currently operates three types of discretionary plans and two types of all-employee sharesave plans.
Awards granted under the executive share option plans are subject to a condition such that they may not be exercised unless the growth in headline earnings per share over a period of three consecutive financial years exceeds the growth in the UK Retail Price Index over the same period by at least 9 per cent and consequently vest over a period of three years.
For historical awards granted under the long term incentive plan (“LTIP”), senior executives were awarded a variable number of shares depending on the level of total shareholder return over a three-year period relative to that of the FTSE 100. The maximum award under the LTIP is determined at grant date and then adjusted at vesting date in accordance with the market performance condition. The vesting period is three years.
For awards granted under the new long term incentive plan (“LTIP 2015”) senior executives are awarded a variable number of shares depending on three equally weighted conditions of: (1) level of total shareholder return over a three-year period relative to that of the FTSE 100; (2) growth in headline earnings per share over a period of three consecutive financial years, which must exceed the growth in the UK Retail Price Index over the same period by at least 9 per cent; and (3) a cumulative three-year figure of operating cash flow measured against the agreed three-year target. The vesting period is three years.
For awards granted to eligible employees (excluding Executive Directors) under the ordinary share plan, such employees may be granted a variable number of awards in any form or combination of options, restricted share awards, conditional share awards or phantom share awards up to a maximum of 100 per cent of their current salary. The vesting period is typically three years and there are no performance measures other than retained employment.
Awards granted under the all-employee sharesave plans vest over periods ranging from three to seven years, except for awards granted under the Employee Share Purchase Plan (“ESPP”) in the USA and Canada, which vest over a one-year period.
(vii) Additional information about the parent company of the GroupThe Company is incorporated in Jersey under the Companies (Jersey) Law 1991 and is headquartered in Switzerland. It operates as the ultimate parent company of the Wolseley Group. Its registered office is 26 New Street, St Helier, Jersey, JE2 3RA, Channel Islands.
The Group’s subsidiary undertakings are set out on pages 124 and 125.

Wolseley plc Annual Report and Accounts 2016114
Independent auditor’s report to the members of Wolseley plc
Independent auditor’s report to the members of Wolseley plc
Opinion on financial statements of Wolseley plc
In our opinion:
• the financial statements give a true and fair view of the state of the Group’s and of the Parent Company’s affairs as at 31 July 2016 and of the Group’s and the Parent Company’s profit for the year then ended;
• the Group financial statements have been properly prepared in accordance with International Financial Reporting Standards (IFRSs) as adopted by the European Union;
• the Parent Company financial statements have been properly prepared in accordance with United Kingdom Generally Accepted Accounting Practice, including FRS 101 “Reduced Disclosure Framework”; and
• the financial statements have been properly prepared in accordance with the Companies (Jersey) Law, 1991.
The financial statements comprise the Group Income Statement, the Group Statement of Comprehensive Income, the Parent Company Profit and Loss Account, the Group and Parent Company Balance Sheets, the Group Cash Flow Statement, the Group and Parent Company Statements of Changes in Equity and the related notes. The financial reporting framework that has been applied in the preparation of the Group financial statements is applicable law and IFRSs as adopted by the European Union. The financial reporting framework that has been applied in the preparation of the Parent Company financial statements is applicable law and United Kingdom Accounting Standards (United Kingdom Generally Accepted Accounting Practice), including FRS 101 “Reduced Disclosure Framework”.
Going concern and the Directors’ assessment of the principal risks that would threaten the solvency or liquidity of the Company
We have reviewed the Directors’ statement regarding the appropriateness of the going concern basis of accounting contained within note 2 to the financial statements on page 120 and the Directors’ statement on the longer-term viability of the Company contained within the principal risks and their management section on page 35.
We have nothing material to add or draw attention to in relation to:
• the Directors’ confirmation on page 53 that they have carried out a robust assessment of the principal risks facing the Company, including those that would threaten its business model, future performance, solvency or liquidity;
• the disclosures on pages 34 to 39 that describe those risks and explain how they are being managed or mitigated;
• the Directors’ statement in note 2 to the Company financial statements about whether they considered it appropriate to adopt the going concern basis of accounting in preparing them and their identification of any material uncertainties to the Company’s ability to continue to do so over a period of at least twelve months from the date of approval of the financial statements; and
• the Directors’ explanation on page 35 as to how they have assessed the prospects of the Company, over what period they have done so and why they consider that period to be appropriate, and their statement as to whether they have a reasonable expectation that the Company will be able to continue in operation and meet its liabilities as they fall due over the period of their assessment, including any related disclosures drawing attention to any necessary qualifications or assumptions.
We agreed with the Directors’ adoption of the going concern basis of accounting and we did not identify any such material uncertainties. However, because not all future events or conditions can be predicted, this statement is not a guarantee as to the Company’s ability to continue as a going concern.
Independence We are required to comply with the Financial Reporting Council’s Ethical Standards for Auditors and we confirm that we are independent of the Group and we have fulfilled our other ethical responsibilities in accordance with those standards. We also confirm we have not provided any of the prohibited non-audit services referred to in those standards.
Our assessment of risks of material misstatement
The assessed risks of material misstatement described below are those that had the greatest effect on our audit strategy, the allocation of resources in the audit and directing the efforts of the engagement team.
The key risks we identified are:
• Completeness of supplier rebates
• Goodwill and intangible asset carrying values
• Inventory valuation
Completeness of supplier rebates
Risk description As described in the Audit Committee report on page 51 and the Accounting policies in the notes to the Financial Statements on page 78, the Group recognises a reduction in cost of sales as a result of amounts receivable from suppliers in the form of rebate arrangements. Where the rebate arrangements are flat rate, there is limited judgement. However, a proportion of the rebate arrangements comprise annual volume rebates, for which the end of the period is often not coterminous with the Group’s year-end. Additionally, in some cases the rebate rises as a portion of purchases as higher quantities or values of the purchases are made.
Judgement is required in estimating the expected level of rebates for the rebate year, driven by the forecast purchase volumes. This requires a detailed understanding of the specific contractual arrangements themselves as well as complete and accurate source data to apply the arrangements to.
How the scope of our audit responded to the risk
We assessed the design and implementation of manual and automated controls over the recording of supplier rebate income. Our procedures on supplier rebates included:
• we interviewed a sample of Wolseley’s internal buyers to supplement our understanding of the key contractual rebate arrangements;
• we tested the accuracy of the amounts recognised by agreeing a sample to individual supplier agreements. We circularised a sample of suppliers to test whether the arrangements recorded were complete;
• we tested the completeness and accuracy of the inputs to the calculations for recording supplier rebates by agreement to supporting evidence, including historical volume data. We challenged the assumptions underlying management’s estimates of purchase volumes including looking at the historical accuracy of previous estimates and historical purchase trends and recalculation of rebates for a sample of suppliers;
• we performed margin analysis to understand trends in order to identify apparent anomalies which may indicate potential rebate income errors. Such anomalies were investigated to assess whether they were indicative of a misapplication of contractual terms or other calculation errors; and
• we also tested post year-end cash receipts, where relevant, to test the recoverability of amounts recorded.
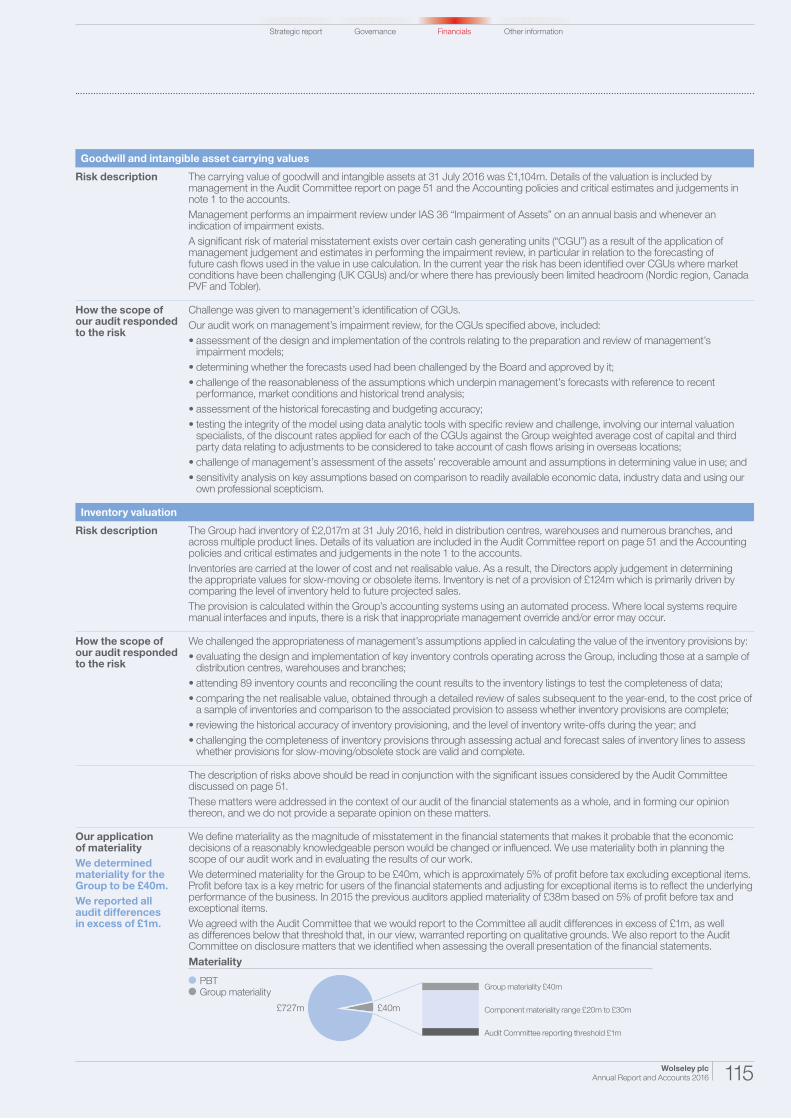
Governance Other information
Wolseley plc Annual Report and Accounts 2016 115
Strategic report Financials
Goodwill and intangible asset carrying values
Risk description The carrying value of goodwill and intangible assets at 31 July 2016 was £1,104m. Details of the valuation is included by management in the Audit Committee report on page 51 and the Accounting policies and critical estimates and judgements in note 1 to the accounts.
Management performs an impairment review under IAS 36 “Impairment of Assets” on an annual basis and whenever an indication of impairment exists.
A significant risk of material misstatement exists over certain cash generating units (“CGU”) as a result of the application of management judgement and estimates in performing the impairment review, in particular in relation to the forecasting of future cash flows used in the value in use calculation. In the current year the risk has been identified over CGUs where market conditions have been challenging (UK CGUs) and/or where there has previously been limited headroom (Nordic region, Canada PVF and Tobler).
How the scope of our audit responded to the risk
Challenge was given to management’s identification of CGUs.
Our audit work on management’s impairment review, for the CGUs specified above, included:
• assessment of the design and implementation of the controls relating to the preparation and review of management’s impairment models;
• determining whether the forecasts used had been challenged by the Board and approved by it;
• challenge of the reasonableness of the assumptions which underpin management’s forecasts with reference to recent performance, market conditions and historical trend analysis;
• assessment of the historical forecasting and budgeting accuracy;
• testing the integrity of the model using data analytic tools with specific review and challenge, involving our internal valuation specialists, of the discount rates applied for each of the CGUs against the Group weighted average cost of capital and third party data relating to adjustments to be considered to take account of cash flows arising in overseas locations;
• challenge of management’s assessment of the assets’ recoverable amount and assumptions in determining value in use; and
• sensitivity analysis on key assumptions based on comparison to readily available economic data, industry data and using our own professional scepticism.
Inventory valuation
Risk description The Group had inventory of £2,017m at 31 July 2016, held in distribution centres, warehouses and numerous branches, and across multiple product lines. Details of its valuation are included in the Audit Committee report on page 51 and the Accounting policies and critical estimates and judgements in the note 1 to the accounts.
Inventories are carried at the lower of cost and net realisable value. As a result, the Directors apply judgement in determining the appropriate values for slow-moving or obsolete items. Inventory is net of a provision of £124m which is primarily driven by comparing the level of inventory held to future projected sales.
The provision is calculated within the Group’s accounting systems using an automated process. Where local systems require manual interfaces and inputs, there is a risk that inappropriate management override and/or error may occur.
How the scope of our audit responded to the risk
We challenged the appropriateness of management’s assumptions applied in calculating the value of the inventory provisions by:
• evaluating the design and implementation of key inventory controls operating across the Group, including those at a sample of distribution centres, warehouses and branches;
• attending 89 inventory counts and reconciling the count results to the inventory listings to test the completeness of data;
• comparing the net realisable value, obtained through a detailed review of sales subsequent to the year-end, to the cost price of a sample of inventories and comparison to the associated provision to assess whether inventory provisions are complete;
• reviewing the historical accuracy of inventory provisioning, and the level of inventory write-offs during the year; and
• challenging the completeness of inventory provisions through assessing actual and forecast sales of inventory lines to assess whether provisions for slow-moving/obsolete stock are valid and complete.
The description of risks above should be read in conjunction with the significant issues considered by the Audit Committee discussed on page 51.
These matters were addressed in the context of our audit of the financial statements as a whole, and in forming our opinion thereon, and we do not provide a separate opinion on these matters.
Our application of materiality
We determined materiality for the Group to be £40m.
We reported all audit differences in excess of £1m.
We define materiality as the magnitude of misstatement in the financial statements that makes it probable that the economic decisions of a reasonably knowledgeable person would be changed or influenced. We use materiality both in planning the scope of our audit work and in evaluating the results of our work.
We determined materiality for the Group to be £40m, which is approximately 5% of profit before tax excluding exceptional items. Profit before tax is a key metric for users of the financial statements and adjusting for exceptional items is to reflect the underlying performance of the business. In 2015 the previous auditors applied materiality of £38m based on 5% of profit before tax and exceptional items.
We agreed with the Audit Committee that we would report to the Committee all audit differences in excess of £1m, as well as differences below that threshold that, in our view, warranted reporting on qualitative grounds. We also report to the Audit Committee on disclosure matters that we identified when assessing the overall presentation of the financial statements.
Audit Committee reporting threshold £1m
Materiality
£727m £40m Component materiality range £20m to £30m
Group materiality £40mPBTGroup materiality

Wolseley plc Annual Report and Accounts 2016116
Independent auditor’s report to the members of Wolseley plc continued
An overview of the scope of our audit
Our Group audit was scoped by obtaining an understanding of the Group and its environment, including group-wide controls, and assessing the risks of material misstatement at the Group level. Based on that assessment we focused our Group audit scope primarily on the audit work at nine locations. Eight of these were subject to a full audit and one was subject to specified audit procedures where the extent of our testing was based on our assessment of the risks of material misstatement and of the materiality of the Group’s operations at that location. These nine locations represent the principal business units and account for 96% of the Group’s revenue and 86% of the Group’s profit before tax. They were also selected to provide an appropriate basis for undertaking audit work to address the risks of material misstatement identified above.
Revenue Profit before tax Net assets
Full audit 96% 86% 99%
Analytical procedures 4% 14% 1%
At the Group level we also tested the consolidation process and carried out analytical procedures to confirm our conclusion that there were no significant risks of material misstatement of the aggregated financial information of the remaining components not subject to audit or audit of specified account balances.
The Group audit team continued to follow a programme of planned visits that has been designed so that a senior member of the Group audit team visits each of the most significant locations where the Group audit scope was focused every year, being USA, UK and Denmark. Our visit programme for other locations including Canada and Switzerland is that they are visited at least once every two years. In years when we do not visit a significant component we will include the component audit partner in our team briefing, discuss their risk assessment, and review documentation of the findings from their work. For all components we attend the local close meetings. Given this was our first year as auditors, we have visited all regions.
Opinion on other matters prescribed by our engagement letter
In our opinion:
• the part of the Directors’ Remuneration Report to be audited has been properly prepared in accordance with the provisions of the UK Companies Act 2006 as if that Act had applied to the Company; and
• the information given in the Strategic Report and the Directors’ Report for the financial year for which the financial statements are prepared is consistent with the financial statements.
Matters on which we are required to report by exception
Adequacy of explanations received and accounting recordsUnder the Companies (Jersey) Law, 1991 we are required to report to you if, in our opinion:
• we have not received all the information and explanations we require for our audit; or
• adequate accounting records have not been kept, or returns adequate for our audit have not been received from branches not visited by us; or
• the financial statements are not in agreement with the accounting records and returns.
We have nothing to report in respect of these matters.
Our duty to read other information in the Annual ReportUnder International Standards on Auditing (UK and Ireland), we are required to report to you if, in our opinion, information in the Annual Report is:
• materially inconsistent with the information in the audited financial statements; or
• apparently materially incorrect based on, or materially inconsistent with, our knowledge of the Group acquired in the course of performing our audit; or
• otherwise misleading.
In particular, we are required to consider whether we have identified any inconsistencies between our knowledge acquired during the audit and the Directors’ statement that they consider the Annual Report is fair, balanced and understandable and whether the Annual Report appropriately discloses those matters that we communicated to the Audit Committee which we consider should have been disclosed. We confirm that we have not identified any such inconsistencies or misleading statements.
Corporate governanceAlthough not required to do so, the Directors have voluntarily chosen to make a corporate governance statement detailing the extent of their compliance with the UK Corporate Governance Code. We reviewed the part of the Corporate Governance Statement relating to the Company’s compliance with certain provisions of the UK Corporate Governance Code. We have nothing to report arising from our review.

Governance Other information
Wolseley plc Annual Report and Accounts 2016 117
Strategic report Financials
Respective responsibilities of Directors and auditor
As explained more fully in the Directors’ Responsibilities Statement, the Directors are responsible for the preparation of the financial statements and for being satisfied that they give a true and fair view.
Our responsibility is to audit and express an opinion on the financial statements in accordance with applicable law and International Standards on Auditing (UK and Ireland). We also comply with International Standard on Quality Control 1 (UK and Ireland). Our audit methodology and tools aim to ensure that our quality control procedures are effective, understood and applied. Our quality controls and systems include our dedicated professional standards review team and independent partner reviews.
This report is made solely to the Company’s members, as a body, in accordance with Article 113A of the Companies (Jersey) Law, 1991. Our audit work has been undertaken so that we might state to the Company’s members those matters we are required to state to them in an auditor’s report and/or those further matters we have expressly agreed to report to them on in our engagement letter and for no other purpose. To the fullest extent permitted by law, we do not accept or assume responsibility to anyone other than the Company and the Company’s members as a body, for our audit work, for this report, or for the opinions we have formed.
Scope of the audit of the financial statements
An audit involves obtaining evidence about the amounts and disclosures in the financial statements sufficient to give reasonable assurance that the financial statements are free from material misstatement, whether caused by fraud or error. This includes an assessment of:
• whether the accounting policies are appropriate to the Group’s and the Parent Company’s circumstances and have been consistently applied and adequately disclosed;
• the reasonableness of significant accounting estimates made by the Directors; and
• the overall presentation of the financial statements. In addition, we read all the financial and non-financial information in the Annual Report to identify material inconsistencies with the audited financial statements and to identify any information that is apparently materially incorrect based on, or materially inconsistent with, the knowledge acquired by us in the course of performing the audit.
If we become aware of any apparent material misstatements or inconsistencies we consider the implications for our report.
Ian Wallerfor and on behalf of Deloitte LLP Chartered Accountants and Recognized Auditor London, UK 26 September 2016

Wolseley plc Annual Report and Accounts 2016118
Company profit and loss account
2016 £m
2015 £m
Administrative expenses (11) (13)
Operating loss (11) (13)
Income from shares in Group undertakings 600 639
Profit on ordinary activities before interest 589 626
Interest payable and similar charges (12) (10)
Profit before tax 577 616
Tax – –
Profit for the financial year 577 616
Company statement of changes in equity
Notes
Called up share
capital£m
Share premium account
£m
Treasury shares
£m
Own shares reserve
£m
Profit and loss account
£m
Total shareholders’
equity£m
Shareholders’ equity at 1 August 2014 29 41 – (93) 7,097 7,074
Profit for the year – – – – 616 616
New share capital subscribed 7 – 1 – – – 1
Purchase of own shares by Employee Benefit Trusts 9 – – – (15) – (15)
Issue of own shares by Employee Benefit Trusts – – – 45 (40) 5
Credit to equity for share-based payments 10 – – – – 20 20
Purchase of Treasury shares 8 – – (250) – – (250)
Disposal of Treasury shares – – 10 – (2) 8
Dividends paid – – – – (222) (222)
Shareholders’ equity at 31 July 2015 29 42 (240) (63) 7,469 7,237
Profit for the year – – – – 577 577
Purchase of own shares by Employee Benefit Trusts 9 – – – (14) – (14)
Issue of own shares by Employee Benefit Trusts – – – 20 (19) 1
Credit to equity for share-based payments 10 – – – – 20 20
Purchase of Treasury shares 8 – – (300) – – (300)
Disposal of Treasury shares – – 24 – (10) 14
Dividends paid – – – – (238) (238)
Shareholders’ equity at 31 July 2016 29 42 (516) (57) 7,799 7,297
Year ended 31 July 2016

Governance Other information
Wolseley plc Annual Report and Accounts 2016 119
Strategic report Financials
Company balance sheet
Notes2016
£m2015
£m
Fixed assets
Investments in subsidiaries 3 7,945 7,607
7,945 7,607
Current assets
Debtors: amounts falling due within one year 4 2 1
Cash at bank and in-hand – 3
2 4
Creditors: amounts falling due within one year 5 (650) (374)
Net current liabilities (648) (370)
Total assets less current liabilities 7,297 7,237
Net assets 7,297 7,237
Capital and reserves
Called up share capital 6 29 29
Share premium account 7 42 42
Treasury shares 8 (516) (240)
Own shares reserve 9 (57) (63)
Profit and loss account 7,799 7,469
Total shareholders’ equity 7,297 7,237
The accompanying notes are an integral part of these Company financial statements.
The Company financial statements on pages 118 to 121 were approved by the Board of Directors on 26 September 2016 and were signed on its behalf by
John Martin Group Chief Executive
Year ended 31 July 2016

Year ended 31 July 2016
Wolseley plc Annual Report and Accounts 2016120
Notes to the Company financial statements
1 – Corporate information
Wolseley plc (the “Company”) was incorporated and registered in Jersey on 28 September 2010 under the Jersey Companies Law as a public company limited by shares under the name Wolseley plc with registered number 106605. The principal legislation under which the Company operates is the Companies (Jersey) Law 1991, as amended, and regulations made thereunder. The address of its registered office is 26 New Street, St Helier, Jersey, JE2 3RA, Channel Islands. It is headquartered in Switzerland.
The principal activity of the Company is to act as the ultimate holding company of the Wolseley Group of companies.
2 – Company accounting policies
Basis of accountingThe Company meets the definition of a qualifying entity under FRS 100 (Financial Reporting Standard 100) issued by the Financial Reporting Council (“FRC”). Accordingly, in the year ended 31 July 2016 the Company has undergone transition from reporting under UK GAAP to FRS 101 as issued by the FRC. The financial statements have been prepared in accordance with FRS 101 (Financial Reporting Standard 101) “Reduced Disclosure Framework” as issued by the FRC. This transition is not considered to have had a material effect on the financial statements. There was no impact on the prior year position as a result of the transition.
As permitted by FRS 101, the Company has taken advantage of the disclosure exemptions available under that standard in relation to share-based payments, financial instruments, capital management, presentation of comparative information in respect of certain assets, presentation of a cash flow statement, standards not yet effective, impairment of assets and related party transactions.
The financial statements have been prepared on the historical cost basis and on the going concern basis.
Note 3 (Operating costs) on page 82, note 8 (Dividends) on page 85, note 26 (Share capital) on page 99 and note 27 (Share-based payments) on page 100 of the Wolseley plc consolidated financial statements form part of these financial statements.
Foreign currenciesThe financial statements are presented in pounds sterling which is the functional currency of the Company.
The cost of the Company’s investments in overseas subsidiary undertakings is translated into sterling at the rate ruling at the date of investment.
Foreign currency transactions entered into during the year are translated into sterling at the rates of exchange ruling on the dates of the transactions. Monetary assets and liabilities denominated in foreign currencies are retranslated at the rate of exchange ruling at the balance sheet date. All currency translation differences are charged or credited to the profit and loss account.
Investments in subsidiariesFixed asset investments are recorded at cost less provision for impairment. The Company assesses at each balance sheet date whether there is objective evidence that an investment or a group of investments is impaired.
Cash at bank and in-handCash at bank and in-hand includes cash in-hand and deposits held with banks which are readily convertible to known amounts of cash. Bank overdrafts are shown within borrowings in current liabilities on the balance sheet to the extent there is no right of offset or intention to net settle with cash balances.
Share capitalThe Company has one class of shares, ordinary shares, which are classified as equity. Incremental costs directly attributable to the issue of new shares or options are shown in equity as a deduction from the proceeds, net of tax.
Where the Company or one of the Company’s trusts purchases the Company’s equity share capital, the consideration paid, including any directly attributable incremental costs (net of tax), is deducted from equity attributable to the Company’s equity holders until the shares are cancelled, reissued or disposed of. Where such shares are subsequently disposed or reissued, any consideration received, net of any directly attributable incremental transaction costs and the related tax effects, is included in equity attributable to the Company’s equity holders.
Share-based paymentsShare-based incentives are provided to employees under the Company’s executive share option, long term incentive and share purchase and ordinary share plans. The Company recognises a compensation cost in respect of these plans that is based on the fair value of the awards, measured using Binomial and Monte Carlo valuation methodologies. For equity-settled plans, the fair value is determined at the date of grant (including the impact of non-vesting conditions such as requirement for employees to save) and is not subsequently remeasured unless the conditions on which the award was granted are modified. Generally, the compensation cost is recognised on a straight-line basis over the vesting period. Adjustments are made to reflect expected and actual forfeitures during the vesting period due to the failure to satisfy service conditions or achieve non-market performance conditions.
Dividends payableDividends on ordinary shares are recognised in the Company’s financial statements in the period in which the dividends are paid or approved by the shareholders of the Company.
TaxWolseley plc is taxed as a holding company in Switzerland so no tax is due at cantonal or communal level. The tax charge is therefore made up of federal tax and capital tax. Federal tax is levied on profits in the year subject to any participation exemption for qualifying dividends from subsidiaries. Capital tax is based on the value of the Company’s assets, primarily its investment in Wolseley Limited and Wolseley Holdings (Switzerland) AG.
3 – Fixed asset investments
Cost £m
At 1 August 2015 7,607
Additions 338
At 31 July 2016 7,945
All of the above investments are in unlisted shares. The Directors believe that the carrying value of the investments is supported by the recoverable amount of their underlying assets.
The Company’s direct holdings in subsidiary undertakings as at 31 July 2016 were as follows:
Company
Country of registration and operation
Principal activity
Percentage of ordinary
shares held
Wolseley Limited England and Wales Investment 100%
Wolseley de Puerto Rico, Inc.
Commonwealth of Puerto Rico
Distributor of industrial products
100%
Wolseley Holdings (Switzerland) AG
Switzerland Investment 100%
Details of the subsidiary undertakings of the Company, including those that are held indirectly, are listed on pages 124 and 125 of the Wolseley plc Annual Report.

Governance Other information
Wolseley plc Annual Report and Accounts 2016 121
Strategic report Financials
4 – Debtors: amounts falling due within one year
2016 £m
2015 £m
Other debtors 2 1
Total 2 1
The fair value of amounts included in debtors approximates to book value.
5 – Creditors: amounts falling due within one year
2016 £m
2015 £m
Other creditors 3 1
Amounts owed to Group companies 647 373
Total 650 374
The fair value of amounts included in creditors approximates to book value. Amounts owed to Group companies are interest bearing, carry an interest rate of 1.2 per cent (2015: 1.0 per cent) and are payable on demand.
6 – Share capital
Details of the Company’s share capital are set out in note 26 on page 99 to the Wolseley plc consolidated financial statements.
7 – Share premium account
Details of new share capital subscribed are set out in note 26 on page 99 to the Wolseley plc consolidated financial statements.
8 – Treasury shares
During the year the Group completed a share buyback programme of £300 million (2015: £250 million). Further details on Treasury shares are set out in note 26 on page 99 to the Wolseley plc consolidated financial statements.
9 – Own shares reserve
During the year, the Company contributed £11 million (2015: £15 million) of cash to its US Employee Benefit Trust and £3 million (2015: £nil) to its Jersey Employee Benefit Trust to purchase shares. The Treasury shares held by both of these Trusts have been consolidated within the Company’s balance sheet as at 31 July 2016 and amount to £57 million (2015: £63 million).
10 – Share-based payments
Details of share awards granted by Group companies to employees, and that remain outstanding over the Company’s shares are set out in note 27 on page 100 to the Wolseley plc consolidated financial statements. The net profit and loss charge to the Company for equity-settled share-based payments was £nil (2015: £nil). The Company charged the full amount incurred for equity-settled share-based payments of £20 million (2015: £20 million) to its subsidiary undertakings.
11 – Contingent liabilities
Provision is made for the Directors’ best estimate of known claims and legal actions in progress. The Company takes legal advice as to the likelihood of success of claims and actions and no provision is made where the Directors consider, based on that advice, that the action is unlikely to succeed or a sufficiently reliable estimate of the potential obligation cannot be made.
In addition, the Company has given certain banks and lenders authority to transfer at any time any sum outstanding to its credit against or towards satisfaction of its liability to those banks of certain subsidiary undertakings. The Company has also given indemnities and warranties to the purchasers of businesses from the Company and certain Group companies in respect of which no material liabilities are expected to arise.
The Company acts as a guarantor for the Group’s UK defined benefit pension plan, which is disclosed in note 25 on pages 96 to 98 to the Wolseley plc consolidated financial statements.
12 – Employees, employee costs and auditor’s remuneration
The average number of employees of the Company in the year ended 31 July 2016 was one (2015: one). Other employees of Group companies were seconded or assigned to the Company in the period in order to fulfil their duties or to carry out the work of the Company. Each of the Non Executive Directors of the Company has an appointment letter with the Company, and the Executive Directors and certain other senior managers of the Group have assignment letters in place with the Company. Total employment costs of the Company for the period, including Non Executive Directors and seconded employees, were £2 million (2015: £1 million).
Fees payable to the auditor for the audit of the Company’s financial statements are set out in note 3 on page 82 to the Wolseley plc consolidated financial statements.
13 – Dividends
Details of the Company’s dividends are set out in note 8 on page 85 to the Wolseley plc consolidated financial statements.
14 – Related party transactions
The Company is exempt under the terms of FRS 101 from disclosing related party transactions with entities that are 100 per cent owned by Wolseley plc.
15 – Post-balance sheet events
Details of post-balance sheet events are given in note 35 on page 105 of the Wolseley plc consolidated financial statements.

Wolseley plc Annual Report and Accounts 2016122
Five year summary
2016 £m
2015 £m
2014£m
2013 £m
2012£m
Revenue
USA 9,456 8,343 7,070 6,785 6,168
UK 1,996 1,987 1,853 1,769 1,898
Nordic 1,881 1,864 1,935 1,916 2,125
Canada and Central Europe 1,097 1,138 1,413 1,568 1,564
Group 14,430 13,332 12,271 12,038 11,755
Trading profit
USA 775 681 546 492 388
UK 74 90 96 95 94
Nordic 59 71 73 86 94
Canada and Central Europe 53 55 72 80 79
Central and other costs (45) (43) (35) (42) (28)
Group 916 854 752 711 627
Amortisation of acquired intangible assets (53) (56) (46) (55) (59)
Impairment of goodwill and acquired intangible assets (94) (238) – (10) (220)
Exceptional items (2) (4) (1) (40) (41)
Operating profit 767 556 705 606 307
Net interest payable (40) (48) (29) (31) (13)
Associate – – – – 16
Profit before tax 727 508 676 575 310
Tax charge (231) (187) (194) (176) (138)
Profit on ordinary activities after tax from continuing operations 496 321 482 399 172
Profit/(loss) from discontinued operations 154 (108) 22 (103) (115)
Profit attributable to equity shareholders 650 213 504 296 57
Ordinary dividends (238) (222) (191) (173) (142)
Special dividend – – (298) (348) –
Total dividends (238) (222) (489) (521) (142)
Net assets employed
Intangible fixed assets 1,104 1,011 1,198 1,246 1,160
Property, plant and equipment 1,434 1,164 1,226 1,263 1,195
Other net assets, excluding liquid funds 1,301 1,230 1,173 955 733
3,839 3,405 3,597 3,464 3,088
Financed by
Share capital 29 29 29 28 28
Share premium 42 42 41 27 19
Foreign currency translation reserve 380 117 127 402 244
Profit and loss account and other reserves 2,452 2,412 2,689 2,596 2,842
Shareholders’ equity 2,903 2,600 2,886 3,053 3,133
Net debt/(cash) 936 805 711 411 (45)
Net assets employed 3,839 3,405 3,597 3,464 3,088

Governance Financials
Wolseley plc Annual Report and Accounts 2016 123
Strategic report Other information
Continuing operations (unless otherwise stated) 2016 2015 2014 2013 2012
Like-for-like revenue growth 2.4% 6.8% 4.4% 3.8% 4.4%
Gross margin 28.3% 28.0% 27.8% 27.6% 27.1%
Trading margin 6.4% 6.4% 6.1% 5.9% 5.3%
Headline earnings per share 247.7p 230.2p 195.0p 175.1p 156.8p
Basic earnings per share from continuing and discontinued operations 256.4p 82.1p 189.8p 107.4p 20.1p
Dividends per share (in respect of the financial year) 100.0p 90.75p 82.5p 66.0p 60.0p
Special dividend per share – – 110.0p 122.0p –
Cover for ordinary dividends 2.5 2.5 2.4 2.7 2.6
Net tangible assets per ordinary share 673.8p 595.1p 632.1p 659.9p 689.9p
Return on capital employed (note 1) 33.4% 33.5% 30.7% 32.2% 29.3%
Return on gross capital employed (note 2) 17.2% 16.9% 14.8% 14.3% 12.6%
Average number of employees 38,175 37,054 35,535 34,929 36,150
Number of shares in issue at year-end (million) 267 267 267 274 286
Number of branches at year-end
Continuing operations 2,754 2,739 2,711 2,730 2,847
Discontinued operations – 168 169 298 313
Total branches 2,754 2,907 2,880 3,028 3,160
US dollar translation rate
Income statement/profit and loss 1.46 1.56 1.64 1.56 1.58
Balance sheet 1.32 1.56 1.69 1.52 1.57
Canadian dollar translation rate
Income statement/profit and loss 1.94 1.86 1.76 1.57 1.59
Balance sheet 1.72 2.04 1.84 1.56 1.57
Euro translation rate
Income statement/profit and loss 1.31 1.33 1.21 1.20 1.19
Balance sheet 1.18 1.42 1.26 1.14 1.27
Note 1. Return on capital employed is the ratio of trading profit to the average year-end aggregate of shareholders’ funds and adjusted net debt excluding goodwill and other acquired intangible assets. Return on capital employed for 2016 has been calculated as follows:
Capital employed
2016 £m
Capital employed
2015 £m
Average capital
employed £m
Trading profit
£m
Return on capital
employed
Net debt 936 805
Year-end working capital adjustment 120 130
1,056 935
Shareholders’ equity 2,903 2,600
Goodwill and other acquired intangible assets (1,045) (968)
2,914 2,567 2,741 916 33.4%
Note 2. Return on gross capital employed is the ratio of trading profit to the average year-end aggregate of shareholders’ funds, adjusted net debt and cumulative goodwill and other acquired intangible assets written off. The cumulative write-offs to goodwill and other acquired intangible assets including amounts in assets held for sale at 31 July 2016 is £1,646 million (2015: £1,505 million) and average gross capital employed for 2016 is calculated as £5,323 million.

Wolseley plc Annual Report and Accounts 2016124
Group companies
The Wolseley Group comprises a large number of companies. This list includes only those subsidiaries which in the Directors’ opinion principally affect the figures shown in the consolidated financial statements. A full list of subsidiary undertakings is detailed below.
Principal subsidiary undertakings
Company name Principal activity Country of incorporation
Beijer Byggmaterial AB Operating company Sweden
Capstone Global Solutions AG Operating company Switzerland
DT Group Holdings A/S Operating company Denmark
Ferguson Enterprises Inc Operating company USA
Neumann Bygg AS Operating company Norway
DT Finland Oy Operating company Finland
Tobler Haustechnik AG Operating company Switzerland
Wasco Holding B.V. Operating company The Netherlands
Wolseley Canada Inc. Operating company Canada
Wolseley UK Limited Operating company England and Wales
Wolseley Capital, Inc. Financing company USA
Wolseley Finance (Switzerland) AG Financing company Switzerland
Wolseley Holdings (Switzerland) AG* Investment company Switzerland
Wolseley (Group Services) Limited Service company England and Wales
Wolseley Insurance Limited Operating company Isle of Man
Wolseley Investments North America, Inc. Investment company USA
Wolseley Limited * Investment company England and Wales
(1) Shareholdings in companies marked * are held 100 per cent directly by Wolseley plc. The proportion of the voting rights in the subsidiary undertakings held directly by Wolseley plc do not differ from the proportion of the ordinary shares held. All other shareholdings in the above mentioned companies are held by intermediate subsidiary undertakings.
(2) All shareholdings in the above subsidiary undertakings are of ordinary shares or equity capital.
(3) A full list of related undertakings of Wolseley Limited is included in its Annual Return submitted to the UK Registrar of Companies.
(4) All subsidiary undertakings have been included in the consolidation.
Full list of subsidiary undertakingsA full list of subsidiaries, joint ventures and companies in which a Wolseley Group company has a controlling interest as at 31 July 2016. The country of incorporation and the effective percentage of equity owned (if less than 100 per cent) is also detailed below. Unless otherwise noted, the share capital comprises ordinary shares which are indirectly held by Wolseley plc.
Fully owned subsidiaries
893111 Canada Inc. (Canada)(x)
A C Electrical Holdings Limited (England)(ix)
A C Electrical Wholesale Limited (England)(iii)
A C Ferguson Limited (Scotland)(ii)(iii)
Advancechief Limited (England)(ii)(iii)
B Holding SAS (France)(iii)
B Participations SAS (France)(iii)
Beijer Byggmaterial AB (Sweden)(iii)
Beijer Byggmaterial i Uppsaala AB (Sweden)(iii)
British Fittings Central Limited (England)(ii)(iii)
British Fittings Company (North Eastern) Limited (England)(ii)(ix)
British Fittings Group Limited (England)(ii)(iii)
British Fittings Limited (England)(ii)(iii)
Broughton’s Limited (England)(ii)(iii)
Build Center Limited (England)(ii)(iii)
Build.com, Inc.(US)(ix)
Builder Center Limited (England)(ii)(iii)
Building & Engineering Plastics Limited (England)(ii)(iii)
Capstone Global Solutions AG (Switzerland)(iii)
Caselco Limited (England)(ii)(iii)
Clayton International, LLC (US)(xii)
Controls Center Limited (England)(ii)(ix)
Crew-Davis Limited (England)(ii)(iii)
Dansk Braendimprægnering A/S (Denmark)(iii)
Davidson Group Leasing Co. LLC (US)(xii)
Drain Center Limited (England)(ii)(iii)
DT 1 A/S (Denmark)(ii)(iii)
DT 2 A/S (Denmark)(ii)(iii)
DT 3 A/S (Denmark)(ii)(iii)
DT 4 A/S (Denmark)(ii)(iii)
DT 5 A/S (Denmark)(ii)(iii)
DT Finland Oy (Finland)(iii)
DT Group Danmark A/S (Denmark)(iii)
DT Group Holdings A/S(Denmark)(iii)
DT Holding (Sweden) AB (Sweden)(iii)
DT Holding 1 AS (Denmark)(iii)
Electro Energy A/S (Denmark)(iii)
Endries International Canada Inc (Canada)(iii)
Endries International de Mexico, S.A. de C.V. (Mexico)(iv)
Endries International Europe BV (Netherlands)(iii)
Endries International, Inc. (US)(ix)
Energy & Process Corporation (US)(x)
Ferguson Enterprises Inc (US)(x)
Ferguson Enterprises Real Estate, Inc (US)(iii)
Ferguson Fire & Fabrication Inc. (US)(iii)
Ferguson Panama, S.A. (Panama)(x)
Ferguson Receivables, LLC. (US)(x)
Firstbase Timber Limited (England)(ii)(iii)
Fusion Provida Holdco Limited (England)(iii)
Fusion Provida UK Limited (England)(iii)
G. L. Headley Limited (England)(ii)(iii)
Galley Matrix Limited (England)(ii)(iii)
Glegg & Thomson Limited (Scotland)(ii)(iii)
Greenhow & Welch Limited (England)(ii)(iii)(iv)
Gunn Bros. (Builders Merchants) Limited (England)(ii)(iii)
H.P. Products Corporation (US)(x)
H.R. Sandvold AS (Norway)(iii)
Hall & Co. Limited (England)(ii)(iii)
Health Equipment Hire Limited (England)(ii)(iii)
Heating Replacement Parts & Controls Limited (England)(ii)(iii)
Heatmerchants Limited (England)(ii)(iii)
Het Onderdeel BV (Netherlands)(iii)
Hobro Ny Trælast A/S (Denmark)(iii)
Home Outlet Online Limited (England)(iii)
HP Logistics, Inc. (US)(x)
Huggjärnet 6 Kommanditbolag (Sweden)(xiii)
J F Lord Limited (England)(ii)(iii)
Julise Limited (England)(ii)(iii)
Keramikland AG (Switzerland)(iii)
King & Company (1744) Limited (England)(ii)(iii)
Governance Financials
Wolseley plc Annual Report and Accounts 2016 125
Strategic report Other information
Fully owned subsidiaries (continued)
Kommanditbolaget Näringen 8:4 (Sweden)(xiii)
Lindera Limited (Northern Ireland)(ii)(iii)
Living Direct, Inc. (US)(x)
Lygon Holdings Limited (England)(ii)(ix)
M. A. Ray & Sons Limited (England)(ii)(iii)
Melanie Limited (England)(ii)(iii)
MPS Builders Merchants Limited (England)(iii)
nettofox.ch AG (Switzerland)(iii)
Neumann Bygg AS (Norway)(iii)
Nevill Long Limited (England)(iii)
Ningbo Capstone Service Solutions Company Limited (China)(iii)
Northern Heating Limited (Scotland)(ii)(iii)
Northern Heating Supplies Limited (Scotland)(ii)(iii)
Nu-Way Heating Plants Limited (England)(ii)(iii)
O.B.C. Limited (England)(ii)(iii)
O.B.C. Limited (Northern Ireland)(ii)(iii)
Oil Burner Components Limited (England)(ii)(iii)
P.D.M. (Plumbers Merchants) Limited (Scotland)(ii)(iii)
Parts Center Limited (England)(ii)(iii)
Pat Murphy Industrial (Sales & Service) Limited (Republic of Ireland)(iii)
PB&M SAS (France)(iii)
Pipeline Controls Limited (England)(ii)(iii)
Plumb-Center Limited (England)(ii)(iii)
Power Equipment Direct Inc. (US)(x)
Promandis Limited (England)(ii)(iii)
Reay Electrical Distributors Limited (England)(ii)(iii)
Rosco Industrial Limited (Scotland)(ii)(iii)
Sellers of Leeds (Group Services) Limited (England)(ii)(iii)
Sellers of Leeds International Limited (England)(ii)(iii)
Sellers of Leeds Limited (England)(ix)
SEMSCO Barbados, LLC (US)(ii)(x)
Shawmac Limited (Northern Ireland)(ii)(ix)
Sindberg Eksport A/S (Denmark)(iii)
Soak B.V. (Netherlands)(ii)(iii)
St. Nicholas Finance Limited (England)(ii)(ix)
STARK Føroyar PF (Denmark)(iii)
Stark Kalaallit Nunaat A/S (Greenland)(iii)
Starkki Property Oy (Finland)(iii)
Stock Loan Services LLC (US)(xii)
T & R Electrical Wholesalers Ltd (England)(iii)
Tellum Construction, LLC (US)(xii)
Thames Finance Company Limited (England)(ii)(iii)
Thomson Brothers Limited (Scotland)(iii)
Tobler Haustechnik AG (Switzerland)(iii)
Uni-Rents Limited (England)(ii)(iii)
Utility Power Systems Limited (England)(vi)
Wasco Distributiecentrum B.V. (Netherlands)(iii)
Wasco Energie Centrum B.V. (Netherlands)(iii)
Wasco Groothandelsgroep B.V. (Netherlands)(iii)
Wasco Holding B.V. (Netherlands)(iii)
Wasco Twello B.V. (Netherlands)(iii)
Westile (Aberdeen) Limited (Scotland)(ii)(iii)
Wholesale Supplies (C.I.) Ltd (Jersey)(iii)(v)
William Wilson & Co. (Aberdeen) Limited (Scotland)(ii)(iii)
William Wilson & Company (Glasgow) Limited (Scotland)(ii)(iii)
William Wilson (Rugby) Limited (England)(ii)(iii)
William Wilson Holdings Limited (Scotland)(iii)(vi)
William Wilson Ltd (Scotland)(iii)
WM. C. Yuille & Company Limited (Scotland)(ii)(iii)
Wolseley (Barbados) Ltd (Barbados)(iii)
Wolseley (Group Services) Limited (England)(iii)
Wolseley Bristol Limited (England)(ii)(iii)
Wolseley Canada Inc (Canada)(x)
Wolseley Capital, Inc. (US)(x)
Wolseley Centers Limited (England)(ii)(iii)
Wolseley Centres Limited (England)(ii)(iii)
Wolseley de Puerto Rico, Inc. (Puerto Rico)(i)(x)
Wolseley Developments Limited (England)(ii)(iii)
Wolseley Directors Limited (England)(ii)(iii)
Wolseley ECD Limited (Northern Ireland)(ii)(iii)
Wolseley ECL Limited (England)(ii)(iii)
Wolseley Engineering Limited (England)(ii)(iii)
Wolseley Europe Limited (England)(iii)
Wolseley Finance (Isle of Man) Limited (Isle of Man)(ii)(ix)(xiv)
Wolseley Finance (Switzerland) AG (Switzerland)(iii)
Wolseley Finance (Thames) Limited (England)(ii)(iii)
Wolseley Finance (Theale) Limited (England)(ii)(vii)
Wolseley France Bois et Matériaux SNC (France)(iii)
Wolseley France SAS (France)(iii)
Wolseley Green Deal Services Limited (England)(iii)
Wolseley Group Holdings Limited (England)(iii)
Wolseley Haworth Limited (England)(iii)
Wolseley Holding A/S (Denmark)(iii)
Wolseley Holdings (Ireland) (Republic of Ireland)(ii)(iii)(xiv)
Wolseley Holdings (Switzerland) AG (Switzerland)(i)(iii)
Wolseley Holdings Canada Inc. (Canada)(xi)
Wolseley Industrial Canada Inc. (Canada)(iii)
Wolseley Insurance Limited (Isle of Man)(ix)
Wolseley Integrated de Mexico, S.A. de C.V. (Mexico)(iv)
Wolseley Investments Limited (England)(ii)(iii)
Wolseley Investments North America, Inc. (US)(iii)
Wolseley Investments, Inc. (US)(iii)
Wolseley Liegenschaftsverwaltung GmbH (Austria)(iii)
Wolseley Limited (England)(i)(iii)
Wolseley NA Construction Services, LLC (US)(xii)
Wolseley Nordic Holdings AB (Sweden)(iii)
Wolseley North America, Inc. (US)(ii)(iii)
Wolseley Overseas Limited (England)(iii)
Wolseley Pension Trustees Limited (England)(ii)(iii)
Wolseley Properties Limited (England)(ii)(iii)
Wolseley QUEST Limited (England)(ii)(iii)
Wolseley Raven Limited (England)(ii)(iii)
Wolseley Sourcing (Switzerland) AG (Switzerland)(iii)
Wolseley Treasury (USD) (England)(iii)
Wolseley Trinidad Ltd (Trinidad and Tobago)(iii)
Wolseley UK Directors Limited (England)(iii)
Wolseley UK Finance Limited (Guernsey)(ii)(iii)(xiv)
Wolseley UK Limited (England)(ix)
Wolseley Utilities Limited (England)(iii)
Wolseley-Hughes Limited (England)(ii)(iii)
Wolseley-Hughes Merchants Limited (England)(ii)(iii)
Wright (Bedford) Limited (England)(ii)(iii)
Yorkshire Heating Supplies Limited (England)(ii)(iii)
Joint venturesBrabyggare Sverige AB (Sweden)(iii)
Controlling interestsLuxury for Less Limited (England, 68%)(viii)
SCI de Lhoumaille (France, 53%)(iii)
Shanghai Du De International Trading Company (China)(iii)(xv)
Notes:
(i) Directly owned by Wolseley plc
(ii) Dormant
(iii) Ownership held in ordinary shares
(iv) Ownership held in class of A shares
(v) Ownership held in class of B Shares
(vi) Ownership held in classes of A and B shares
(vii) Ownership held in classes of A, B, C and D shares
(viii) Ownership held in classes of A1, A2, B, C, D, E, G shares
(ix) Ownership held in ordinary and preference shares
(x) Ownership held in common stock
(xi) Ownership held in common stock and preferred stock
(xii) Ownership held as membership interests
(xiii) Ownership held as partnership interests
(xiv) Companies controlled by the Group based on management’s assessment
(xv) Ownership held 100% by Luxury for Less Limited