Embed Size (px)
Citation preview

J-COAL
Strategic ReportThe New Role of Coal-FiredPower Plant in the Era ofEnergy Transition
August 2021

Strategic Report on the New Role of Coal-Fired Power Plant in the
Era of Energy Transition
August 2021
Strategic Report on the New Role of Coal-fired Power Plant in the Era of Energy Transition
i
Foreword
We are pleased to present the Strategic Report on the New Role of Coal-Fired Power Plant
in the Era of Energy Transition which was developed by the Japan Coal Frontier Organization (JCOAL)
Team and the ASEAN Centre for Energy (ACE) in close cooperation with the ASEAN Forum on Coal
(AFOC).
From the result of the 6th ASEAN Energy Outlook, it was found that coal has been and will
continue to play a crucial role in ensuring the steady growth of many ASEAN Member states.
However, with the need for the ASEAN region to transition into low-carbon power generation, ACE
deemed that now is the time to reidentify the role of coal in the coming era of the energy transition.
This strategic report aims to serve as a reference for the ASEAN Member States in identifying
available and emerging clean coal technologies, and policies that could promote its wider adoption,
in order to support the global action towards low carbon transition while maintaining energy security
and energy resilience in the region.
This report includes a review of the existing coal and renewable energy policies in the ASEAN
Member States (AMS) and introduced the use of the Grid Fluctuation Index (GFI), a tool developed
by JCOAL, to determine when and to what extent a grid would possibly experience fluctuation given
the current and projected capacity additions. It also discussed solutions that allow flexible operations
– techniques that have worked effectively in Japan and countries with similar market systems; and
highlights the importance of enhanced pollution and emission regulation on the continuous utilisation
of the existing coal fleet. To maintain the sustainable use of coal in the ASEAN region, this report
also recommends policy developments on increased HELE utilisation, enhanced pollution and
emission regulation, and carbon capture, utilisation, and storage (CCUS) deployment.
I highly appreciate the authors, contributors, and reviewers who have worked hard in
developing this report. Appreciation to Mr. Osamu Tsukamoto, the President of JCOAL, with his
leadership, we had initiated this joint strategic report as part of our result discussion on the future of
energy in ASEAN.
We hope that this report will be a valuable resource to advance the adoption of clean coal
technologies (CCT) in the region in parallel with the use of renewable energy and energy-efficient
technologies.
Dr. Nuki Agya Utama
Executive Director, ACE

Strategic Report on the New Role of Coal-fired Power Plant in the Era of Energy Transition
ii
Acknowledgments
The Strategic Report on the New Role of Coal-Fired Power Plant in the Era of Energy Transition was
prepared by the Japan Coal Frontier Organization (JCOAL) Team and the ASEAN Centre for Energy
(ACE) in close cooperation with the ASEAN Forum on Coal (AFOC).
In JCOAL, this report is directed by Mr. Osamu Tsukamoto; main authors are Takeharu Hasegawa,
Hiroaki Kanemoto, Dr. Kazuyuki Murakami, Masahiro Ozawa, Shinjiro Teuchi, Yamada Fumiko, and
Kazuhiro Watanabe.
In ACE, this report is directed by Dr. Nuki Agya Utama; main authors are Alnie Demoral, Dr. Andy
Tirta, Muhammad Oktada Hilman, Muhammad Rizki Kresnawan, Sandy Fajrian, Silvira Ayu Rosalia,
Dr. Tharinya Supasa, and Yudiandra Yuwono; other contributors are Amira Bilqis, Iqlima Fuqoha, Rika
Safrina, Tabita Natasha Wijaya.
This report also received significant review and input from Dr. Akbar Swandaru, Beni Suryadi, Rizky
Aditya Putra, and Septia Buntara.
Peer reviews were conducted by the members of the ASEAN Forum on Coal (AFOC).
Cover layout by Bayu Surya Prayogie (ACE) and Nella Nabila (ACE).

Strategic Report on the New Role of Coal-fired Power Plant in the Era of Energy Transition
iii
Abbreviations 1
ACE ASEAN Centre for Energy
AEDS ASEAN Energy Database System
AIMS ASEAN Interconnection Masterplan Study
AMS ASEAN Member States
APAEC ASEAN Plan of Action for Energy Cooperation
APG ASEAN Power Grid
APS
AQCS
APAEC Target Scenario
Air Quality Control System
ATS
CCT
CCUS
AMS Target Scenario
Clean Coal Technology
Carbon Capture, Utilisation, and Storage
CO2
CR
Carbon dioxide
Carbon Recycling
COVID-19
DR
Coronavirus 2019
Demand-on-response
EE
EP
Energy Efficiency
Electrostatic Precipitator
EE&C
EIA
FGD
Energy Efficiency and Conservation
US Energy Information Administration
Flue Gas Desulfurization System
GDP Gross Domestic Product
GFI Grid Fluctuation Index
GHG
HELE
Greenhouse gas
High Efficiency and Low Emission
JCOAL
MEEP
Japan Coal Frontier Organization
Moving Electrode type Electrostatic Precipitator
MTCO2-eq
OAP
OCCTO
PLS
Metric Ton of carbon dioxide - equivalent
Over Firing Air Port
Organization of Cross-regional Coordination of Transmission Operators
Partial Least Squares
RE
SCR
Renewable Energy
Selective Catalytic NOx Reduction device

Strategic Report on the New Role of Coal-fired Power Plant in the Era of Energy Transition
iv
SDG Sustainable Development Goals
UN United Nations
VRE Variable Renewable Energy

Strategic Report on the New Role of Coal-fired Power Plant in the Era of Energy Transition
v
Contents
Foreword ...................................................................................................................................... i
Acknowledgments........................................................................................................................ ii
Abbreviations .............................................................................................................................. iii
Contents ...................................................................................................................................... v
List of Figures ............................................................................................................................. vi
List of Tables .............................................................................................................................. vii
Executive Summary ................................................................................................................... viii
Chapter 1: Global Energy Transition and the ASEAN ...................................................................... 1
1.1 Regional Energy Targets and Strategies .................................................................................. 2
1.2 ASEAN Energy Outlook ........................................................................................................... 3
Chapter 2: Renewable Energy Policies in ASEAN ........................................................................... 8
2.1 AMS National Renewable Energy Targets, Policies, and Mechanisms .................................... 8
2.2 Barriers and Policy Gaps to Wider Deployment ..................................................................... 10
Chapter 3: Clean Coal Utilization Policy in ASEAN ........................................................................ 12
Chapter 4: The Present Status and Long-term Perspectives of Power Generation in ASEAN ......... 16
4.1 Grid Fluctuation Index (GFI) ................................................................................................... 17
Chapter 5: Flexible Operation Technology and Techniques for Coal-Fired Power Plant to Bolster
Grid-connected Renewable Energy Integration ........................................................................... 22
5.1 Electricity supply and demand balancing mechanism with control measures ........................ 23
5.2 Enhanced roles of balancing power sources for the enhanced power supply and demand
control ......................................................................................................................................... 26
5.3 Electricity market (wholesale electricity market, capacity market, supply, and demand
balancing market) ........................................................................................................................ 28
5.4 Overseas cases of demand-on-response (DR) mechanism .................................................... 31
5.5 Flexibilisation at a coal-fired power plant ............................................................................... 33
Chapter 6: CCT and HELE for environmental compliance of coal-fired power plants. ..................... 38
6.1 Working on regional and global environmental conservation through CCT and HELE ............ 38
6.2 Forward-looking initiatives to ensure the steady and sustainable energy transition ............... 43
Chapter 7: Policy Implications and Recommendations ................................................................. 50
References ................................................................................................................................ 52

Strategic Report on the New Role of Coal-fired Power Plant in the Era of Energy Transition
vi
List of Figures
Figure 1. Total Primary Energy Supply (TPES) for Baseline Scenario ................................................. 4
Figure 2. Projected RE Shares for the Baseline, ATS, and APS Scenarios ......................................... 5
Figure 3. ASEAN Installed Capacity Mix for APS Scenario ................................................................ 6
Figure 4. ASEAN Total Installed Capacity under ATS (left) and APS (right) ...................................... 12
Figure 5. ASEAN Total Installed Capacity under the ATS ................................................................ 13
Figure 6 Grid Fluctuation analysis – conventional ............................................................................ 17
Figure 7 Grid Fluctuation Index (GFI) ............................................................................................... 18
Figure 8 Example of GFI Calculation from Duck Curve .................................................................... 18
Figure 9 Analysis result of the estimated GFI for several countries. ................................................ 19
Figure 10 Analysis result of the estimated GFI for ASEAN .............................................................. 20
Figure 11. Envisaged electricity supply curves by fuel (week wise) upon renewables integration ... 22
Figure 12. Example of Daily Load Curves with Operation of Flexible Power Sources ..................... 23
Figure 13. Image of various controls related to supply and demand balance and frequency .......... 25
Figure 14. Major events to be addressed by balancing sources ...................................................... 26
Figure 15. Type classification of power supply, etc. secured by general power transmission and
distribution business operators ....................................................................................................... 28
Figure 16. Electricity Market Trading Flow by Type of the Market .................................................. 30
Figure 17. Roles and Functions of the Balancing Market Participants ............................................. 30
Figure 18. Overseas DR Market: The Case of the United States .................................................... 32
Figure 19. Overview of Vertical Mill and Ball Mill ............................................................................ 33
Figure 20. A Case Example of Steam Temperature Control Improvement ...................................... 34
Figure 21. Overview of the Wide Range Burner .............................................................................. 35
Figure 22. Turndown expansion example with wide range burner .................................................. 35
Figure 23. An Example of Start-up Bypass System ......................................................................... 36
Figure 24. Overview of HELE / CCT ................................................................................................ 38
Figure 25. An Overview of MEEP .................................................................................................. 39
Figure 26. Limestone Gypsum Method FGD ................................................................................. 39
Figure 27. NOx Reduction Measures: Low NOx Burner, In-Furnace NOx reduction technology, and
SCR ................................................................................................................................................ 40
Figure 28. Schematic Diagram of AQCS by Type ............................................................................ 41

Strategic Report on the New Role of Coal-fired Power Plant in the Era of Energy Transition
vii
Figure 29. A System with Reduced Mercury Emissions ................................................................. 41
Figure 30. Overview of biomass firing technology choices ............................................................. 42
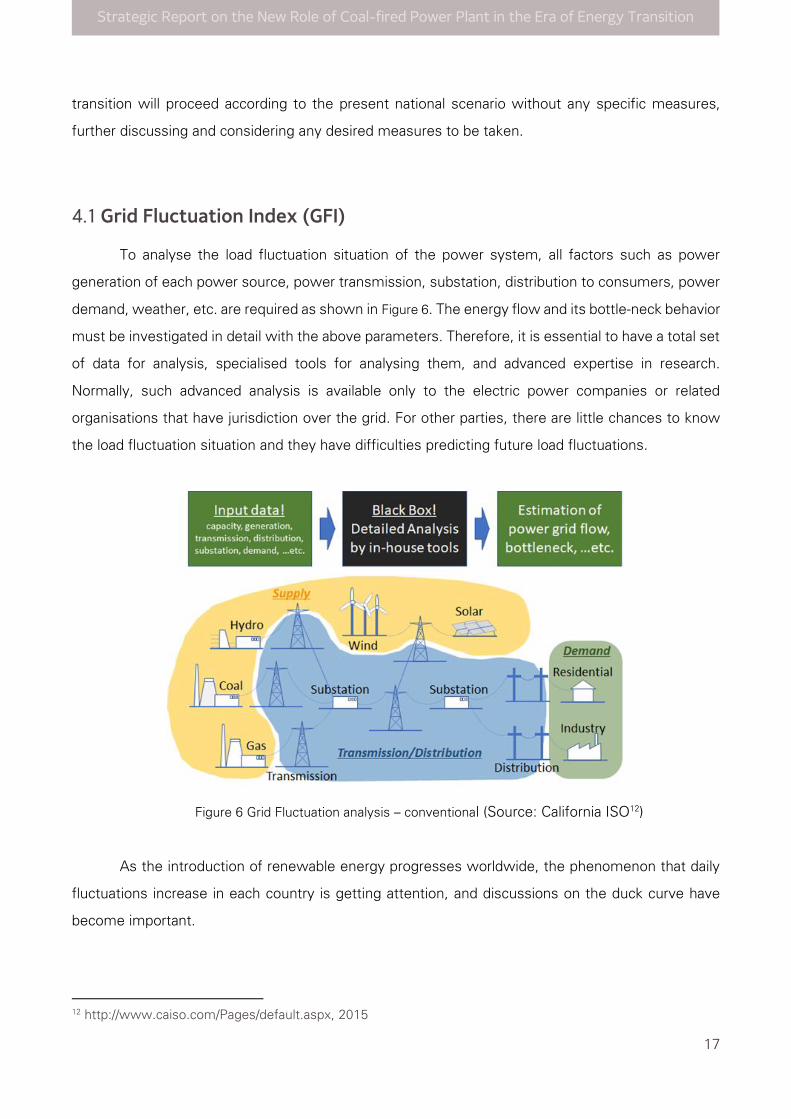
Figure 31. Japan's primary energy and power supply plan ............................................................ 43
Figure 32. Conceptual view of carbon recycle (CR) ....................................................................... 44
Figure 33. Overview of CCUS and CR ............................................................................................. 44
Figure 34. CR Roadmap of the Government of Japan ................................................................... 45
Figure 35. Location of Osakikamijima ........................................................................................... 46
Figure 36. Osaki Coolgen Project Schedule .................................................................................... 47
Figure 37. Outline of the Algae Carbon Recycling Technology Demonstration ............................... 47
Figure 38. Location of Tomakomai in Japan .................................................................................... 47
Figure 39. Overview of process, progress, and outcomes of the Tomakomai CCS Project ............. 48
Figure 40. Bird’s-eye View of the Tomakomai CCS Project Site ...................................................... 48
List of Tables
Table 1. Existing National Renewable Energy Targets in the AMS .................................................... 9
Table 2. Existing Coal Policies in AMS ............................................................................................ 14
Table 3. Classification of Available Reserve .................................................................................... 24
Table 4. Various controls related to supply and demand balance and frequency ............................ 25
able 5. Events to be addressed through balancing power sources ................................................. 27
Table 6. Overview of Japan’s Electricity Market Design ................................................................. 29
Table 7. List of By-function Product in the Supply-demand Balancing Market ................................. 31
Table 8. Overseas DR Market: The Case of France ........................................................................ 32

Strategic Report on the New Role of Coal-fired Power Plant in the Era of Energy Transition
viii
Executive Summary
For the past decades, coal has been playing a crucial role in the ASEAN energy sector by
supplying the steady growth in power demand of the developing region. But now that Southeast
Asia embarks into energy transition following the global shift into a low-carbon economy to address
climate change, reidentifying the role of coal in the energy sector is deemed essential to ensure the
security, accessibility, affordability, and sustainability of energy in the region.
The ASEAN has been one of the fastest-growing regions in the world. This growth increases
energy demand and an anticipated release of bulk emissions from power generation. The region is
facing the pressure of maintaining its energy supply while aiming to resolve the existing energy
issues, alongside the impacts of climate change.
The primary energy demand for the region is projected to increase up to 2.5 times higher in
2040 from the 2017 level. This would need up to 179 GW of cumulative capacity installation for the
same period. The AMS has been working towards the decarbonisation of its power grid which is
demonstrated by the presence of regional and national policies that are aimed to promote the
increased penetration of renewables. The region under the ASEAN Plan of Action for Energy
Cooperation (APAEC), intends to achieve an RE share of 23% by 2025 in the energy mix and to
increase the RE share to 35% in terms of installed capacity. These existing policies have driven large
uptake of renewables in the past years even with the COVID-19 pandemic in 2020 and are expected
to push more RE deployments in the long run.
However, the regional forecast determined that existing national RE policies and targets are
insufficient to achieve the regional target by 2025. Grid reliability due to intermittency of Variable
Renewable Energy (VRE) technologies such as solar and wind power remains to be a major challenge.
in its wider deployment. Until the advanced grid integration technologies – such as storage, smart
grids intelligence, and digital technology for demand management – reach technology saturation such
that their price falls due to the economies-of-scale, coal and natural gas power will remain the main
source to back up and maintain grid stability to ensure energy security.
The region employs High-Efficiency Low Emission (HELE) technologies such as Super Critical
(SC) and Ultra-Super Critical (USC) Pulverise Coal Technologies for new coal-fired power installations.
ASEAN also explores the feasibility of adopting technologies that can reduce emissions and improve
existing coal-fired power plants such as coal upgrading, cofiring systems with biomass, Carbon
Capture Utilisation and Storage (CCUS), and flexible operation for more sustainable coal use.

Strategic Report on the New Role of Coal-fired Power Plant in the Era of Energy Transition
ix
GFI (Grid Fluctuation Index) is a convenient analytical tool that does not require a complicated
analytical process, expert software, etc. We would be able to know when and to what extent a
country would possibly experience grid fluctuation, and how the energy transition path would be, by
calculating GFI and plotting it with timelines, baseload generation capacity, or mid-merit generation
capacity with the standard energy and electricity data, which would be conducive to the national
policies and measures to prevent or minimise the negative impact of RE integration. Accordingly, GFI
is suitable for policymakers and the national utilities to foresee how the energy transition will proceed
according to the present national scenario without any specific measures, further discussing and
considering any desired measures to be taken.
To address the issues proactively by controlling grid fluctuation, a comprehensive set of
measures in terms of market system formulation/transformation, digitalisation, and regulatory
reforms are required aside from providing flexible operation of the existing power plants and
introduction of new technology for generation, transmission, and storage. In this context, the ongoing
flexible market system formulation and relevant policy reforms in Japan and comparable market
systems in a few other countries are introduced as a useful reference for relevant ASEAN
stakeholders to provide a comprehensive view of what needs to be developed and sustained during
and beyond the energy transition.
To maintain the sustainable use of coal in the ASEAN region, this report recommends policy
developments and updates on increased HELE utilisation, enhanced pollution, and emission
regulation, and Carbon capture, utilisation, and storage (CCUS) deployment. Increased HELE
utilisation calls for a solid regulatory framework on the application of HELE technologies on newly
built plants and will also require consistent support when it comes to the financial, construction, and
operation aspects. It was projected that ASEAN will need 60 GW additional capacity of supercritical
and ultrasupercrital coal-fired power plants in 20 years which requires around US$77 billion
investment.
Likewise, enhancement of pollution and emission regulations needs a presence of a more
stringent emission standard, strengthened research on emerging pollution control technologies, and
support to its adoption in terms of legal and financial aspects. Reduction of dust, SOx, and NOx is
particularly important as a regional environmental measure, and many reduction measures are being
implemented worldwide. Advanced technologies on pollutants removal were explored in this report,
and comprehensive evaluation and adoption of these technologies are seen as means of achieving
stringent emission standards for power plants.
Lastly, CCUS deployment in the region would still require numerous discussions on several
topics such as legal and regulatory frameworks, storage, liability, pricing mechanisms, on top of

Strategic Report on the New Role of Coal-fired Power Plant in the Era of Energy Transition
x
ensuring public awareness and acceptance of the technology. The Tomakomai CCS Project in Japan
demonstrates that the understanding and support of the local community and project partners can
make a full chain CCS system from capture to storage feasible and effective means of preventing a
bulk release of CO2 to the atmosphere.

Strategic Report on the New Role of Coal-fired Power Plant in the Era of Energy Transition
1
Chapter 1: Global Energy Transition and
the ASEAN
It has been a goal to limit the increase of global average temperature to 1.5°C above pre-
industrial levels to slow down, if not prevent, the irreversible effects of climate change on humanity
and the environment. This colossal challenge demands the effort of every country and region to
transition into a low-carbon economy by shifting into clean and renewable technologies and by
improving energy efficiency across all sectors. The energy transition requires commitment from
governments, followed by the establishment of necessary legal and regulatory frameworks that
would provide an environment conducive to implementing the strategies needed to achieve the
climate targets.
Southeast Asia homes countries that are most vulnerable to climate change. Member states
- the Philippines (2nd), Vietnam (16th), Lao PDR (22nd), Cambodia (38th), and Myanmar (48th) were
among the countries that are most susceptible to extreme weather events such as typhoon and
flooding, which results in fatalities and loss of livelihood yet have a minimal capability in mitigating
these risks1. It has been estimated that climate change could reduce Southeast Asia’s GDP by 11%
as it damages critical sectors such as agriculture, tourism, and fisheries, on top of health implications
to its citizens2.
If the above is not enough of a challenge, the region also consists of developing countries
with a steadily increasing energy demand for the growing population and economy. Because of this,
the ASEAN member states (AMS) need to address the complex issue of energy security,
accessibility, affordability, and sustainability along with climate change. This has been a reason why
the energy transition pathway of Southeast Asian nations could be different from the rest of the
world, or at the very least to more developed regions.
This strategic report on the new role of coal aims to serve as a reference for the ASEAN
Member States in identifying available and emerging clean coal technologies, and policies that
promote its wider adoption, in order to support the global action towards low carbon transition while
maintaining energy security and energy resilience in the region. Chapter 1 of the report outlines the
current energy situation in the ASEAN region and the energy futures that were explored in the 6th
ASEAN Energy Outlook. Chapter 2 and Chapter 3 discuss the existing renewable energy and coal
1 Global Climate Risk Index 2020. (2019). Available at https://germanwatch.org/en/17307. 2 Southeast Asia and the Economics of Global Climate Stabilization. (2016) Available at
https://www.adb.org/publications/southeast-asia-economics-global-climate-stabilization

Strategic Report on the New Role of Coal-fired Power Plant in the Era of Energy Transition
2
policies in each ASEAN member states and tackle the challenges and barriers that hinder the wider
integration to the grid in the case of VREs, and the need for more stringent emission standards in
the case of utilising the existing coal-fired power plants for energy security.
Using the existing capacities and energy policies presented in the previous chapters, the
ASEAN grid was assessed for reliability using the tool, Grid Fluctuation Index (GFI). GFI, a tool
developed by JCOAL, can determine when and to what extent a grid would possibly experience
fluctuation. The result of the assessment was presented in Chapter 4 of the report. Chapter 5
presents solutions that allow flexible operation in the case of high fluctuation in a grid. It also
introduces relevant policy reforms in Japan and comparable market systems in a few other countries
that may serve as useful references for its adoption in ASEAN.
Chapter 6 highlights the importance of enhanced pollution and emission regulation and
explored advanced technologies on pollutants removal. Government-driven initiatives such as carbon
recycling are also introduced, as well as updates and lessons learned from the Tomakomai CCS
demonstration project.
The strategic report was concluded with Chapter 7 which recommends policy developments
on increased HELE utilization, enhanced pollution, and emission regulation, and CCUS deployment that
allows sustainable coal use, in parallel of renewable energy use and energy efficiency, to ensure
energy security and grid resilience in the region.
1.1 Regional Energy Targets and Strategies
Since the Conference of the Parties (COP) 21, the ASEAN has taken the Paris Agreement as
a direction for cooperation to address climate change. In the region, the energy transition transpires
through the combined efforts of the AMS under the guidance of the ASEAN Plan of Action for Energy
Cooperation (APAEC). The APAEC is a series of policy documents supporting multilateral energy
cooperation to advance regional integration and connectivity goals in ASEAN.
APAEC serves as a blueprint for better cooperation towards enhanced energy security,
accessibility, affordability, and sustainability. It accelerates the energy transition in the region by
developing and implementing outcome-based strategies that are established to 1) expand regional
multilateral electricity trading, strengthen grid resilience and modernisation, 2) pursue the
development of a common gas market for ASEAN by enhancing gas and LNG connectivity and
accessibility, 3) optimise the role of clean coal technology towards sustainable and lower-emission

Strategic Report on the New Role of Coal-fired Power Plant in the Era of Energy Transition
3
development, 4) reduce the energy intensity of consuming sector, 5) to increase renewable energy
integration in the grid, 6) advance energy policy and planning, and 7) build human resource capabilities
on nuclear science and technology for power generation.
The APAEC Phase II: 2021-2025, building on the success of APAEC Phase I: 2016- 2020, sets
out more ambitious targets and initiatives for the region and supports the realisation of the United
Nations Sustainable Development Goal 7, Affordable and Clean Energy. Under the current phase,
ASEAN aims to reduce their energy intensity by 32% in 2025 based on the 2005 levels and encourage
further energy efficiency and conservation efforts, especially in the transport and industry sectors. In
terms of renewable energy deployment, the region seeks to achieve a RE share of 23% by 2025 in
the ASEAN energy mix and to increase the RE share in installed power capacity to 35% in the same
period.3
1.2 ASEAN Energy Outlook
The APAEC through ASEAN Centre for Energy (ACE) develops the ASEAN Energy Outlook
(AEO), highlighting the key trends in the energy landscape and policy direction to enhance energy
security, transition, and resilience in the region. The recent release, 6th ASEAN Energy Outlook
(AEO6) explores demand and future developments under four energy scenarios: Baseline, AMS
Targets Scenarios (ATS), APAEC Target Scenarios (APS), and Sustainable Development Scenarios
(SDG) for the period of 2017 - 2040.4
The baseline projects the ASEAN energy system considering the historical trends in each
country with the modest implementation of the policies and strategies to meet their national and
regional targets. The AMS Targets Scenarios (ATS) and APAEC Target Scenarios (APS) project the
future development of the ASEAN energy system considering the attainment of their country-specific
targets and the ASEAN regional target, respectively. The SDG is an additional scenario from the
previous edition (5th ASEAN Energy Outlook), which aims to explore the pathways required by the
ASEAN to significantly contribute to the attainment of the United Nations SDG 7 targets on 1)
ensuring universal access to affordable, reliable, and modern energy service, 2) increase the share of
renewables in the global energy mix, and 3) double the global rate of improvement of energy
efficiency (from 2015 levels).5
3 ASEAN Plan of Action for Energy Cooperation (APAEC) 2016-2025 Phase II: 2021-2025. (2020). Available at
https://aseanenergy.org/asean-plan-of-action-and-energy-cooperation-apaec-phase-ii-2021-2025/ 4 The 6th ASEAN Energy Outlook 2017 - 2040. (2020). Available at https://aseanenergy.org/the-6th-asean-
energy-outlook/ 5 See https://sdgs.un.org/goals

Strategic Report on the New Role of Coal-fired Power Plant in the Era of Energy Transition
4
According to the AEO6 projection, the region's population and economy are expected to grow
significantly in the long term, despite the slowing down in the recent year due to the COVID-19
pandemic. In the baseline scenario, the total primary energy supply (TPES) is projected to increase
by 2.5 times in 2040 at 1,589 Mtoe from the 2017 level at 625 Mtoe, as shown in Figure 1. Renewable
energy is expected to grow at an annual rate of 4.2%. However, coal and oil still dominate the energy
mix, increasing at an annual rate of 4.8% and 4.0% from 2017 to 2040. Coal is mainly used as a fuel
for electricity generation, while oil is for transport. In 2040, RE share in TPES following the historical
trends in the AMS accounts for 14% while the combined share from coal, oil, and natural gas
accounts for 83.8%. With the modest implementation of AMS national and regional RE policies, the
region is at risk of resource depletion, relying on fossil fuel imports. Aside from vulnerability to global
market price volatility, the increase in fossil fuel consumption at this rate would results in energy-
related GHG emission for the region to be six times higher in 2040 at 4,171 MTCO2-eq from the 2017
level of 1,686 MTCO2-eq taking a toll on public health and labour productivity.
Figure 1. Total Primary Energy Supply (TPES) for Baseline Scenario (Source: AEO6)
Although renewable share grows steadily in the baseline, and with the efforts made to reach
the national energy targets, it remains insufficient to achieve the regional target of 23% share by
2025, as shown in Figure 2. It would require the collective commitment and efforts of the AMS to
close this gap. Few policy recommendations from the AEO6 are to raise the current AMS national
targets by accelerating the biofuel mandates through increased blending ratio and investing more in
renewable power installations.
In the APS scenario, 138 GW of renewable capacity is required to be built from 2018 through
2040 out of the 179 GW total capacity additions. The total investment needed for this capacity
expansion is USD 508 Billion, driven by capital needed for cleaner technologies installations.
However, the cost of capacity expansion can be balanced by the socio-economic benefits such as

Strategic Report on the New Role of Coal-fired Power Plant in the Era of Energy Transition
5
job creation and emission reduction. Investment in renewables, especially solar and wind power, can
create new jobs (e.g., installers, fabricators, and engineers). The projected job created by solar and
wind power investment is 223,000 by 2025, which is 2.7 times more than the baseline. Cumulative
employment may reach 303,000 jobs in 2040 – 220,000 of which is from solar deployments and the
remainder from wind deployments.
Figure 2. Projected RE Shares for the Baseline, ATS, and APS Scenarios (Source: ASEAN Energy Database
System, AEDS)
The GHG emission of the region sharply lowers to 2,264 MTCO2-eq in the APS scenario,
which is almost as half much as the baseline emission. However, like the baseline scenario, the
electricity sector remains the most significant greenhouse gas and pollution emitter, followed by the
transport and the industry. On a positive note, this presents an opportunity for the power industry –
which can easily be regulated – to create a huge emission reduction by shifting into clean and climate-
neutral technologies for electricity generation.
The critical approach for attaining the regional RE target is the increased penetration of
variable renewable energy. Solar and wind capacity must reach an average annual growth of 15%
and 12%, respectively. By 2025, solar capacity is expected to jump to 83 GW from 32 GW in 2020.
Meanwhile, the capacity of hydropower (the major renewable energy resource in the region) is
expected to jump to 77 GW from 59 GW during the same period.
A reduction of coal power capacity of about 15% from major coal-consuming countries,
Indonesia, Malaysia, the Philippines, and Vietnam, has been observed with this transition from
conventional to VREs deployment. However, as shown in Figure 3, fossil fuel (coal and natural gas)
remains a significant part of the ASEAN power mix even in the next 20 years.

Strategic Report on the New Role of Coal-fired Power Plant in the Era of Energy Transition
6
Figure 3. ASEAN Installed Capacity Mix for APS Scenario (Source: AEO6)
The SDG 7 – affordable and clean energy, links access to clean energy and energy efficiency
measures as key climate change strategies to reduce greenhouse gas emissions.6 The attainment of
APAEC target on renewable energy and energy efficiency has provided the region a good direction
to the attainment of SDG targets 2 and 3. But to meet the energy intensity reduction target stated in
SDG 7.3, it was projected that ASEAN would need to reduce the energy intensity at an annual average
of 2.6% from 2015 to 2030. The current national and regional energy efficiency target would only
achieve 1.7% and 2.2% annual reductions, respectively. Therefore, raising the energy efficiency
target of the ASEAN is deemed important to meet the global energy intensity reduction target.
Meanwhile, the achievement of national and regional RE targets would increase the RE share
to 18.8% and 24.6%, respectively, by 2030. These figures seem to be adequate given that the SDG
has not specified a target percentage of renewables in the global power mix. IRENA even determined
that Southeast Asia must meet 53% of its power generation from modern renewable energy to align
itself to meeting the upper-temperature limit of 2°C Paris Agreement target. If ASEAN intends to
support the global goal of keeping the temperature away from the tipping point, it must improve its
renewable targets for the region.7
ASEAN as a region also needs more effort to attain SDG 7.1, particularly on getting a
significant portion of the population access to clean fuel and technology for cooking. AMS has already
made significant progress to ensure 100% electrification by 2030 through combined conventional
and renewable generation both on grid-connected and off-grid areas. However, the pace at which
6 Connections between the Paris Agreement and the 2030 Agenda. (2019). Available at
https://www.sei.org/publications/connections-between-the-paris-agreement-and-the-2030-agenda/ 7 Global Renewables Outlook. (2020). Available at https://www.irena.org/-
/media/Files/IRENA/Agency/Publication/2020/Apr/IRENA_Global_Renewables_Outlook_2020.pdf

Strategic Report on the New Role of Coal-fired Power Plant in the Era of Energy Transition
7
clean energy cooking is pushed in the region still lags the global target. About 60 million households
or 240 million people in ASEAN still cook with traditional biomass such as wood, crop wastes,
charcoal, or kerosene stove. Rural households with low-income are least likely to adopt the use of
modern stoves and fuels. Meeting SDG 7.3 would require policies and financial instruments that
would encourage the population to shift into liquefied petroleum gas (LPG), biogas, and natural gas
for the near term, then eventually to electric stoves.
Summing up this chapter, ASEAN through APAEC initiatives has been continuously pursuing
efforts to transition into a cleaner energy sector by encouraging the increase in uptake of renewable
and energy-efficient technologies, aligning its future developments to the global goal of mitigating
the impact of climate change. The energy transition in ASEAN will require a high upfront cost in the
short term, but in the long run produces substantial socio-economic benefits such as job creation,
public wellness, and most importantly, emission reduction. Achieving the APAEC targets ensures
good alignment with the UN SDG 7 goals, but despite the attainment of both national and regional
targets, coal and other fossil-based fuel remain to be a significant source of energy to supply the
region’s increasing energy demand.

Strategic Report on the New Role of Coal-fired Power Plant in the Era of Energy Transition
8
Chapter 2: Renewable Energy Policies in
ASEAN
To achieve the ASEAN’s aspirational target of 23% RE share in TPES by 2025, the APAEC
establishes the outcomes-based strategies (OBS) for the region namely, 1) advance renewable
energy policy and decarbonisation pathways, 2) conduct high-level policy dialogue on renewable
energy, 3) enhance renewable energy research and development (R&D), 4) promote renewable
energy financing schemes and mechanisms, 5) support biofuel and bioenergy development and lastly
6) enhance renewable energy information and training centre.
Under these strategies, the region intends in the following year to develop a long-term
renewable energy roadmap for the ASEAN, conduct an impact assessment of RE financing
implemented in the past five years, initiate discussion on biofuel and bioenergy guideline standards
for the ASEAN, and establish a nodal network with research institutions and academe for joint studies
and information sharing on RE policy support and instruments.
The long-term energy roadmap shall guide the AMS on the technical and economically viable
renewable uptake, taking on the findings and recommendations of the ASEAN Interconnection
Masterplan Study (AIMS) III, ASEAN renewable energy outlook, and the review on the readiness of
the RE supporting industries. The AIMS III is an ongoing study with the Heads of ASEAN Power
Utilities/Authorities (HAPUA) that seeks to explore the feasibility of a more ambitious renewable
energy target and its implication on ASEAN Power Grid (APG). The APG is another strategic
programme under APAEC that aims to facilitate electricity trading among the Member States through
strategic interconnections and enhance the integration of their power systems, built to accommodate
higher VRE penetration cost-effectively and reliably.
The ten (10) ASEAN Member States – Brunei Darussalam, Cambodia, Indonesia, Lao PDR,
Malaysia, Myanmar, the Philippines, Singapore, Thailand, and Vietnam, given that the roadmap is yet
to be developed, has been working on their national targets to encourage an increase in renewables
in their country’s energy mix.
2.1 AMS National Renewable Energy Targets, Policies, and Mechanisms
Table 1 summarises the official energy targets of each of the ASEAN member states. ASEAN
is rich in hydropower resources which supply around 18% of the power requirement of the region
but is working towards diversification by improving the capacity uptake of variable renewable energy
resources. Cambodia, a country that is rich in hydropower resources, stated in the 2019 Cambodia

Strategic Report on the New Role of Coal-fired Power Plant in the Era of Energy Transition
9
Basic Energy Plan to source 10% of its power mix from biomass, wind, and solar by 2030 and to
source 3% of its residential electricity demand from rooftop solar by 2025. Meanwhile, Malaysia
implemented a solar PV net energy metering (NEM) scheme in 2017, setting a target of 500 MW of
distributed solar capacity in 2020. Complementing this mechanism in the commercial sector are the
Solar Leasing Policy that allows private companies to install rooftop solar panels at no up-front cost,
Green Investment Tax Allowance (GITA), and Green Income Tax Exemption (GITE). Malaysia also
pioneered peer-to-peer (P2P) trading using blockchain technology in the region that allows NEM
“prosumers” to sell excess power on an energy trading platform to other consumers. In addition,
the Malaysia Green Attribute Tracking System (MGATS) supports the issuance and trade of
renewable energy certificates (RECs).
Myanmar, which also sources its electricity from hydropower, sets a target of increasing solar
and wind power share to 1.2% in their energy mix, supporting a target of 12% non-hydro renewables
by 2030. Despite the land area, Singapore aspires to achieve 350 MWp of solar capacity by 2020 and
at least 2 GWp by 2030.
Thailand has always been leading the region in terms of renewable deployment. Thailand is
the first ASEAN country that has introduced a feed-in-tariff scheme for small-scale power producers.
In the current RE Map, the country aims to increase solar capacity from 6 GW to 17 GW by 2036 and
is looking to expand solar opportunities through the development of floating solar PV farms at their
dams. Vietnam saw a massive leap in solar power deployment in 2019 due to generous solar feed-
in-tariff and tax reduction for developers. The country targets to reach 32.3% renewable share in
TPES by 2030 and 43% by 2050 according to the Vietnam Renewable Energy Development Strategy
for 2030 with an outlook to 2050.
Table 1. Existing National Renewable Energy Targets in the AMS
AMS Official Targets
Brunei
Darussalam 10% renewable energy share in installed power generation capacity by 2035
Cambodia
55% of Hydropower share, 10% of other renewable energy in power generation
mix by 2030 (other renewable Energy: 6.5% from biomass and 3.5% from solar)
3% of residential electricity demand met by rooftop solar PV by 2035
Indonesia
23% RE in primary energy supply by 2025
Biodiesel blending ratio target 30% by 2020 and maintain that level through 2025
and to 2050
20% bioethanol blending ratio target by 2025; 50% by 2050

Strategic Report on the New Role of Coal-fired Power Plant in the Era of Energy Transition
10
Lao PDR
30% RE share of total energy consumption by 2025, including 20% of electricity
from RE that is not large-scale hydro, and 10% biofuel share (blending ratio 5–
10%)
Malaysia 20% RE in the power capacity mix by 2025 (excluding large-scale hydro)
Myanmar 12% share of RE in national power generation mix by 2030 (excluding large-scale
hydro)
Philippines
35% RE share in the generation mix by 2030 with 1% minimum annual
increment from the previous year
Biofuel blending ratio around 2% for biodiesel and 10% of bioethanol
Singapore 350 MWp of solar capacity by 2020 and at least 2 GWp by 2030
Thailand
30% RE share in total final energy consumption (TFEC) by 2036, including15–
20% renewable electricity in the total generation; 30–35% of consumed heat
from renewables; and a 20–25% biofuel share in TFEC
Vietnam 32.3% RE share in TPES by 2030, 44% by 2050
32% RE share in power generation by 2030 and 43% by 2050
Biofuel blending is considered as an integral means of reducing the emission in the transport
sector. It is also crucial in reducing the import reliance of several ASEAN member states. Indonesia,
Lao PDR, Malaysia, the Philippines, Singapore, and Thailand are a few of the AMS with a clear biofuel
mandate policy that targets a typical blending ratio of 5-10%. Indonesia even aspires to achieve a
50% blending ratio by 2050.
Despite the existing targets, policies, and mechanisms that AMS implements to promote the
RE deployment on the national level, it remains insufficient to meet the regional target—achieving
the national targets yields an RE share of 17.7% by 2025, which is 5.3%-pts below the regional
target. The APAEC Phase II initiative has been to align the AMS national policies and plans with the
APAEC regional strategies.
2.2 Barriers and Policy Gaps to Wider Deployment
The increased integration of more renewables in the grid is one of the most desirable
pathways to decarbonise the power sector. However, it still faces tech-economic and legal barriers
which hinder its larger implementation in the ASEAN region.
Despite policies that promote renewable uptake, particularly solar and wind, the state of grid
infrastructure remains a limiting factor to higher VRE integration. Power fluctuation and interruption
in the power grid exhibit the difficulty in maintaining the stability of the electricity transmission
system due to the intermittent nature of variable renewable energy. This challenge in balancing
power supply to the demand also makes VRE deployment less attractive to its application to heavy

Strategic Report on the New Role of Coal-fired Power Plant in the Era of Energy Transition
11
industry and other end-users that require consistent and reliable electrification. ASEAN being
archipelagic makes the integration of VRE even more difficult since variability in the generation is
considerably impacting smaller systems compared to larger ones.
Battery storage, which has exhibited significant cost reductions in the past years, could play
a major role in allowing an increased share of VREs in the grid. However, comparing the cost of VRE
and battery storage technologies from other regions globally, ASEAN prices are still way higher.8
The cost of VRE, although it is becoming more competitive with conventional technologies,
remains capital intensive. It would require legislative and fiscal instruments to ensure renewable
projects are bankable to attract investors. With this, implementing regulations needs to keep up with
the national and regional policies that are put in place.
8 Regional Energy Trends Report 2020. (2020). Available at https://www.unescap.org/publications/regional-
energy-trends-report-2020-tracking-sdg-7-asean-region

Strategic Report on the New Role of Coal-fired Power Plant in the Era of Energy Transition
12
Chapter 3: Clean Coal Utilization Policy in
ASEAN
In the ASEAN power sector, a significant transition to low carbon sources is expected to take
place under the ATS and the APS, yet coal and gas will remain important. The ATS reflects the
country’s power development plan with energy efficiency measures while the APS implies the
acceleration of RE considering each country’s RE potential. The projection of ASEAN installed
capacity in both APS and ATS are illustrated in Figure 4 and Figure 5, respectively. In 2017, the ASEAN
installed capacity was 234 GW, with a 26.1% share coming from RE.
Under the ATS, coal-fired power plant contributes 37% of total capacity, followed by RE (33%)
and gas (27%) in 2025. While, when ASEAN upscales RE penetration under the APS, Figure 5 depicts
the most significant share are from RE (23% of solar and wind, 19% of hydro, 10% of other RE),
followed by coal (26%), and gas (23%) in 2025. With this high penetration of solar and wind, the role
of fossil fuel power plants or other flexible generation will be essential to maintain grid stability. On
top of this, coal will likely remain the second primary fossil fuel due to its availability and affordability.
Figure 4. ASEAN Total Installed Capacity under ATS (left) and APS (right) (Source: AEO6)
Coal has been crucial for economic development within the region by providing reliable,
affordable, and flexible energy. Moving towards low carbon transition pathways, worldwide best
available technologies are proven for the region to adopt. Those technologies include coal upgrading,
High-Efficiency Low Emissions (HELE) technologies, cofiring systems with biomass, and most
importantly, Carbon Capture Utilisation and Storage (CCUS) or Carbon Capture and Storage (CCS).

Strategic Report on the New Role of Coal-fired Power Plant in the Era of Energy Transition
13
ASEAN is actively promoting the utilisation of clean coal technologies (CCT) by establishing
the ASEAN Forum on Coal (AFOC). Most of the AMS have introduced CCT or HELE initiatives in their
recent power development plan. HELE technologies, namely Super Critical (SC) and Ultra-Super
Critical (USC) have a higher process efficiency than the subcritical9.
Figure 4 presents the clean coal transition from 2017 to 2040 under the ATS. It is projected
that there will be more than 60 GW additional capacity of SC and USC coal-fired power plants (CFPP)
in the next 20 years with around US$77 billion investment needed. Meanwhile, it is shown in Figure
5 that Malaysia is leading the way to shift away from conventional CFPP by increasing the USC CFPP
capacity from 2 GW in 2017 to 11 GW in 2040. This would be a good starting point for ASEAN further
to utilise HELE technologies for new or retrofitted CFPP.
Figure 5. ASEAN Total Installed Capacity under the ATS (Source: AEO6)
Table 2 provides the updated AMS new coal policies which are usually reported in the annual
ASEAN Forum on Coal. Several AMS have put in place policies to promote CCT and encourage higher
domestic coal consumption to strengthen sustainable development and energy security. Being the
major player on coal in the region, Indonesia has developed a CCT roadmap, conducted feasibility
studies on coal gasification, and piloted cofiring systems with biomass in several CFPPs across the
country.
9 In ASEAN countries, current subcritical efficiency ranges from 20%-34%, while supercritical and ultra-
supercritical are 37% and 42% respectively.

Strategic Report on the New Role of Coal-fired Power Plant in the Era of Energy Transition
14
Table 2. Existing Coal Policies in AMS10
AMS Coal Policy
Cambodia
Coal pricing is based on Newcastle Index
Subsidy mechanism: No coal subsidy, only Tax and VAT is exempted
Transport fee is based on bidding, usually every 3-4 years
Lao PDR
Based on Order No 08, dated 02 July 2018, the Lao government promotes mining
company extraction coal to supply domestic consumption (i.e., cement industry),
as well as the demand of domestic coal-fired power plants.
The coal industry in Laos is in the early stage of development of its coal mining
industry.
Coal pricing is based on the international coal price.
Lao Government takes coal royalty with a rate of 6% of sale value/ton.
Indonesia
Law No. 3 of 2020, revision on Law No. 4 of 2009 on Mineral and Coal Mining
Government Regulation No. 77 of 2014, 3rd revision on Government Regulation
No. 23 of 2010 on Implementation of Mineral and Coal Mining Business
Activities.
Regulation of the Minister of Energy and Mineral Resources No. 34 of 2009 on
Preference of Domestic Minerals and Coal Supply
Regulation of the Minister of Energy and Mineral Resources No. 50 of 2018 on
Mineral and Coal Mining Business Operations
Emission standard: Minister of Environment and Forestry Decree No. 15/2019
Supporting Policies:
• Government Regulation No. 96 of 2015 on Facilities and Incentives in Special
Economic Areas
• Government Regulation No. 9 of 2016 on Income Tax Facilities for
Investments in Certain Business Fields and/or in Certain Regions (Tax
Allowance).
• Regulation of the Minister of Finance No. 188 of 2015 on The Exemption of
Import Duty on the Import of Machinery and Items and Materials for Industry
Development or Development in the Framework of Investment
• Regulation of the Minister of Finance No. 150 of 2018 on Giving Facilities for
Reducing Tax Income (Tax Holiday).
Malaysia Emission standard: Environmental Quality (Clean Air) Regulations 2014 for Heat
and Power Generation
Myanmar
Foreign direct investments are allowed in large-scale mineral exploration and
production only, but not allowed in medium and small-scale production.
To invite more local and foreign investments in coal to promote environmental-
friendly and advanced coal production technologies
To focus coal production to fulfill domestic coal demand for industrial use and
electricity generation
10The AMS country report in the 17th AFOC Council Meeting (April 2019); Indonesia presentation (Future
Policy of Coal Utilisation) in the 18th AFOC Council Meeting (July 2020)

Strategic Report on the New Role of Coal-fired Power Plant in the Era of Energy Transition
15
To promote CCT technology for low-grade coal (lignite and sub-bituminous) and
its upgrading technology
Philippines
The Philippine Conventional Energy Contracting Program (DC2017-09-0010):
• Transparent and competitive system for awarding service and operating
contracts for the exploration, development, and production of the country’s
coal resources
• Nomination and publication of applied areas
• Application for Coal Operating Contracts (COC) at any given time
Coal Mine Safety and Health Rules and Regulations (DC2018-12-0028):
• Issued to make the coal mine safety and health rules and regulations more
applicable to present local coal mining conditions, compatible with the
provisions of the ILO C176, the Dept. of Energy has repealed the coal mines
safety rules and regulations (BED DC No. 1 series of 1978)
• To ensure the safety and health of all workers involved in the coal mining
operations in the Philippines
Thailand
Environmental and Public Acceptance is the most concern
Support the use of Clean Coal Technology in strengthening
sustainable development and energy security in parallel with expanding public
acceptance and improving coal image
Domestic coal is not allowed to be exported
Imported tax deduction for Clean Coal Technology
New Power Development Plan will be launched soon (likely After April to May
2019)
On a regional scale, Coal and Clean Coal Technology (CCT) is one of the programme areas
under APAEC Phase II. Key strategies under this programme include promotion of the role of CCT
and CCUS towards energy transition and low carbon economy, the conduct of outreach to advance
the regional actions to enhance the public awareness of CCT, facilitate investment and partnership
on CCT, and advance CCT research, development, and innovation.
In promoting the role of CCT and CCUS towards energy transition, the region seeks the
advancement of CCT and low emission technologies as potential solutions to support the global
action on climate change while ensuring a stable energy supply in the area.
Under this programme, the adoption of more advanced coal technologies such as cofiring
technologies, integrated gasification combined cycle (IGCC), coal upgrading, coal conversion
technologies, CCUS, flexible operation shall be reviewed in terms of technical and economic
feasibility through engagement with the region’s key stakeholders.

Strategic Report on the New Role of Coal-fired Power Plant in the Era of Energy Transition
16
Chapter 4: The Present Status and Long-
term Perspectives of Power Generation in
ASEAN
Toward the long-term temperature goal of the Paris Agreement to hold global average
temperature increase to “well below 2°C above preindustrial levels and pursuing efforts to limit the
temperature increase to 1.5°C above pre-industrial levels”, it is crucial for every country to go through
the energy transition toward carbon neutrality in the foreseeable future. With the massive cost
reduction of RE that the world has experienced in recent years, RE is now in the center of all fuels
and generation sources. It provides minimum environmental impacts and economic benefits to the
respective communities and the world. However, it is also known that massive RE integration would
cause grid fluctuation and associated issues if no appropriate measures are taken. Not only emerging
countries but also some developed countries have yet to determine the optimum long-term actions
in addressing associated issues. It is quite understandable since paradigm-shift such as RE
integration is a one-time-only experience for any part of the globe. Every country has its own energy
and electricity situation that would affect the respective energy transition pathways.
In summary, the global target of energy transition and carbon neutrality to cope with climate
change is being shared and recognised. However, the pathways to reach the goal would be different
as countries have their own social and economic conditions and energy situation. So, the initial step
of prime importance in this context is to identify the currently envisaged pathway and whether, by
whatever means and to what extent, mechanisms and measures would be required to sustain grid
stability and sustainable electricity supply.
JCOAL has recently developed GFI (Grid Fluctuation Index) that does not require a complicated
analytical process, expert software, etc11. The method can determine when and to what extent a grid
would possibly experience fluctuation and how the energy transition path would be. By calculating
as a reference and plotting it with timelines, baseload generation capacity, or mid-merit generation
capacity with the standard energy and electricity data, GFI can help the establishment of national
policies and measures that can prevent and/or minimise the negative impact of RE integration
accordingly. GFI is suitable for policymakers and the national utilities to foresee how the energy
11 GFI was originally developed by Dr. Kazuyuki Murakami, Senior Material Scientist and Program Manager,
R&D Department, JCOAL. He is a team member of JCOAL for the ACE-JCOAL Cooperation.
Strategic Report on the New Role of Coal-fired Power Plant in the Era of Energy Transition
17
transition will proceed according to the present national scenario without any specific measures,
further discussing and considering any desired measures to be taken.
4.1 Grid Fluctuation Index (GFI)
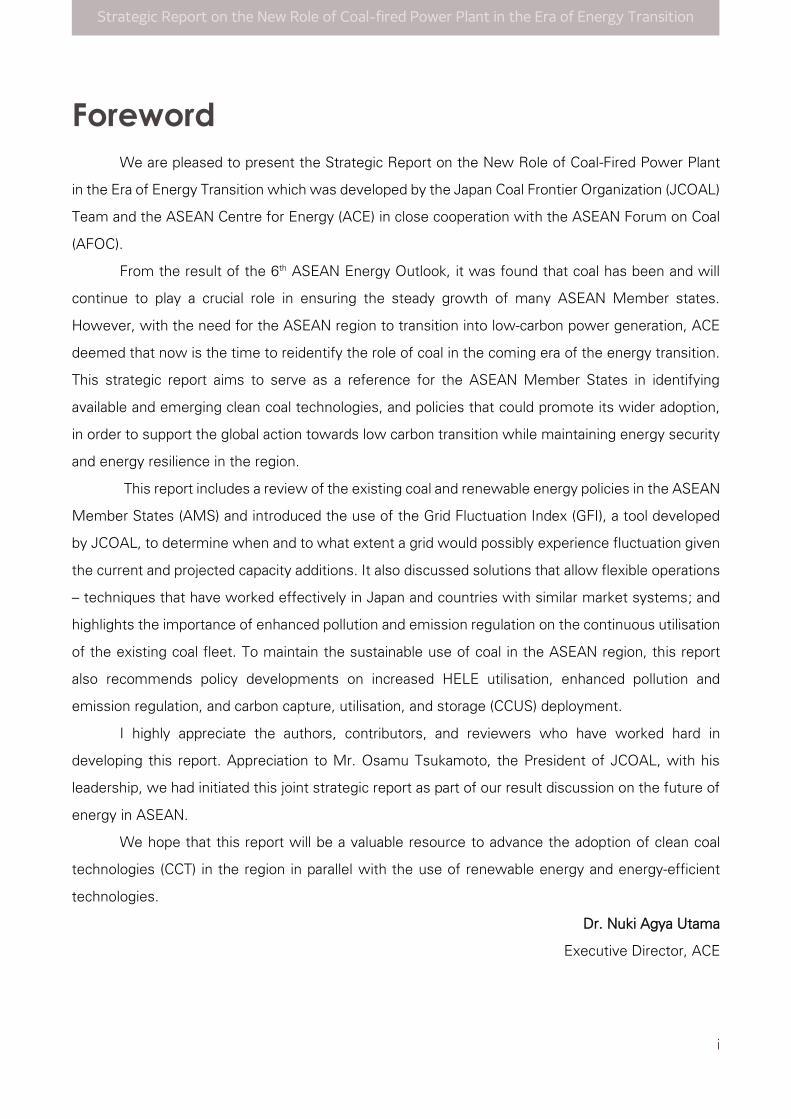
To analyse the load fluctuation situation of the power system, all factors such as power
generation of each power source, power transmission, substation, distribution to consumers, power
demand, weather, etc. are required as shown in Figure 6. The energy flow and its bottle-neck behavior
must be investigated in detail with the above parameters. Therefore, it is essential to have a total set
of data for analysis, specialised tools for analysing them, and advanced expertise in research.
Normally, such advanced analysis is available only to the electric power companies or related
organisations that have jurisdiction over the grid. For other parties, there are little chances to know
the load fluctuation situation and they have difficulties predicting future load fluctuations.
Figure 6 Grid Fluctuation analysis – conventional (Source: California ISO12)
As the introduction of renewable energy progresses worldwide, the phenomenon that daily
fluctuations increase in each country is getting attention, and discussions on the duck curve have
become important.
12 http://www.caiso.com/Pages/default.aspx, 2015

Strategic Report on the New Role of Coal-fired Power Plant in the Era of Energy Transition
18
JCOAL has been recently working on developing a method for predicting and evaluating the
load fluctuation situation of the power system in a straightforward process. As an index showing the
load fluctuation situation, the slope of the daily load fluctuation curve is regarded as a parameter of
the fluctuation, and the number divided by the total capacity of the grid is called the Grid load
Fluctuation Index, GFI as shown in Figure 7.
Figure 7 Grid Fluctuation Index (GFI) (Source: JCOAL)
Specifically, the coordinates of the position with the maximum slope are picked up from the
country’s load curve that would be available in the public domain. Figure 8 is an example of India,
the maximum slope part at night is divided by the total installed capacity of the grid for obtaining its
GFI.
Figure 8 Example of GFI Calculation from Duck Curve (Source: CEA13)
If a load curve is available, it is possible to calculate the GFI directly, however, there are cases
where such data cannot be obtained from the public domain. In such cases, general data such as
installed capacity and power generation would help us to identify the potential future grid load
fluctuation. As the analytical data for the prediction herewith, “International Energy Outlook 2019”
supplied on the website of the US EIA were used for multivariate regression analysis with GFI
obtained from the load curve data of the country of publication. The method used is PLS, the Partial
13 Presentation at the FY2020 CEA-JCOAL Workshop (virtual) on 25 January 2021

Strategic Report on the New Role of Coal-fired Power Plant in the Era of Energy Transition
19
Least Squares method14, which is used when the explanatory variables are collinear. As a result of
the analysis, the energy availability factors of coal-fired power, nuclear power, total renewable energy,
and solar power were adopted as multiple regression variables. The PLS regression equation is
shown as follows.
GFI = E + w1Xcoal + w2Xrenew + w3Xnuclear + w4Xsolar
Where, Xcoal, Xrenew, Xnuclear, Xsolar are the availability factors of coal, total renewables, nuclear and solar,
respectively. E and W1 to W4 are the residual error and each coefficient, each value is E=-0.1258,
w1=0.00147, w2=-0.00025, w3=-0.00014, w4=0.00706.
The analytical results of the main countries indicated in the EIA data are shown in Figure 9. In
several countries, GFI is found to increase year by year as its economic growth proceeds. By plotting
the forecasted baseload generation sources share, it is expected that India would have the most
severe situation in all four countries shown here from 2020 to 2050. Countries with a high share of
hydro and gas generation are supposed to have no major issues of grid flexibility in the foreseeable
future.
Figure 9 Analytical result of the estimated GFI for several countries (Source: JCOAL)
Japan shows a stable GFI in the next three decades. Only a slight increase of GFI in total
generation will be expected despite that RE installation is continuing. The availability factor of RE is
relatively low, and gas power will play a role to compensate for grid flexibilisation.
Currently, China has the largest grid in the world and keeps its position in the future. GFI of
China may be in a slight upward trend with an increased total capacity of primarily RE and other
14 For example, “Handbook of Partial Least Squares Concepts Methods and Applications” Vincenzo Esposito
Vinzi et al.

Strategic Report on the New Role of Coal-fired Power Plant in the Era of Energy Transition
20
generation sources. Coal is still the primary source of power generation, but its share is decreasing.
India on the other hand, is an expanding power grid in which coal plays a dominant role.
The government of India pursues a policy of RE installation while decreasing the share of
fossil fuels. GFI of India will increase remarkably after 2030. If any effective measures are not going
to be taken, flexibilisation issues will become apparent.
GFI of Brazil will increase in 2025 then remain at around 0.1. Even GFI is approximately 0.1,
the same level as China, grid fluctuation is not severe because hydropower is the main source.
A GFI analysis was conducted based on the electricity plans of ASEAN countries up to 2040
The results are shown in Figure 10. GFI is closely related to the availability of coal-fired power since
coal is the primary energy source in the ASEAN region. GFI of several countries will be increasing
from 2030, such countries are Indonesia, Malaysia, the Philippines, Vietnam. Meanwhile, Singapore
and Thailand seem to have lesser opportunities for grid fluctuation. Brunei, Laos, Cambodia, and
Myanmar despite relatively smaller grid sizes will also have fewer concerns about grid fluctuation.
As mentioned, the grid scales of Indonesia, Vietnam, the Philippines, and Malaysia are
expanding without any significant change in the power supply shares. These countries would have
major concerns about grid fluctuation after 2030 based on the GFI analysis.
Figure 10 Analytical result of the estimated GFI for ASEAN (Source: JCOAL)

Strategic Report on the New Role of Coal-fired Power Plant in the Era of Energy Transition
21
For Indonesia, GFI is projected to surge up after 2035. Flexibilisation on its coal-fired power
plants would be one of the significant options to address the possible fluctuation of the national grid.
The GFI of Malaysia will stay on at a relatively high level at 0.09-0.1. Coal accounts for less
than 50% of the generation mix. The GFI of the Philippines will remain at a relatively high level at
approx. 0.08 to 0.1, which would require flexibilisation measures as well. High dependence on coal-
fired power generation is deemed to be a significant factor that caused it. The local grid system
fluctuation might occur more severely if the more flexible power supply sources such as gas and/or
hydro are less available.
The GFI of Vietnam will stay at relatively low level up to 2025, following a sharp increase
toward 2035 as installed capacity will continue to increase. Note that as of 2040, coal will account
for less than 40% of the generation mix for Vietnam.
As described in this section, GFI analysis is a helpful tool for considering future flexibilisation
measures for a country that needs to expand its energy supply with affordable and reliable costs.

Strategic Report on the New Role of Coal-fired Power Plant in the Era of Energy Transition
22
Chapter 5: Flexible Operation Technology
and Techniques for Coal-Fired Power
Plant to Bolster Grid-connected
Renewable Energy Integration
As discussed in previous chapters, a massive renewable introduction is imperative in the
context of globally shared actions to address climate change. Yet, without appropriate measures, it
would cause grid fluctuation that may work even against sustainable and efficient electricity supply.
To address the issues proactively to control grid fluctuation to the minimum extent possible,
a comprehensive set of measures in terms of market system formulation/transformation
digitalisation will be required in addition to the flexible operation of the existing power plants and
introduction of new technology for the generation, transmission, and storage.
This chapter mainly outlines the ongoing flexible market system formulation and relevant
policy reforms in Japan and comparable market systems in a few other countries. It will be a valuable
reference for ASEAN stakeholders to obtain a comprehensive view of materialisation during the
energy transition.
Figure 11. Envisaged electricity supply curves by fuel (week wise) upon renewables integration
(Source: IEA-CCC15)
15 Presentation of IEA-CCC at AFOC CCT Workshop in Bangkok, August 2019

Strategic Report on the New Role of Coal-fired Power Plant in the Era of Energy Transition
23
5.1 Electricity supply and demand balancing mechanism with control
measures
Japan has been divided into two areas with different frequencies, that is, the reference
frequencies of 50Hz in East Japan and 60Hz in West Japan16. In the respective areas, the frequency
is being controlled in the range of ± 0.2 to ± 0.3 Hz to the reference frequency. It is managed by
controlling the amount of generated power at the same rate while the supply-demand situation would
change every moment. Therefore, the general power transmission and distribution business
operators in each area provide reserves to address supply and demand fluctuations in each time cycle
and prediction errors in demand and renewable energy output in a short-term cross-section and
balance supply and demand and control the frequency.
On the generation side, frequency control is undertaken by thermal and hydroelectric power
plants. Among these, hydropower has seasonal restrictions. In other words, the output balance
required for frequency control is limited by flood conditions. Accordingly, thermal power plants are
the primary balancing sources to address the required frequency control throughout the year.
Figure 12. Example of Daily Load Curves with Operation of Flexible Power Sources (Source: Kyushu
EPCO17)
16 Japan’s “One country, two frequencies” has a historical background. It originates to the late 19th century
when first generators were introduced in Japan. 17 Contribution of Kyushu EPCO for the presentation by JCOAL at “Indian Power Stations (IPS) 2017”, the
annual conference by NTPC India held in Delhi, India in February 2017.

Strategic Report on the New Role of Coal-fired Power Plant in the Era of Energy Transition
24
5.1.1 Type of reserve capacity
The following table shows that the types of reserves are classified into three types according
to the output response characteristics (activation time and duration). The operating reserve is secured
at about 8% of the maximum power demand assumption value on the day before and about 5% on
the day, considering the risk of power loss due to supply and demand assumption errors, mechanical
failures, etc., and short-term demand fluctuation risks.
In addition, about 3% of the time demand is secured for the spinning reserve as a part of the
operating reserve.
Table 3. Classification of Available Reserve18 Source: OCCTO19
Item Definition Applicable facility
Spinning
Reserve
A supply capacity that can immediately start
responding to load fluctuations and a
decrease in system frequency when the
power is turned off increases the output
within about 10 seconds and generates
electricity until the operating reserve is
activated.
Remaining capacity of
generator in free governor
mode during a partial load
operation
Operating
Reserve
Supply capacity that can be started in parallel
and within a short time (within about 10
minutes) to take the load and continue to
generate power until the standby reserve is
started and the load is taken.
・Remaining capacity of the
generator during a partial load
operation
・ Hydropower and gas
turbines waiting to stop
Standby
reserve
Supply capacity that takes several hours from
startup to parallel and loading. ・Thermal power plant on
stand-by
5.1.2 Supply and demand balance and frequency control
Figure 13 shows an image of various controls related to supply and demand balance and
frequency, and Table 4 shows multiple control methods for frequency fluctuation components.
Demand fluctuations (load fluctuations) in the power system are classified into three types according
to the fluctuation components. The controls shown in Table 4 are implemented according to each
fluctuation component.
18 Interim report of the committee on balancing power sources, OCCTO, March 2016 19 Organization for Cross-regional Coordination of Transmission Operators (OCCTO) is an organization
established in Japan in 2015 for the on-going power sector reform and stable and sustainable supply of
electricity through overseeing the cross-regional situation and issues around balancing power sources that is
crucial for the grid stability. https://www.occto.or.jp/en/index.html

Strategic Report on the New Role of Coal-fired Power Plant in the Era of Energy Transition
25
Figure 13. Image of various controls related to supply and demand balance and frequency
(Source: OCTTO)
Table 4. Various controls related to supply and demand balance and frequency (Source: OCCTO)
Measures Description
Free Governor Operation Mode
The system frequency is adjusted by a governor, which is a
device that automatically adjusts the amount of steam and water
that are the power so that the rotation speed of the generator is
maintained at a constant speed regardless of load fluctuations.
An operation that increases or decreases the output according to
changes.
Load Frequency Control (LFC)
To maintain the frequency of the power system and the power
flow of the interconnection line at regular times at the specified
values, the amount of frequency change and the amount of
change in the interconnection line power due to load fluctuations
are detected and the output of the generator is controlled.
Economic load Dispatching
Control (EDC)
Control that distributes the load to each power plant (each
generator) to achieve the power system's most economical,
stable, and rational operation.

Strategic Report on the New Role of Coal-fired Power Plant in the Era of Energy Transition
26
5.2 Enhanced roles of balancing power sources for the enhanced power
supply and demand control
Japan has relatively recently started unbundling the power sector, and the unbundling has
been still developing while the mass introduction of renewable energy power generation is
progressing. In this regard, it is deemed that the national mechanism of balancing power sources has
become increasingly important.
5.2.1 What are balancing power sources?
Under the simultaneous planned value equalisation system, the power generation company
and the retail electric power company match the plan and result in 30-minute units. However, in the
actual situation, there would be prediction errors. In addition, there is a gap between power supply
and demand due to ad hoc fluctuations and power losses. The supply capacity used by general power
transmission and distribution business operators to achieve electricity supply of the same amount
simultaneously is called "balancing power sources". The three events that require balancing power
sources are shown below.
Figure 14. Significant events to be addressed by balancing sources (Source: OCCTO)

Strategic Report on the New Role of Coal-fired Power Plant in the Era of Energy Transition
27
Table 5. Events to be addressed through balancing power sources (Source: OCCTO)
5.2.2 Classification of balancing power sources
Figure 15 shows an image of the classification of securing power sources, etc., by general
power transmission and distribution business operators. The balancing power sources are the power
supply I and power supply II, which are classified into three categories according to the presence or
absence of the frequency control function, etc. They are classified into six categories in total.
Prediction errors
A retail electric power company creates a demand plan by forecasting demand, but
since it is not possible to formulate a plan that exactly matches the actual demand,
there will be a difference between the forecast and the actual result after GC. This
is called "prediction error", and supply and demand are matched by using balancing
power sources.
In addition, the difference between the predicted value of renewable energy output
and the actual value, which was predicted two days before the actual supply and
demand day under the FiT, is also dealt with by balancing power sources.
Fluctuations over time
The actual demand is constantly changing, and the output of renewable energy is
also changing from moment to moment. Even if the forecast and the actual result
fall in the same 30-minute average value, small fluctuations occur in a time shorter
than 30 minutes. This is called "time fluctuation", for which measures of balancing
power sources are also taken.
Power loss
In case of power supply sags due to some unpredictable troubles, balancing power
sources will address to mitigate the supply-demand gap incurred.
GC (Gate closure)
GC in the balancing market mechanism is the point in time when submission or
update of a balancing energy bid for a standard product on a common merit order
list is no longer permitted. After GC during the closing period, no trading is
allowed.

Strategic Report on the New Role of Coal-fired Power Plant in the Era of Energy Transition
28
20
Figure 15. Type classification of power supply, etc. secured by general power transmission and
distribution business operators (Source: OCCTO)
5.3 Electricity market (wholesale electricity market, capacity market, supply, and demand balancing market)
Table 6 and Figure 16 is about the composition of the Japanese electricity market and the
transaction schedule in the electricity market, respectively. Currently, there is a wholesale electricity
market in Japan as a market for trading electricity, and the amount of electricity (kWh value) is traded.
In the future, when the capacity market and supply and demand balancing market are created, trading
of kW value and ⊿kW value will start.
20 Power sources I is the sources that general power transmission and distribution business operators do not
use for balancing (excluding emergencies).
Upward and downward balancing power capacity ((1) & (2)
Op
erat
ion
al The key is that the level of balancing of power sources that
general power transmission and distribution business
operators should take into consideration for the optimal grid
balancing. OCCTO carries out monitoring work based on
the foregoing consideration and the daily balancing plans
submitted by the general power transmission and
distribution business operators.
Pla
nn
ing
The key is that the level of balancing of power sources that
general power transmission and distribution business
operators should ensure by securing Power Sources I
through public biddings, the method of which is under
discussion at relevant expert meetings for the system
design. OCCTO is to ensure the sufficient capacity based on
the above information and the annual plans of balancing
sources.
Preliminarily reserved “Power Sources I” ((3))

Strategic Report on the New Role of Coal-fired Power Plant in the Era of Energy Transition
29
Table 6. Overview of Japan’s Electricity Market Mechanism Design (Source: OCCTO)
Figure 17 shows the roles and functions of the electricity market participants in the supply and
demand market balancing. In the supply and demand market, sellers (power generation companies,
aggregators) and buyers (general power transmission and distribution companies) are trading
companies with the ability to adjust as products. The seller provides "balancing power (⊿kW)" that
meets the market transaction requirements and executes the contract from the one with the lowest
bid (called "multi-price auction"). The power resources sellers bring to the market are categorised into
generators, batteries, and load equipment.
⚫ When trading a part of the kW value in the balancing market, it is difficult to procure the kW value
efficiently because there would be multiple procuring entities and procurement markets for the kW
value. In addition, the presence of multiple pricing in the kW value reduces the price indexability of
the capacity market.
⚫ In this context, it is envisaged as an excellent option to have all the kW values nationally required
traded in the capacity market, and then trade all the ⊿kW values required by general power
transmission and distribution business operators in the balancing market.
⚫ It is crucial that separate consideration will be made about the scope of kW value traded in the
capacity market, securing balancing power sources, and the range and degree of the cost to be
borne by operators.

Strategic Report on the New Role of Coal-fired Power Plant in the Era of Energy Transition
30
Figure 16. Electricity Market Trading Flow by Type of the Market (Source: OCCTO)
Figure 17. Roles and Functions of the Balancing Market Participants (Source: METI)
The requirements for the products for the supply and demand market balancing are shown
below. Currently, five products with different response times, durations, frequency balancing powers,
etc., are being considered. In addition, new resources such as demand-on-response (DR) and virtual
power plants (VPP) are also expected to be available.

Strategic Report on the New Role of Coal-fired Power Plant in the Era of Energy Transition
31
Table 7. List of By-function Product in the Supply-demand Balancing Market (Source: OCCTO)
Note: It has been under consideration and discussion initiated by the Government of Japan whether such
dedicated lines and simple command systems can be connected to the system of the CDCC (Central Dispatch
Control Center). In the meantime, the simple command system is used to send and receive uplink information.
As of now, it is envisaged that the entry of DR will be a major part of it, which will not affect the calculation of
area demand value. However, there is a possibility that the accuracy of area demand calculation may decrease
due to the connection of power generation systems such as VPP in the future. Therefore, consider setting an
upper limit on the connection capacity that does not require uplink information.
5.4 Overseas cases of demand-on-response (DR) mechanism
Table 8 summarises the demand-on-response (DR) market mechanism in France, while Figure
18 shows the example of introducing DR from PJM of the United States.
In France, as a measure to secure kW for peak demand, transactions are being actively carried
out in the AOE program (equivalent to Japan's power source I'), a market dedicated to DR. On the
other hand, transactions as balancing power have a transaction record as Primary Reserve (equivalent
to primary) and Rapid Reserve (equivalent to tertiary ①). In the US PJM, the capacity market occupies
the majority, and there are few transactions in the supply and demand balancing market (Ancillary
Services).

Strategic Report on the New Role of Coal-fired Power Plant in the Era of Energy Transition
32
Table 8. Overseas DR Market: The Case of France (Source: OCCTO21)
Figure 18. Overseas DR Market: The Case of the United States (Source: OCCTO)
21 The table was made based on the information available at RTI (France)’s website and the original interviews
and surveys OCCTO conducted in 2018.

Strategic Report on the New Role of Coal-fired Power Plant in the Era of Energy Transition
33
5.5 Flexibilisation at a coal-fired power plant
Flexible generation sources consist of conventional power plants and dispatchable renewable
generators such as biomass or geothermal plants. The fundamental requirement: They must have
the ability to ramp up rapidly and ramp down the output to follow net load, quickly shut down and
startup; and operate efficiently at a lower minimum level during high renewable energy output
periods
Coal-fired power plants, primarily pulverised coal-fired power plants, have a time delay for
pulverising coal and a time delay due to the large heat capacity of the boiler body and used to be
deemed to unserved as flexible power sources. However, a coal-fired power plant can serve as a
flexible power source by conducting flexible operations as long as appropriate measures are taken.
The points of flexibilisation include improvement of load change rate, reduction of minimum
coal combustion load, and shortening of startup time.
The first step in improving the load change rate is to improve the coal output characteristics
of the mill. In the case of a vertical mill, the classifier at the outlet of the mill has been changed from
a fixed type to a rotary type, the roller has been changed from a spring type to a hydraulic type, and
the airport has been changed from a fixed type to a rotary type and increasing the mill motor capacity
and applying an inverter, and the control device has also been improved. By doing so, the coal output
characteristics are improved. In the case of a ball mill, a method of controlling the amount of coal
held in the mill by adjusting the coal level is also conceivable. Figure 19 shows a schematic diagram
of a vertical mill and a ball mill.
Figure 19. Overview of Vertical Mill and Ball Mill (Source; IHI22)
22 IHI Corporation, Japan. https://www.ihi.co.jp/en/

Strategic Report on the New Role of Coal-fired Power Plant in the Era of Energy Transition
34
Improvement of steam temperature control is also essential, and as superheated steam
temperature control, a method of increasing the number of superheater spray stages from 2 stages
to 3 stages and finely controlling them is adopted. In the reheater steam temperature control, the
reheater gas recirculation fan method, parallel path damper method, reheater inlet water spray
method, etc., are adopted. However, to prevent efficiency decrease, the parallel path damper method
is adopted. Alternatively, the reheater bypass steam spray method may be adopted. An example of
a system for improving steam temperature control is shown in Figure 20.
Figure 20. A Case Example of Steam Temperature Control Improvement (Source: JCOAL)
It is also important to reduce the minimum load for coal combustion and expand the operating
load range. In a pulverised coal-fired boiler, pulverised coal crushed by a mill is transported to a burner
by air. Therefore, even if the boiler load is low, the amount of air for transportation is secured, so that
the amount of air cannot be reduced, the concentration of pulverised coal in the burner portion is
diluted, and combustion becomes difficult. To solve this, it is necessary to separate the pulverised
coal in the burner portion into a high concentration side and a low concentration side to improve
combustibility. This burner is the Wide Range Burner, and it is possible to reduce the minimum load
for coal burning. In addition, since the burner turndown is widened, the load band that does not
require the start and stops of the mill is enlarged, and the operability is improved.
Figure 21 shows a schematic diagram of the Wide Range Burner. In addition, the figure shows
an enlarged example of turndown when the Wide Range Burner is adopted.

Strategic Report on the New Role of Coal-fired Power Plant in the Era of Energy Transition
35
Figure 21. Overview of the Wide Range Burner (Source: IHI)
Figure 22. Turndown expansion example with wide range burner (Source: IHI)
Attention is to be paid that as the load decreases, the efficiency also decreases. In this context,
a comprehensive judgment is required to determine whether flexibilisation measures are taken
before implementation. In a constant pressure operation plant, adopting a transformer operation
makes it possible to suppress a decrease in efficiency at the time of partial load.

Strategic Report on the New Role of Coal-fired Power Plant in the Era of Energy Transition
36
When installing a denitration device such as a selective catalytic NOx reduction device (SCR),
if there are restrictions on the gas temperature used, it is necessary to install an economiser bypass
gas system to secure the gas temperature required for using SCR even when the load is low.
Since it is required to start and stop frequently for flexibilisation, it is important to shorten the
start time, for which it is necessary to raise the steam temperature quickly, and it is important to plan
the startup bypass system.
The startup bypass system includes a superheater bypass and a turbine bypass. The
superheater bypass makes it possible to obtain high-temperature steam early by extracting low-
temperature steam at startup from the middle of the superheater and steaming the superheater tube.
Turbine bypass is a bypass line that directly connects the steam at the turbine inlet to the condenser.
The steam that bypasses the high-pressure turbine passes through the reheater to cool the reheater,
bypassing the low-pressure turbine and connecting it to the condenser. There is a high and low-
pressure turbine bypass. Since the high-low pressure turbine bypass can cool the reheater tube, a
large amount of fuel can be input, leading to a reduction in startup time. Which activation bypass
system to use is determined based on installation cost and operability. Figure 23 shows an example
of the startup bypass system.
Figure 23. An Example of Start-up Bypass System (Source: JCOAL)
As clarified in the preceding chapter, load followability in existing power plants is crucial to
sustaining grid stability during massive renewable integration. A coal-fired power plant is not an
exception and as shown, it is just possible as long as appropriate measures are taken so that any
inconveniences to the operation and production of power at the plant will be minimised while
contributing to the grid stability. Improving the load change rate, reducing the minimum loading rate
of coal combustion, and shortening the startup time is possible by modifications and modified
operations related to many equipment and facilities such as mills, burners, boilers, water/steam

Strategic Report on the New Role of Coal-fired Power Plant in the Era of Energy Transition
37
systems, air/gas systems, and turbine-related equipment as well as a control instrument.
Consultations with the original manufacturers of the equipment are highly recommended to identify
the optimal measures for sustainable flexibilisation at the concerned power plant.

Strategic Report on the New Role of Coal-fired Power Plant in the Era of Energy Transition
38
Chapter 6: CCT and HELE for
environmental compliance of coal-fired
power plants.
6.1 Working on regional and global environmental conservation through
CCT and HELE For the continuous use of coal, it is important to take measures to improve the environment
at the local and global levels. Figure 24 shows the technical system diagram of CCT and HELE. The
left side is mainly related to regional environmental measures, and the right side is related to global
environmental measures.
Figure 24. Overview of HELE / CCT (Source: JCOAL)
Reduction of dust, SOx, and NOx is particularly important as a regional environmental measure,
and many reduction measures are being implemented worldwide. As a measure against dust, a dry
electrostatic precipitator (ESP) is generally used. When strengthening dust countermeasures, it is
necessary to expand the installation space, but by adopting a moving electrode type electrostatic
precipitator (MEEP), it is not required to expand the installation space and performance can be
improved. Figure 25 shows the schematic structure of MEEP.

Strategic Report on the New Role of Coal-fired Power Plant in the Era of Energy Transition
39
Figure 25. An Overview of MEEP (Source: Mitsubishi Power23)
As a SOx reduction measure, the limestone gypsum method, which is wet desulphurisation
equipment (FGD), is generally used. In the limestone gypsum method, the by-product gypsum can
be used as a raw material for gypsum board, cement, and the like. In addition, the seawater method
may be adopted as a simple and inexpensive method. In addition, when reducing the amount of
water used, a dry desulfurisation device may be adopted.
Figure 26. Limestone Gypsum Method FGD (Source: Mitsubishi Power) NOx reduction measures can be divided into steps using boilers and measures using
denitration equipment. Measures for boilers include adopting low NOx burners, reducing excess air
rate, adopting in-furnace NOx reduction technology, and adopting non-catalytic denitration equipment.
Depending on the regulation value, these measures may be able to be taken without installing a
denitration device. If NOx regulation is strict, a selective catalytic NOx reduction device (SCR) is
23 Mitsubishi Power, Ltd. https://power.mhi.com/

Strategic Report on the New Role of Coal-fired Power Plant in the Era of Energy Transition
40
required, but the amount of catalyst can be set according to the regulation value. Figure 27 shows
typical NOx reduction measures.
Figure 27. NOx Reduction Measures: Low NOx Burner (IHI), In-Furnace NOx reduction technology
(IHI), SCR (Mitsubishi Power)
In these regional environmental measures, it is necessary to select an appropriate method
according to the environmental regulation value. Still, a comprehensive check is also important for
strengthening the environmental regulation value in the future. Figure 28 shows a typical flue gas
treatment system (AQCS) in a wet desulphurisation system.
OAP

Strategic Report on the New Role of Coal-fired Power Plant in the Era of Energy Transition
41
Figure 28. Schematic Diagram of AQCS by Type (Mitsubishi Power)
Although there is a mercury emission standard in the environmental regulation value, mercury
emission is also reduced in AQCS, and mercury emission from the exhaust gas is reduced by
promoting the oxidation of mercury with a denitration catalyst is also possible. Figure 29 shows the
concept of reducing mercury emissions.
Figure 29. A system with Reduced Mercury Emissions (Source: Mitsubishi Power)
As a global environmental measure, CO2 emissions are reduced to prevent global warming.
Since coal-fired fuels emit more CO2 than other fossil fuels, we have been reducing CO2 emissions
by improving efficiency.
As a typical example of improving the efficiency of coal-fired power plants, efficiency
improvement has been promoted from a subcritical pressure plant to a supercritical pressure (SC)

Strategic Report on the New Role of Coal-fired Power Plant in the Era of Energy Transition
42
plant and from an SC plant to an ultra-supercritical (USC) plant. Recently, further development and
practical application of high-efficiency plants such as advanced ultra-supercritical pressure (A-USC),
integrated gasification combined cycle (IGCC), and integrated gasification fuel cell cycle (IGFC) have
been promoted.
Biomass is also being used as a measure to prevent global warming. This is because biomass
is carbon-neutral, so using it instead of fossil fuel will lead to CO2 reduction. The circulating fluidised
bed boiler (CFB) technology with possibly increased biomass cofiring rate will improve the global
environment through application to small and medium-sized thermal power generation facilities
where it is difficult to improve efficiency with pulverised boilers and grid connection is not available.
Figure 30 shows the options for biomass utilisation technology.
Figure 30. Overview of biomass firing technology choices (Source: JCOAL)
Figure 31 shows Japan's primary energy and power supply plans. The plan for 2030 is to
supply 20% of electricity from renewable energy.
Strategic Report on the New Role of Coal-fired Power Plant in the Era of Energy Transition
43
Figure 31. Japan's primary energy and power supply plan (Source: METI24)
6.2 Forward-looking initiatives to ensure the steady and sustainable
energy transition
Carbon recycling, abbreviated as CR, is a philosophy and concept that underpins our global
endeavours toward carbon neutrality. With CR, carbon dioxide is understood as a carbon source, so
capturing and recycling these material activities are being facilitated. Carbon dioxide (CO2) is to be
utilised for producing recycled materials and fuels by mineralisation, artificial photosynthesis, and
methanation and this will also control CO2 emissions to the air. That way, it is anticipated that CR and
CCUS will bolster the emissions reduction.
24 Press Release by METI on July 27, 2021. Available at
https://www.meti.go.jp/press/2021/07/20210726007/20210726007.pdf

Strategic Report on the New Role of Coal-fired Power Plant in the Era of Energy Transition
44
6.2.1 Carbon recycling (CR) Initiatives by Japan
In 2019, Japan formulated the "Carbon Recycling 3C Initiatives" to facilitate the development
and commercialisation of Carbon Recycling technologies.
Figure 32. Conceptual view of carbon recycling (CR) (Source: METI25)
The CR Initiatives by the Government of Japan consist of three major activities, i.e., Caravan,
Center of Research, and Collaboration.
Figure 33. Overview of CCUS and CR (Source: JCOAL)
25 Presentation on “Carbon Recycling 3C Initiative” by METI in October 2020

Strategic Report on the New Role of Coal-fired Power Plant in the Era of Energy Transition
45
“Caravan” enhances bilateral and multilateral relationships by sharing information through
various occasions such as international conferences and workshops. As for the “Center of
Research”, two key sites have been designated as the center of research under the initiative. The
two centres, i.e., Osakkikamijima for IGCC / IGFC & CCS and Tomakomai for CCS are essential for
the outreach for overseas stakeholders with the progress and outcomes of their projects as well as
for the ongoing R&D activities.
“Collaboration” is the third and another important component of the CR Initiatives. It is to
expand industry-academic-government research projects in the field. Figure 34 shows the three-
phased CR Roadmap by the Government of Japan.
Figure 34. CR Roadmap of the Government of Japan (Source: METI)26
26 Press Release by METI on July 27, 2021. Available at
https://www.meti.go.jp/press/2021/07/20210726007/20210726007.pdf

Strategic Report on the New Role of Coal-fired Power Plant in the Era of Energy Transition
46
The two key Centers of Research under the CR Initiatives
1) Osaki Coolgen
Figure 35. Location of Osakikamijima (Source: METI27)
Osaki Coolgen is a grand project involving key technology-owning companies and relevant
institutions to develop IGCC, IGFC, and CCUS in Osakikamijima, Hiroshima Prefecture in Western
Japan.
This project consists of three steps. They have achieved the targets of the first step of
obtaining sufficient performance of oxygen-blown integrated coal gasification combined cycle
(oxygen-blown IGCC), which is a core technology of the forthcoming integrated coal gasification fuel
cell combined cycle (IGFC) that can be the ultimate high-efficiency technology generating electricity
with a gas turbine, steam turbine, and fuel cells. Currently, they are conducting the demonstration of
oxygen-blown IGCC with CO2 capture, followed by the installation of fuel cells to the IGCC system
to enhance the efficiency in IGFC with CO2 capture. The phased demonstration of IGCC, IGCC with
CO2 capture, and IGFC with CO2 capture are planned to complete in early 202328.
27 Press Release by METI on July 27, 2021. Available at
https://www.meti.go.jp/press/2021/07/20210726007/20210726007.pdf 28 Osaki Coolgen Corporation, https://www.osaki-coolgen.jp/en/project/overview.html
Osakikamijima
Hiroshima

Strategic Report on the New Role of Coal-fired Power Plant in the Era of Energy Transition
47
Figure 36. Osaki Coolgen Project Schedule (Source: Osaki Coolgen29)
Now as a Center of Research for CR, another component has been added. Algae
carbon recycling technology has been tested. Microalgae can be utilised as raw materials for
producing diesel fuel, jet fuel, plastics, feed, etc. The following is the outline of the Algae
Carbon Recycling Technology Demonstration program.
Figure 37. Outline of the Algae Carbon Recycling Technology Demonstration (Source: METI)30
2) Tomakomai CCS
Figure 38. Location of Tomakomai in Japan31
The other key Center of Research under the CR Initiatives, Tomakomai CCS Project,
conducted by the Ministry of Economy, Trade, and Industry (METI), New Energy and Industrial
Technology Development Organization (NEDO), and Japan CCS Co., Ltd (JCCS), is the first large
scale CCS demonstration in Japan. The entire plant was constructed in FY2012-2015, followed by
the injection starting from April 2016 at a scale of 100 thousand tonnes per annum. They achieved
29 Osaki Coolgen Corporation, https://www.osaki-coolgen.jp/en/project/overview.html 30 Presentation on “Carbon Recycling 3C Initiative” by METI in October 2020 31 https://simple.wikipedia.org/wiki/Tomakomai,_Hokkaid%C5%8D
Algae Carbon Recycling Technology Demonstration
-Project period: 2017-2020
-Total project cost: 1.92 billion yen
-Project operator: IHI・ Fuel production target: 100s-1,000 kL/y in 2030
-Absorbed CO2 amount expected: 12-13 tCO2/year

Strategic Report on the New Role of Coal-fired Power Plant in the Era of Energy Transition
48
the initial target cumulative injection of 300 thousand tonnes on November 22, 2019. Now the project
is in the phase of post-injection monitoring.
Figure 39. Overview of process, progress, and outcomes of the Tomakomai CCS Project
(Source: Japan CCS32)
Figure 40. Bird’s-eye View of the Tomakomai CCS Project Site (Source: Japan CCS)
The following are confirmed as the outcomes of the foregoing demonstration activities.
Further development, application, and implementation are anticipated based on the results of
the project.
• Full chain CCS system from capture to storage has been demonstrated
32 Japan CCS Co., Ltd. https://www.japanccs.com/en/
The project was supported by New Energy and Industrial Technology Development Organization (NEDO).

Strategic Report on the New Role of Coal-fired Power Plant in the Era of Energy Transition
49
• No seismicity (Mw>-0.5) has been detected in/around the depth range of the reservoirs
before and after the start of the injection
• Natural earthquakes have not caused any damage to the facilities or reservoirs of the
project
• The first monitor 3D survey successfully detected an anomaly at cumulative CO2 injection
of 61,000 to 69,000 tonnes into the Moebetsu Formation, matching simulation results
• The project has been conducted with the understanding and support of the local
community, thanks to the forward-looking way of outreach activities by the project
partners
• The CO2 cumulative injection target of 300,000 tonnes has been achieved as scheduled,
which means completing the demonstration project.

Strategic Report on the New Role of Coal-fired Power Plant in the Era of Energy Transition
50
Chapter 7: Policy Implications and
Recommendations
Different regions go through different energy transition pathways. In a growing region like
ASEAN, meeting the demand is as important as achieving emission reductions. As discussed in the
previous chapters, coal remains to be a considerable resource in the region and therefore, it is crucial
to redefine the new role of coal moving forward to this new era of decarbonisation.
To further advance a higher adoption of low carbon technologies on coal, it is deemed that
changes in the existing coal policies are needed. This chapter clusters the policy recommendations
on cleaner coal utilisation in the ASEAN region into three main areas: 1) Increasing efficiency through
HELE utilisation, 2) Pollution and emission regulatory, institutional, and technology enhancement, and
3) Carbon capture, utilisation, and storage (CCUS) deployment.
Increasing efficiency through HELE utilisation
• A regulatory framework to mandate newly built and retrofitted coal-fired power plants to use
the more advanced supercritical and ultra-supercritical technologies
• Promote the dispatch of electricity generated from cleaner and more efficient coal plants for
the baseload, and keeping the older plants running at minimum
• Provide financial mechanisms to support the shift to HELE technologies in new plants, and
the upgrade of the less efficient systems in existing plants
• Provide support to HELE projects in terms of design and construction by easing the
permitting and supply chain barriers to these processes
• Provide capacity building that will develop local talents and improve their operation and
maintenance capabilities
• Strengthen research on load balancing to fully capitalise on the reliability of coal power to
regulate the fluctuations of renewable power
• Improve public awareness on the economic benefits and improvements of coal-fired power
plants utilising high efficiency, low emission technologies
Pollution and emissions regulatory, institutional, and technology enhancement
• Establish more stringent emission standards for coal-fired power plants to push clean coal

Strategic Report on the New Role of Coal-fired Power Plant in the Era of Energy Transition
51
technology deployment
• Promote the use of pollution control and removal systems with higher efficiency in existing
coal-fired power plants by providing incentives to adopters
• Strengthen research on new pollution control techniques and promote their gradual
deployment
• Cofiring of carbon-neutral fuels such as biomass at coal-fired power plants to mitigate
pollution and CO2 emissions
• Enhance local government initiatives and formulation of well-coordinated assessment,
monitoring, and evaluation schemes to make the foregoing endeavors about regulatory and
technology aspects work
Carbon capture, utilisation, and storage deployments
• Improve public awareness on the feasibility and implication of deploying carbon capture,
utilisation, and storage (CCUS) in the region
• Undertake storage assessments and characterisation
• Provide legal and regulatory framework in undertaking pilot, demonstration, and commercial
deployments in terms of liability and transboundary transport and storage
• Research the potential of CO2 transport and storage networks among ASEAN states to
enhance the economies-of-scale and lower the investment costs, and perform regional
source-sink mapping
• Research the appropriate financial and/or carbon pricing mechanisms to advance the
deployment of CCUS in existing and new coal-fired power plants
These recommendations must also be accompanied by rigorous policy supports and
enforcement of each member state to ensure proper transition towards sustainable coal use in the
ASEAN region. The general concept of this report is to demonstrate strategies on how the region
can continuously utilise coal resources in a cleanest-possible manner, in parallel of renewable energy
use and energy efficiency, to ensure energy security and cushion the impact of integrating large
capacity of renewables in the grid.

Strategic Report on the New Role of Coal-fired Power Plant in the Era of Energy Transition
52
References
ACE and CETERI. (2019). Cleaner Coal Utilization Roadmap in ASEAN. Retrieved from
https://aseanenergy.org/study-on-cleaner-coal-utilization-roadmap-in-asean/
ASEAN Centre for Energy. (2015). ASEAN Plan of Action for Energy Cooperation (APAEC) 2016-2025.
ASEAN Centre for Energy, June 2004, 2004–2009.
ASEAN Centre for Energy. (2020). ASEAN CO2 Emissions from Coal-Fired Power Plants: A Baseline
Study. Retrieved from https://aseanenergy.org/asean-co2-emissions-from-coal-fired-power-
plants-a-baseline-study/
California ISO (n.d.). “What the duck curve tells us about managing a green grid”. Retrieved from
https://www.caiso.com/documents/flexibleresourceshelprenewables_fastfacts.pdf
Central Electricity Authority (CEA) of India. (2021). Presentation at CEA-JCOAL Workshop (a closed
bilateral event).
Global CCS Institute and ACE. (2014). ASEAN CCS strategic considerations. June.
https://aseanenergy.org/asean-ccs-strategic-considerations/
IEA-CCC. (2019). Presentation of IEA-CCC at AFOC CCT Workshop in Bangkok.
IHI Corporation, Japan. (n.d.). NOx Reduction Measures. Retrieved from https://www.ihi.co.jp/en/
IRENA. (2020). Global Renewables Outlook: Energy transformation 2050. In International Renewable
Energy Agency. https://www.irena.org/publications/2020/Apr/Global-Renewables-Outlook-2020
Janetschek, H., & Iacobuta, G. (2019). Connections between the Paris Agreement and the 2030
Agenda. September.
Japan CCS Co., Ltd. (n.d.) Japan Carbon Capture and Storage Initiative. Retrieved from
https://www.japanccs.com/en/
METI. (2020). Presentation on “Carbon Recycling 3C Initiative” in October 2020.
METI. (2021). Press Release by Ministry of Economy, Trade, and Industry of Japan (METI) on July
27, 2021. Retrieved from https://www.meti.go.jp/press/2021/07/20210726007/20210726007.pdf
Mitsubishi Power, Ltd. (n.d.). Flue gas treatment and mercury removal system. Retrieved from
https://power.mhi.com/
OCCTO. (2016). Interim report of the committee on balancing power sources.
OCCTO. (n.d.). Information at the website of Organization for Cross-regional Coordination of
Transmission Operators. Retrieved from https://www.occto.or.jp/en/index.html
Osaki Coolgen Corporation. (n.d.). Osaki Coolgen Carbon Recycle. Retrieved from
https://www.osaki-coolgen.jp/en/project/overview.html

Strategic Report on the New Role of Coal-fired Power Plant in the Era of Energy Transition
53
Raitzer, D. A., Bosello, F., Tavoni, M., Orecchia, C., Marangoni, G., & Nuella Samson, J. G. (2015).
Southeast Asia and The Economics of Global Climate Stabilization. Asian Development Bank, 1–
191.
Sönke, K., Eckstein, D., Dorsch, L., & Fischer, L. (2020). Global climate risk index 2020.
https://germanwatch.org/en/download/7170.pdf
The ASEAN Centre for Energy. (2015). ASEAN Energy Outlook. Journal of Chemical Information and
Modeling, 53(9), 1689–1699.
United Nations ESCAP. (2020). Regional Energy Trends Report 2020: Tracking SDG 7 in ASEAN
Region. https://www.unescap.org/publications/regional-energy-trends-report-2020-tracking-sdg-7-
asean-region
United Nations. (2018). AFFORDABLE AND CLEAN ENERGY: energy efficient. The Sustainable
Development Goals Report. http://www.un.org/sustainabledevelopment/energy/
Vinzi, Vincenzo Esposito, et.al. (2010). Handbook of Partial Least Squares Concepts Methods and
Applications. Retrieved from https://link.springer.com/book/10.1007/978-3-540-32827-8