Embed Size (px)
Citation preview
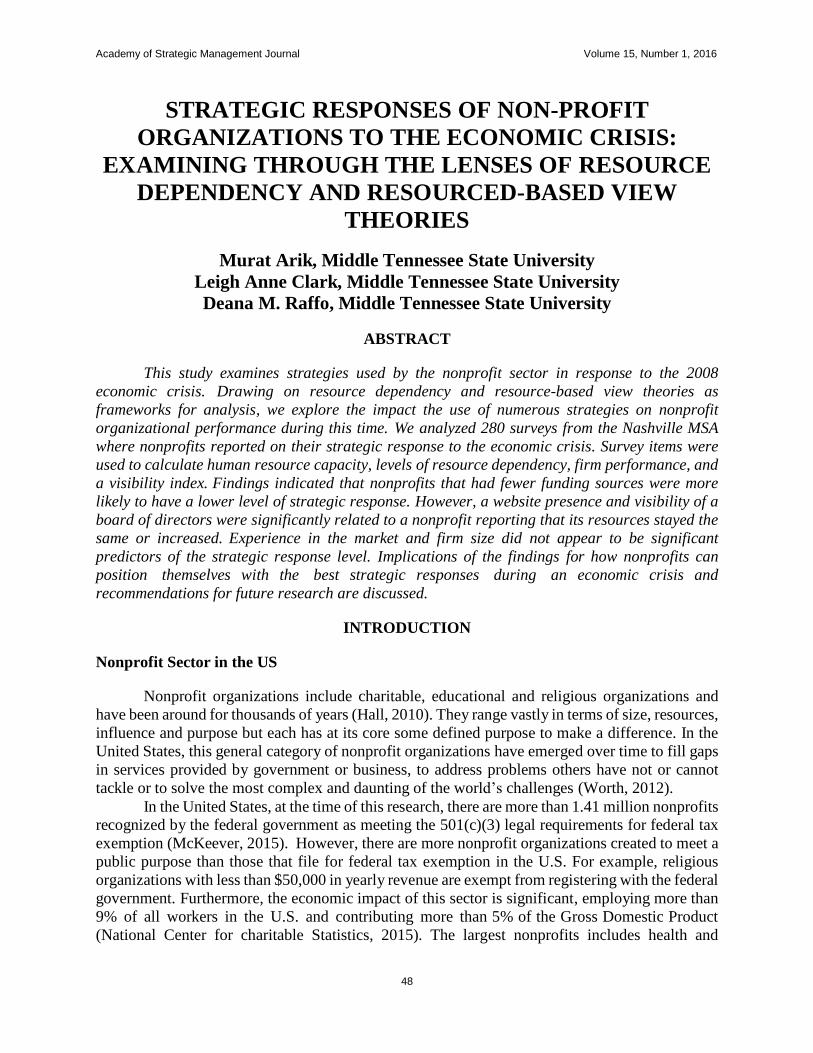
Academy of Strategic Management Journal Volume 15, Number 1, 2016
48
STRATEGIC RESPONSES OF NON-PROFIT
ORGANIZATIONS TO THE ECONOMIC CRISIS:
EXAMINING THROUGH THE LENSES OF RESOURCE
DEPENDENCY AND RESOURCED-BASED VIEW
THEORIES
Murat Arik, Middle Tennessee State University
Leigh Anne Clark, Middle Tennessee State University
Deana M. Raffo, Middle Tennessee State University
ABSTRACT
This study examines strategies used by the nonprofit sector in response to the 2008
economic crisis. Drawing on resource dependency and resource-based view theories as
frameworks for analysis, we explore the impact the use of numerous strategies on nonprofit
organizational performance during this time. We analyzed 280 surveys from the Nashville MSA
where nonprofits reported on their strategic response to the economic crisis. Survey items were
used to calculate human resource capacity, levels of resource dependency, firm performance, and
a visibility index. Findings indicated that nonprofits that had fewer funding sources were more
likely to have a lower level of strategic response. However, a website presence and visibility of a
board of directors were significantly related to a nonprofit reporting that its resources stayed the
same or increased. Experience in the market and firm size did not appear to be significant
predictors of the strategic response level. Implications of the findings for how nonprofits can
position themselves with the best strategic responses during an economic crisis and
recommendations for future research are discussed.
INTRODUCTION
Nonprofit Sector in the US
Nonprofit organizations include charitable, educational and religious organizations and
have been around for thousands of years (Hall, 2010). They range vastly in terms of size, resources,
influence and purpose but each has at its core some defined purpose to make a difference. In the
United States, this general category of nonprofit organizations have emerged over time to fill gaps
in services provided by government or business, to address problems others have not or cannot
tackle or to solve the most complex and daunting of the world’s challenges (Worth, 2012).
In the United States, at the time of this research, there are more than 1.41 million nonprofits
recognized by the federal government as meeting the 501(c)(3) legal requirements for federal tax
exemption (McKeever, 2015). However, there are more nonprofit organizations created to meet a
public purpose than those that file for federal tax exemption in the U.S. For example, religious
organizations with less than $50,000 in yearly revenue are exempt from registering with the federal
government. Furthermore, the economic impact of this sector is significant, employing more than
9% of all workers in the U.S. and contributing more than 5% of the Gross Domestic Product
(National Center for charitable Statistics, 2015). The largest nonprofits includes health and
Academy of Strategic Management Journal Volume 15, Number 1, 2016
49
education systems such as public hospitals and universities.
Historically, nonprofits were funded by private donors and were seen as a creative vehicle
for wealthy individuals to meet an obligation or duty to take care of others. Nonprofits flourished
during the Industrial Revolution as some individuals’ incomes burgeoned. The Industrial
Revolution also generated a lot of social need due to poor worker conditions, child labor issues,
and long hours. Following the Great Depression and the federal government’s action to provide
direct services, nonprofits often partnered with the government directly to receive federal grants
to deliver services. This dependence on private support and the government were the mainstays of
funding for nonprofits for many decades (Hall, 2010; Worth, 2012).
A change in government funding philosophy delivered a jolt to the nonprofit sector in the
1980s. Under the leadership of President Reagan, the federal government reduced and privatized
funding for many social programs. Many nonprofits were heavily dependent on government
funding to support their work (Hall, 2010). Nonprofits that were receiving government grants to
deliver services could no longer count on that steady stream of income. The privatization of social
programs often meant that less service were funded or provided which increased the request for
services that nonprofits offered. The nonprofit sector had to adjust to compete for privatized
government grants in this new landscape as well as develop new ways to rise funding (Hall,
2010).
Other changes involved a heightened demand for accountability and transparency. For
many years, most nonprofits were evaluated for their mission and the good that they set out to do,
rather than by their measurable impact. In the 1990s, there was a shift related to the funding source
for nonprofits. The technology boom made some people wealthy, and a new donor emerged that
was younger, outcome focused, and wanted to view their donation as an investment. They expected
a return on that investment and required nonprofits to demonstrate their success and impact. At the
same time, there were some scandals in the nonprofit sector that led to a call for accountability.
The nonprofit sector was pushed, and often mandated, to adopt business operating procedures to
provide evidence of results and accountability to deep pocket donors and the general public (Hall,
2010; Worth, 2012).
Most recently, there has been a growth in social innovation by for-profit companies
addressing traditional “nonprofit” challenges in innovative, sustainable ways anchored around a
for-profit or hybrid model. Some government and private grants are allowing these new
organizations to compete with nonprofits on an even playing field. Nonprofits have to adjust to
increased competition and a continuing demand for more accountability (Salamon, 2010).
This call to operate more like a business included a push to be more strategic, to conduct
long-range as well as short-range planning, to diversify funding sources, and determine its unique
competitive advantage (Hall, 2010). Large, established nonprofits adopted business principles
more quickly, but even the medium to small nonprofits have done so. The nonprofit sector today
is continuing to become more sophisticated in its use of strategy, marketing, and management tools
to achieve its mission.
Economic Crisis 2008-2011
In 2008, the U.S. economy experienced a severe crisis largely attributed to the burst of a
real estate bubble. Risky mortgage loans, coupled with questionable banking policies and
Academy of Strategic Management Journal Volume 15, Number 1, 2016
50
practices, led to a large increase in foreclosures which precipitated this economic crisis (Gerardi,
Lehnert, Sherlund & Willen, 2008). Mortgages were granted to individuals without the means to
pay them back, bankers benefited from bonuses based on volume rather than stability of profits,
and “too big to fail” was born (Acharya & Richardson, 2009). This resulted in a global recession
with record stock market losses, business downsizing or shut downs, high unemployment rates,
and financial uncertainty on the largest scale we have seen since the Great Depression (Bansal,
Jiang & Jung, 2015). Furthermore, it is expected that the consequences from the economic decline
will continue to have an effect on the nonprofit sector due to job losses, slow income growth,
retirement account losses, and uncertainty in donor confidence, and continued undercurrents of
anxiety and skepticism during the recovery period (Zietlow, 2010).
During the economic downturn, nonprofit organizations felt the impact perhaps more
acutely than for-profit businesses because they dealt with not only shrinking resources, but with
an increased demand for services. The recession came at a time when charitable giving hit an all-
time high of $306 billion in 2007, up from $295 billion in 2006 (Reed & Bridgeland, 2009) then
falling 3.6% in 2009 which was the steepest decline in charitable giving since tracking began in
1956 (The Center on Philanthropy at Indiana University, 2010). Individual donations decreased
(Casey, 2012) and businesses reduced their corporate giving (Banasal, Jiang & Jung, 2015). Key
findings from one study indicated that 83% of nonprofits reported fiscal stress with close to 40%
reporting “severe” or “very severe” fiscal stress and approximately half (51%) reporting declining
revenues (Salamon, Geller, & Spence, 2009). A 2011 survey reported that 85% of nonprofits have
continued to expect an increase in service demand (Nonprofit Finance Fund, 2011) even as the
U.S. Economy has been in a recovery stage since 2010 and nonprofits reported they were still
feeling the effects of the economy’s decline in 2012 (Pettijohn, Boris, & Farrell, 2014).
Yet even while the U.S. was in an economic recession and nonprofits experienced declining
revenues, this sector experienced growth. This was driven partly by the Obama administration’s
economic stimulus package known as the American Reinvestment and Recovery Act (Casey,
2012) and other governmental policies (Salamon, Geller, & Spence, 2009). Despite the
economic challenges the nonprofit sector was able to adapt and apply strategic and innovative
approaches to a changing environment. More than two-thirds of nonprofits reported that they
were “successful” or “very successful” in coping with the financial crisis (Salamon, Geller, &
Spence, 2009).
Nonprofits handled the economic hardship and uncertainty using a host of management
strategies to survive, from diversifying their revenue sources to expanding their human capacities.
Human resources strategies varied and sometimes involved cuts such as reducing staff, furloughs,
pay reductions, salary freezes, and postponing new hires. Conversely, strategies to expand human
capacities included reassignments, shifting roles geared toward fundraising, strengthening
relationships with boards and other alliances and external associations, and relying more heavily
on volunteers were used (Casey, 2012; Mosley, Maronic, & Katz, 2012). Financial strategies
ranged from cuts to innovative partnerships. Fiscal safeguarding often involved cutting operational
expenses with downsizing or reducing waste. Yet this was also a time where nonprofits added
programs to generate revenue streams, competed for grants when they would not have otherwise,
created innovative fundraising efforts, collaborated or initiated joint ventures to share or expand
resources, found new funding sources from governmental agencies, and created innovative
marketing strategies and entrepreneurial activities ( Mosley, Maronic, &Katz, 2012; Salamon,
Geller, & Spence, 2009) .
Academy of Strategic Management Journal Volume 15, Number 1, 2016
51
Strategic planning with both conventional and innovative tactics in the nonprofit sector
saw positive results during the economic downturn. This study explores the impact that the use of
these strategies has on nonprofit organizational performance during this time. Specifically, we aim
to answer three questions:
1) What were the strategic responses of nonprofits to the economic crisis?
2) Which nonprofit factors determined a stronger level of strategic responses?
3) Which strategic responses were related to overall financial growth of the nonprofit?
To answer these questions, this paper draws on two widely used strategic management
theories that complement each other in a unique way in explaining nonprofit strategies and
performance. Resource Dependency Theory (RDT) and Resource-Based View (RBV) are used to
understand a nonprofit’s strategic responses in the face of the economic crisis.
THEORETICAL FRAMEWORK
Some of the best management theorists have put forth their beliefs on why organizations
come to be and what makes them successful. Within this body of work, are two well-known
theories of the firm: Resource Dependency Theory and a Resource-based View of the Firm Theory.
It is through the lens of each of these theories that we examine the strategic responses nonprofits
took during the economic crisis to determine how well they explain why some nonprofit
organizations were more successful than others.
Resource Dependency Theory
The resource dependence perspective is based on power dynamics and has grown from the
work of Pfeffer and Salancik (see The External Control of Organizations: A Resource Dependence
Perspective, 1978). At its basic level, the resource dependence theory explains that organizations
are a collection of power relations based on the exchange of resources (Ulrich & Barney, 1984).
To be successful, organizations modify their structure and patterns of behavior to best secure
needed external resources. An organization gains overall power by having resources that others
need and decreasing its dependence on others for resources crucial to its own needs.
The Resource Dependency Theory has the following three main parts as explained by
Ulrich & Barney (1984, p. 472):
First, organizations are assumed to be comprised of internal and external coalitions.
Coalitions emerge from social exchanges that are formed to influence and control behavior.
Second, the environment is assumed to contain scarce and valued resources essential to
organizational survival. Third, organizations are assumed to work towards two related
objectives within their environment: (1) to acquire control over resources that minimize their
dependence on other organizations and (2) to acquire control over resources that maximize
the dependence of other organizations on themselves.
The environment is a source of uncertainty for the organization as the organization must
always try to develop the relationships to maximize its power and reduce the uncertainty.
Organizations limit uncertainty by building coalitions, formal and informal relationships, or
bringing some resources internally to have better control (Ulrich & Barney, 1984).
Pfeffer and Leong (1977) explored the power relationships of nonprofit agencies
participating in the United Fund coalition (now known as the United Way). They identified that

Academy of Strategic Management Journal Volume 15, Number 1, 2016
52
community needs and the services provided would be sure of uncertainty as well as the amount
of funds raised through the United Fund efforts. They found that nonprofit organizations had more
power within the United Fund if they were visible to others and more established because they
were able to attract outside resources. In a similar study, Provan, Beyer, and Kruytbosch (1980)
explored the influence that nonprofits receiving funding from the United Way had over the United
Way organization because of the individual nonprofits’ strong ties to the community and ability to
meet community needs. The researchers did not find a significant relationship between strength of
community ties and the amount of funding provided explaining that those power gains may not be
exercised except when they are needed by a nonprofit -- for example during an economic
downturn. With a funding agency such as the United Way, an economic crisis will increase the
dependence of a nonprofit on the United Way and will increase the United Way’s dependence on
all existing nonprofits to convey the need to the community to continue supporting the United
Way.
One resource for the nonprofit organization is its board of directors. The board of directors
of a nonprofit organization is very important in terms of governance and access to resources
(Mwenja & Lewis, 2009). The members of the board are a source of relational capital linking the
organization to different social networks and additional financial resources (Hilman & Dalziel,
2003; Mwenja & Lewis, 2009). Board members also have skills and expertise themselves that are
useful to the organization which is referred to as human capital (Brown, 2005; Mwenja & Lewis,
2009). In the area of governance, board members use their experience, reputation, and knowledge
to guide the organization. Furthermore, larger boards generally have more contact with the public,
which facilitates fundraising and other externally driven activities (Olson, 2000). Board size does
not necessarily increase board performance (Bradshaw, Murray, & Wolpin, 1992), but larger
boards are more adept at monitoring nonprofit function and providing resources (Brown, 2005).
By having a resourceful and experienced board, a nonprofit organization is better able to counter
the impact of external uncertainty.
An internet presence is another valuable resource in the nonprofit sector. There are many
uses for having a web presence for nonprofits including soliciting funds, building a brand,
information disbursement, and networking (Gomes, 2001). Levine and Zahradnik (2012) found
that nonprofits with a greater online presence (measured by number of media, donor, and volunteer
pages coupled with number and variety of communication tools and links) improved their financial
viability. Similarly, Schnieder (2003) reported that nonprofits that lack these web resources may
fall short in their pursuit to acquire the resources and support that their programs need. Despite the
need for nonprofits to have a web presence, it appears that the current focus in information
technology research and nonprofits is trending toward studying social media (e.g. Facebook,
Twitter) as the nonprofit sector works to build and nurture their relationships (e.g. Kent, Taylor,
& White, 2003; Waters & Fenely, 2013).
Resource-Based View of the Organization
Prior to 1984, researchers focused on an organization’s product-market exchange to
explain why firms exist. For example, Coase’s transaction cost theory centered on minimizing
opportunity costs in market exchanges (1937). Wernerfelt (1984) first proposed a shift in how
organizations were analyzed moving from a product-market focus to a resource position focus. He
defined resource to be “anything which could be thought of as a strength or weakness of a given
firm” (p. 172). These resources which included in-house technology, efficient procedures, or

Academy of Strategic Management Journal Volume 15, Number 1, 2016
53
connections to others could over time are a source of a distinct advantage for the organization.
Over the next decade, the resource-based view theory gained support mainly due to a
Harvard Business Review article published in 1990 by Prahalad and Hamel. In this article, the
authors translated the theory into a meaningful concept for most business leaders – they termed it
the core competence of the corporation. They urged business leaders to identify an organization’s
portfolio of competencies rather than their business units. They explained that “core competencies
are the collective learning in the organization, especially how to coordinate diverse production
skills and integrate multiple streams of technologies” (Prahalad & Hamel, 1990, p. 4). Unlike a
physical resource, a core competence does not lessen when it is used.
The resource-based view of the firm states that organizations have internal strengths and
weaknesses. These strengths are a source of resources including but not limited to tangible,
physical resources. These strengths can be a competitive advantage for the organization over its
competitors. If these strengths are repeated and sustained, they may be a core competence for the
organization. Successful firms have core competencies that are rare, hard to imitate, and valuable
to others (Wernerfelt, 1984; Prahalad & Hamel, 1990).
An example of an internal resource of a nonprofit organization that could over time serve
as its core competence would be in the area of strategic human resource management (Akingbola,
2013). A nonprofit organization that does a better job than others to target, recruit, manage, and
promote volunteers to live, breathe, and implement its mission would be an example of a nonprofit
organization that has a core competence that will be hard to replicate.
Nonprofits are also unique from for-profit firms because they do not distribute their profits
to owners or stockholders but rather reinvest those revenues back into the nonprofit to further their
mission. Nonprofits that do this extremely well may also have a core competence. Frumkin and
Andre-Clark (2000) suggested that nonprofits have a potential competitive advantage over for-
profits because they could focus on the values-driven strategy over operational efficiency than
their for-profit counterparts.
HYPOTHESES
Any organization, including nonprofits, is concerned with having sufficient resources to
meet the purpose of the organization. For the U.S. nonprofit sector (McKeever & Pettijohn, 2014),
the revenue comes from the following sources:
Fees for services and goods from private sources: 50.0%
Fees for services and goods from government sources: 23.1%
Private contributions: 12.9%
Government grants: 9.2%
Other income: 1.2%
An economic downturn impacts many of these revenue sources for different reasons and
causes great uncertainty for the nonprofit organization. Once the realization of the economic crisis
settles into the population, government, business, and nonprofit leaders are expected to prepare for
and adjust to an anticipated decrease in revenues. The resource dependency theory posits that
organizations will examine their power relationships and make adjustments to have more control
over resources for which they depend and for which are surrounded by more uncertainty. For
example, an organization will take steps to reduce its dependency on a resource that is likely to
decrease. This theory leads us to also posit that an organization will capitalize on the power gained
Academy of Strategic Management Journal Volume 15, Number 1, 2016
54
for a resource it controls that others now need. We expect to organizations take strategic steps to
adjust their power relationships.
H1 Nonprofit organizations strategically respond to reduce the effect of external uncertainties because
of economic crisis.
The resource-based view of the firm suggests that in times of uncertainty, organizations
that have a core competence that benefits them in this new environment will be more successful
than those that do not. During difficult, changing, uncertain times, Hall, Beck, Lengnick-Hall
(2011) theorized that organizations with developed strategic human resource capacity have a
competency that would make the organization resilient during challenging times. They defined
organizational resilience as “a firm’s ability to effectively absorb, develop situation-specific
responses to, and ultimately engage in transformative activities to capitalize on disruptive surprises
that potentially threaten organization survival” (p. 244).
H2 Human resource capacity of the firm is positively related to the level of strategic responses to the
external uncertainties.
Also with the rapidly changing environment, organizations that are able to capture, transfer
and use their experience and knowledge are at an advantage over those organizations that are new
or unable to do so (Weldy, 2009). For some organizations, the ability to manage their knowledge
is a source of competitive advantage.
Some researchers have found that firm age is related to firm survival during challenging
times. They explain that new organizations need time to develop and identify their capabilities.
During stress, these new organizations are more likely to falter (Esteve-Perez & Manez-Castillejo,
2008). More established firms are better able to weather difficult times. Building on the
knowledge-based resource, an older firm would likely have more experience and knowledge to
access to adjust to the changing environment.
H3 The age of the firm is positively related to the financial performance of the firm during a period of
financial external uncertainties.
Ronald Coase (1937) proposed the transaction cost theory in The Nature of the Firm as a
way to explain why firms exist and to predict the size of a firm. He noted previous research had
focused solely on the concept that price determination was the main determinant of firm existence
and size. His theory introduced the idea that it is the coordination function of exchanges that
interact with the price determination that was essential. Coase explained “the main reason why it
is profitable to establish a firm would seem to be that there is a cost of using the price mechanism”
(p. 390).
Ulrich and Barney (1984) explained that the transaction cost theory had evolved into an
efficiency theory. Transactions are any exchange of services or goods that can occur within or
outside the organization between economic actors. A successful firm is able to manage its
transaction costs internally and externally to maximize the price mechanism. Firms have to balance
the internal costs of performing or producing something in-house with the external costs of having
another economic entity perform or provide a product or service.
There are many factors that impact transaction costs which include the level of uncertainty,

Academy of Strategic Management Journal Volume 15, Number 1, 2016
55
governance mechanism, and transaction characteristics. Uncertainty in the market is another
factor that makes entering into a contract to manage the uncertainty important to keeping
the price predictable (Coase, 1937). There has been limited exploration of transaction cost
theory to the nonprofit firm but Valentinov (2008) provided some of that history. He explained
that much of the focus has been centered on explaining how the nonprofit firm is a type of
legal form and is explained by cost theory. Characterizing the research in the nonprofit area
in two strands, he suggested that most have focused on incentive alignment. The nonprofit
arrangement minimizes opportunism and maximizes the establishment of trust.
His article focused on what he refers to as the Coasean approach which would not focus on
the nonprofit firm’s structure as limiting opportunism but would instead focus on the nonprofit’s
ability to limit costs in terms of “reducing the cost of searching for, processing, and communicating
information” (p. 7). Valentinov summarized this approach to the nonprofit sector as follows:
Nonprofit firms arise to economize on this transaction cost by reducing the number of
contracts that needs to be made among the participants of utility-driven production, by
replacing short-term contracts with long-term ones, and by reducing the cost to the participants
of searching for opportunities of involvement in this production (p. 16).
One way that nonprofit organizations reduce the cost of transactions is becoming efficient
in information exchange. Most nonprofit organizations have some sort of website and many are
able to raise funds through the website (Waters, 2007). A website also makes information readily
available to others which prevent a staff person from having to provide that information directly.
Organizations that are able to provide the right information, to the right people, in an effective way
may be able to develop a competitive advantage over other organizations that are unable to do so.
The nonprofit board of directors is also a valuable resource to the nonprofit
organization. As explored earlier in the paper, the members of the board are a source of relational
capital linking the organization to different social networks and additional financial resources
(Hilman & Dalziel, 2003; Mwenja & Lewis, 2009). A nonprofit organization that provides
information about its board of directors on its nonprofit website is allowing additional connection
points for potential donors, volunteers, and other stakeholders to access the organization. By doing
so, the nonprofit is efficiently providing more information about the organization that helps others
judge the quality and stability of the organization (Miller-Millesen, 2003). We posit that these
judgments will impact the support given to the organization by others.
H4 The level of visibility of the firm is positively related to the financial performance of the firm during
a period of financial external uncertainties.
It is common for a nonprofit organization to take part in strategic planning and use a three-
to five-year strategic plan to guide the nonprofit in meeting its mission (Bryson, 2010). Strategic
planning has yielded positive organizational results but for some nonprofits is a cumbersome
undertaking. One of the benefits of strategic planning is to align the organizational resources with
the goals and objectives of the nonprofit to better reach the stated purpose. Bryson urges nonprofits
to view strategic planning beyond the creation of a plan but to rather integrate strategic decision
making as a practice within the organization. By doing so, the nonprofit focuses on the
implementation of the strategy in all aspects of the organization. The plan becomes alive and is
integral to all the activities of the nonprofit.
Academy of Strategic Management Journal Volume 15, Number 1, 2016
56
The recent economic crisis has been characterized as the largest economic crisis since the
Great Depression of the 1930’s. It created great uncertainty for many who rely on nonprofits for
services and for nonprofit organizations in terms of their financial stability. Management experts
advise organizational leaders that their strategy has to be about “constantly adapting to change in
an every changing landscape” (Matai, 2011). Organizations are encouraged to respond quickly as
the environment is rapidly changing and a slow response may cause an organization to fail.
Marrying these two lines of thought suggests that nonprofits faced with the severe
uncertainty presented by the economic crisis must react quickly in a manner consistent with their
strategy. For the past few decades, nonprofit organizations have heeded the call to become more
business-like (Maier, Meyer & Steinbereithner, 2016). Diversification makes longevity and
sustainability more likely by reducing risk and leads to greater stability during economic volatility.
Leaning too heavily on a primary revenue source (grant, earned income, donations) increases risk
and there are limitations with dependence on single funding resources (Besel, Williams & Klak,
2011). When faced with the financial crisis, nonprofits that were not very diversified were
predicted to respond to the financial uncertainty by seeking greater diversity in their sources of
funding theorizing that that diversification of funding would help a nonprofit survive times of
financial uncertainty such as the economic crisis (Froelich, 1999; see also Reed & Bridgeland,
2009; Chikoto & Neely, 2014).
H5: The level of strategic responses to the external uncertainties is positively associated with the
financial performance of the firm during a period of financial external uncertainties.
RESEARCH METHOD
Methods and Sample
The Nashville metropolitan statistical area (MSA) has 2,045 nonprofit organizations with
revenue of $25,000 and over according to database obtained from Urban Institute’s National
Center for Charitable Statistics Core Files (NCCSCF). In 2012, a sample of 1,086 nonprofit
organizations in the Nashville MSA was sent a request to complete a survey to assess their
contribution to the Nashville MSA economy. An e-mail survey was sent to 635 nonprofit
organizations for which an e-mail address was available while an additional 521 were invited to
complete the survey in hard copy format through a mail solicitation. The list of nonprofits was
extracted from both NCCSCF and Nashville Center for Nonprofit Management databases. We
received a total of 306 responses with 280 surveys usable for this analysis. See Table 1 for the
survey response rate data.
The 22-item survey asked for demographical data, information about employees and
volunteers, expenditures and revenues, and perceived economic crisis impact and strategic
management responses. Survey respondents were asked for specific information about the steps
they took during the economic crisis and for financial information for 2008 and the current year
2010. Data was also collected from the Urban Institute’s National Center for Charitable Statistics
Core Files and Individual IRS Form 990 Files for some missing data. The initial 22-item survey
was designed to measure economic impact of nonprofit organizations on the Nashville MSA.

Academy of Strategic Management Journal Volume 15, Number 1, 2016
57
Table 1
SURVEY RESPONSE RATE
Response No
Response
Dropped
(Undeliverable,
misclassification, etc.)
Total in
Sample
Net total in
Sample
Response
Rate
Sample 230 399 10 635 625 36.22%
Sample 76 385 60 521 461 16.49%
Total
Sample 306 784 70 1156 1086 28.18%
Level of Strategic Response Variable
Survey respondents were asked specifically about their strategic response to the economic
crisis. Two questions in particular allowed for additional responses to be provided in open-
ended other category.
Q19. What was your organization’s response to the economic crisis? (Check all that apply)
Q20. In response to the economic crisis, has your organization attempted to use any of the following strategies
(please check all that apply)?
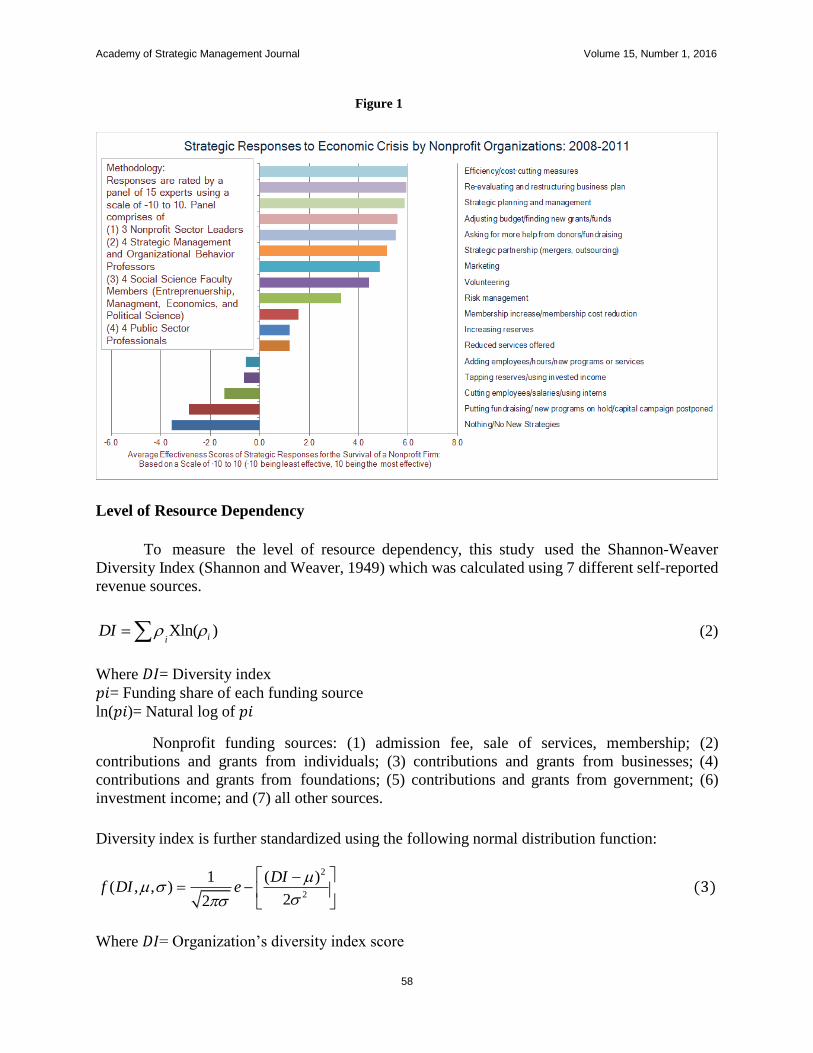
The responses to these two questions created more than 50 separate responses. The
researchers collapsed the responses into 17 overall categories and then had an expert panel review
the overall categories. The 15-member expert panel consisted of nonprofit sector leaders, strategic
management faculty, social science faculty, and public sector professionals. Each expert was sent
an online questionnaire that asked “based on your expert opinion and using a scale of -10 through
10, how would you rate reach of the following survival strategies during an economic crisis
period?” The expert responses were combined and yielded a hierarchy of the effective strategic
responses in an economic crisis. Each nonprofit organization’s strategic response scores were then
aggregated to create a continuous strategic response variable. The strategic response category
scores ranges from -4 to 6 based on expert panel coding (see Figure 1).
Human Resource Capacity
To calculate how strong of a resource a nonprofit has available in terms of its human
capacity, we used three variables: the number of full time employees, the number of part-time
employees, and the total number of weekly volunteer hours the nonprofit receives. Part-time
employment and volunteer hours are converted to the full-time employment equivalency.
Human Resource Capacity Index (HRCI) =3 40
PT WVHFT (1)
Where 𝐹𝑇= Number of full-time employees
𝑃𝑇= Number of part-time employees weighted by 3
𝑊𝑉𝐻= Weekly volunteer hours weighted by 40.
Academy of Strategic Management Journal Volume 15, Number 1, 2016
58
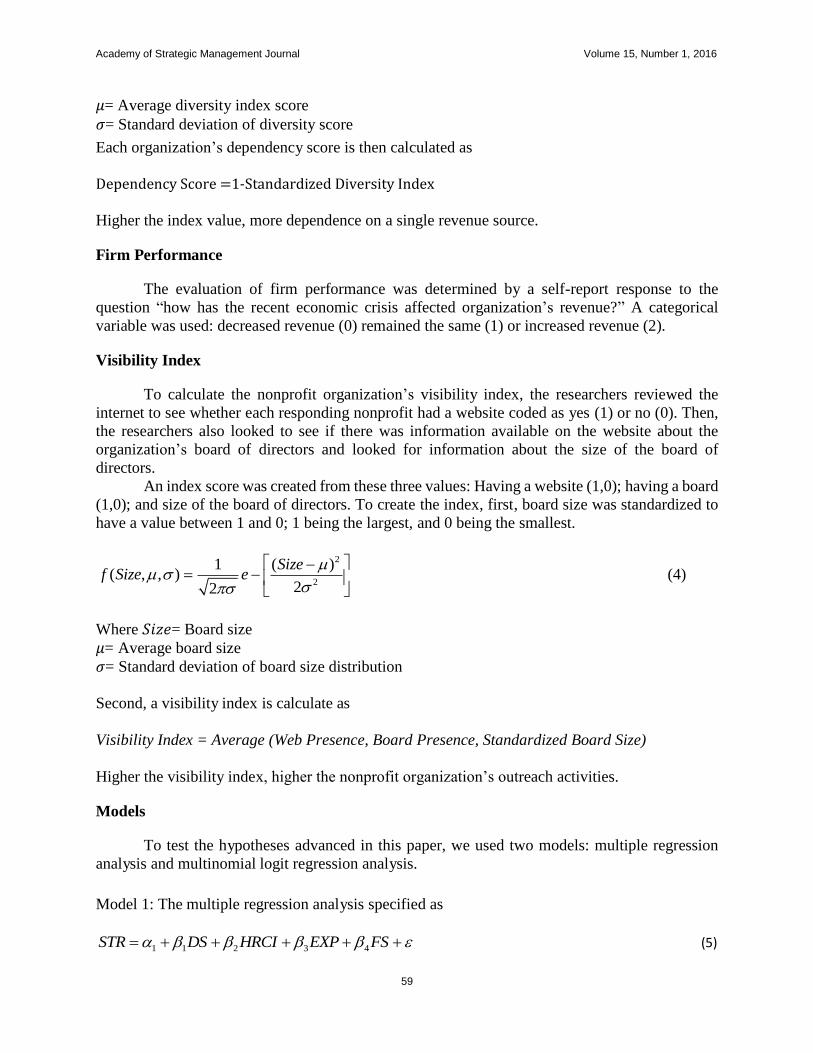
Level of Resource Dependency
Figure 1
To measure the level of resource dependency, this study used the Shannon-Weaver
Diversity Index (Shannon and Weaver, 1949) which was calculated using 7 different self-reported
revenue sources.
Xln( )iiDI (2)
Where 𝐷𝐼= Diversity index
𝑝𝑖= Funding share of each funding source
ln(𝑝𝑖)= Natural log of 𝑝𝑖
Nonprofit funding sources: (1) admission fee, sale of services, membership; (2)
contributions and grants from individuals; (3) contributions and grants from businesses; (4)
contributions and grants from foundations; (5) contributions and grants from government; (6)
investment income; and (7) all other sources.
Diversity index is further standardized using the following normal distribution function:
2
2
1 ( )( , , )
22
DIf DI e
(3)
Where 𝐷𝐼= Organization’s diversity index score
Academy of Strategic Management Journal Volume 15, Number 1, 2016
59
𝜇= Average diversity index score
𝜎= Standard deviation of diversity score
Each organization’s dependency score is then calculated as
Dependency Score =1-Standardized Diversity Index Higher the index value, more dependence on a single revenue source.
Firm Performance
The evaluation of firm performance was determined by a self-report response to the
question “how has the recent economic crisis affected organization’s revenue?” A categorical
variable was used: decreased revenue (0) remained the same (1) or increased revenue (2).
Visibility Index
To calculate the nonprofit organization’s visibility index, the researchers reviewed the
internet to see whether each responding nonprofit had a website coded as yes (1) or no (0). Then,
the researchers also looked to see if there was information available on the website about the
organization’s board of directors and looked for information about the size of the board of
directors.
An index score was created from these three values: Having a website (1,0); having a board
(1,0); and size of the board of directors. To create the index, first, board size was standardized to
have a value between 1 and 0; 1 being the largest, and 0 being the smallest.
2
2
1 ( )( , , )
22
Sizef Size e
(4)
Where 𝑆𝑖𝑧𝑒= Board size
𝜇= Average board size
𝜎= Standard deviation of board size distribution
Second, a visibility index is calculate as
Visibility Index = Average (Web Presence, Board Presence, Standardized Board Size)
Higher the visibility index, higher the nonprofit organization’s outreach activities.
Models
To test the hypotheses advanced in this paper, we used two models: multiple regression
analysis and multinomial logit regression analysis.
Model 1: The multiple regression analysis specified as
1 1 2 3 4STR DS HRCI EXP FS (5)

Academy of Strategic Management Journal Volume 15, Number 1, 2016
60
Where 𝑆𝑇𝑅= Strategic response score
𝐷𝑆= Dependency score
𝐻𝑅𝐶𝐼= Human resource capacity index [in natural log]
𝐸𝑋𝑃= Firm’s experience in market [in natural log]
𝐹𝑆= Firm’s size measured as total revenue [in natural log]
Model 2: The multinomial logistic regression analysis specified as
1 1 2 3 4PI HRCI EXP STR Visibility (6)
Where 𝑃𝐼= Performance indicators that take one of the three values [0=decreased revenue;
1=remained the same; and 2=increased revenue]
𝑆𝑇𝑅= Strategic response score
𝐻𝑅𝐶𝐼= Human resource capacity index [in natural log]
𝐸𝑋𝑃= Firm’s experience in market [in natural log]
𝑉𝑖𝑠𝑖𝑏𝑖𝑙𝑖𝑡𝑦= Visibility index score
This study used the multinomial logistic regression analysis instead of the logistic
regression analysis because the dependent variable (performance indicator) included more than
two discrete values.
RESULTS
What determined the level of strategic response to the economic crisis? To answer this
question, we specified a multiple regression model using the strategic response score (STR-
dependent variable) as a function of human resource capacity index (HRCI), dependency score
(DS), experience (EXP) and firm size (FS). Table 2 presents descriptive statistics used in the
model.
Table 2
MODEL 1: THE MULTIPLE REGRESSION ANALYSIS: DESCRIPTIVE STATISTICS
N
Range
Minimum
Maximum
Mean
Std.
Deviation
Strategic Response Score (STR) 225 42.90 -7.20 35.70 15.18 9.58
Dependency Score (DS) 280 0.93 0.04 0.97 0.49 0.31
Human Resource Capacity Index (HRCI) [in natural log] 280 12.59 -3.69 8.90 2.35 1.70
Firm Size (FS) [in natural log] 280 9.72 10.22 19.94 13.06 1.78
Experience (EXP) [in natural log] 277 4.10 1.10 5.20 3.09 0.84
Valid Number of Observations 224
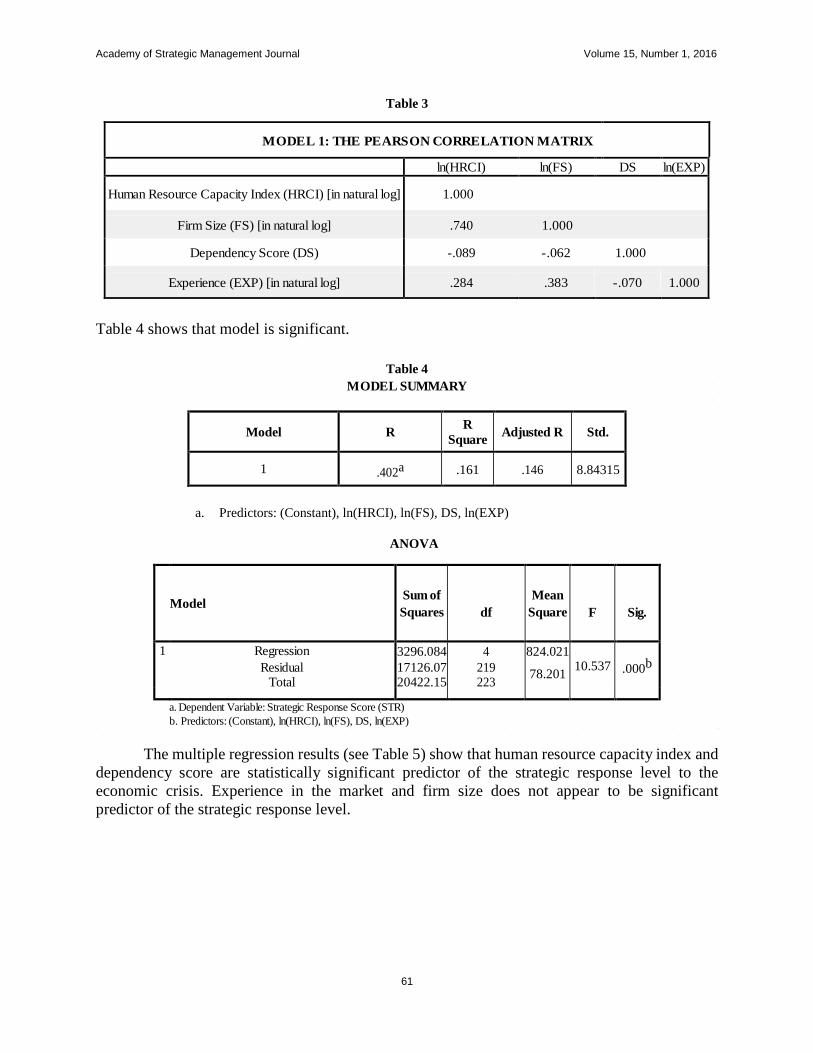
The Pearson correlation matrix is presented in Table 3 suggests a strong correlation
between human resource capacity index and firm size. However, since the absolute value of
correlation is less than 0.85, we included both dependent variables in the model.
Academy of Strategic Management Journal Volume 15, Number 1, 2016
61
Table 3
MODEL 1: THE PEARSON CORRELATION MATRIX
ln(HRCI) ln(FS) DS ln(EXP)
Human Resource Capacity Index (HRCI) [in natural log] 1.000
Firm Size (FS) [in natural log] .740 1.000
Dependency Score (DS) -.089 -.062 1.000
Experience (EXP) [in natural log] .284 .383 -.070 1.000
Table 4 shows that model is significant.
Table 4
MODEL SUMMARY
Model R R
Square Adjusted R Std.
1 .402a .161 .146 8.84315
a. Predictors: (Constant), ln(HRCI), ln(FS), DS, ln(EXP)
ANOVA
Model Sum of
Squares
df
Mean
Square
F
Sig.
1 Regression 3296.084 4 824.021 10.537 .000b Residual 17126.07
1
219 78.201
Total 20422.15
4
223
a. Dependent Variable: Strategic Response Score (STR)
b. Predictors: (Constant), ln(HRCI), ln(FS), DS, ln(EXP)
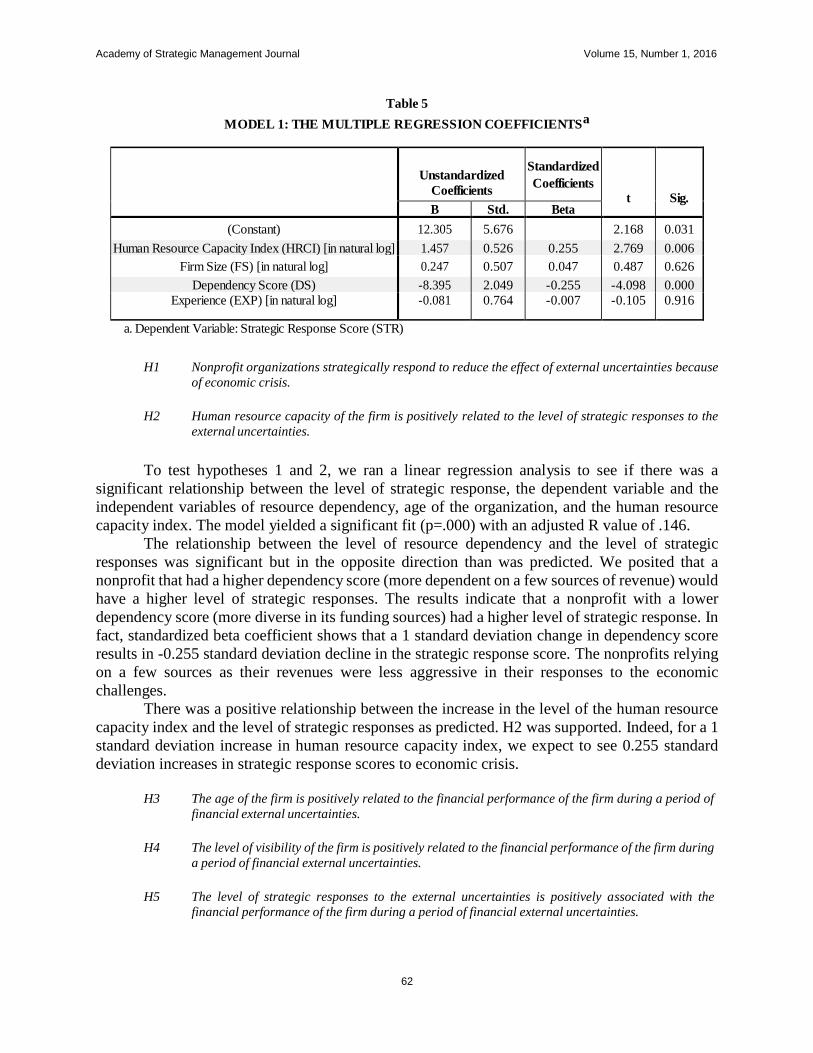
The multiple regression results (see Table 5) show that human resource capacity index and
dependency score are statistically significant predictor of the strategic response level to the
economic crisis. Experience in the market and firm size does not appear to be significant
predictor of the strategic response level.
Academy of Strategic Management Journal Volume 15, Number 1, 2016
62
Table 5
MODEL 1: THE MULTIPLE REGRESSION COEFFICIENTSa
Unstandardized
Coefficients
Standardized
Coefficients
t
Sig. B Std.
Error
Beta
(Constant) 12.305 5.676 2.168 0.031
Human Resource Capacity Index (HRCI) [in natural log] 1.457 0.526 0.255 2.769 0.006
Firm Size (FS) [in natural log] 0.247 0.507 0.047 0.487 0.626
Dependency Score (DS) -8.395 2.049 -0.255 -4.098 0.000
Experience (EXP) [in natural log] -0.081 0.764 -0.007 -0.105 0.916
a. Dependent Variable: Strategic Response Score (STR)
H1 Nonprofit organizations strategically respond to reduce the effect of external uncertainties because
of economic crisis.
H2 Human resource capacity of the firm is positively related to the level of strategic responses to the
external uncertainties.
To test hypotheses 1 and 2, we ran a linear regression analysis to see if there was a
significant relationship between the level of strategic response, the dependent variable and the
independent variables of resource dependency, age of the organization, and the human resource
capacity index. The model yielded a significant fit (p=.000) with an adjusted R value of .146.
The relationship between the level of resource dependency and the level of strategic
responses was significant but in the opposite direction than was predicted. We posited that a
nonprofit that had a higher dependency score (more dependent on a few sources of revenue) would
have a higher level of strategic responses. The results indicate that a nonprofit with a lower
dependency score (more diverse in its funding sources) had a higher level of strategic response. In
fact, standardized beta coefficient shows that a 1 standard deviation change in dependency score
results in -0.255 standard deviation decline in the strategic response score. The nonprofits relying
on a few sources as their revenues were less aggressive in their responses to the economic
challenges.
There was a positive relationship between the increase in the level of the human resource
capacity index and the level of strategic responses as predicted. H2 was supported. Indeed, for a 1
standard deviation increase in human resource capacity index, we expect to see 0.255 standard
deviation increases in strategic response scores to economic crisis.
H3 The age of the firm is positively related to the financial performance of the firm during a period of
financial external uncertainties.
H4 The level of visibility of the firm is positively related to the financial performance of the firm during
a period of financial external uncertainties.
H5 The level of strategic responses to the external uncertainties is positively associated with the
financial performance of the firm during a period of financial external uncertainties.
Academy of Strategic Management Journal Volume 15, Number 1, 2016
63
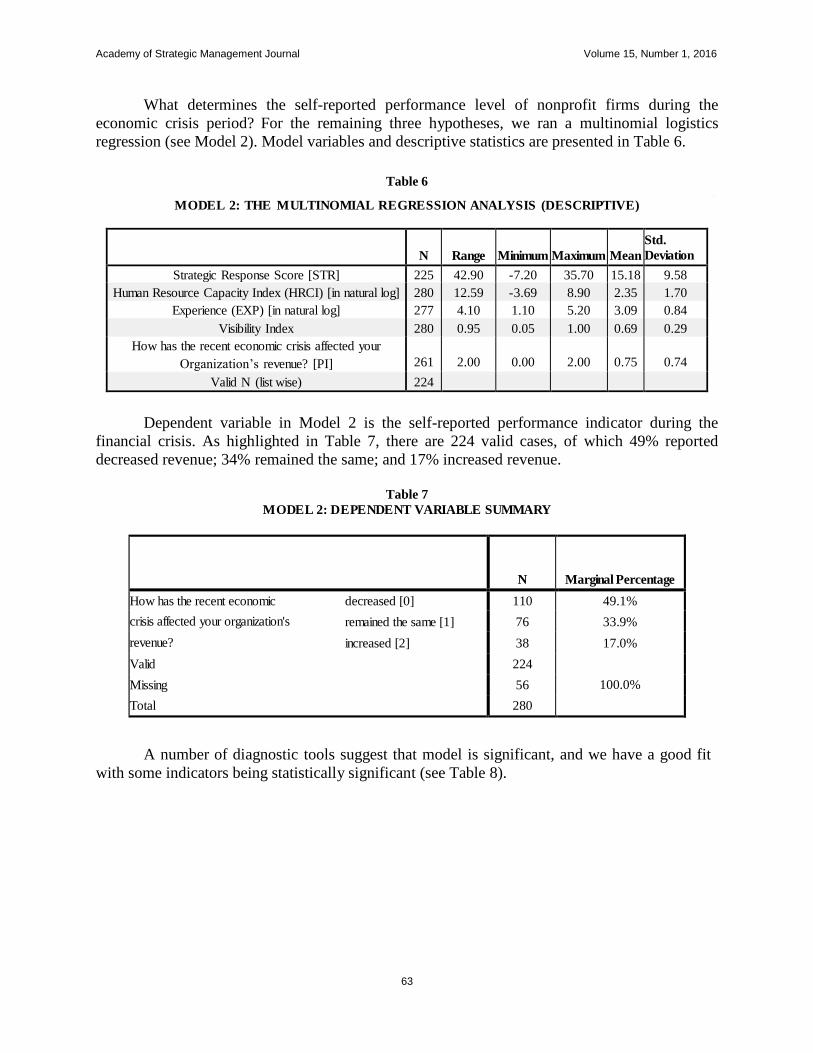
What determines the self-reported performance level of nonprofit firms during the
economic crisis period? For the remaining three hypotheses, we ran a multinomial logistics
regression (see Model 2). Model variables and descriptive statistics are presented in Table 6.
Table 6
MODEL 2: THE MULTINOMIAL REGRESSION ANALYSIS (DESCRIPTIVE)
N
Range
Minimum
Maximum
Mean
Std.
Deviation
Strategic Response Score [STR] 225 42.90 -7.20 35.70 15.18 9.58
Human Resource Capacity Index (HRCI) [in natural log] 280 12.59 -3.69 8.90 2.35 1.70
Experience (EXP) [in natural log] 277 4.10 1.10 5.20 3.09 0.84
Visibility Index 280 0.95 0.05 1.00 0.69 0.29
How has the recent economic crisis affected your
Organization’s revenue? [PI]
261
2.00
0.00
2.00
0.75
0.74
Valid N (list wise) 224
Dependent variable in Model 2 is the self-reported performance indicator during the
financial crisis. As highlighted in Table 7, there are 224 valid cases, of which 49% reported
decreased revenue; 34% remained the same; and 17% increased revenue.
Table 7
MODEL 2: DEPENDENT VARIABLE SUMMARY
N
Marginal Percentage
How has the recent economic decreased [0] 110 49.1%
crisis affected your organization's remained the same [1] 76 33.9%
revenue? increased [2] 38 17.0%
Valid 224
100.0% Missing 56
Total 280
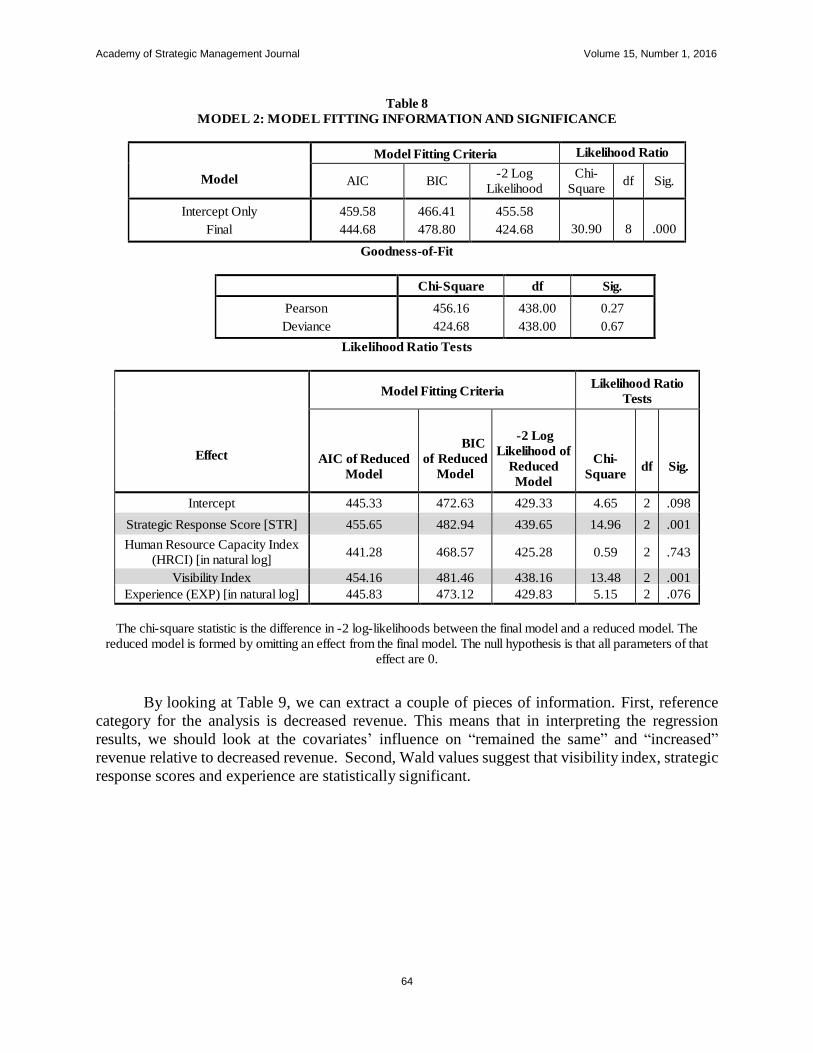
A number of diagnostic tools suggest that model is significant, and we have a good fit
with some indicators being statistically significant (see Table 8).
Academy of Strategic Management Journal Volume 15, Number 1, 2016
64
Table 8
MODEL 2: MODEL FITTING INFORMATION AND SIGNIFICANCE
Model
Model Fitting Criteria Likelihood Ratio
Tests AIC BIC
-2 Log
Likelihood
Chi-
Square df Sig.
Intercept Only
Final
459.58
444.68
466.41
478.80
455.58
424.68
30.90
8
.000
Goodness-of-Fit
Likelihood Ratio Tests
Effect
Model Fitting Criteria Likelihood Ratio
Tests
AIC of Reduced
Model
BIC
of Reduced
Model
-2 Log
Likelihood of
Reduced
Model
Chi-
Square
df
Sig.
Intercept 445.33 472.63 429.33 4.65 2 .098
Strategic Response Score [STR] 455.65 482.94 439.65 14.96 2 .001
Human Resource Capacity Index
(HRCI) [in natural log] 441.28 468.57 425.28 0.59 2 .743
Visibility Index 454.16 481.46 438.16 13.48 2 .001
Experience (EXP) [in natural log] 445.83 473.12 429.83 5.15 2 .076
The chi-square statistic is the difference in -2 log-likelihoods between the final model and a reduced model. The
reduced model is formed by omitting an effect from the final model. The null hypothesis is that all parameters of that
effect are 0.
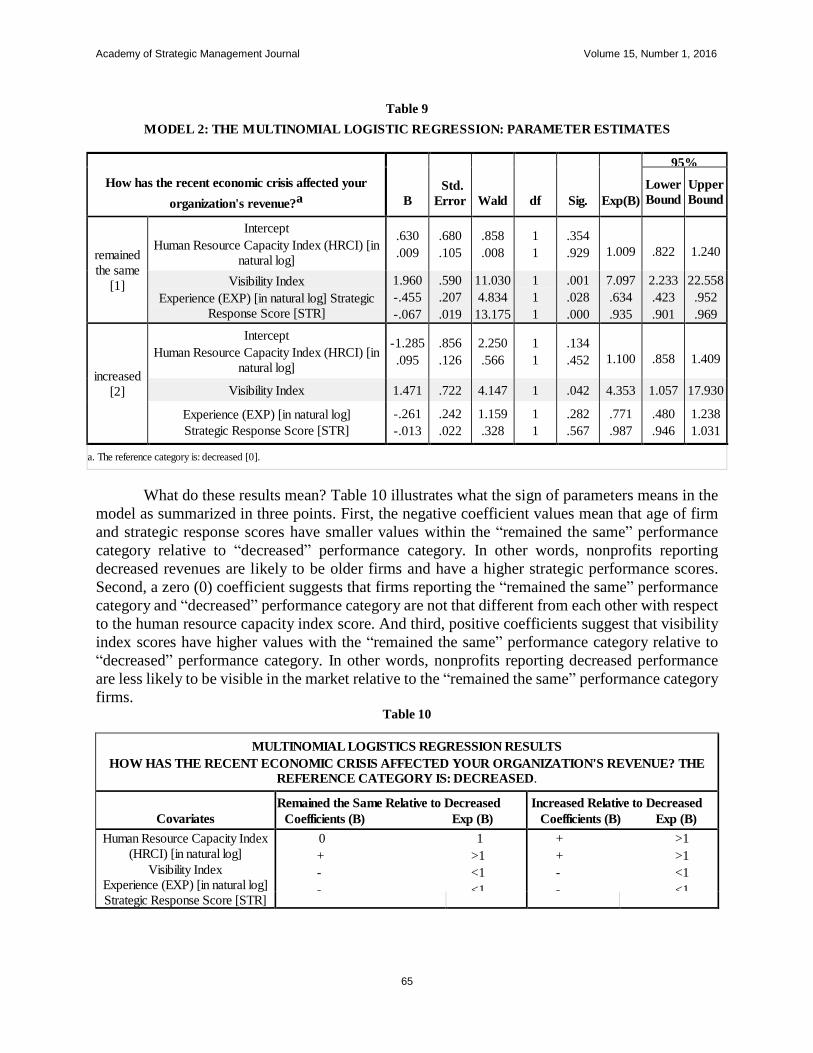
By looking at Table 9, we can extract a couple of pieces of information. First, reference
category for the analysis is decreased revenue. This means that in interpreting the regression
results, we should look at the covariates’ influence on “remained the same” and “increased”
revenue relative to decreased revenue. Second, Wald values suggest that visibility index, strategic
response scores and experience are statistically significant.
Chi-Square df Sig.
Pearson
Deviance
456.16
424.68
438.00
438.00
0.27
0.67
Academy of Strategic Management Journal Volume 15, Number 1, 2016
65
Table 9
MODEL 2: THE MULTINOMIAL LOGISTIC REGRESSION: PARAMETER ESTIMATES
How has the recent economic crisis affected your
organization's revenue?a
B
Std.
Error
Wald
df
Sig.
Exp(B)
95%
Confidence Lower
Bound
Upper
Bound
remained
the same
[1]
Intercept
Human Resource Capacity Index (HRCI) [in
natural log]
.630
.009
.680
.105
.858
.008
1
1
.354
.929
1.009
.822
1.240
Visibility Index
Experience (EXP) [in natural log] Strategic
Response Score [STR]
1.960
-.455
-.067
.590
.207
.019
11.030
4.834
13.175
1
1
1
.001
.028
.000
7.097
.634
.935
2.233
.423
.901
22.558
.952
.969
increased
[2]
Intercept
Human Resource Capacity Index (HRCI) [in
natural log]
-1.285
.095
.856
.126
2.250
.566
1
1
.134
.452
1.100
.858
1.409
Visibility Index 1.471 .722 4.147 1 .042 4.353 1.057 17.930
Experience (EXP) [in natural log]
Strategic Response Score [STR]
-.261
-.013
.242
.022
1.159
.328
1
1
.282
.567
.771
.987
.480
.946
1.238
1.031
a. The reference category is: decreased [0].
What do these results mean? Table 10 illustrates what the sign of parameters means in the
model as summarized in three points. First, the negative coefficient values mean that age of firm
and strategic response scores have smaller values within the “remained the same” performance
category relative to “decreased” performance category. In other words, nonprofits reporting
decreased revenues are likely to be older firms and have a higher strategic performance scores.
Second, a zero (0) coefficient suggests that firms reporting the “remained the same” performance
category and “decreased” performance category are not that different from each other with respect
to the human resource capacity index score. And third, positive coefficients suggest that visibility
index scores have higher values with the “remained the same” performance category relative to
“decreased” performance category. In other words, nonprofits reporting decreased performance
are less likely to be visible in the market relative to the “remained the same” performance category
firms. Table 10
MULTINOMIAL LOGISTICS REGRESSION RESULTS
HOW HAS THE RECENT ECONOMIC CRISIS AFFECTED YOUR ORGANIZATION'S REVENUE? THE
REFERENCE CATEGORY IS: DECREASED.
Covariates
Remained the Same Relative to Decreased
Coefficients (B) Exp (B)
Increased Relative to Decreased
Coefficients (B) Exp (B)
Human Resource Capacity Index
(HRCI) [in natural log]
Visibility Index
Experience (EXP) [in natural log]
Strategic Response Score [STR]
0 1
+ >1
- <1
- <1
+ >1
+ >1
- <1
- <1
Academy of Strategic Management Journal Volume 15, Number 1, 2016
66
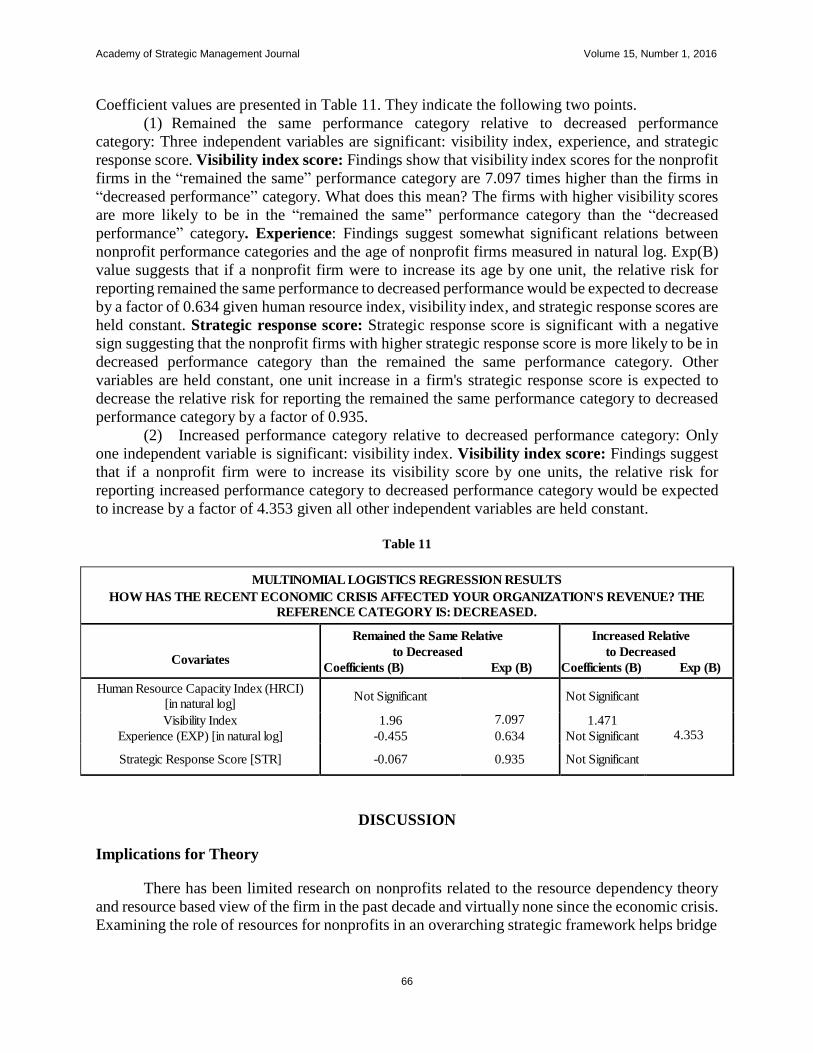
Coefficient values are presented in Table 11. They indicate the following two points.
(1) Remained the same performance category relative to decreased performance
category: Three independent variables are significant: visibility index, experience, and strategic
response score. Visibility index score: Findings show that visibility index scores for the nonprofit
firms in the “remained the same” performance category are 7.097 times higher than the firms in
“decreased performance” category. What does this mean? The firms with higher visibility scores
are more likely to be in the “remained the same” performance category than the “decreased
performance” category. Experience: Findings suggest somewhat significant relations between
nonprofit performance categories and the age of nonprofit firms measured in natural log. Exp(B)
value suggests that if a nonprofit firm were to increase its age by one unit, the relative risk for
reporting remained the same performance to decreased performance would be expected to decrease
by a factor of 0.634 given human resource index, visibility index, and strategic response scores are
held constant. Strategic response score: Strategic response score is significant with a negative
sign suggesting that the nonprofit firms with higher strategic response score is more likely to be in
decreased performance category than the remained the same performance category. Other
variables are held constant, one unit increase in a firm's strategic response score is expected to
decrease the relative risk for reporting the remained the same performance category to decreased
performance category by a factor of 0.935.
(2) Increased performance category relative to decreased performance category: Only
one independent variable is significant: visibility index. Visibility index score: Findings suggest
that if a nonprofit firm were to increase its visibility score by one units, the relative risk for
reporting increased performance category to decreased performance category would be expected
to increase by a factor of 4.353 given all other independent variables are held constant.
Table 11
MULTINOMIAL LOGISTICS REGRESSION RESULTS
HOW HAS THE RECENT ECONOMIC CRISIS AFFECTED YOUR ORGANIZATION'S REVENUE? THE
REFERENCE CATEGORY IS: DECREASED.
Covariates
Remained the Same Relative
to Decreased
Coefficients (B) Exp (B)
Increased Relative
to Decreased
Coefficients (B) Exp (B)
Human Resource Capacity Index (HRCI)
[in natural log] Not Significant
7.097
Not Significant
4.353
Visibility Index 1.96 1.471
Experience (EXP) [in natural log] -0.455 0.634 Not Significant
Strategic Response Score [STR] -0.067 0.935 Not Significant
DISCUSSION
Implications for Theory
There has been limited research on nonprofits related to the resource dependency theory
and resource based view of the firm in the past decade and virtually none since the economic crisis.
Examining the role of resources for nonprofits in an overarching strategic framework helps bridge
Academy of Strategic Management Journal Volume 15, Number 1, 2016
67
the gap between for-profit theory and non-profit theory. This study is an attempt to fill the gap in
the literature.
One of the most important findings was that there was an inverse relationship between the
dependency score and the level of strategic response. Nonprofits that had fewer funding sources
were more likely to have a lower level of strategic response which was counterintuitive given the
mantra that nonprofits must diversify funding to survive. But this finding is not totally without
explanation and supports another stream of nonprofit research.
There have been studies that have found focusing on a few revenue sources is better in
terms of overall revenue growth than diversifying as suggested by the diversification voices. Foster
and Fine (2007) shared their findings focused on the largest nonprofits in terms of financial
resources. They reported that those at the top often focused on a limited number of funding sources
rather than on diversification. They did explain that within a type of funding source, for example,
government grants, the very large nonprofits were diversified within that category receiving
government funds from many different sources. Chikoto and Neely (2014) also shared their
support for the revenue concentration theory finding a relationship between greater nonprofit
financial capacity and decreased funding diversification. The data used for their study was prior to
the financial crisis.
It is also possible that the high dependency score being related to a lower level of strategic
response can be explained by need versus action analysis. According to diversification theory, a
high dependency score would suggest that the nonprofit needs to diversify its funding to better
control its environment just as a higher BMI suggests a person needs to exercise and decrease their
calorie intake to better control negative health consequences. Neither one indicates that the
recommended action will be taken.
We also explored what factors predicted better financial performance during the economic
crisis based on a self-report of our finances decreased, remained the same, or increased. The
resources of website presence and a board of directors available to people outside the organization
on the website were significantly related to a nonprofit reporting that its resources stayed the same
or increased. There was a relationship between nonprofits reporting that their finances decreased
and a lower visibility score.
When we compared the data for nonprofits that reported a decrease in financial resources
to the data for nonprofits that stayed the same, we found that there was a significant difference in
the areas of age of the nonprofit, level of strategic response, and visibility index. Firms that stayed
the same, which is a positive outcome in times of an economic crisis of the level they experienced,
had higher values for all three variables. Likewise, when we compared the data for nonprofits that
reported a decrease in financial resources to the data for nonprofits that increased in resources,
only the visibility index level made a significant difference. Those results suggest that there is
something important and powerful about the visibility resource.
Implications for Practice
The results of this study have several implications for nonprofits going forward.
First, nonprofits need to view their website presence as a valuable resource that needs to be
developed, maintained, and used strategically to draw in other resources. For nonprofits that
are able to develop a web or digital presence better than others, the visibility becomes a core
competence and may develop into a competitive advantage. But to get to that level of a
resource, a nonprofit is going to have to stay ahead of the curve and invest in the needed
knowledge and technology to remain a market leader.
Academy of Strategic Management Journal Volume 15, Number 1, 2016
68
The study also suggests to nonprofit organizations that there is value in sharing information
about their board of directors on their websites. Nonprofits should be cautious of hiding board
members away for fear they will be bothered, put rather should put them into the public eye as an
extension of the organization. Of course, nonprofits need to recruit the right board members to
serve in that capacity and willing to have their information shared in that manner.
Another important implication for the nonprofit sector is that diversification of funding
may not always be the right way to go. There is enough evidence to suggest nonprofits pause and
explore whether it is more valuable to focus on a few sources of revenue and diversifying within
the stream of funding.
Limitations and Future Research
Additional research is needed to provide better guidance to nonprofits on whether
diversifying resources is the better advice or is it preferable to centralize resources. It would be
interesting to compare financial data obtained during the recent financial crisis compares to the
data used by Chikoto and Neely (2014) which was gathered prior to the crisis.
Some of the main variables were gathered through the self-report survey which always has
its limitations. The self-report data does not capture information from nonprofits that did not
survive the economic downturn to provide the data. This is an important piece of the full picture.
Future research could compile financial data from organization’s Form 990s and be used as a
separate performance measure to determine whether revenues increased or decreased.
The visibility and human capacity indices proved promising so further research can explore
the use of these variables in predicting financial performance or survival is needed. The visibility
index could be expanded to include an evaluation on the level of website presence and level of
social media and other digital presence to develop a richer visibility index. Further work on
investigating additional ways to calculate human capacity of a nonprofit as a resource may add to
the explanatory value of similar studies.
CONCLUSION
Management experts advise nonprofit organizations that in times of crisis it is usually best
to do something, and nonprofit organizations should diversify their financial resources so not to
have all their eggs in one basket. The recent economic crisis presented unique challenges to
nonprofit organizations as predictable, reliable funding sources were no longer certain and reliable,
and the demand for their services increased as the economic downturn caused more need. Little
research in the past decade has examined the strategic responses to the economic crisis in the
nonprofit sector and this study acts as an attempt to fill this gap. From studying this situation
through the lenses of two resource theories, we can now provide some guidance to nonprofit
organizations of how to respond during similar times. Nonprofits need to ensure they have strong
visibility, strong human resource capacity, and should increase their level of strategic responses.
This study is just the start to understanding which strategic responses are the right ones for a
nonprofit organization to weather a similar financial storm.
Acknowledgements:
Initial research is conducted by Business and Economic Research Center through a contract with
Nashville Center for Nonprofit Management.
Academy of Strategic Management Journal Volume 15, Number 1, 2016
69
REFERENCES
Acharya, V. V., & Richardson, M. (2009). Causes of the financial crisis. Critical Review, 21(2-3), 195-210. doi:
10.1080/08913810902952903.
Bansal, P., Jiang, G. F., & Jung, J. C. (2015). Managing responsibly in tough economic times: strategic and tactical
CSR during the 2008–2009 global recession. Long Range Planning, 48(2), 69-79.
doi:10.1016/j.lrp.2014.07.002.
Besel, K., Williams, C. L., & Klak, J. (2011). Nonprofit sustainability during times of uncertainty. Nonprofit
Management and Leadership, 22(1), 53-65. doi:10.1002/nml.20040.
Bradshaw, P., Murray, V., & Wolpin, J. (1992). Do nonprofit boards make a difference? An exploration of the
relationships among board structure, process, and effectiveness. Nonprofit and Voluntary Sector Quarterly,
21(3), 227-249.
Bryson, J. M. (2010). The future of public and nonprofit strategic planning in the United States. Public
Administration Review, 70 (Supplement to Volume 70: The Future of Public Administration in 2020), S255-
267.
Coase, R.H. (1937). The Nature of the Firm. Economica, 4(16), 386-405.
Chikoto, G.L. & Neely, D. G. (2014). Building nonprofit financial capacity: The impact of revenue
concentration and overhead costs. Nonprofit and Voluntary Sector Quarterly, 43(3), 570-588.
Esteve-Perez, S. & Manez-Castillejo, J. A. (2008). The resource-based theory of the firm and firm survival. Small
Business Economics, 30(3), 231-249.
Foster, W. & Fine, G. (2007). How nonprofits get really big. Stanford Social Innovation Review, 5(2), 46-55.
Froelich, K. A. (1999). Diversification of revenue strategies: Evolving resource dependence in nonprofit
organizations. Nonprofit and Voluntary Sector Quarterly, 28(3), 246-268.
Frumkin, P. & Andre-Clark, A. (2000). When mission, markets, and politics collide: values and strategy in the
nonprofit human services. Nonprofit and Voluntary Sector Quarterly, 29(1), 141-164.
Gomes, R., & Knowles, P. A. (2001). Strategic internet and e-commerce applications for local nonprofit
organizations. Journal of Nonprofit & Public Sector Marketing, 9(1/2), 215.
Gerardi, K., Lehnert, A., Sherlund, S. M., & Willen, P. (2008). Making sense of the subprime crisis.
Brookings Papers on Economic Activity, 2008(2), 69-159. doi:10.1080/08913810902952903
The Center on Philanthropy at Indiana University, Giving USA Foundation. (2010). Giving USA 2010: The Annual
Report on Philanthropy for the year 2009.
Hall, P. D. (2010). Historical perspectives on nonprofit organizations in the United States. The Jossey-Bass
handbook of nonprofit leadership and management, 3rd Ed. 3-38.
Kent, M. L., Taylor, M., & White, W. J. (2003). The relationship between website design and organizational
responsiveness to stakeholders. Public Relations Review, 29(1), 63-77.
Lee, T. E., Chen, J. Q., & Zhang, R. (2001). Utilizing the Internet as a competitive tool for non-profit
organizations. The Journal of Computer Information Systems, 41(3), 26.
Levine, H., & Zahradnik, A. G. (2012). Online media, market orientation, and financial performance in
nonprofits. Journal of Nonprofit & Public Sector Marketing, 24(1), 26-42.
McKeever, B. S. & Pettijohn, S. L. (2014, October). The Nonprofit Sector in Brief 2014: Public Charities, Giving
and Volunteering. The Urban Institute.
Maier, F., Meyer, M. & Steinbereithner, M. (2016). Nonprofit organizations becoming business-like: A
systematic review. Nonprofit and Voluntary Sector Quarterly, 45(1), 64-86.
Matai, D.K. (2011, March 30). What is the key to survival in a constantly changing environment? Business Insider.
Retrieved on Feb. 24, 2016 from http://www.businessinsider.com/what-is-the-key-to-survival-in-a-
constantly-changing-environment-2011-3
Miller-Milesen, J. L. (2003). Understanding the behavior of nonprofit boards of directors: A theory-based
approach. Nonprofit and Voluntary Sector Quarterly, 32(4), 521-547.
Mosley, J. E., Maronick, M. P., & Katz, H. (2012). How organizational characteristics affect the adaptive tactics
used by human service nonprofit managers confronting financial uncertainty. Nonprofit Management
and Leadership, 22(3), 281-303.
Mwengja, D. & Lewis, A. (2009). Exploring the impact of the board of directors on the performance of not- for-
profit organizations, Business Strategy Series, 10(6), 359-365.
National Center for Charitable Statistics (2015). Quick Facts About Nonprofits. Retrieved from
http://nccs.urban.org/statistics/quickfacts.cfm.
Academy of Strategic Management Journal Volume 15, Number 1, 2016
70
Nonprofit Finance Fund. (2011). America’s nonprofits struggle to meet fast-climbing demand for services.
Retrieved from http://www.nonprofitfinancefund.org/announcements/2011/nonprofit-finance-fund-survey-
americas- npos-struggle-to-meet-fast-climbing-demand.
Pettijohn, S. L., Borris, E. T., & Rarrell, M. R. (2014). National Study of Nonprofit-Government Contracts and
Grants 2013: State Profiles.
Pfeffer, J. & Leong, A. (1977). Resource allocations in United Funds: Examination of Power and Dependence.
Social Forces, 55(3), 775-790.
Pfeffer, J. (1978). The micropolitics of organizations. In M.W. Meyer & Associates (Eds.), Environments and
Organizzations. San Francisco: Jossey-Bass, 29-50.
Pfeffer, J. & Salancik, G. R. (1978). The external control of organizations: A resource dependence
perspective. The Stanford University Press.
Provan, K. G., Beyer, J. M., & Kruytbosch, C. (1980). Environmental linkages and power in resource-
dependence relations between organizations. Administrative Science Quarterly, 25(2), 200-225.
Reed, B., Bridgeland, J., McNaught, M., & Dunkelman, M. (2009). The quiet crisis: The impact of the
economic downturn on the nonprofit sector. A Report by Civic Enterprises and Democratic Leadership
Council. Kellogg Foundation.
Salamon, L., Geller, S. L., & Spence, K. L. (2009). Impact of the 2007-2009 economic recession on nonprofit
organizations. The John Hopkins Listening Post Project, 14.
Salamon, L. M. (2010). The changing context of nonprofit leadership and management. The Jossey-Bass
Handbook of Nonprofit Leadership and Management, 3, 77-100.
Shannon, C. E. and Weaver, W. (1949). The Mathematical Theory of Communication. University of Illinois Press,
Urbana, Illinois, 144.
Schneider, J. A. (2003). Small, minority‐based nonprofits in the information age. Nonprofit Management and
Leadership, 13(4), 383-399.
Soto-Acosta, P., Loukis, E., Colomo-Palacios, R., Lytras, & Miltiadis D. (2010). An empirical research of the effect
of internet-based innovation on business value. African Journal of Business Management, 4(18), 4096-4105.
Ulrich, D. & Barney, J. B. (1984). Perspectives in organizations: Resource dependence, efficiency, and
population. The Academy of Management Review, 9(3), 471-81.
Valentinov, V. (2008). The transaction cost theory of the nonprofit firm: Beyond opportunism. Nonprofit and
Voluntary Sector Quarterly 37(1), March 2008, 5-18.
Waters, R. D. (2007). Nonprofit organizations’ use of the internet: A content analysis of communication trends on
the internet sites of the philanthropy 400. Nonprofit Management and Leadership, 18(1), 59-76.
Waters, R. D., & Feneley, K. L. (2013). Virtual stewardship in the age of new media: have nonprofit
organizations' moved beyond Web 1.0 strategies? International Journal of Nonprofit and Voluntary Sector
Marketing, 18(3), 216-230.
Weldy, T.G. (2009). Learning organizations and transfer: Strategies for improving performance. The Learning
Organization, 16(1), 58-68.
Worth, M. J. (2012). Nonprofit Management: Principles and Practice, 2nd edition.
Zietlow, J. (2010). Nonprofit financial objectives and financial responses to a tough economy. Journal of
Corporate Treasury Management, 3(3).

Reproduced with permission of the copyright owner. Further reproduction prohibited withoutpermission.