Embed Size (px)
Citation preview
1 / 73© 2018 SIA Group – www.s-i-a.ch
Strategic Value InvestingOwnership Approach
August 2018

© 2018 SIA Group – www.s-i-a.ch 2 / 73
. Investment Philosophy
. Our Investment Process
. Portfolio construction
. Expected returns
. A managed account: owner’s reporting
. Appendix 1: our funds
. Appendix 2: some words on copper and oil
Key message: if approached as a business owner, equities can be a high return, low risk investment.
Presentation plan

© 2018 SIA Group – www.s-i-a.ch 3 / 73
The essence of investing
. We are investors in business, want to make money by making our capital bear fruit
. Difference between investing and speculating. Investing: Acceptably profitable income streams
. Speculating: Assets that will go up
. Both can be highly profitable
. We only do the first
© 2018 SIA Group – www.s-i-a.ch 4 / 73
We call it Strategic Value Investing
So basically we buy good companies at inexpensive prices or extremely cheap companies. Bad businesses are usually toxic at almost any price.
• We don’t look for “shares that will go up”
• We neither “play the markets” nor look for “catalysts” or in any way put our investors’ money in the hands of future price movements
• We never “chase” the markets. We use markets’ prices as opportunities to buy or sell. We never act on a view on what the markets will do, because we don’t know
WE BUY BUSINESSES, NOT SHARES

© 2018 SIA Group – www.s-i-a.ch 5 / 73
…converged to Strategic Value Investing
We never “chase” the markets. We use markets’ prices as opportunities to buy or sell
Strategic InvestingFind Good Companies at Reasonable/Inexpensive Prices
Good Companies
• ROE well above COE, adjusted by risk, over the cycle…
• … thanks to Barriers to entry• Need to understand competitive
dynamics to avoid value traps
Inexpensive Prices
• Annual double digit net return to investors and 10-15% intrinsic return
• Key analytical variables are ROCE, dividend yield, leverage and the notion of convergence
• Thorough strategic and financial analysis
Mitigate fundamental risk and use volatility as a source of opportunity

© 2018 SIA Group – www.s-i-a.ch 6 / 73
Good companies enjoy “moats”
We look for “MOATS”
• High entry barriers & low exit barriers
• Economies of scale
• Sustainable cost advantages
• Intellectual Property
• Network effects
• High switching costs
• Reputation
The risk of investing in good businesses is overpaying

© 2018 SIA Group – www.s-i-a.ch 7 / 73
And a Business Owner Approach
We force ourselves to think as owners
"It happens, however, that the energies and skill of the professional investor and speculator are mainly occupied otherwise. For most of these persons are, in fact, largely concerned, not with making superior long-term forecasts of the probable yield of an investment over its whole life, but with foreseeing changes in the conventional basis of valuation a short time ahead of the general public.
They are concerned, not with what an investment is really worth to a man who buys it for "keeps", but with what the market will value it at, under the influence of mass psychology, three months or a year hence."
JM Keynes, The general theory of employment, interest, and money, 1936

© 2018 SIA Group – www.s-i-a.ch 8 / 73
Quoted Equity affords many more opportunities than Private Equity
. Quoted Equity facilitates enormously diversification across sectors, sizes, and geographies. By definition all quoted stocks are available for investment, only limited in practice by investor’s size. Transactions costs (for a long-term investor) are negligible.
. On the other hand, Private Equity is very limited in its targets by geography, size, and availability. Transactions costs are extremely high.
. In addition, Public Equity offers excellent liquidity, which is very important when planning long-term.

© 2018 SIA Group – www.s-i-a.ch 9 / 73
But liquidity implies short-term volatility
. Private Equity is sometimes seen as “less volatile” than Quoted Equity, and therefore as having a better risk/reward profile
. But volatility is not the same as risk, and Quoted Equity is actually less risky than Private Equity, often with better long-term returns when risk adjusted
. It is essential to understand the difference between “profits” and capital appreciation
“Making money while the market drops”
© 2018 SIA Group – www.s-i-a.ch 10 / 73
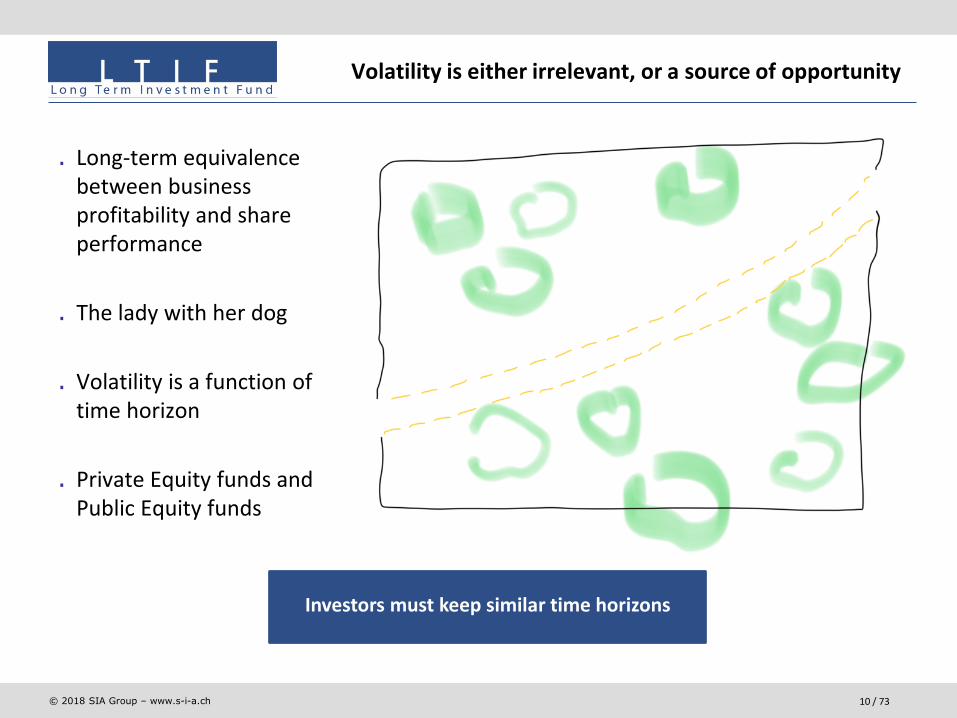
Volatility is either irrelevant, or a source of opportunity
. Long-term equivalence between business profitability and share performance
. The lady with her dog
. Volatility is a function of time horizon
. Private Equity funds and Public Equity funds
Investors must keep similar time horizons

© 2018 SIA Group – www.s-i-a.ch 11 / 73
Volatility actually presents opportunity for Quoted Equity
California Resources Corporation, share price since inception
. Data for LTIF Classic:0
20
40
60
80
100
120
Source: Bloomberg
2015 2016 2017 2018
Initial price: 81.00Current price: 34.57 (As of May 16th, 2018)Share performance: -57.08% (annualized -21.45%)Investment performance: 120% (annualized +25.04%)
Initial investment
Average cost: 15.7
Large purchases
© 2018 SIA Group – www.s-i-a.ch 12 / 73
0 5 10 15 20 25 30 35 40 45 50
2016
2012
2008
2004
2000
1996
1992
1988
1984
1980
1976
1972
1968
1964
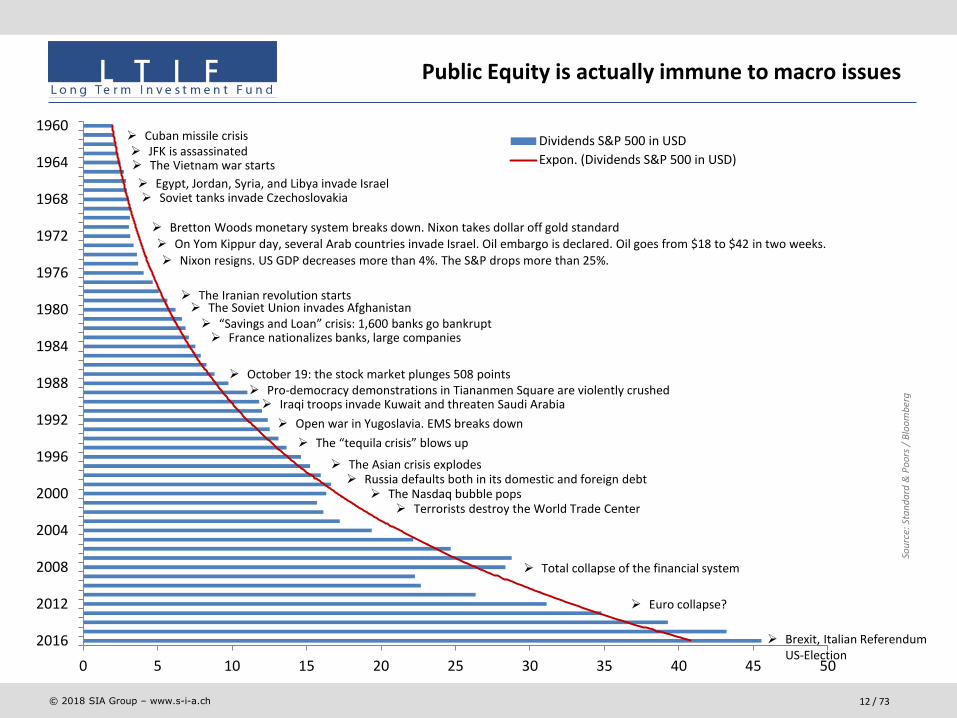
1960Dividends S&P 500 in USD
Expon. (Dividends S&P 500 in USD)➢ The Vietnam war starts
➢ Egypt, Jordan, Syria, and Libya invade Israel➢ Soviet tanks invade Czechoslovakia
➢ On Yom Kippur day, several Arab countries invade Israel. Oil embargo is declared. Oil goes from $18 to $42 in two weeks.
➢ Nixon resigns. US GDP decreases more than 4%. The S&P drops more than 25%.
➢ The Iranian revolution starts
➢ Bretton Woods monetary system breaks down. Nixon takes dollar off gold standard
➢ France nationalizes banks, large companies
➢ JFK is assassinated➢ Cuban missile crisis
➢ The Soviet Union invades Afghanistan➢ “Savings and Loan” crisis: 1,600 banks go bankrupt
➢ Total collapse of the financial system
➢ October 19: the stock market plunges 508 points➢ Pro-democracy demonstrations in Tiananmen Square are violently crushed➢ Iraqi troops invade Kuwait and threaten Saudi Arabia
➢ The “tequila crisis” blows up
➢ The Asian crisis explodes➢ Russia defaults both in its domestic and foreign debt
➢ The Nasdaq bubble pops➢ Terrorists destroy the World Trade Center
➢ Euro collapse?
Sou
rce:
Sta
nd
ard
& P
oo
rs /
Blo
om
ber
g
➢ Brexit, Italian ReferendumUS-Election
➢ Open war in Yugoslavia. EMS breaks down
Public Equity is actually immune to macro issues

© 2018 SIA Group – www.s-i-a.ch 13 / 73
But the volatility can be deadly for the naïve investor
Below all the noise, shares are real assets
-3
23
-12
19 13 9
-13
20 8
-11
0 11 16
-17 -30
32 19
-12
1 12 26
-10
15 17 1
26 15
2 12
27
-7
26
4 7
-2
34 20
31 27
20
-10 -13
-23
26
9
3
14
4
-38
23
13
-0
13
30
11
-1
10
-1'000
-800
-600
-400
-200
0
200
400
600
1960 1964 1968 1972 1976 1980 1984 1988 1992 1996 2000 2004 2008 2012 2016
USD
S&P 500 YoY notional gain/loss in USD(indexed to USD 100 = 1 share as of 31.12.1959)
S&P 500 YoY notional gain/loss in USD
S&P 500 Dividend per share in USD
S&P 500 Index YoY performance in %
© 2018 SIA Group – www.s-i-a.ch 14 / 73
. Investment Philosophy
. Our Investment Process
. Portfolio construction
. Expected returns
. A managed account: owner’s reporting
. Appendix 1: our funds
. Appendix 2: some words on copper and oil
Key message: if approached as a business owner, equities can be a high return, low risk investment.
Presentation plan
© 2018 SIA Group – www.s-i-a.ch 15 / 73
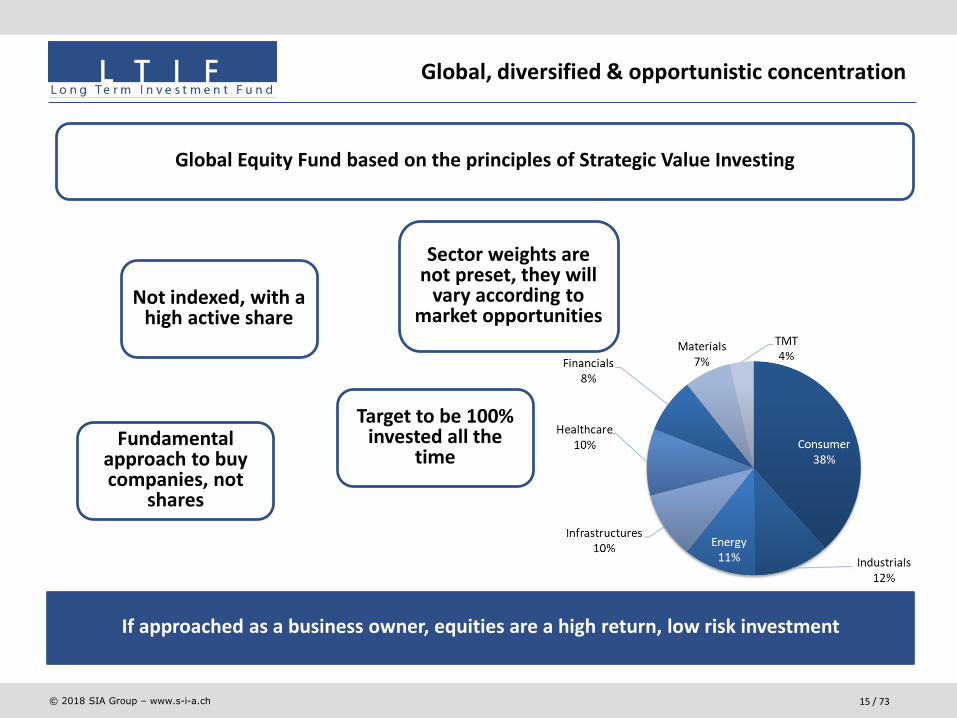
Global, diversified & opportunistic concentration
If approached as a business owner, equities are a high return, low risk investment
Global Equity Fund based on the principles of Strategic Value Investing
Not indexed, with a high active share
Fundamental approach to buy companies, not
shares
Target to be 100% invested all the
time
Sector weights are not preset, they will
vary according to market opportunities
© 2018 SIA Group – www.s-i-a.ch 16 / 73
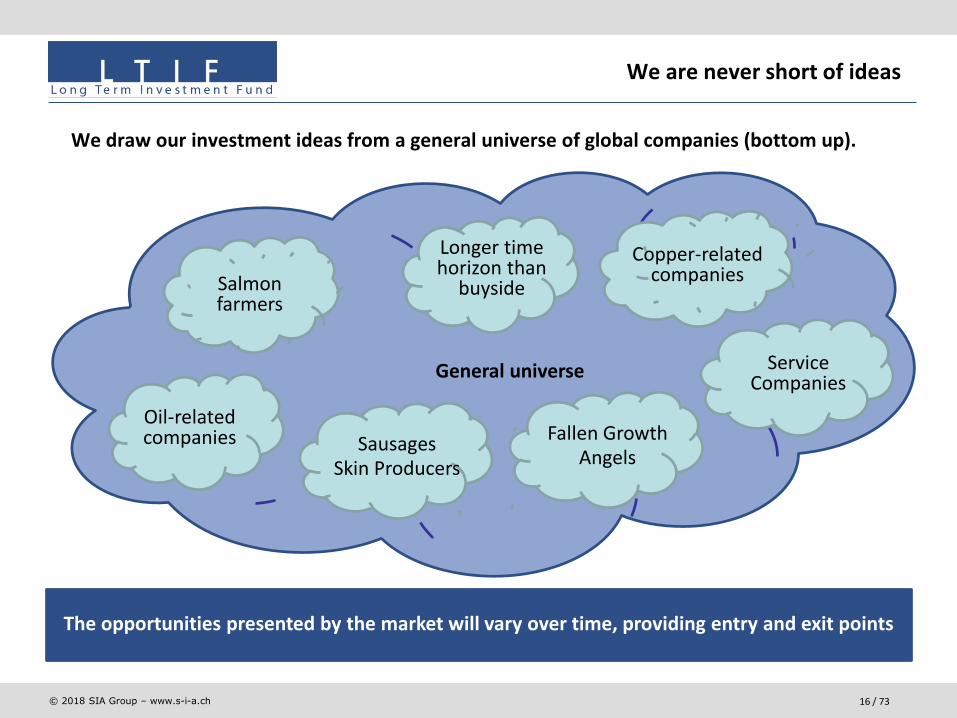
We are never short of ideas
We draw our investment ideas from a general universe of global companies (bottom up).
The opportunities presented by the market will vary over time, providing entry and exit points
General universe
Copper-relatedcompanies
Oil-related companies
Salmon farmers
Longer time horizon than
buyside
Fallen GrowthAngels
Service Companies
SausagesSkin Producers

© 2018 SIA Group – www.s-i-a.ch 17 / 73
Quantitative & Non Structured Screenings
Structured screening…
• Bloomberg screening based on low-average valuations combined with and returns (ROE or ROCE), including filters (debt, size, liquidity, historical growth, valuation extremes, return extremes, increasing marginal returns)
• For valuation PER, EV/EBIT, and P/BV are our preferred metrics and for quality ROCE, ROE and ROCE/WACC, ROE/COE
… combined with non-structured ideas
• Sell-side screenings are useful (Selected lists, Morningstar, Quant screenings, Small Cap. teams etc…)
• Conferences and Company calls
• Expert calls (GLG)
• Unstructured ideas from the day to day business
• We run a watch list with some 100 names trying to keep it updated

© 2018 SIA Group – www.s-i-a.ch 18 / 73
3D Investing… Disciplined Due Diligence
Discipline makes the difference. Strategy vs. execution
It is so easy to buy a stock…. Unless you are required to:
1. Read Annual Accounts (including footnotes!), learn about business, competitors
2. Build a DCF model and cross-check with sell siders
3. Visit/call the company
4. Call several sell-sides
5. Call experts (through GLG or other suppliers)
6. Complete the valuation after all inputs
7. SWOT analysis
8. Investment Committee
9. The whole process takes 1 month, unless the company is already well known. We think we “understand” around 300 global names

© 2018 SIA Group – www.s-i-a.ch 19 / 73
The SIA checklist
• Is it a good business? Competition, moats?
• Good Management, shareholder oriented?
• Margin of Safety?
• Balance sheet?
• Cash flow use?
• Reinvestment returns. Marginal return on investment?
• In 10 years from now?
• Suitable for a large position?
• Do we double if stock price falls?
• Is it better than existing holdings? Marginal contribution to return and risk

© 2018 SIA Group – www.s-i-a.ch 20 / 73
. Investment Philosophy
. Our Investment Process
. Portfolio construction
. Expected returns
. A managed account: owner’s reporting
. Appendix 1: our funds
. Appendix 2: some words on copper and oil
Key message: if approached as a business owner, equities can be a high return, low risk investment.
Presentation plan

© 2018 SIA Group – www.s-i-a.ch 21 / 73
Reckitt Benckiser Group, UK, in GBPLong-term growth of EPS: 7.0%Long-term growth of DPS: 17.4%Total return: 1’324.4%Annualized total return: 12.8%
McDonald‘s Corp, USA, in USDLong-term growth of EPS: 9.9%Long-term growth of DPS: 15.5%Total return: 1’593.0%Annualized total return: 13.7%
0
200
400
600
800
1'000
1'200
1'400
-0.5
0
0.5
1
1.5
2
2.5
3
1990 1992 1994 1996 1998 2000 2002 2004 2006 2008 2010 2012 2014e
(FY 1990 - 2012)
%GB
P
RECKITT BENCKISER GROUP PLC
Earnings per share (GBP) Dividend per share (GBP) Cum.Total return net (r. scale)
0
200
400
600
800
1'000
1'200
1'400
1'600
1'800
2'000
0
1
2
3
4
5
6
7
1990 1992 1994 1996 1998 2000 2002 2004 2006 2008 2010 2012 2014e
(FY 1990 - 2012)
%USD
MCDONALD'S CORP
Earnings per share (USD) Dividend per share (USD) Cum.Total return net (r. scale)Source: Bloomberg
We start with low risk stocks
© 2018 SIA Group – www.s-i-a.ch 22 / 73
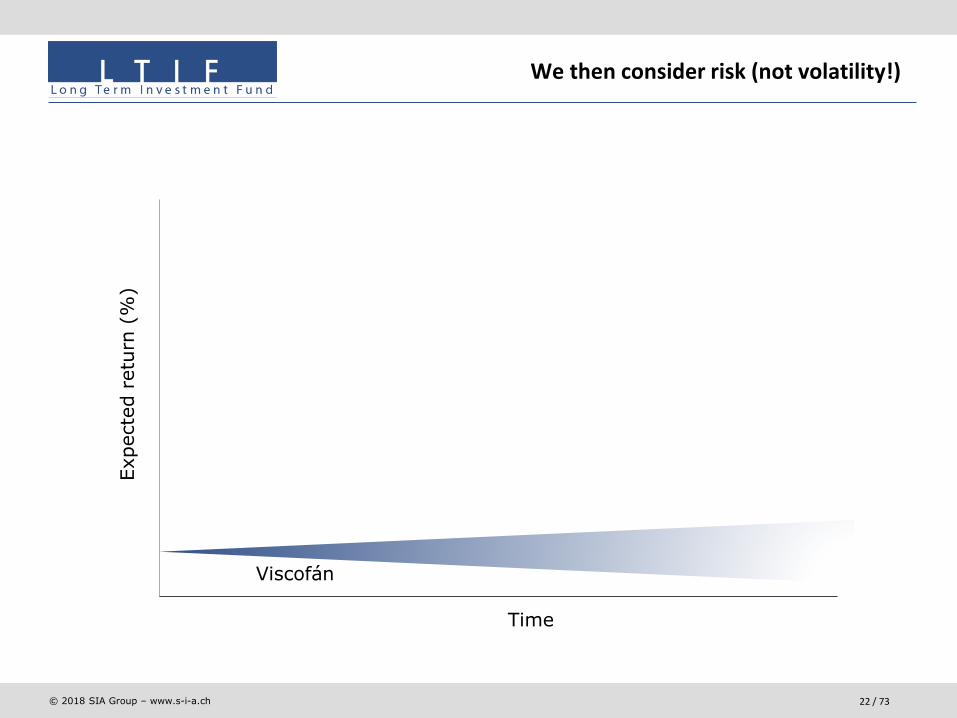
We then consider risk (not volatility!)
Time
Viscofán
Expecte
d r
etu
rn (
%)

© 2018 SIA Group – www.s-i-a.ch 23 / 73
Expecte
d r
etu
rn (
%)
Time
Air Liquide
We then consider risk (not volatility!)
© 2018 SIA Group – www.s-i-a.ch 24 / 73
Time
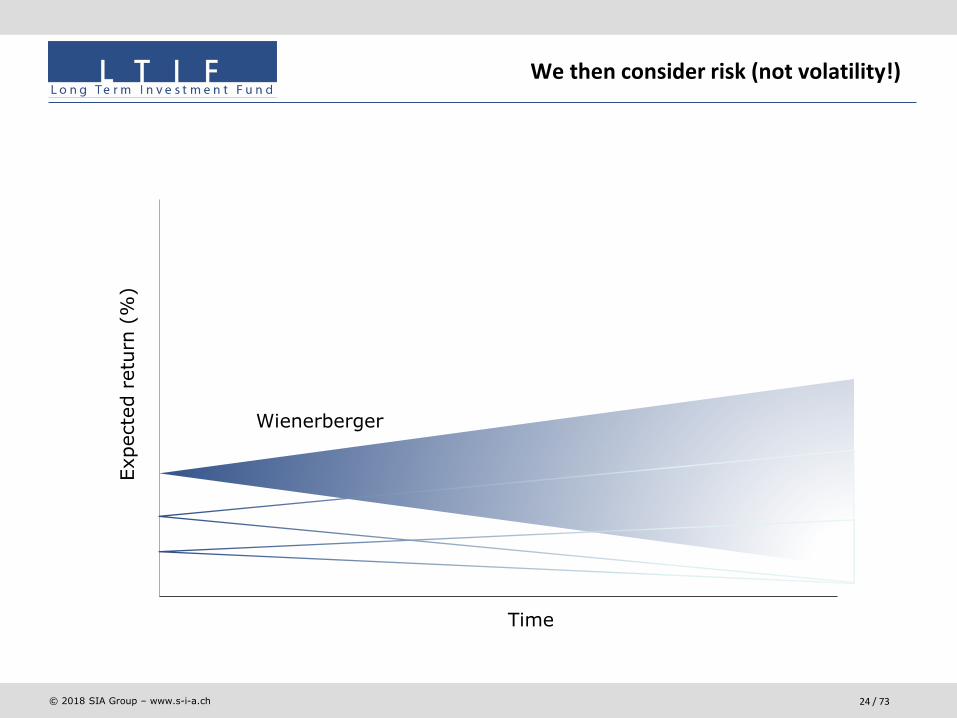
Wienerberger
Expecte
d r
etu
rn (
%)
We then consider risk (not volatility!)
© 2018 SIA Group – www.s-i-a.ch 25 / 73
Time
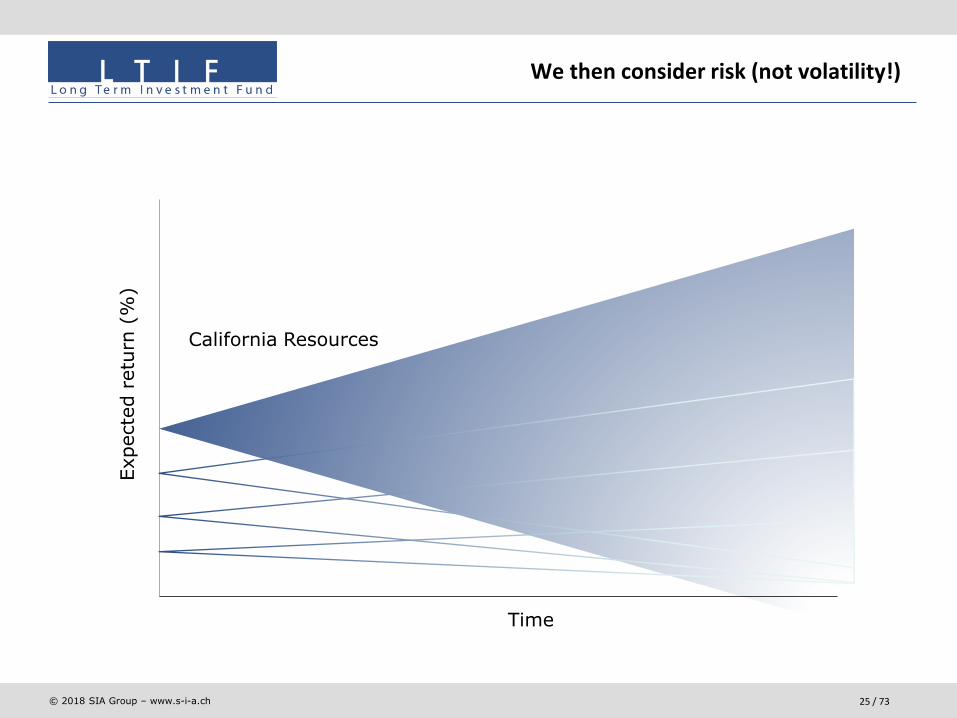
California Resources
Expecte
d r
etu
rn (
%)
We then consider risk (not volatility!)

© 2018 SIA Group – www.s-i-a.ch 26 / 73
Portfolio Construction: Company Categories
An adequate mix of categories helps us keep a balanced portfolio
Category 1“Risk-free stocks”
Category 2Solid, non-cyclical
companies
Category 3Solid, cyclical
companies
Category 4Special situations
Companies with the least fundamental risk, stable growth, stable returns
Ex: Reckitt-Benckiser Group
Viscofán
They present some fundamental risk, but generally unrelated to the business cycle
Ex: ISS DCDeutsche Post AG
Fundamental risks related to the general business cycle, or to the cycle of the specific
industry
Ex: Pandora SAWienerberger
Even though they present a fair amount of fundamental risk, we have a view that is
contrary to the mainstream
Ex: Premier OilCRC

© 2018 SIA Group – www.s-i-a.ch 27 / 73
Portfolio construction: expected returns
• Cat 1 stocks are our benchmark of risk/return. They usually yield a 7-8% return at almost negligible risk (certainly less than most Gov. debts). We also call Cat 1 stocks compounders
• 10% return on investment for Cat 1, 12%+ for Cat 2, 14%+ for Cat 3… these are our margins of safety
• 50% in Cat 1 + 2, 50% in Cat 3 + 4 but Cat 4 are limited (generally less than 10%, on risk considerations) and depending on opportunities
• We also structure the portfolio by Sectors seeking diversification, c 10% per sector in 10 sectors/sub sectors. We also avoid geographic or FX excessive concentration
• There is a 5th Cat… not investable.
• When the price reach our IV we do not automatically sell, we revisit the investment case (salmon)

© 2018 SIA Group – www.s-i-a.ch 28 / 73
After determining the “risk-free rate of return”, we determine the necessary spreads for all other levels of risk
. Category 1: “risk-free stock”: 10%
. Category 2: solid, non-cyclical companies: 12%
. Category 3: solid, cyclical companies: 14%
. Category 4: special situations: 16%
These are entry returns. If the return decreases noticeably, because of share price appreciation or long-term business deterioration, the stock becomes a candidate for a sale.
SIA Risk Category 1 2 3 4
(1 = low Risk; 4 = high Risk)
Portfolio construction: establishing spreads

© 2018 SIA Group – www.s-i-a.ch 29 / 73
Source: Reckitt Benckiser, Bloomberg & SIA
Category 1: Reckitt Benckiser Group
SIA Risk Category 1 2 3 4
Company Description Ticker & ISIN RB/ LN / GB00B24CGK77
Benchmark FTSE 100 INDEX (UKX)
Sector (MSCI GICS) Consumer Staples
Industry (MSCI GICS) Household Products
Currency British Pounds (GBp)
SIA Expected Return
Corporate Information Valuation Ratios
No of Employees 40'100 Fiscal Year 12/14 12/15 12/16 12/17 12/18E 12/19E
Price/Earnings 22.6x 25.7x 28.0x 14.4x 20.3x 18.8x
Current Capitalization in EUR Free Cash Flow Yield 5.2% 3.6% 4.6% 4.5%
53'226 EV/EBITDA 16.8x 19.1x 20.3x 20.1x 16.0x 15.1x
Net Debt (M) 12'077 EV/Sales 4.4x 5.2x 5.2x 5.2x 4.6x 4.5x
13'143 Price/Book 5.5x 6.4x 5.7x 3.6x 3.3x 3.0x
Dividend Yield 2.7% 2.2% 2.2% 2.4% 2.5% 2.7%
Share Price Performance in GBP
67.35 Profitability Ratios %
74.57 Fiscal Year 12/14 12/15 12/16 12/17 12/18E 12/19E
52.55 Gross Margin 57.7 59.1 61.2 59.7 60.0 60.7
0.77 EBITDA Margin 26.3 27.2 25.8 25.7 28.8 29.6
0.0% Operating Margin 24.5 25.3 23.9 23.8 26.2 27.3
-5.8% Profit Margin 36.5 19.6 19.3 53.6 18.5 19.4
73.8% ROIC 19.7 20.3 19.1 12.9
230.8% Return on Equity 49.0 25.4 23.9 56.2 16.4 16.5
10.0%
(1 = low Risk; 4 = high Risk)
YTD Return
5Y Return
52 Wk Return
10Y Return
www.rb.com
Market Cap. (M)
Revenue (M)
52 Wk Beta
Last Price
52 Week Low
52 Week High
Reckitt Benckiser Group PLC manufactures and distributes a wide range of household, toiletry,
health, and food products on a global basis. The Company's products include fabric treatments,
disinfectant spray and cleaners, dishwashing detergent, personal care, food, and over the counter
drugs.
(as of 16.08.2018)
50
55
60
65
70
75
80
Aug-17 Nov-17 Feb-18 May-18 Aug-18
GBp
Reckitt Price vs. FTSE 100 INDEX
RECKITT BENCKISER GROUP PLCFTSE 100 INDEX (rebased)
[16.08.2017 - 16.08.2018]
Daily Frequency
© 2018 SIA Group – www.s-i-a.ch 30 / 73
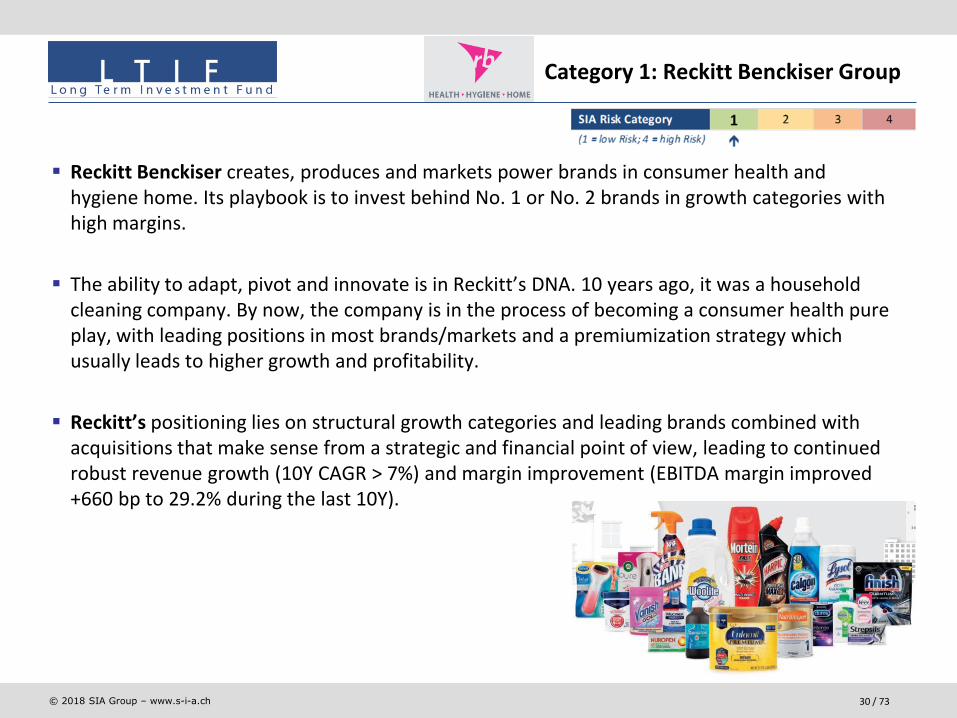
▪ Reckitt Benckiser creates, produces and markets power brands in consumer health and hygiene home. Its playbook is to invest behind No. 1 or No. 2 brands in growth categories with high margins.
▪ The ability to adapt, pivot and innovate is in Reckitt’s DNA. 10 years ago, it was a household cleaning company. By now, the company is in the process of becoming a consumer health pure play, with leading positions in most brands/markets and a premiumization strategy which usually leads to higher growth and profitability.
▪ Reckitt’s positioning lies on structural growth categories and leading brands combined with acquisitions that make sense from a strategic and financial point of view, leading to continued robust revenue growth (10Y CAGR > 7%) and margin improvement (EBITDA margin improved +660 bp to 29.2% during the last 10Y).
Category 1: Reckitt Benckiser Group
© 2018 SIA Group – www.s-i-a.ch 31 / 73
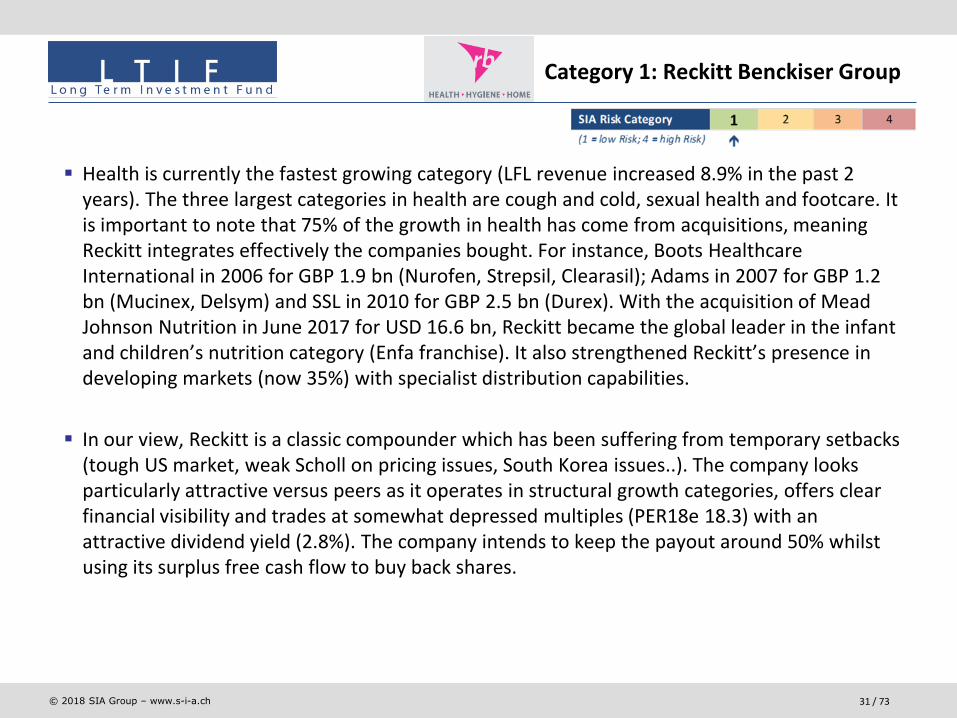
▪ Health is currently the fastest growing category (LFL revenue increased 8.9% in the past 2 years). The three largest categories in health are cough and cold, sexual health and footcare. It is important to note that 75% of the growth in health has come from acquisitions, meaning Reckitt integrates effectively the companies bought. For instance, Boots Healthcare International in 2006 for GBP 1.9 bn (Nurofen, Strepsil, Clearasil); Adams in 2007 for GBP 1.2 bn (Mucinex, Delsym) and SSL in 2010 for GBP 2.5 bn (Durex). With the acquisition of Mead Johnson Nutrition in June 2017 for USD 16.6 bn, Reckitt became the global leader in the infant and children’s nutrition category (Enfa franchise). It also strengthened Reckitt’s presence in developing markets (now 35%) with specialist distribution capabilities.
▪ In our view, Reckitt is a classic compounder which has been suffering from temporary setbacks (tough US market, weak Scholl on pricing issues, South Korea issues..). The company looks particularly attractive versus peers as it operates in structural growth categories, offers clear financial visibility and trades at somewhat depressed multiples (PER18e 18.3) with an attractive dividend yield (2.8%). The company intends to keep the payout around 50% whilst using its surplus free cash flow to buy back shares.
Category 1: Reckitt Benckiser Group
© 2018 SIA Group – www.s-i-a.ch 32 / 73
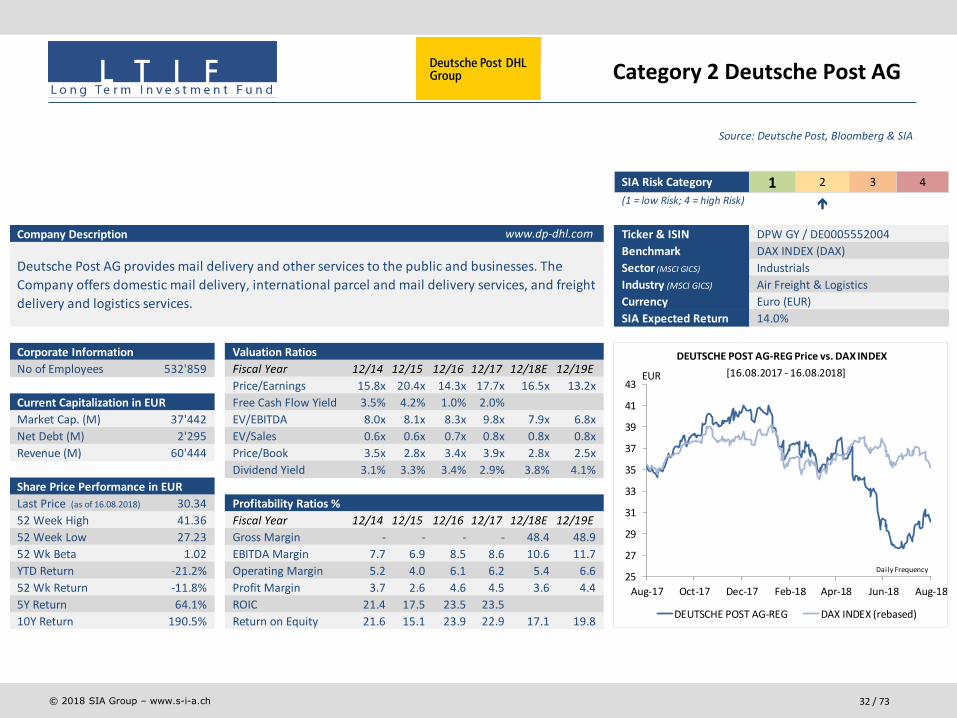
Source: Deutsche Post, Bloomberg & SIA
Category 2 Deutsche Post AG
SIA Risk Category 1 2 3 4
Company Description Ticker & ISIN DPW GY / DE0005552004
Benchmark DAX INDEX (DAX)
Sector (MSCI GICS) Industrials
Industry (MSCI GICS) Air Freight & Logistics
Currency Euro (EUR)
SIA Expected Return
Corporate Information Valuation Ratios
No of Employees 532'859 Fiscal Year 12/14 12/15 12/16 12/17 12/18E 12/19E
Price/Earnings 15.8x 20.4x 14.3x 17.7x 16.5x 13.2x
Current Capitalization in EUR Free Cash Flow Yield 3.5% 4.2% 1.0% 2.0%
37'442 EV/EBITDA 8.0x 8.1x 8.3x 9.8x 7.9x 6.8x
Net Debt (M) 2'295 EV/Sales 0.6x 0.6x 0.7x 0.8x 0.8x 0.8x
60'444 Price/Book 3.5x 2.8x 3.4x 3.9x 2.8x 2.5x
Dividend Yield 3.1% 3.3% 3.4% 2.9% 3.8% 4.1%
Share Price Performance in EUR
30.34 Profitability Ratios %
41.36 Fiscal Year 12/14 12/15 12/16 12/17 12/18E 12/19E
27.23 Gross Margin - - - - 48.4 48.9
1.02 EBITDA Margin 7.7 6.9 8.5 8.6 10.6 11.7
-21.2% Operating Margin 5.2 4.0 6.1 6.2 5.4 6.6
-11.8% Profit Margin 3.7 2.6 4.6 4.5 3.6 4.4
64.1% ROIC 21.4 17.5 23.5 23.5
190.5% Return on Equity 21.6 15.1 23.9 22.9 17.1 19.8
5Y Return
52 Wk Return
52 Week Low
10Y Return
www.dp-dhl.com
Market Cap. (M)
Revenue (M)
52 Wk Beta
Last Price
Deutsche Post AG provides mail delivery and other services to the public and businesses. The
Company offers domestic mail delivery, international parcel and mail delivery services, and freight
delivery and logistics services.
YTD Return
52 Week High
(1 = low Risk; 4 = high Risk)
14.0%
(as of 16.08.2018)
25
27
29
31
33
35
37
39
41
43
Aug-17 Oct-17 Dec-17 Feb-18 Apr-18 Jun-18 Aug-18
EUR
DEUTSCHE POST AG-REG Price vs. DAX INDEX
DEUTSCHE POST AG-REG DAX INDEX (rebased)
[16.08.2017 - 16.08.2018]
Daily Frequency

© 2018 SIA Group – www.s-i-a.ch 33 / 73
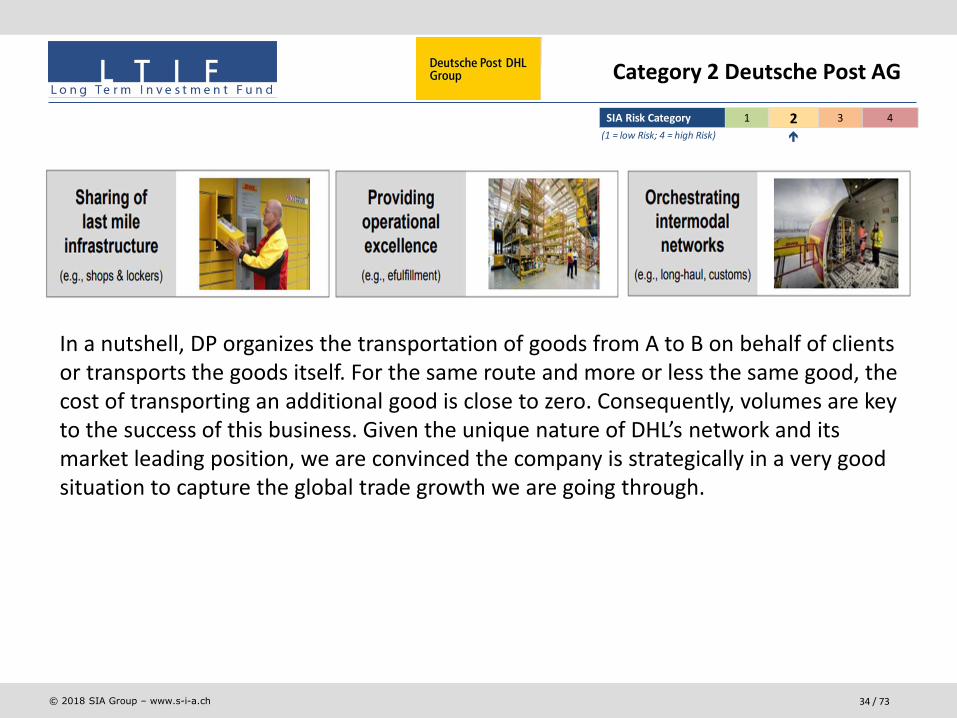
SIA Risk Category 1 2 3 4
(1 = low Risk; 4 = high Risk)
Deutsche Post DHL operates purely within logistics businesses. The company is very different from the pure mail and parcel delivery business within Germany formed in 1995, largely due to the majority takeover of DHL in 2002.
Today, DP is the world’s largest listed postal operator and operates across 4 key segments:
• Post, e-commerce and parcel • Express• Global freight and forwarding• Supply chain
Category 2 Deutsche Post AG
© 2018 SIA Group – www.s-i-a.ch 34 / 73
SIA Risk Category 1 2 3 4
(1 = low Risk; 4 = high Risk)
In a nutshell, DP organizes the transportation of goods from A to B on behalf of clients or transports the goods itself. For the same route and more or less the same good, the cost of transporting an additional good is close to zero. Consequently, volumes are key to the success of this business. Given the unique nature of DHL’s network and its market leading position, we are convinced the company is strategically in a very good situation to capture the global trade growth we are going through.
Category 2 Deutsche Post AG
© 2018 SIA Group – www.s-i-a.ch 35 / 73
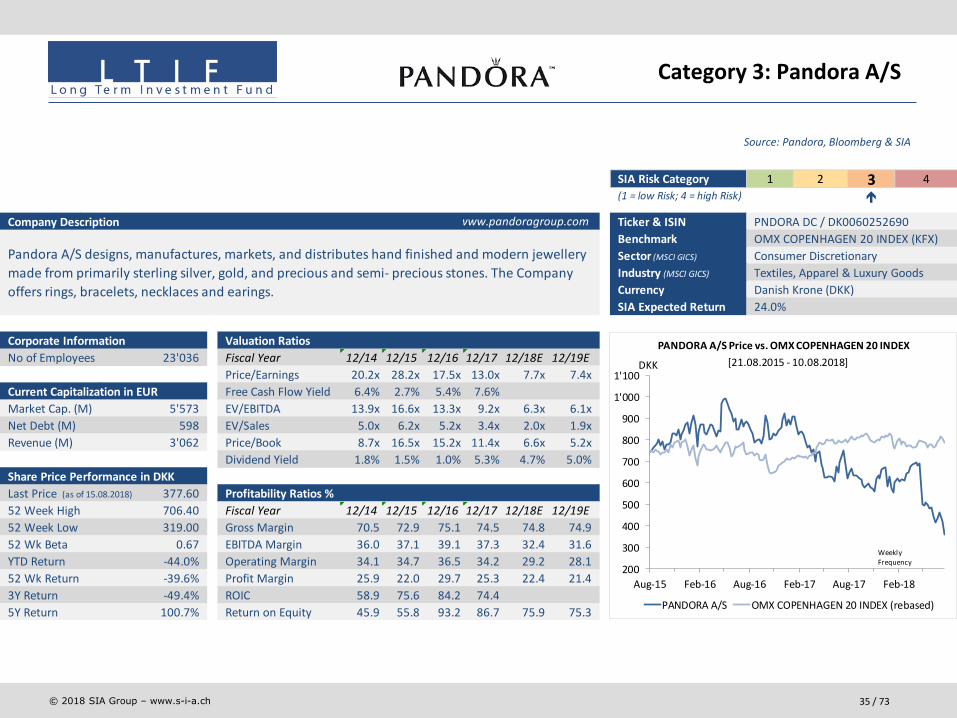
Source: Pandora, Bloomberg & SIA
Category 3: Pandora A/S
SIA Risk Category 1 2 3 4
Company Description Ticker & ISIN PNDORA DC / DK0060252690
Benchmark OMX COPENHAGEN 20 INDEX (KFX)
Sector (MSCI GICS) Consumer Discretionary
Industry (MSCI GICS) Textiles, Apparel & Luxury Goods
Currency Danish Krone (DKK)
SIA Expected Return
Corporate Information Valuation Ratios
No of Employees 23'036 Fiscal Year 12/14 12/15 12/16 12/17 12/18E 12/19E
Price/Earnings 20.2x 28.2x 17.5x 13.0x 7.7x 7.4x
Current Capitalization in EUR Free Cash Flow Yield 6.4% 2.7% 5.4% 7.6%
5'573 EV/EBITDA 13.9x 16.6x 13.3x 9.2x 6.3x 6.1x
Net Debt (M) 598 EV/Sales 5.0x 6.2x 5.2x 3.4x 2.0x 1.9x
3'062 Price/Book 8.7x 16.5x 15.2x 11.4x 6.6x 5.2x
Dividend Yield 1.8% 1.5% 1.0% 5.3% 4.7% 5.0%
Share Price Performance in DKK
377.60 Profitability Ratios %
706.40 Fiscal Year 12/14 12/15 12/16 12/17 12/18E 12/19E
319.00 Gross Margin 70.5 72.9 75.1 74.5 74.8 74.9
0.67 EBITDA Margin 36.0 37.1 39.1 37.3 32.4 31.6
-44.0% Operating Margin 34.1 34.7 36.5 34.2 29.2 28.1
-39.6% Profit Margin 25.9 22.0 29.7 25.3 22.4 21.4
-49.4% ROIC 58.9 75.6 84.2 74.4
100.7% Return on Equity 45.9 55.8 93.2 86.7 75.9 75.3
52 Week Low
52 Wk Beta
YTD Return
52 Wk Return
3Y Return
5Y Return
Pandora A/S designs, manufactures, markets, and distributes hand finished and modern jewellery
made from primarily sterling silver, gold, and precious and semi- precious stones. The Company
offers rings, bracelets, necklaces and earings. 24.0%
Market Cap. (M)
Revenue (M)
Last Price
52 Week High
(1 = low Risk; 4 = high Risk)
www.pandoragroup.com
(as of 15.08.2018)
200
300
400
500
600
700
800
900
1'000
1'100
Aug-15 Feb-16 Aug-16 Feb-17 Aug-17 Feb-18
DKK
PANDORA A/S Price vs. OMX COPENHAGEN 20 INDEX
PANDORA A/S OMX COPENHAGEN 20 INDEX (rebased)
[21.08.2015 - 10.08.2018]
Weekly Frequency

© 2018 SIA Group – www.s-i-a.ch 36 / 73
▪ Pandora is a Danish manufacturer and retailer of affordable jewelry. The company has a strong manufacturing base in Thailand and a network of c.10,000 stores in more than 100 countries.
SIA Risk Category 1 2 3 4
(1 = low Risk; 4 = high Risk)
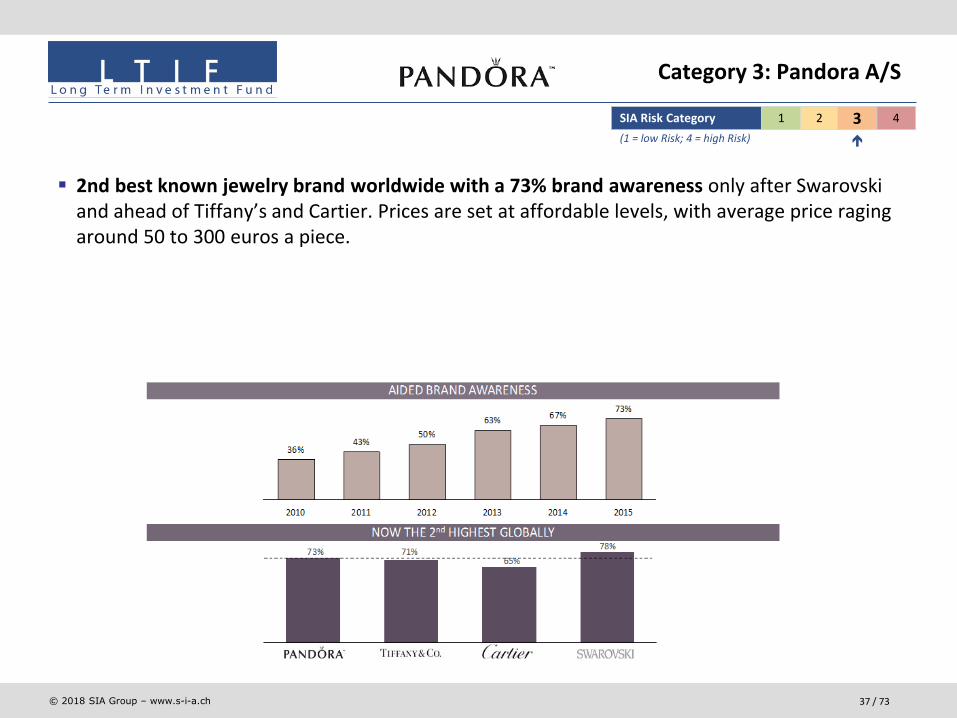
Category 3: Pandora A/S
© 2018 SIA Group – www.s-i-a.ch 37 / 73
▪ 2nd best known jewelry brand worldwide with a 73% brand awareness only after Swarovski and ahead of Tiffany’s and Cartier. Prices are set at affordable levels, with average price raging around 50 to 300 euros a piece.
SIA Risk Category 1 2 3 4
(1 = low Risk; 4 = high Risk)
Category 3: Pandora A/S

© 2018 SIA Group – www.s-i-a.ch 38 / 73
▪ The company specializes in bracelets and charms, its breakthrough product, but it is currently expanding its product portfolio (rings, earrings...) whilst restructuring its retail operations, increasingly turning these into an integrated channel that can feed data back to the production side. The Zara for jewels?
▪ Bracelets can gather several charms, effectively turning customers into repeat buyers. Charms are designed for celebrations, becoming a convenient gift for special occasions. Pandora launches 7 annual collections (Valentine’s day, Christmas…).
SIA Risk Category 1 2 3 4
(1 = low Risk; 4 = high Risk)
Category 3: Pandora A/S
© 2018 SIA Group – www.s-i-a.ch 39 / 73
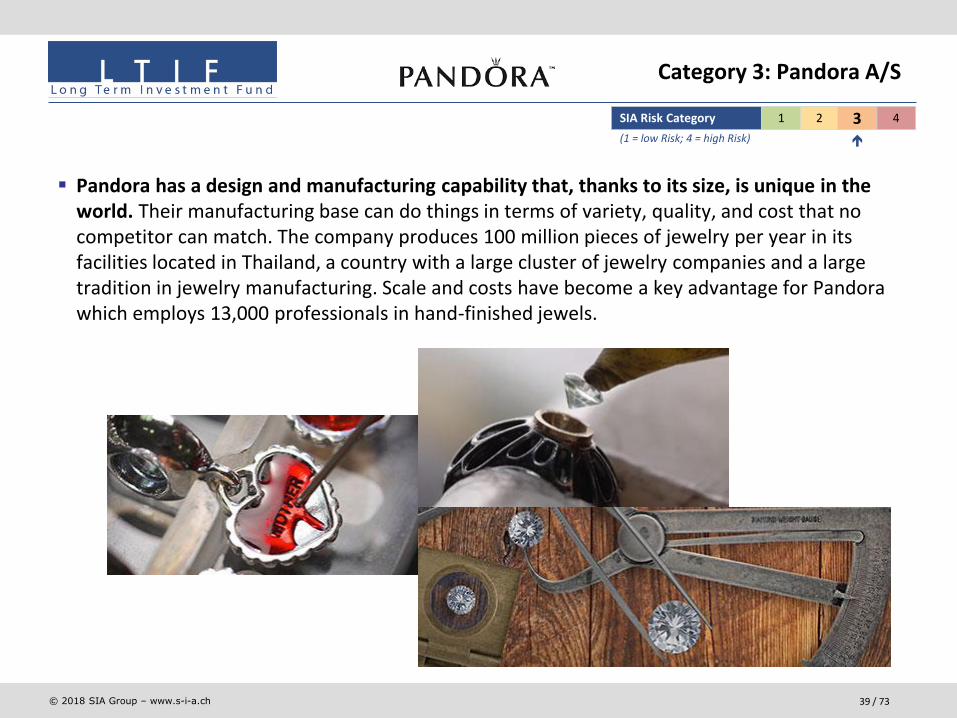
▪ Pandora has a design and manufacturing capability that, thanks to its size, is unique in the world. Their manufacturing base can do things in terms of variety, quality, and cost that no competitor can match. The company produces 100 million pieces of jewelry per year in its facilities located in Thailand, a country with a large cluster of jewelry companies and a large tradition in jewelry manufacturing. Scale and costs have become a key advantage for Pandora which employs 13,000 professionals in hand-finished jewels.
SIA Risk Category 1 2 3 4
(1 = low Risk; 4 = high Risk)
Category 3: Pandora A/S

© 2018 SIA Group – www.s-i-a.ch 40 / 73
▪ Pandora has experienced an outstanding growth in the past decade, with a CAGR of 37% since 2008, multiplying its sales by 12x in 8 years. This level of growth is of course unsustainable but we believe that double digit growth is feasible.
▪ With 35-40% EBITDA margins, low capital employed and capex needs, Pandora is a large free cash flow generator. This cash flow is being distributed via dividends and buy backs.
SIA Risk Category 1 2 3 4
(1 = low Risk; 4 = high Risk)
Category 3: Pandora A/S

© 2018 SIA Group – www.s-i-a.ch 41 / 73
▪ Pandora is cheap to us. The stock trades at a PE of 7.7x 2018E, dividend yield of 4.8% and anda Price to Free Cash Flow of 7%. The stock is cheap because growth rates have been coming down and the market has doubts about future growth.
SIA Risk Category 1 2 3 4
(1 = low Risk; 4 = high Risk)
Category 3: Pandora A/S

© 2018 SIA Group – www.s-i-a.ch 42 / 73
Source: Premier Oil, Bloomberg & SIA
Category 4: Premier Oil plc
SIA Risk Category 1 2 3 4
Company Description Ticker & ISIN PMO LN / GB00B43G0577
Benchmark FTSE 100 INDEX (UKX)
Sector (MSCI GICS) Energy
Industry (MSCI GICS) Oil, Gas & Consumable Fuels
Currency British Pounds (GBP)
SIA Expected Return
Corporate Information Valuation Ratios
No of Employees 871 Fiscal Year 12/14 12/15 12/16 12/17 12/18E 12/19E
Price/Earnings - - 4.3x - 12.8x 4.8x
Current Capitalization in EUR Free Cash Flow Yield -27.2% -75.1% -78.5% -0.6%
976 EV/EBITDA 3.4x 4.0x 4.5x 4.5x 3.7x 3.3x
Net Debt (M) 2'169 EV/Sales 2.1x 2.4x 3.4x 3.0x 2.4x 2.3x
925 Price/Book 0.7x 0.5x 0.6x 0.9x 2.0x 1.5x
Dividend Yield 0.0% 0.0% 0.0% 0.0% 0.0% 0.0%
Share Price Performance in GBP
1.13 Profitability Ratios %
1.35 Fiscal Year 12/14 12/15 12/16 12/17 12/18E 12/19E
0.52 Gross Margin 39.5 38.1 56.0 56.3 - -
2.11 EBITDA Margin 62.3 60.2 76.6 67.3 64.1 68.4
42.4% Operating Margin -13.9 -66.3 -18.2 3.2 31.2 35.0
106.9% Profit Margin -12.9 -103.4 13.1 -24.3 5.8 15.3
-69.4% ROIC -6.4 -22.8 -6.3 1.4
-54.9% Return on Equity -10.5 -84.7 15.9 -35.6 6.5 32.1
www.premier-oil.com
52 Week Low
52 Week High
Last Price
15.0%
Premier Oil plc is an international oil and gas exploration and development company with producing
interests in the United Kingdom, Indonesia, and Pakistan. The Company has continuing exploration
and appraisal efforts in the United Kingdom, South and South East Asia, and Africa.
Market Cap. (M)
Revenue (M)
52 Wk Beta
YTD Return
5Y Return
52 Wk Return
10Y Return
(1 = low Risk; 4 = high Risk)
(as of 15.08.2018)
0
1
1
2
2
3
3
4
4
5
5
Aug-13 Aug-14 Aug-15 Aug-16 Aug-17
GBP
PREMIER OIL PLC Price vs. FTSE 100 INDEX
PREMIER OIL PLC FTSE 100 INDEX (rebased)
[16.08.2013 - 10.08.2018]
Weekly Frequency

© 2018 SIA Group – www.s-i-a.ch 43 / 73
▪ Premier Oil is a medium-sized oil company present in 3 main regions, the North Sea, Vietnam and Indonesia, with current production of 70,000 b/d.
▪ Over time PMO has built long life reserves totaling 750m barrels (reserves & resources > 25 years of production), with an attractive cost level of $15 per bbl.
▪ Management has correctly managed the downturn, lowering its break even cash costs from 35$ per bbl in 2014 to 25$ in 2016; reducing capex from $ 1.2bn in 2014 to $ 400mn in 2017; and acquiring assets from EON at the right time (15,000 b/d in the North Sea) in early 2016.
▪ Taking into account the existing projects and EON assets, PMO could reach 90,000-100,000 b/d production by 2019, effectively adding 10,000 b/d per year for the next 2 years.
SIA Risk Category 1 2 3 4(1 = low Risk; 4 = high Risk)
Category 4: Premier Oil plc

© 2018 SIA Group – www.s-i-a.ch 44 / 73
▪ Two new projects are behind these growth prospects. First, Catcher (50% owned, North Sea) which came on stream in H217 at lower costs than expected (down from an initial 2.25bn $ to 1.7bn).
SIA Risk Category 1 2 3 4(1 = low Risk; 4 = high Risk)
Category 4: Premier Oil plc
© 2018 SIA Group – www.s-i-a.ch 45 / 73
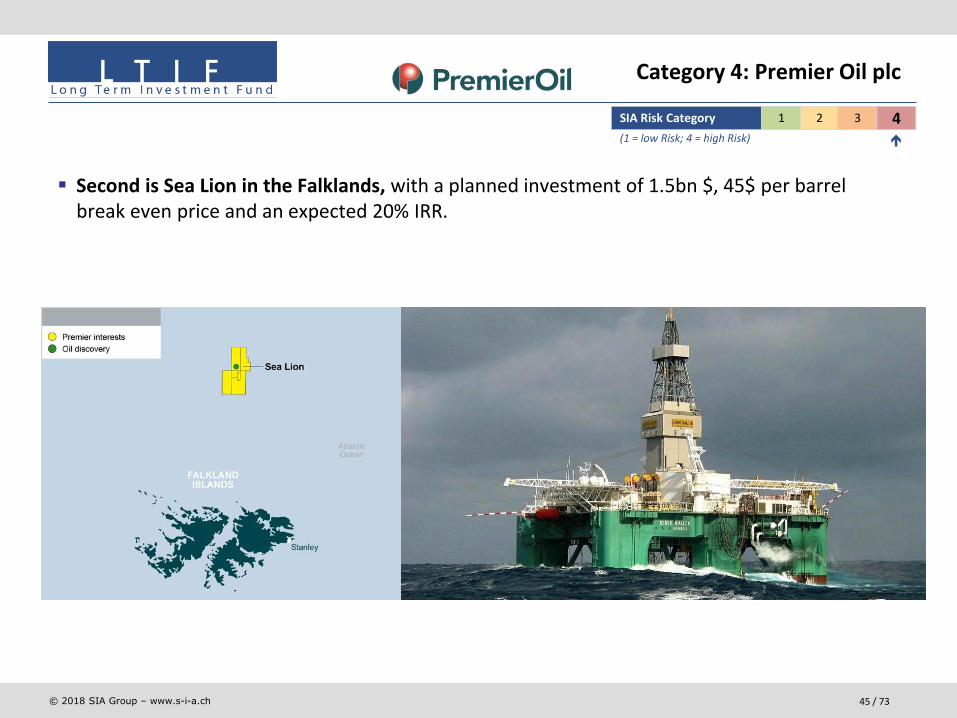
▪ Second is Sea Lion in the Falklands, with a planned investment of 1.5bn $, 45$ per barrel break even price and an expected 20% IRR.
SIA Risk Category 1 2 3 4(1 = low Risk; 4 = high Risk)
Category 4: Premier Oil plc
© 2018 SIA Group – www.s-i-a.ch 46 / 73
▪ PMO was trading at 300-400p p.s. in 2014 (with oil prices at 80$+). After the collapse in oil prices it went as low as 20p in 2016. It is now trading at 110p with a market capitalization of only GBP 850m.
▪ The oil price collapse combined with a large pile of debt almost killed the company. However, management has been able to withstand these conditions 6 years heavily cutting opex & capex, acquiring distressed assets and re-negotiating its debt.
▪ Last year, the company renegotiated the debt with its lender. Net debt is currently 2.6bn $ with cash up to 370mn $.
▪ Oil has started a new up cycle. As we have expected oil price was moving first to the US shale marginal cost (60$+) and is now moving to conventional marginal costs (80$+). We see 60$-70$ in 2018 and 80$+ as from 2019 once the massive capex cuts happened since 2014 will come into effect.
SIA Risk Category 1 2 3 4(1 = low Risk; 4 = high Risk)
Category 4: Premier Oil plc
© 2018 SIA Group – www.s-i-a.ch 47 / 73
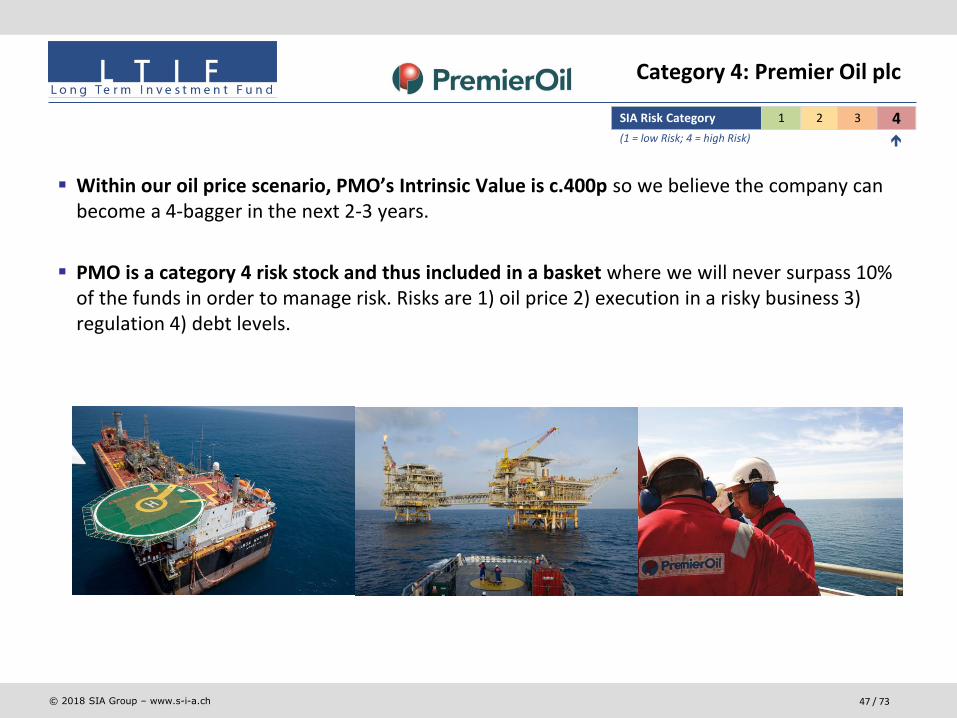
▪ Within our oil price scenario, PMO’s Intrinsic Value is c.400p so we believe the company can become a 4-bagger in the next 2-3 years.
▪ PMO is a category 4 risk stock and thus included in a basket where we will never surpass 10% of the funds in order to manage risk. Risks are 1) oil price 2) execution in a risky business 3) regulation 4) debt levels.
SIA Risk Category 1 2 3 4(1 = low Risk; 4 = high Risk)
Category 4: Premier Oil plc
© 2018 SIA Group – www.s-i-a.ch 48 / 73
. Investment Philosophy
. Our Investment Process
. Portfolio construction
. Expected returns
. A managed account: owner’s reporting
. Appendix 1: our funds
. Appendix 2: some words on copper and oil
Key message: if approached as a business owner, equities can be a high return, low risk investment.
Presentation plan
© 2018 SIA Group – www.s-i-a.ch 49 / 73
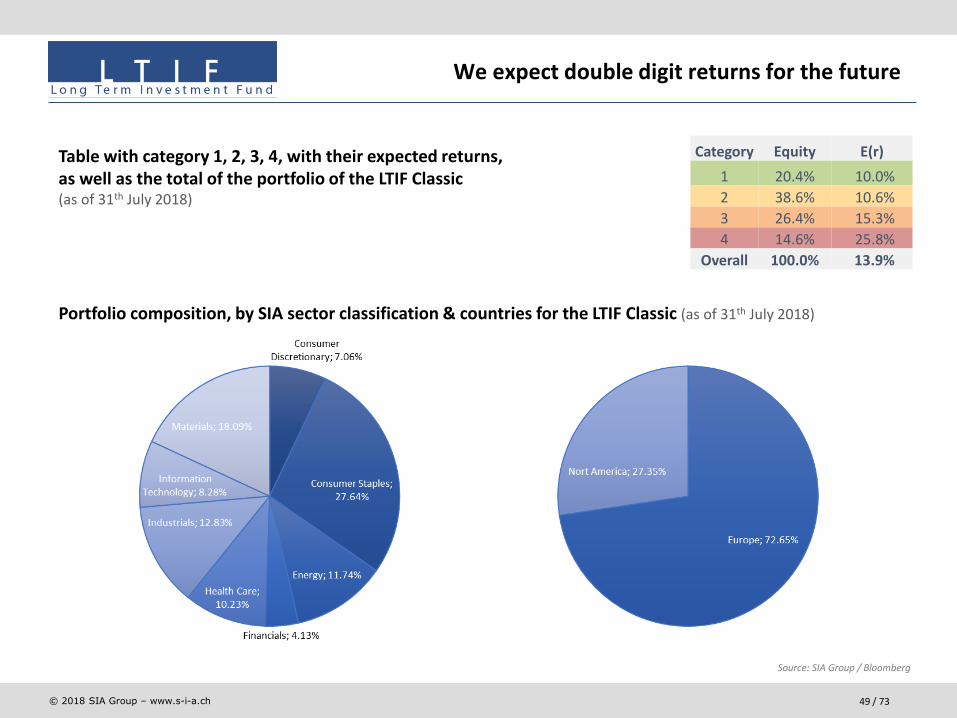
Table with category 1, 2, 3, 4, with their expected returns, as well as the total of the portfolio of the LTIF Classic(as of 31th July 2018)
Portfolio composition, by SIA sector classification & countries for the LTIF Classic (as of 31th July 2018)
Source: SIA Group / Bloomberg
We expect double digit returns for the future
Category Equity E(r)
1 20.4% 10.0%
2 38.6% 10.6%
3 26.4% 15.3%
4 14.6% 25.8%
Overall 100.0% 13.9%

© 2018 SIA Group – www.s-i-a.ch 50 / 73
. These returns are annualized: not every year.
. At a 10% annualized return, assets double in 7 years, almost quadruple in 14 years and multiply by 7 in 20 years.
. The essence of ownership is patience, and letting good companies compound.
. This is one of the best ways to preserve and increase wealth for the next generations:
. Profitability: about the best possible real long-term returns
. Transparency: all audited data
. Very low transaction fees and running costs
. Liquidity: ease of increasing/decreasing positions
. Diversification: enter partnerships with the best companies worldwide, in many different sectors and countries
We expect double digit returns for the future

© 2018 SIA Group – www.s-i-a.ch 51 / 73
. Our investment philosophy has proven itself with many investors over many years
. We possess the requisite analytical skill, both strategic and financial
. We provide a thoroughly transparent, owner-oriented reporting and information
. Our medium size allows us to both have enough resources and total concentration on a number of clients
. We can exploit relatively small opportunities
. We have a track record to back our claims:
Source: SIA Group / Bloomberg
SIA is well placed to obtain these returns
MSCI AC World Net TR Index LTIF Classic
EUR USD EUR USD
Value at 14th January 2002 86.8 77.6 100.0 89.4
Value at 31st July 2018 202.6 237.2 438.6 0.0
Cumulative return (%) 133.5% 205.7% 338.6% -100.0%
Annualized return (%) 5.3% 7.0% 9.3% -100.0%
© 2018 SIA Group – www.s-i-a.ch 52 / 73
. The case for equities
. Our investment approach
. Portfolio construction
. Expected returns
. A managed account: owner’s reporting
. Appendix 1: our funds
. Appendix 2: some words on copper and oil
Key message: if approached as a business owner, equities can be a high return, low risk investment.
Presentation plan

© 2018 SIA Group – www.s-i-a.ch 53 / 73
Quarterly • Earnings for the quarter, year-to-date, year on year• Dividends for the quarter, year-to-date, year on year• Book value
Annually Earnings, dividends and book value, plus:
• Portfolio changes• Brief note on each company• Forward estimates
We’ll report on the whole portfolio on what it is: a diversified, holding company of operating businesses:
Owner’s reporting

© 2018 SIA Group – www.s-i-a.ch 54 / 73
Source: SIA Group / Bloomberg
31.12.2015 331.4 3.2
31.12.2016 397.5 19.9
31.12.2017 408.8 2.9
MSCI World MSCI World MSCI World MSCI World
P/E EPS yield % Div. Yield % P/B
2016 23.8 15.5 6.4 20.6 4.8 2016 8.7 2.2 2.5 2016 189.3 1.8 2.2
2017e 26.3 10.7 15.1 6.6 18.4 5.4 2017e 9.8 12.2 2.4 2.5 2017e 204.4 8.0 1.9 2.4
2018e 30.9 17.3 13.2 7.6 16.8 6.0 2018e 10.6 8.3 2.6 2.3 2018e 215.2 5.3 1.9 2.3
Year BPS % P/BP/EEPS yield
%Year DPS %
Div. Yield
%
Date NAV %
Year EPS %
5
9
13
17
21
25
29
33
2016 2017e 2018e
EUR LTIF ClassicEarnings per share
6
8
10
12
2016 2017e 2018e
EUR
LTIF ClassicDividend per share
100
150
200
250
300
2016 2017e 2018e
EUR
LTIF ClassicBook Value per share
Reporting LTIF Classic as of 29.12.2017 (aggregated data in EUR)
Update typical fundamental reporting sheet

© 2018 SIA Group – www.s-i-a.ch 55 / 73
Long Term Investment Fund (SIA) - Classic
Source: SIA Group / Bloomberg
Market Capitalization of companies in EUR in the LTIF Classic as of 31th July 2018
29.21%28.46%
14.67%
27.66%
0.00%
5.00%
10.00%
15.00%
20.00%
25.00%
30.00%
35.00%
< 5 bn EUR > 5 and below <15 bn EUR > 15 and < 50 bn EUR > 50 bn EUR
© 2018 SIA Group – www.s-i-a.ch 56 / 73
. Target of double digit returns
. Extremely low fundamental risk: “don’t lose money”
. Owner approach to investing: long-term, focus on profit growth and not share price movements
. Balanced portfolio across risk levels
Summary
SIA adds value by taking a long-term approach, applying strategic analysis and discriminating opportunities from value traps

© 2018 SIA Group – www.s-i-a.ch 57 / 73
. Investment Philosophy
. Our Investment Process
. Portfolio construction
. Expected returns
. A managed account: owner’s reporting
. Appendix 1: our funds
. Appendix 2: some words on copper and oil
Key message: if approached as a business owner, equities can be a high return, low risk investment.
Presentation plan

© 2018 SIA Group – www.s-i-a.ch 58 / 73
Source: SIA Group / Bloomberg
Long-term performance of the LTIF Classic fund
LTIF Classic, MSCI AC World Index, S&P 500 Index, incl. annualized returns
25
50
100
200
400
Jan-02 Jan-03 Jan-04 Jan-05 Jan-06 Jan-07 Jan-08 Jan-09 Jan-10 Jan-11 Jan-12 Jan-13 Jan-14 Jan-15 Jan-16 Jan-17 Jan-18
(14-01-2002 - 31-07-2018)
LTIF Classic EUR
MSCI All Country World Net Total Return Index EUR
S&P 500 Net Total Return Index EUR
+338.6% total / +9.4% p.a.
+133.4% total / +5.3% p.a.
+138.4% total / +5.4% p.a.

© 2018 SIA Group – www.s-i-a.ch 59 / 73
. Daily liquidity, cut-off time previous day at 4:00 pm CET
. Performance fees are assessed and paid quarterly, subject to High Water Marks and Hurdle Rates
Long Term Investment Fund (SIA) structure
Compartments LTIF Classic Series LTIF Stability A Cap Series
Investment style Long-only Long - Short
Management fee 1.5% pa 0.9% pa
Performance fee 15% (HWM and Hurdle Rate) 15% (HWM)
Currency EUR CHF USD GBP EUR EUR CHF USD
ISIN number LU0244071956 LU0301246772 LU0301247077 LU0750886714 LU1449969846 LU1128810261 LU1589813515 LU1132799310
Telekurs valor 2'432'569 3'101'817 3'101'820 18'032'305 33'180'015 25'840'496 36'183'892 25'906'913
Bloomberg ticker LTIFCLA LX LTIFCLC LX LTIFCLU LX LTIFCLS LX LTIFCLD LX LTISTAE LX LTISTAC LX LTISTAU LX
Distribution reinvested reinvested reinvested reinvested distributed reinvested reinvested reinvested
Compartments LTIF Natural Resources LTIF Socially Responsible Investing
Investment style Long-only, with a SRI filter
Management fee 0.9% pa
Performance fee 15% (HWM and Hurdle Rate)
Currency EUR CHF USD GBP EUR USD EUR
ISIN number LU0244072335 LU0301246939 LU0301247234 LU0457696077 LU1790109257 LU1790109331 LU1790109414
Telekurs valor 2'432'575 3'101'836 3'101'839 10'638'983 40'678'982 40'678'984 40'678'985
Bloomberg ticker LTIFGEV LX LTIFGEC LX LTIFGEU LX LTIFGEG LX LTIFSRI LX LTIFSRU LX LTIFSRD LX
Distribution reinvested reinvested reinvested reinvested reinvested reinvested distributed
1.5% pa
15% (HWM)
© 2018 SIA Group – www.s-i-a.ch 60 / 73
. The case for equities
. Our investment approach
. Portfolio construction
. Expected returns
. A managed account: owner’s reporting
. Appendix 1: our funds
. Appendix 2: some words on copper and oil
Key message: if approached as a business owner, equities can be a high return, low risk investment.
Presentation plan

© 2018 SIA Group – www.s-i-a.ch 61 / 73
10000000
12000000
14000000
16000000
18000000
20000000
22000000
24000000
26000000
28000000
19
95
19
96
19
97
19
98
19
99
20
00
20
01
20
02
20
03
20
04
20
05
20
06
20
07
20
08
20
09
20
10
20
11
20
12
20
13
20
14
20
15
20
16
20
17
20
18
20
19
20
20
Global Refined Copper Demand
3.2% growth line
Source: World Bureau of Metal Statistics, Bloomberg
Copper apparent demand over the past 20 years shows a trend growth of just
above 3%, in line with the growth of the global economy.
Copper apparent demand

© 2018 SIA Group – www.s-i-a.ch 62 / 73
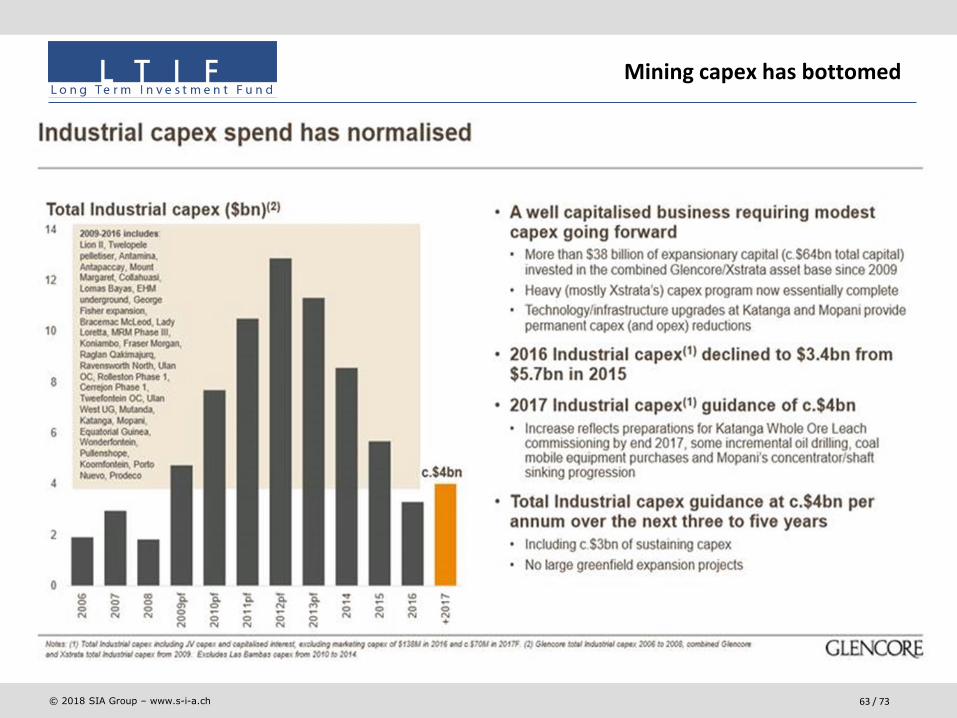
. To incentivize new capacity prices have to go at least 50% higher
. Even after getting into an incentive pricing regime, projects take years to build
Eventually new capacity will be needed
© 2018 SIA Group – www.s-i-a.ch 63 / 73
Mining capex has bottomed
© 2018 SIA Group – www.s-i-a.ch 64 / 73
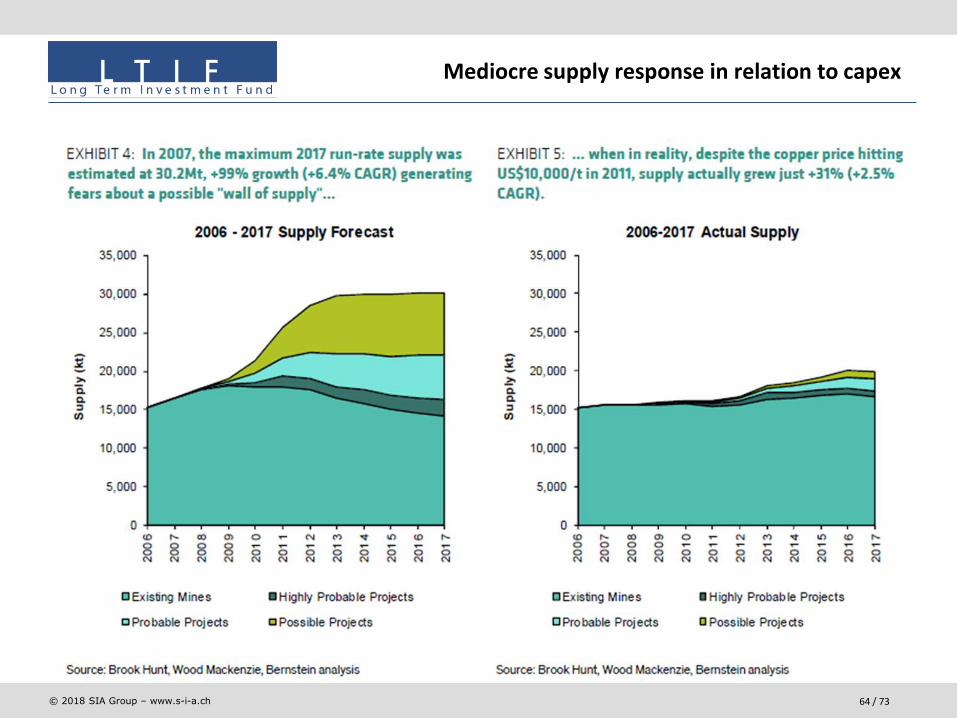
Mediocre supply response in relation to capex

© 2018 SIA Group – www.s-i-a.ch 65 / 73
• 100m b/d in 2020, withdemand growth at 1.0% p.a., in line with historicalaverages
• Growth only in developingcountries. OECD demand isalready flat or decreasing
• Depletion is at least 3% per year so we need around 18m b/d new production assets tooffset it
• Electric Vehicles, CO2 emission regulation will not have a large impact over2020
Oil: the world will need 100m barrels a day by 2020
© 2018 SIA Group – www.s-i-a.ch 66 / 73
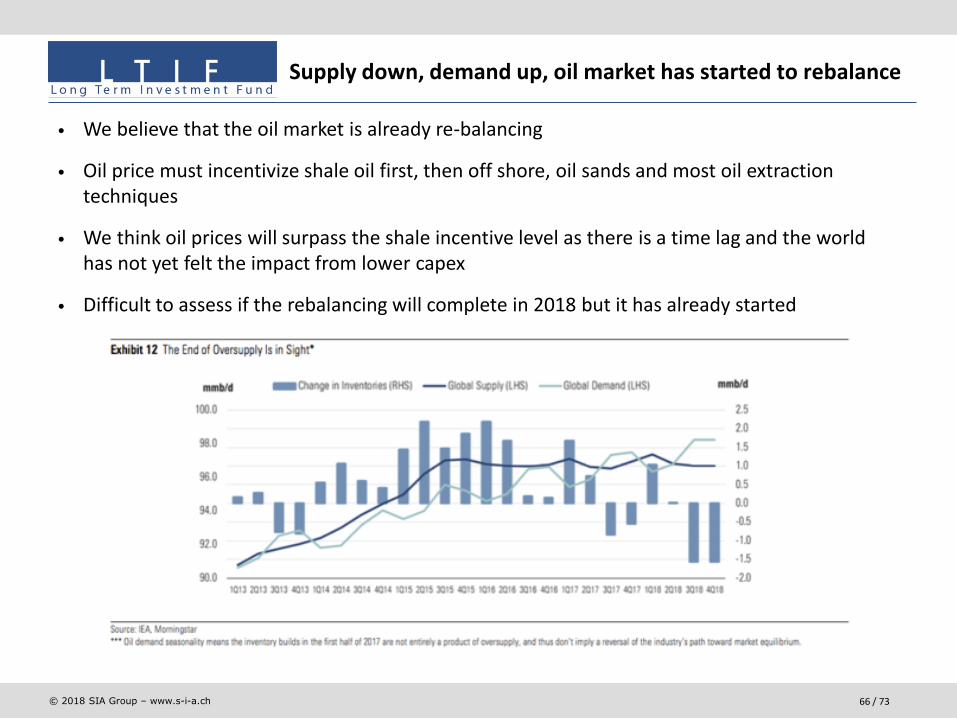
• We believe that the oil market is already re-balancing
• Oil price must incentivize shale oil first, then off shore, oil sands and most oil extraction techniques
• We think oil prices will surpass the shale incentive level as there is a time lag and the world has not yet felt the impact from lower capex
• Difficult to assess if the rebalancing will complete in 2018 but it has already started
Supply down, demand up, oil market has started to rebalance

© 2018 SIA Group – www.s-i-a.ch 67 / 73
• Most of productivity improvements are behind us. Main advances have been the number of drilling days and longer laterals
• Cost deflation is also behind us and this industry is cyclical
US production is peaking
© 2018 SIA Group – www.s-i-a.ch 68 / 73
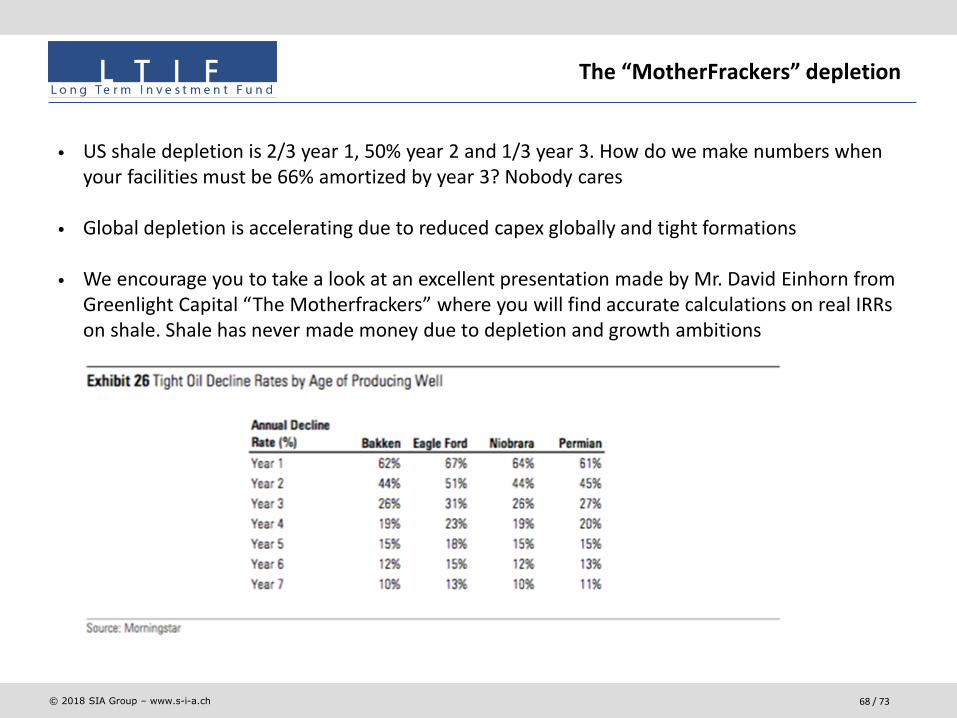
The “MotherFrackers” depletion
• US shale depletion is 2/3 year 1, 50% year 2 and 1/3 year 3. How do we make numbers when your facilities must be 66% amortized by year 3? Nobody cares
• Global depletion is accelerating due to reduced capex globally and tight formations
• We encourage you to take a look at an excellent presentation made by Mr. David Einhorn from Greenlight Capital “The Motherfrackers” where you will find accurate calculations on real IRRs on shale. Shale has never made money due to depletion and growth ambitions
© 2018 SIA Group – www.s-i-a.ch 69 / 73
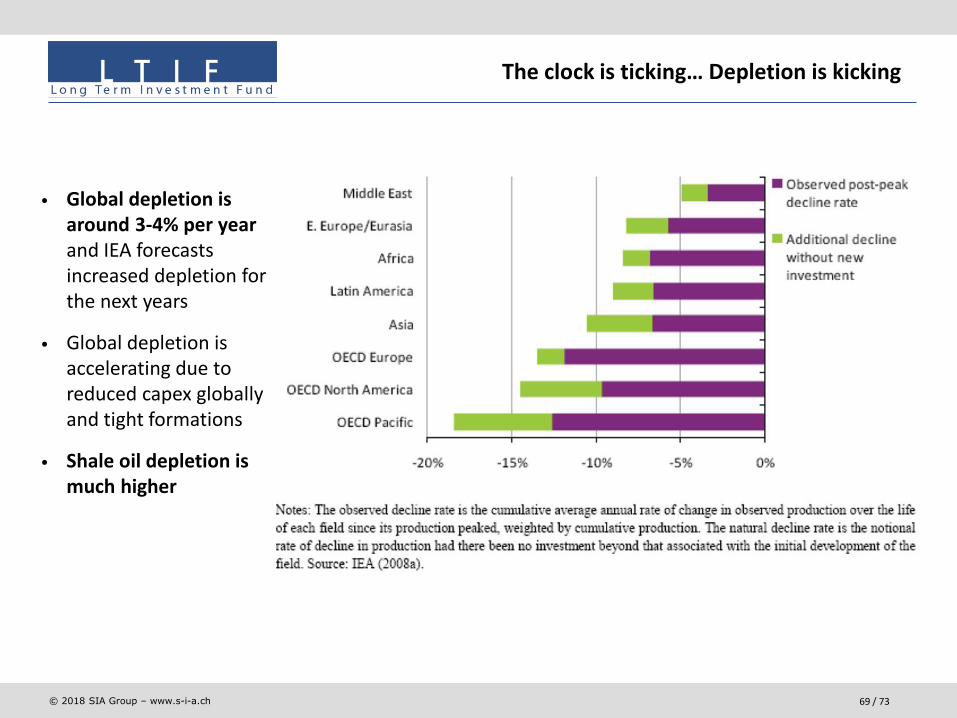
The clock is ticking… Depletion is kicking
• Global depletion is around 3-4% per yearand IEA forecasts increased depletion for the next years
• Global depletion is accelerating due to reduced capex globally and tight formations
• Shale oil depletion is much higher

© 2018 SIA Group – www.s-i-a.ch 70 / 73
Same story as mining

© 2018 SIA Group – www.s-i-a.ch 71 / 73
Long Term Investment Fund (SIA) – Natural Resources
Source: SIA Group / Bloomberg
Market Capitalization of companies in EUR in the LTIF NR as of 29th March 2018
© 2018 SIA Group – www.s-i-a.ch 72 / 73
Long Term Investment Fund
. 15, avenue J.F. Kennedy
. L-1855 Luxembourg
. Grand Duchy of Luxembourg
SIA Funds AG
. Alpenblickstrasse 25
. 8853 Lachen
. Switzerland
. Tel: +41 55 617 28 70
. Fax: +41 55 617 28 71
. website: www.s-i-a.ch
. e-mail: [email protected]
Contacts
© 2018 SIA Group – www.s-i-a.ch 73 / 73
LTIF (SIA) Classic, Stability A Cap, SRI and Natural Resources
. Performance up to 31.05.06 is that of the BVI-based LTIF, of which the LTIF Luxembourg is an identical successor. Previous
performance is audited by Ernst & Young. Past performance is neither a guarantee nor a reliable indicator of future results.
Performance data does not include the commissions and fees charged at the time of subscribing for or redeeming shares. This
information has been furnished to you upon request and solely for your information and may not be reproduced or redistributed
to any other person. It is not intended as an offer or solicitation with respect to the purchase or sale of shares of the Sicav. Neither
the Central Administration Agent nor the Investment Manager assume any liability in the case of incorrectly reported or
incomplete information. Please be aware that investment funds involve investment risks, including the possible loss of the
principal amount invested. For a detailed description of the risks in relation to each share in the investment fund, please see the
latest version of the prospectus, simplified prospectus, annual and semi-annual reports, which may solely be relied upon as the
basis for investment decisions; these documents are available on www.s-i-a.ch or from the Central Administration Agent
FundPartner Solutions (Europe) SA, 15A, avenue J.F. Kennedy, L - 1855 Luxembourg. LTIF Classic, Stability A Cap and Natural
Resources (previously Global Energy Value) were approved for distribution in and from Switzerland by the Swiss Financial Market
Supervisory Authority (FINMA) according to Art. 19 al. 1 of the Collective Investment Schemes Act, paying agent is Banque Pictet &
Cie SA, Route des Acacias 60, 1211 Geneva 73, Switzerland. Legal representative in Switzerland is FundPartner Solutions (Suisse)
SA, Route des Acacias 60, 1211 Geneva 73, Switzerland; notified to the Austrian Finanzmarktaufsicht according to §36 of the
Investment Funds Act; authorised in France by the Autorité des Marchés Financiers (AMF) pursuant to Art. 411-58 of the AMF
General Regulation; authorised by the German Bundesanstalt für Finanzdienstleistungsaufsicht (BaFin) according to §132 of the
Investment Act; authorised in Italy by the Bank of Italy and the CONSOB according to Article 42 of Legislative Decree no. 58 of 24
February 1998; registered in the register of foreign collective investment schemes commercialized in Spain by the Comisión
Nacional del Mercado de Valores (CNMV) pursuant to Art. 15 of the Law on Collective Investment Vehicles; recognised in the
United Kingdom by the Financial Services Authority (FSA) as a recognised scheme within the meaning of Section 264 of the
Financial Services and Markets Act 2000.
Disclaimer