Embed Size (px)
Citation preview

Article
Strategic Wildfire Response Decision Support and the RiskManagement Assistance Program
David E. Calkin 1,*, Christopher D. O’Connor 1 , Matthew P. Thompson 2 and Richard Stratton 3
�����������������
Citation: Calkin, D.E.; O’Connor,
C.D.; Thompson, M.P.; Stratton, R.
Strategic Wildfire Response Decision
Support and the Risk Management
Assistance Program. Forests 2021, 12,
1407. https://doi.org/10.3390/
f12101407
Academic Editor: Sandra Oliveira
Received: 19 August 2021
Accepted: 12 October 2021
Published: 15 October 2021
Publisher’s Note: MDPI stays neutral
with regard to jurisdictional claims in
published maps and institutional affil-
iations.
Copyright: © 2021 by the authors.
Licensee MDPI, Basel, Switzerland.
This article is an open access article
distributed under the terms and
conditions of the Creative Commons
Attribution (CC BY) license (https://
creativecommons.org/licenses/by/
4.0/).
1 USDA Forest Service, Rocky Mountain Research Station, Missoula, MT 59801, USA;[email protected]
2 USDA Forest Service, Rocky Mountain Research Station, Fort Collins, CO 80526, USA;[email protected]
3 USDA Forest Service, National Office, Fire and Aviation Management, Washington, DC 20250, USA;[email protected]
* Correspondence: [email protected]; Tel.: +1-406-546-5715
Abstract: In 2016, the USDA Forest Service, the largest wildfire management organization in theworld, initiated the risk management assistance (RMA) program to improve the quality of strategicdecision-making on its largest and most complex wildfire events. RMA was designed to facilitate amore formal risk management process, including the use of the best available science and emergingresearch tools, evaluation of alternative strategies, consideration of the likelihood of achieving objec-tives, and analysis of tradeoffs across a diverse range of incident objectives. RMA engaged personnelfrom a range of disciplines within the wildfire management system to co-produce actionable sciencethat met the needs of the highly complex incident decision-making environment while aiming to alignwith best practices in risk assessment, structured decision-making, and technology transfer. Over thefour years that RMA has been in practice, the content, structure, and method of information deliveryhave evolved. Furthermore, the RMA program’s application domain has expanded from merely largeincident support to incorporate pre-event assessment and training, post-fire review, organizationalchange, and system improvement. In this article, we describe the history of the RMA program todate, provide some details and references to the tools delivered, and provide several illustrativeexamples of RMA in action. We conclude with a discussion of past and ongoing program adaptationsand of how this can inform ongoing change efforts and offer thoughts on future directions.
Keywords: wildfire management; decision support; suppression; risk management
1. Introduction
Increasingly, extreme wildfire events are overwhelming fire management systems’capability to control fire and limit its impacts [1–3]. The increasing complexity and uncer-tainty of the socio-ecological fire environment are driven by multiple factors, includingclimate change [4,5], changing patterns of human settlement (e.g., housing expansion in theUnited States [6,7], rural abandonment in Mediterranean Europe [8,9]), and increased fuelloading due to a history of suppression [10–12]. Within the United States, there is growingrecognition that systemic changes in how the wildland fire system plans for and managesfires are necessary to alter risk trajectories [2,3,13–16].
Safe, effective, and risk-informed response to wildfire is a pillar of the NationalCohesive Wildland Fire Management Strategy. In recent years, the concept of safe andeffective response within federal wildfire management agencies in the US has transitionedfrom one that is focused largely on individual responsibility (see, for example, the USForest Service Safety Journey [17]) toward a more corporate risk management approach thatincorporates strategic risk assessment, structured decision-making, and accountability [18].This transition has emerged in part through the recognition that much of the exposure ofpersonnel to the hazards of the wildfire environment is determined at the strategic level,
Forests 2021, 12, 1407. https://doi.org/10.3390/f12101407 https://www.mdpi.com/journal/forests

Forests 2021, 12, 1407 2 of 18
through choices such as which resources to mobilize, when and where to deploy them, andwhat tasks to accomplish. For example, a traditional aviation safety-based approach wouldfocus on the conditions of the equipment, environmental factors, and pilot decision-making.A strategic exploration would include these as well but would also include an assessmentof how the assignment supports strategic incident objectives and if those incident objectivesare aligned with organizational priorities (see, for example [19]). Fully embracing riskmanagement principles in wildfire decision-making will likely require a significant changeto the historic large fire management structure and the organizational culture of aggressivesuppression as the dominant paradigm [20].
In December 2016, Forest Service senior leadership tasked a sub-group to exploreopportunities to improve the strategic alignment of critical decisions on large wildfires,bringing the Agency’s values in alignment with those articulated in the Life First initia-tive [21]. Although risk management had been identified as the cornerstone of wildfiremanagement since at least the 1995 Federal Wildland Fire Management Policy [22] andreiterated in 2009 guidance [23], the application of risk management concepts had largelybeen executed at the operational or real-time levels. The intention of broadening thescope to strategic decisions and perspectives was challenged by several organizational con-straints, such as uncertainty, misaligned incentive structures, goal ambiguity, and limitedformal training and education [24]. Thompson et al. [18] provided specific recommen-dations to improve the adoption of risk management in federal wildfire management inthe three areas of leadership, education, and capacity, and in assessment and planning.One particularly salient example is: “As a near-term solution, assemble and deploy a setof interdisciplinary consulting teams to provide the necessary expertise and guidance inrisk-based decision support”.
With those themes in mind, risk management assistance (RMA) was designed to assistlocal land and fire management decision-makers (frequently known as agency adminis-trators (AAs) in US federal land-management agencies) and incident management teams(IMTs) in making high-quality, risk-informed decisions. RMA achieved this by providingaccess to experienced AAs, IMTs, and subject matter experts in risk management and fireoperations, and by delivering enhanced fire analytics. The intent of the RMA program wasto apply existing and emerging decision support tools, coupled with risk managementexpertise, to improve the overall effectiveness and efficiency of wildfire response, doing soin a manner that emphasized the co-production of knowledge and worked across tradition-ally siloed fire management functions. By focusing on individual, complex large wildfireevents, RMA explored opportunities for and barriers to accelerating the adoption of moreformal risk-informed decision-making practices in wildfire management.
In this article, we describe our engagement and experience with the RMA program.In Section 2, we briefly review relevant literature on the characteristics of decision-makingon wildland fire and emerging recommendations to improve strategic response planning.In Section 3, we describe the development of the RMA program and how components ofthe RMA process fit into a risk-management cycle. In Section 4, we provide four exampleapplications of RMA in supporting different components of large, complex wildfires. InSection 5, we discuss how decision support and information delivery have evolved overtime and identify research needs and opportunities for further improvement in wildfiredecision-making.
2. Supporting Strategic Wildfire Response Decision-Making
Large, long-duration wildfires (fires that burn multiple thousands of hectares and thatlast for weeks or even months) can be highly uncertain events, creating a complex strategicand operational decision-making environment, influenced by factors such as sociopoliticalpressure and subject to myriad cognitive biases [24–28]. We focus on these fires becausethey can pose significant safety concerns, result in high levels of expenditures and damages,and resist control efforts. Furthermore, large fires entail dynamic and adaptive decisions

Forests 2021, 12, 1407 3 of 18
where time pressure and uncertainty challenge efforts to evaluate and compare alternativeoptions based on factors such as safety and the probability of success [29].
Some authors have suggested that decisions within this environment align with therecognition primed decision-making (RPD) construct [30,31]. Due to time pressure orill-defined goals, individuals utilizing RPD do not routinely evaluate alternatives butrather utilize their experience and familiarity with the situation to identify a single courseof action and modify that strategy until it feels acceptable [32]. The likelihood that ex-perts using RPD can consistently make high-quality decisions requires that the decisionenvironment is of high validity, i.e., that the relationships between signals and eventsare relatively stable and the outcomes from actions are readily observable [33]. The dy-namic and unpredictable nature of the large fire environment, the breadth of strategiesand tactics to address multiple and often competing objectives, and the lack of structuredfeedback on suppression effectiveness suggest that reliance on RPD for strategic wildfireresponse may be inappropriate [34]. Transitioning from RPD to more structured forms ofdecision-making requires reducing the time pressure through more efficient informationgathering/delivery, and by clarifying wildfire management incident objectives and alter-natives through enhanced risk and decision analysis. In other words, there is a need toenhance both the informational content on which decisions are based and the process bywhich those decisions are reached [35,36]
In response to the increasing complexity and risk of wildfire, there is an emerging bodyof literature focused on improving fire management decision processes. This entails, forexample, the study of factors influencing fire manager decision-making, the study of factorsinfluencing the adoption of fire science and decision support, a review and synthesis ofdecision support trends and needs, and the design and delivery of next-generation decisionsupport (e.g., [14,25,31,34,37–44]). In the US, existing large fire decision support systemsprovide a range of services, such as spatial analysis, fire behavior modeling, hazard andrisk assessment, and decision documentation [45,46]. However, they offer only limitedfunctionality to support the evaluation of alternative strategies with an emphasis on a safeand effective response. The RMA program is in part intended to bridge that gap.
3. RMA in Concept and in Practice3.1. Framework Design
RMA was designed by a small interdisciplinary team of line officers, experiencedincident management participants, and researchers, with a focus on improving decisionquality on the largest, most complex events. The team identified a small number ofemerging research products to help support the development and evaluation of multiplestrategic alternatives. With this goal in mind, the team recruited additional participantsin wildfire operations, analytics, safety, and risk management to support fire decisions bytraveling to and working directly with the managers of ongoing incidents in the summer of2017. By incorporating individuals with a variety of wildfire responsibilities, the intentionwas to provide feasible strategic options that were consistent with incident managementdecision processes, while limiting the impact to hosting units and engaged IMTs. Figure 1provides a brief history of the development of the RMA program, the focal areas of decisionsupport, and its use history according to fire season from 2017–2020.

Forests 2021, 12, 1407 4 of 18Forests 2021, 12, x 4 of 19
Figure 1. The risk management assistance (RMA) storyline and delivery history.
The structure and individual components of RMA fit into a standard risk
management cycle that is generally consistent with other wildfire risk management
processes (Figure 2; see, for example, [34,47,48]). Some RMA tools are highlighted and
mapped according to the appropriate stage of the risk management cycle. “Assess and
plan” involves the development of knowledge of the fire conditions, the impact to
objectives, and alternative approaches to managing the event; “decide and act” require
the selection of the preferred alternative and the implementation of the operational plan;
“monitor and learn” determines if current actions are producing desirable results; if not,
the cycle begins again.
In the Assess and Plan phase, RMA facilitates the co-production of an initial or
updated risk assessment by the hosting unit and the IMT, based on response objectives
and challenges. The assessment is informed by combining RMA tools with local
knowledge about the area, to help facilitate situational awareness and guide the
development of appropriate near-term actions and potential strategies. RMA tools, such
as indices of suppression difficulty [49] and the probability of control surfaces [50],
complement well-established fire behavior models that are frequently used within the
large fire management environment, including Flammap, FARSITE, FSPro, and other
tools delivered through the Wildland Fire Decision Support System [51]. Incorporating
analytical products with local knowledge facilitates improved reconnaissance, sizing up
of the fire responder safety environment, assessment of the potential effectiveness of
different strategies, locating and reinforcing the contingency lines, the weighing up of
alternative approaches, and the potential short- and long-term outcomes of an incident.
These tools can also support tactical decision-making during the management phase of
the fire by rapidly identifying potential areas of high concern, as tactics and strategy
evolve.
In the Decide and Execute phase, potential strategies are examined based on how
well they meet established incident resource management objectives, the potential risk to
fire responders, and the likelihood that they will be successful. This phase creates a
transparent process for developing an alignment of AAs, IMTs, and other land
Figure 1. The risk management assistance (RMA) storyline and delivery history.
The structure and individual components of RMA fit into a standard risk managementcycle that is generally consistent with other wildfire risk management processes (Figure 2;see, for example, [34,47,48]). Some RMA tools are highlighted and mapped accordingto the appropriate stage of the risk management cycle. “Assess and plan” involves thedevelopment of knowledge of the fire conditions, the impact to objectives, and alternativeapproaches to managing the event; “decide and act” require the selection of the preferredalternative and the implementation of the operational plan; “monitor and learn” determinesif current actions are producing desirable results; if not, the cycle begins again.
Forests 2021, 12, x 5 of 19
management partners to discuss response options and to communicate objectives and
strategies to a public information officer, to engage with the surrounding community.
In the Monitor and Learn phase, RMA tools provide information to AAs and IMTs to
ensure that the incident strategy is progressing as intended or to identify if the incident
strategy needs to be reevaluated. Monitoring tools facilitate discussions of ground and
aerial suppression resource use and the effectiveness and expected fire duration, to inform
ongoing and future suppression actions and resource needs. Stonesifer et al. [19] present
the Aviation Use Summary in more detail, and RMA timeline products can be accessed at
the RMA dashboard [52]. These tools facilitate the early recognition of the need to modify
existing strategies or develop new ones and can support emerging performance
measurement of wildfire suppression effectiveness, as described by Thompson et al.
[14,34].
Figure 2. Stylized three-stage risk management decision cycle and its relationship to highlighted RMA tools; adapted from
Thompson et al. [34].
3.2. Implementation and Evolution
In 2017 and 2018, a request from the AA (usually the Forest Supervisor) was required
in order to initiate RMA support. Typically, RMA teams were requested when an
established fire appeared to be of high complexity and was likely to continue burning on
the landscape for several weeks or longer. Once assistance was requested, the hosting AA
provided a delegation of authority, outlining responsibilities for the RMA team and
communicating with the assigned IMT regarding shared intentions. An RMA team would
then travel to the site of the large fire, to gather intelligence and gain a better
understanding of the local decision environment. A typical team composition included a
line officer (the designated RMA team leader), operations specialist, wildfire analyst, and
risk specialist.
In those first two years, the focus of the RMA program was to support the local AA,
emphasizing the in-person engagement of an interdisciplinary team with the land
management unit experiencing the event. The culmination of this engagement was
typically the development of a trade-off analysis (TOA) that compared alternative
strategies, based on incident resource objectives, firefighter exposure and risk, and the
probability of success. The engagement brought together local leadership, key members
of the IMT, and occasionally local public representatives, with the intent of achieving
agreement and alignment around the strategy that best met the decision criteria. One
primary finding of a review of RMA during that period by Schultz et al. [13] was that
Figure 2. Stylized three-stage risk management decision cycle and its relationship to highlighted RMA tools; adapted fromThompson et al. [34].

Forests 2021, 12, 1407 5 of 18
In the Assess and Plan phase, RMA facilitates the co-production of an initial orupdated risk assessment by the hosting unit and the IMT, based on response objectives andchallenges. The assessment is informed by combining RMA tools with local knowledgeabout the area, to help facilitate situational awareness and guide the development ofappropriate near-term actions and potential strategies. RMA tools, such as indices ofsuppression difficulty [49] and the probability of control surfaces [50], complement well-established fire behavior models that are frequently used within the large fire managementenvironment, including Flammap, FARSITE, FSPro, and other tools delivered throughthe Wildland Fire Decision Support System [51]. Incorporating analytical products withlocal knowledge facilitates improved reconnaissance, sizing up of the fire responder safetyenvironment, assessment of the potential effectiveness of different strategies, locatingand reinforcing the contingency lines, the weighing up of alternative approaches, andthe potential short- and long-term outcomes of an incident. These tools can also supporttactical decision-making during the management phase of the fire by rapidly identifyingpotential areas of high concern, as tactics and strategy evolve.
In the Decide and Execute phase, potential strategies are examined based on howwell they meet established incident resource management objectives, the potential riskto fire responders, and the likelihood that they will be successful. This phase creates atransparent process for developing an alignment of AAs, IMTs, and other land managementpartners to discuss response options and to communicate objectives and strategies to apublic information officer, to engage with the surrounding community.
In the Monitor and Learn phase, RMA tools provide information to AAs and IMTs toensure that the incident strategy is progressing as intended or to identify if the incidentstrategy needs to be reevaluated. Monitoring tools facilitate discussions of ground andaerial suppression resource use and the effectiveness and expected fire duration, to informongoing and future suppression actions and resource needs. Stonesifer et al. [19] presentthe Aviation Use Summary in more detail, and RMA timeline products can be accessedat the RMA dashboard [52]. These tools facilitate the early recognition of the need tomodify existing strategies or develop new ones and can support emerging performancemeasurement of wildfire suppression effectiveness, as described by Thompson et al. [14,34].
3.2. Implementation and Evolution
In 2017 and 2018, a request from the AA (usually the Forest Supervisor) was required inorder to initiate RMA support. Typically, RMA teams were requested when an establishedfire appeared to be of high complexity and was likely to continue burning on the landscapefor several weeks or longer. Once assistance was requested, the hosting AA provided adelegation of authority, outlining responsibilities for the RMA team and communicatingwith the assigned IMT regarding shared intentions. An RMA team would then travel tothe site of the large fire, to gather intelligence and gain a better understanding of the localdecision environment. A typical team composition included a line officer (the designatedRMA team leader), operations specialist, wildfire analyst, and risk specialist.
In those first two years, the focus of the RMA program was to support the localAA, emphasizing the in-person engagement of an interdisciplinary team with the landmanagement unit experiencing the event. The culmination of this engagement was typi-cally the development of a trade-off analysis (TOA) that compared alternative strategies,based on incident resource objectives, firefighter exposure and risk, and the probabilityof success. The engagement brought together local leadership, key members of the IMT,and occasionally local public representatives, with the intent of achieving agreement andalignment around the strategy that best met the decision criteria. One primary finding ofa review of RMA during that period by Schultz et al. [13] was that “RMA increased lineofficers’ ability to communicate the rationale underlying their decisions more clearly andtransparently to their colleagues and partners”.
However, Schultz et al. [13] also noted that fully exploring strategic options throughthe TOA process was challenging due to several factors, including limited decision space

Forests 2021, 12, 1407 6 of 18
once the fire was established, a need to establish strategic intent before the TOA couldbe completed, and concerns about external intervention in fire strategy determination.Additional user feedback included recommendations to introduce and utilize productsand concepts in the pre-event planning phase and the need for increased training andexperience with the assessment products and decision processes. Post-season reviews andfindings identified the more timely delivery of products as a critical need. Specifically, thein-person delivery of a structured TOA did not align with the compressed timeline neededto establish an incident strategy.
Two additional primary issues became apparent with formally structuring a TOA.The first was the recognition that analytics, information, and expert knowledge wereimbalanced across the risk to communities and landscapes and risk to responders. Theprobability of success factor was the least mature and the most reliant on expert judgment,which could be particularly problematic in cases where out-of-area IMTs were unfamiliarwith the local landscape and conditions. Perhaps not surprisingly, the most valued analyticswere those that spoke to responder safety and the probability of success. Second, theframing of alternatives was at times insufficient and overly simplistic to truly capture thecomplexity of the decision space. For example, some initial TOAs compared strategies thatwere defined as “direct” or “indirect” when, in practice, those are just tactics, and realisticincident strategies would likely employ both tactics but would vary in terms of the amountof direct relative to indirect line built.
With these issues in mind, the team initiated several changes to the RMA program,beginning with a definition of the primary problem to be addressed. We shifted the problemframe away from formalizing a TOA with simplistic alternatives and toward exploringopportunities for safe and effective control, enabling a discussion of tradeoffs associatedwith choices of where to engage, but in more meaningful terms. Additionally, we enhancedfield training, reduced the delivery time of RMA assessment products through remotedelivery, and increased the focus on linking with structured pre-season planning processesto identify potential wildfire operational delineations (PODs) [18].
In 2019, RMA transitioned largely to a remote support model, focusing on deliveringindividual products to IMT members and hosting unit staff. Increased field experiencewith the RMA component products created an increased demand for these assessments tosupport locally developed incident strategies. By working remotely, RMA analysts wereable to support more field requests by reducing travel time. RMA analysts communicateddirectly with the requesting individuals to tailor the required models to support the event.
During the 2020 fire season, the COVID-19 pandemic posed unique and unprece-dented challenges for the fire management system but also created new opportunities todemonstrate and utilize remote decision support. RMA pre-staged the necessary data,recruited new analysts, and streamlined remote delivery processes to reduce response timeand increase capacity to support the field. RMA also took advantage of the fact that manyof the traditional analytical support resident on incident management teams would bedelivered by regional analysts supporting multiple fires remotely, to avoid increasing thespread of COVID-19 within fire camps. The remote incident support was well-positionedto leverage the range of RMA analytics and to further customize products with a combina-tion of observed fire behavior and fire–weather interactions, direct communication withmultiple IMTs, and consultation with local observers.
3.3. Highlighted RMA Tools
RMA combines the expertise of agency administrators, fire managers, and researchscientists with direct feedback from practitioners. This feedback allows the suite of productssupplied through RMA to be constantly changing and improving and ensures that thespecific products requested and/or developed for each incident can be highly customized tothe specific needs of the decision-maker. Below, we provide brief descriptions of three of thecurrently most requested analytical tools that support RMA engagements: the suppressiondifficulty index (SDI), potential control locations (PCL), and the snag hazard map.
Forests 2021, 12, 1407 7 of 18
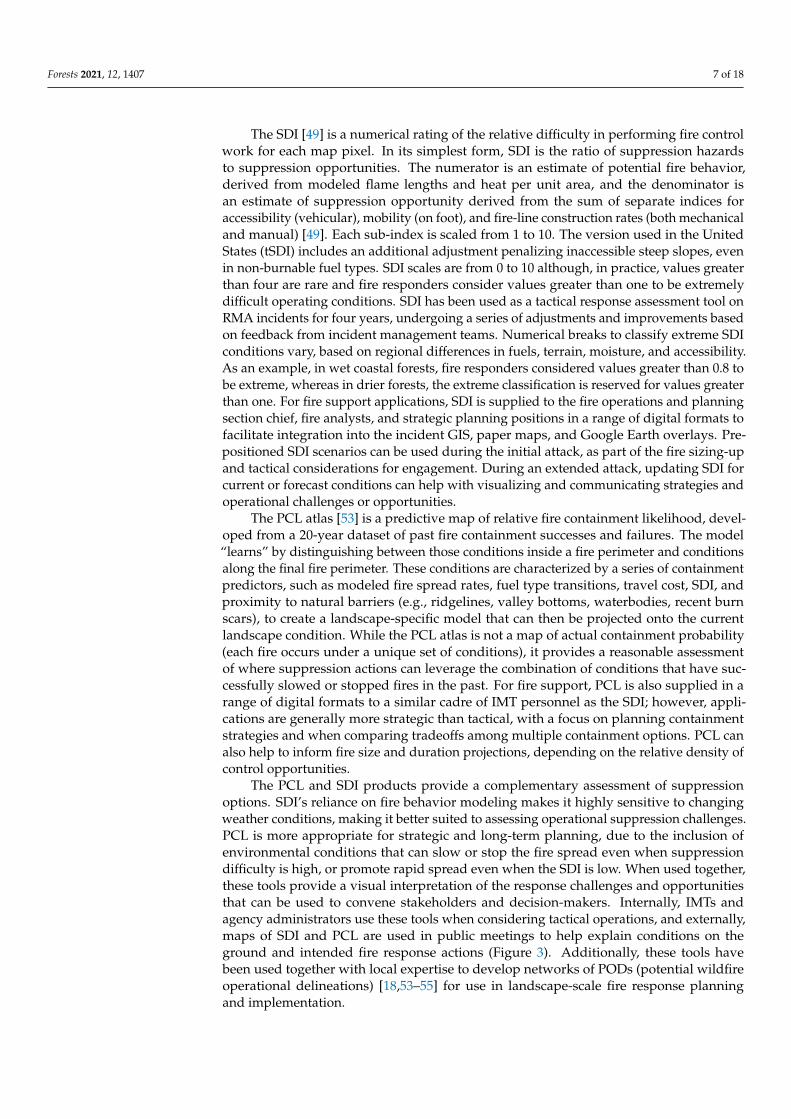
The SDI [49] is a numerical rating of the relative difficulty in performing fire controlwork for each map pixel. In its simplest form, SDI is the ratio of suppression hazardsto suppression opportunities. The numerator is an estimate of potential fire behavior,derived from modeled flame lengths and heat per unit area, and the denominator isan estimate of suppression opportunity derived from the sum of separate indices foraccessibility (vehicular), mobility (on foot), and fire-line construction rates (both mechanicaland manual) [49]. Each sub-index is scaled from 1 to 10. The version used in the UnitedStates (tSDI) includes an additional adjustment penalizing inaccessible steep slopes, evenin non-burnable fuel types. SDI scales are from 0 to 10 although, in practice, values greaterthan four are rare and fire responders consider values greater than one to be extremelydifficult operating conditions. SDI has been used as a tactical response assessment tool onRMA incidents for four years, undergoing a series of adjustments and improvements basedon feedback from incident management teams. Numerical breaks to classify extreme SDIconditions vary, based on regional differences in fuels, terrain, moisture, and accessibility.As an example, in wet coastal forests, fire responders considered values greater than 0.8 tobe extreme, whereas in drier forests, the extreme classification is reserved for values greaterthan one. For fire support applications, SDI is supplied to the fire operations and planningsection chief, fire analysts, and strategic planning positions in a range of digital formats tofacilitate integration into the incident GIS, paper maps, and Google Earth overlays. Pre-positioned SDI scenarios can be used during the initial attack, as part of the fire sizing-upand tactical considerations for engagement. During an extended attack, updating SDI forcurrent or forecast conditions can help with visualizing and communicating strategies andoperational challenges or opportunities.
The PCL atlas [53] is a predictive map of relative fire containment likelihood, devel-oped from a 20-year dataset of past fire containment successes and failures. The model“learns” by distinguishing between those conditions inside a fire perimeter and conditionsalong the final fire perimeter. These conditions are characterized by a series of containmentpredictors, such as modeled fire spread rates, fuel type transitions, travel cost, SDI, andproximity to natural barriers (e.g., ridgelines, valley bottoms, waterbodies, recent burnscars), to create a landscape-specific model that can then be projected onto the currentlandscape condition. While the PCL atlas is not a map of actual containment probability(each fire occurs under a unique set of conditions), it provides a reasonable assessmentof where suppression actions can leverage the combination of conditions that have suc-cessfully slowed or stopped fires in the past. For fire support, PCL is also supplied in arange of digital formats to a similar cadre of IMT personnel as the SDI; however, appli-cations are generally more strategic than tactical, with a focus on planning containmentstrategies and when comparing tradeoffs among multiple containment options. PCL canalso help to inform fire size and duration projections, depending on the relative density ofcontrol opportunities.
The PCL and SDI products provide a complementary assessment of suppressionoptions. SDI’s reliance on fire behavior modeling makes it highly sensitive to changingweather conditions, making it better suited to assessing operational suppression challenges.PCL is more appropriate for strategic and long-term planning, due to the inclusion ofenvironmental conditions that can slow or stop the fire spread even when suppressiondifficulty is high, or promote rapid spread even when the SDI is low. When used together,these tools provide a visual interpretation of the response challenges and opportunitiesthat can be used to convene stakeholders and decision-makers. Internally, IMTs andagency administrators use these tools when considering tactical operations, and externally,maps of SDI and PCL are used in public meetings to help explain conditions on theground and intended fire response actions (Figure 3). Additionally, these tools havebeen used together with local expertise to develop networks of PODs (potential wildfireoperational delineations) [18,53–55] for use in landscape-scale fire response planningand implementation.

Forests 2021, 12, 1407 8 of 18
Forests 2021, 12, x 8 of 19
used together, these tools provide a visual interpretation of the response challenges and
opportunities that can be used to convene stakeholders and decision-makers. Internally,
IMTs and agency administrators use these tools when considering tactical operations, and
externally, maps of SDI and PCL are used in public meetings to help explain conditions
on the ground and intended fire response actions (Figure 3). Additionally, these tools have
been used together with local expertise to develop networks of PODs (potential wildfire
operational delineations) [18,53–55] for use in landscape-scale fire response planning and
implementation.
Figure 3. SDI-PCL matrix. The color codes applied to SDI and the PCL atlas are designed to
complement one another. Locations where the products agree represent the best (blue/blue) or worst
(red/red) conditions for safe and effective wildfire response actions. Locations where the products
diverge indicate conditions where there is a juxtaposition between suppression effort and
containment likelihood.
Also critical to fire sizing-up and response assessment is an initial assessment of
hazards to fire responders. The Snag Hazard map product is intended to show areas of
relative hazard caused by dead, standing trees. The maps are compiled from the National
TreeMap dataset [56], primarily for use in large-scale modeling, and have not been field-
verified. From the map of tree attributes, dead trees are extracted and summarized by
median height and density per hectare. Data are classified using the relative hazard scale
of Dunn et al. [57] and displayed as a digital overlay for use by incident GIS staff and in
Google Earth overlay format. In Region 5, the National TreeMap layers are combined with
remote-sensing data collected from the eDaRT program [58] to produce a cumulative tree
mortality map from 2009–2020. The eDaRT-adjusted snag hazard map is similarly
classified as per Dunn et al. (2019) [7] and represents a “tuned” version of the National
TreeMap snag hazard product that is adjusted to account for remotely observed mortality
events.
RMA analytics and tools hosted on the RMA dashboard [52] include interactive maps
and incident-specific information summaries, presenting the individual products that
allow fire managers and specialists to visualize the risks and opportunities presented by
a fire on the landscape of interest. The dashboard is an open site that can be accessed by
federal, state, local, and private partners. Analytical tools hosted on the site include a
combination of customized real-time incident support products and more standardize
pre-positioned tools, available prior to fire ignition and typically at broader regional or
Figure 3. SDI-PCL matrix. The color codes applied to SDI and the PCL atlas are designed tocomplement one another. Locations where the products agree represent the best (blue/blue) orworst (red/red) conditions for safe and effective wildfire response actions. Locations where theproducts diverge indicate conditions where there is a juxtaposition between suppression effort andcontainment likelihood.
Also critical to fire sizing-up and response assessment is an initial assessment ofhazards to fire responders. The Snag Hazard map product is intended to show areas ofrelative hazard caused by dead, standing trees. The maps are compiled from the NationalTreeMap dataset [56], primarily for use in large-scale modeling, and have not been field-verified. From the map of tree attributes, dead trees are extracted and summarized bymedian height and density per hectare. Data are classified using the relative hazard scaleof Dunn et al. [57] and displayed as a digital overlay for use by incident GIS staff and inGoogle Earth overlay format. In Region 5, the National TreeMap layers are combined withremote-sensing data collected from the eDaRT program [58] to produce a cumulative treemortality map from 2009–2020. The eDaRT-adjusted snag hazard map is similarly classifiedas per Dunn et al. (2019) [7] and represents a “tuned” version of the National TreeMapsnag hazard product that is adjusted to account for remotely observed mortality events.
RMA analytics and tools hosted on the RMA dashboard [52] include interactive mapsand incident-specific information summaries, presenting the individual products that allowfire managers and specialists to visualize the risks and opportunities presented by a fire onthe landscape of interest. The dashboard is an open site that can be accessed by federal,state, local, and private partners. Analytical tools hosted on the site include a combinationof customized real-time incident support products and more standardize pre-positionedtools, available prior to fire ignition and typically at broader regional or national scales.The interactive RMA dashboard is continuously updated and is available online [52].
4. RMA Fire Support Application Case Studies
Here we review four specific applications on large wildland fire incidents, to demon-strate the evolution of RMA engagement over time, the flexibility of the RMA frameworkto adapt fire analytics, and the risk management decision cycle to support the needs ofindividual incidents. A fifth example is provided by Stonesifer et al. [19] in this issue onthe application of the Aviation Use Summary. Direct engagement, either remotely or inperson, promotes the introduction of and familiarity with custom analytics, engagementacross disciplines, and an improved environment for structured decision-making. These

Forests 2021, 12, 1407 9 of 18
examples demonstrate the range of issues explored with RMA, how RMA tools informeddecisions, and the geographic diversity of RMA engagement.
4.1. Crescent Mountain Fire, Washington State, USA
For the first two years of the RMA program, analysts invested a significant amountof time in one-on-one engagements with IMTs to introduce new analytical tools and tobuild a rapport between fire practitioners and fire scientists, to integrate science moreseamlessly into decision-making. The following example details one such engagementwhere an out-of-area team was transitioning onto a high-risk fire and needed a rapidsizing-up and assessment for the fire environment before committing their resources toany specific containment objectives.
On 7 August 2018, a Southern Area T1 IMT took over the Crescent Mountain Fire onthe Okanogan-Wenatchee National Forest in Washington State. Three years previously, theTwisp River Fire killed three firefighters and injured four others in a burnover entrapment,only a few miles to the east. RMA personnel had already developed an initial suite ofanalytical tools for a nearby incident and supplied initial SDI, PCL, and evacuation routeanalytics as part of the morning team in-briefing.
This was the first time that the IMT had seen RMA analytics, so the operationschief reached out directly to RMA analysts to learn more about the products and theirinterpretation. When comparing how the fire was spreading with wind-driven mid-sloperuns and stopping at higher elevations, the operations chief found that the PCL and,especially, the SDI maps supported the “gut” feeling of experienced operations personnelabout where they were likely to have the highest probability of success in keeping the fireas small as possible, while mitigating the risk to fire responders. Operations personneldeveloped a plan to contain the fire as it advanced to the southeast, using the nationalforest trail 408, which was the first opportunity to engage the fire with a PCL holdinglikelihood greater than 0.25 (Figure 4). The team used SDI and PCL maps in meetings withagency administrators and with the public, to help convey the containment strategy. Twodays later, the prepped line was challenged by the fire and was held for eight days while itcontinued to smolder. A high-wind event on the afternoon of 17 August caused the fire tospot across the valley at mid-slope, jumping the reinforced line and allowing it to progressthrough a matrix of steep terrain, following the pattern predicted by SDI and PCL, until itwas finally contained at a dense network of roads on 9 September 2018.

Forests 2021, 12, 1407 10 of 18Forests 2021, 12, x 10 of 19
Figure 4. Fire analytics maps supplied to an out-of-area IMT regarding the 2018 Crescent Mountain Fire on the Okanagan-
Wenatchee National Forest of Washington State. Maps of the suppression difficulty index (a) and potential control
locations (b) were used together (c) to develop containment strategies and to communicate these strategies with Agency
Administrators and the public.
4.2. Ferguson Fire, California, USA
Distribution of RMA analytics to local land managers and their partners created
unique opportunities to incorporate local knowledge and data products to produce
custom tools where better data were available. In the following example, an information
gap identified by incident managers was addressed by creating a research partnership
between the RMA risk scientists and local environmental scientists to produce a high-
resolution map of snag risk to fire responders that was then further tuned with field
observations to integrate with other RMA analytics.
Figure 4. Fire analytics maps supplied to an out-of-area IMT regarding the 2018 Crescent Mountain Fire on the Okanagan-Wenatchee National Forest of Washington State. Maps of the suppression difficulty index (a) and potential controllocations (b) were used together (c) to develop containment strategies and to communicate these strategies with AgencyAdministrators and the public.
4.2. Ferguson Fire, California, USA
Distribution of RMA analytics to local land managers and their partners createdunique opportunities to incorporate local knowledge and data products to produce customtools where better data were available. In the following example, an information gapidentified by incident managers was addressed by creating a research partnership betweenthe RMA risk scientists and local environmental scientists to produce a high-resolutionmap of snag risk to fire responders that was then further tuned with field observations tointegrate with other RMA analytics.
On 20 July 2018, RMA engaged with the Incident management team and leadershipfrom the Sierra National Forest, concerning the Ferguson Fire in the Sierra Nevada Moun-tains of California. Located approximately 24 km (15 mi) due east of the west entrance

Forests 2021, 12, 1407 11 of 18
to Yosemite National Park, and 6 km (3.75 mi) south of the 2013 Rim Fire footprint, theFerguson Fire was burning in heavy timber on rugged terrain, with a high snag loadcaused by significant bark beetle outbreaks from 2013 to 2017. Along with initial requestsfor the standard suite of RMA analytics, the Long-Term Analyst (LTAN) requested anyavailable information on snag mapping for the area. At the time, the only national databaseof insect disturbance and potential snag hazard was the insect and disease survey (IDS)mapping program [59]. For this landscape, IDS tree mortality polygons (2014–2017) cov-ered almost the entire forest and surrounding area but, without information about theseverity of mortality, these did not prove useful for assessing firefighter exposure concernson the ground.
The Regional Fire Planner connected the RMA analysts with scientists at the RegionFive Remote Sensing Laboratory (RSL) who were prototyping a new experimental canopymortality mapping system, known as the “Ecosystem Disturbance and Recovery Tracker”(eDaRT) [59]. The eDaRT system was designed to detect, quantify, and track forest canopymortality and eventual regrowth over time, making it an ideal candidate for incident-levelsnag hazard mapping. Initial eDaRT overlays, showing cumulative canopy mortality from2010 to 2016, were used to quantify areas of snag hazard concern (> 10% recent overstorymortality) at the 30-meter pixel scale, allowing for a more refined assessment of the elevatedrisk to firefighters (Figure 5).
Forests 2021, 12, x 12 of 19
Figure 5. Mapped canopy mortality used to inform fire responders of snag hazard on the 2018 Ferguson Fire, Mendocino
National Forest, CA. A general overview of snag hazard concerns in the vicinity of the actively growing fire (a) was
informed by aerial imagery (b) and remote sensing products (c). Snag hazard was used to alter surface fuel models and
spread direction assumptions in SDI calculations and demonstrated increased SDI values in most areas of high canopy
mortality (d). Canopy mortality estimates leveraged the ecosystem disturbance and recovery tracker system (eDaRT)
under development at the regional remote-sensing laboratory.
4.3. Pine Gulch Fire, Colorado, USA
The 2020 fire season and COVID-19 pandemic posed a unique set of challenges for
incident management teams but also created new opportunities to increase reliance on
remotely located resources, such as fire behavior analysts (FBANs). Remote FBANs
supported incident teams on multiple large wildfires simultaneously, essentially
functioning as area command support instead of incident-level resources. This unique
access to support multiple incidents, combined with the previous three years of
experience with RMA products, proved to be fertile ground for innovation among the fire
analyst corps. Analysts independently developed methods to assess relative holding
potential for a range of existing road networks, using the reanalysis of RMA PCL maps
and tools to assess the relative “costs” of improving road and trail networks for fire
containment, based on SDI maps. As credentialed fire professionals, assigned to support
IMTs, these analysts had access to real-time feedback from field operations. The credibility
of their own fire careers uniquely positioned them to track if or how analytics were used
to support key decisions regarding incidents.
An early example of this new functionality came from the Pine Gulch Fire, ignited by
lightning on 31 July 2020, north of Grand Junction, Colorado. The fire grew rapidly over
the next ten days and, at a size of just under 15,800 ha (39,100 acres), RMA support was
requested on 11 August. Rapid fire spread posed unique challenges for assessing the
Figure 5. Mapped canopy mortality used to inform fire responders of snag hazard on the 2018Ferguson Fire, Mendocino National Forest, CA. A general overview of snag hazard concerns inthe vicinity of the actively growing fire (a) was informed by aerial imagery (b) and remote sensingproducts (c). Snag hazard was used to alter surface fuel models and spread direction assumptionsin SDI calculations and demonstrated increased SDI values in most areas of high canopy mortality(d). Canopy mortality estimates leveraged the ecosystem disturbance and recovery tracker system(eDaRT) under development at the regional remote-sensing laboratory.
On 25 July 2018, an analyst from the R5 RSL observed that while smoke-shading wassuppressing the fire spread in healthy forest, the surface fire was actively spreading insnag patches where surface fuels were augmented with “branch fuels” from the dead anddying canopy, promoting convective spread upslope, even against prevailing winds. To

Forests 2021, 12, 1407 12 of 18
capture these observed dynamics, RMA analysts modified the SDI to account for upslopewinds and increased surface fuel loading only in the snag patches identified by eDaRT(Figure 5). These custom snag hazard and modified SDI products provided a more accurateportrayal of the increased hazards to fire responders from recent beetle kill and were usedto communicate the need for indirect tactics to protect fire responder safety until the firemoved to more defensible roads and open country. This initial snag-mapping effort ledto additional cooperation between RMA and the R5 RSL over the 2020 fire season, toproduce an eDaRT-adjusted snag hazard map that accounts for pre-disturbance forestheight and tree density. This new product combined the National TreeMap [56] with thenew eDaRT-based mortality magnitude index (MMI), the snag hazard rating system [57],and the landscape change monitoring system (LCMS) disturbance rate tracker [58] toproduce an annual overlay of snag hazard for the forested lands of California.
This example illustrates the value of having access to flexible skillsets across a rangeof disciplines, to adapt and combine datasets to significantly improve the decision-makingenvironment for fire managers. This is one of many examples of on-the-fly solutionsdeveloped through partnerships between national- and local-scale scientists and managers.
4.3. Pine Gulch Fire, Colorado, USA
The 2020 fire season and COVID-19 pandemic posed a unique set of challenges forincident management teams but also created new opportunities to increase reliance onremotely located resources, such as fire behavior analysts (FBANs). Remote FBANs sup-ported incident teams on multiple large wildfires simultaneously, essentially functioningas area command support instead of incident-level resources. This unique access to sup-port multiple incidents, combined with the previous three years of experience with RMAproducts, proved to be fertile ground for innovation among the fire analyst corps. Ana-lysts independently developed methods to assess relative holding potential for a rangeof existing road networks, using the reanalysis of RMA PCL maps and tools to assess therelative “costs” of improving road and trail networks for fire containment, based on SDImaps. As credentialed fire professionals, assigned to support IMTs, these analysts hadaccess to real-time feedback from field operations. The credibility of their own fire careersuniquely positioned them to track if or how analytics were used to support key decisionsregarding incidents.
An early example of this new functionality came from the Pine Gulch Fire, ignitedby lightning on 31 July 2020, north of Grand Junction, Colorado. The fire grew rapidlyover the next ten days and, at a size of just under 15,800 ha (39,100 acres), RMA supportwas requested on 11 August. Rapid fire spread posed unique challenges for assessing theholding potential under consistent high winds and drier than average conditions. In 2020,RMA produced its first standardized regional-scale SDI and PCL products depicting 90thpercentile fire weather conditions, to aid with pre-positioning data for rapid assessmentand decision support. These products were supplied to the FBAN, who had used incident-specific fire weather versions of both products for previous fire support and in pre-seasonfire planning on his own forest. The FBAN reached out to RMA analysts to inquire aboutthe fire weather assumptions of the new standardized SDI and PCL products and wascautioned about the “relative” nature of control likelihood under highly variable winds andfuel moistures. To address the mismatch between observed and simulated fire behavior,the LTAN ran an analysis of average PCL values for a 120-meter buffered area alonga segmented network of all roads in the three counties affected by the fire. Segmentswere labeled according to the average PCL value for the buffered segment area, andobservations of effective road holding locations were used to establish the effective PCLthreshold needed for a road to serve as a functional containment location. Buffering theroad corridors helped to differentiate those locations where the roads themselves were theonly viable control features from those areas where a combination of road location, fueltransitions, accessibility, and fuel type and fire behavior transitions improved the potentialholding capacity. The method proved successful for selecting the eventual road networks

Forests 2021, 12, 1407 13 of 18
that held on the 56,250-ha (139,000-acre) Pine Gulch Fire (Figure 6) and, two months later,on the 71,580-ha (176,878-acre) Mullen Fire.
Forests 2021, 12, x 13 of 19
holding potential under consistent high winds and drier than average conditions. In 2020,
RMA produced its first standardized regional-scale SDI and PCL products depicting 90th
percentile fire weather conditions, to aid with pre-positioning data for rapid assessment
and decision support. These products were supplied to the FBAN, who had used incident-
specific fire weather versions of both products for previous fire support and in pre-season
fire planning on his own forest. The FBAN reached out to RMA analysts to inquire about
the fire weather assumptions of the new standardized SDI and PCL products and was
cautioned about the “relative” nature of control likelihood under highly variable winds
and fuel moistures. To address the mismatch between observed and simulated fire
behavior, the LTAN ran an analysis of average PCL values for a 120-meter buffered area
along a segmented network of all roads in the three counties affected by the fire. Segments
were labeled according to the average PCL value for the buffered segment area, and
observations of effective road holding locations were used to establish the effective PCL
threshold needed for a road to serve as a functional containment location. Buffering the
road corridors helped to differentiate those locations where the roads themselves were
the only viable control features from those areas where a combination of road location,
fuel transitions, accessibility, and fuel type and fire behavior transitions improved the
potential holding capacity. The method proved successful for selecting the eventual road
networks that held on the 56,250-ha (139,000-acre) Pine Gulch Fire (Figure 6) and, two
months later, on the 71,580-ha (176,878-acre) Mullen Fire.
Figure 6. Containment feature ranking system, based on average PCL value for buffered road
segments developed by a local fire analyst assigned to the 2020 Pine Gulch fire in the Bureau of
Land Management Grand Junction District of Colorado. Road rankings used a secondary analysis
of the RMA potential control locations tool to enable direct comparisons of individual road sections
and their surroundings, to aid in selecting and reinforcing fire containment features. Analysis and
road classifications, courtesy of Bradley Pietruszka.
4.4. Decker Fire, Colorado, USA
Figure 6. Containment feature ranking system, based on average PCL value for buffered roadsegments developed by a local fire analyst assigned to the 2020 Pine Gulch fire in the Bureau of LandManagement Grand Junction District of Colorado. Road rankings used a secondary analysis of theRMA potential control locations tool to enable direct comparisons of individual road sections andtheir surroundings, to aid in selecting and reinforcing fire containment features. Analysis and roadclassifications, courtesy of Bradley Pietruszka.
4.4. Decker Fire, Colorado, USA
Although RMA has largely transitioned away from utilizing trade-off analysis (TOA)as the focus of their engagement with the field, under certain conditions, it can be ahighly effective tool to inform large fire strategic decisions. As noted earlier, assuringTOAs are developed while there is still significant strategic decision space, with stronginternal support by AAs and IMTs (13), are both significant challenges and critical needs.These conditions coalesced to allow the TOA process to have a significant influence on themanagement strategy of the Decker Fire.
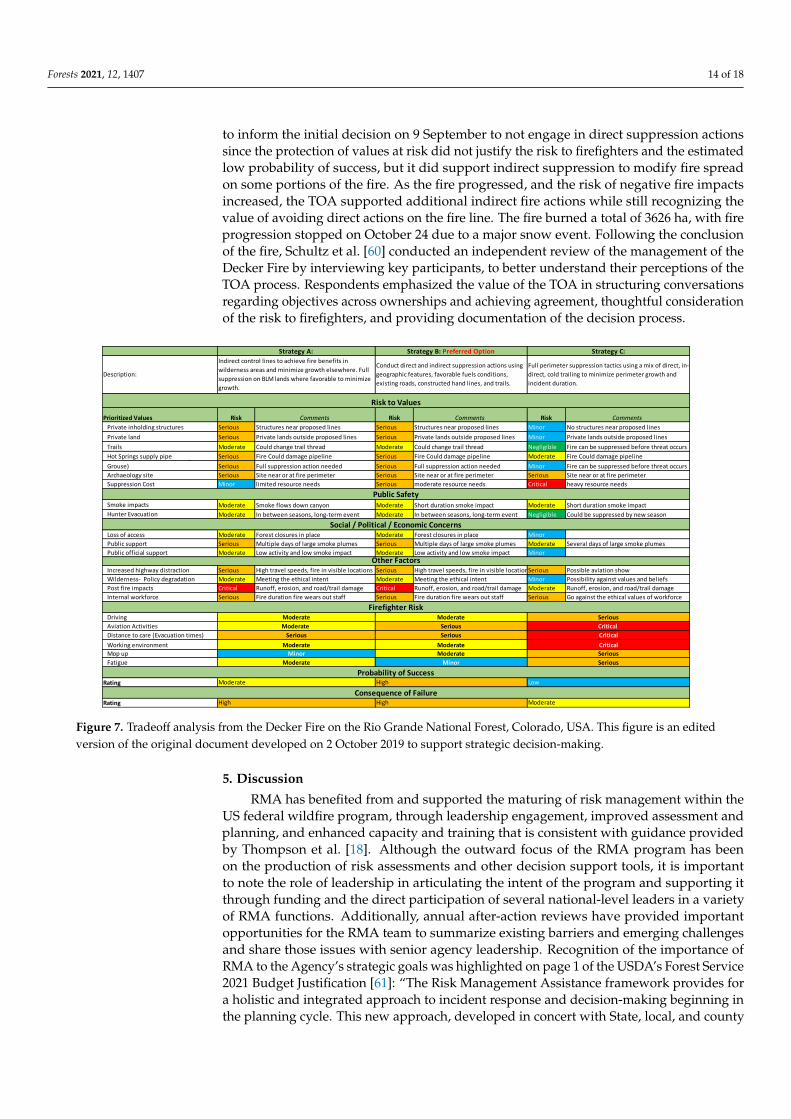
The Decker Fire started on September 8 2019 from a lightning strike in the Sangrede Cristo Wilderness, on the Rio Grande National Forest in southern Colorado. The fireignited in rugged, remote country, with limited immediate values at risk. The AAs on theForest, who had been exposed to RMA through previous fire engagements, requested thatRMA facilitate the development of a TOA to identify strategic options for the managementof the fire. The initial TOA was conducted on 9 September and was re-run on 15 Septemberand 2 October, after the fire made significant wind-driven runs. Figure 7 provides an editedversion of the Decker Fire TOA from 2 October, comparing three alternative strategiesdemonstrating the key components of the TOA. Specific considerations included the riskto developed and natural resource values, risk to public safety, social/political/economicconcerns, risk to firefighters, the probability of strategy success, and the consequence offailure. The TOA process utilized RMA analytics, including SDI, PCL, and snag hazard
Forests 2021, 12, 1407 14 of 18
to inform the initial decision on 9 September to not engage in direct suppression actionssince the protection of values at risk did not justify the risk to firefighters and the estimatedlow probability of success, but it did support indirect suppression to modify fire spreadon some portions of the fire. As the fire progressed, and the risk of negative fire impactsincreased, the TOA supported additional indirect fire actions while still recognizing thevalue of avoiding direct actions on the fire line. The fire burned a total of 3626 ha, with fireprogression stopped on October 24 due to a major snow event. Following the conclusionof the fire, Schultz et al. [60] conducted an independent review of the management of theDecker Fire by interviewing key participants, to better understand their perceptions of theTOA process. Respondents emphasized the value of the TOA in structuring conversationsregarding objectives across ownerships and achieving agreement, thoughtful considerationof the risk to firefighters, and providing documentation of the decision process.
Forests 2021, 12, x 14 of 19
Although RMA has largely transitioned away from utilizing trade-off analysis (TOA)
as the focus of their engagement with the field, under certain conditions, it can be a highly
effective tool to inform large fire strategic decisions. As noted earlier, assuring TOAs are
developed while there is still significant strategic decision space, with strong internal
support by AAs and IMTs (13), are both significant challenges and critical needs. These
conditions coalesced to allow the TOA process to have a significant influence on the
management strategy of the Decker Fire.
The Decker Fire started on September 8 2019 from a lightning strike in the Sangre de
Cristo Wilderness, on the Rio Grande National Forest in southern Colorado. The fire
ignited in rugged, remote country, with limited immediate values at risk. The AAs on the
Forest, who had been exposed to RMA through previous fire engagements, requested that
RMA facilitate the development of a TOA to identify strategic options for the management
of the fire. The initial TOA was conducted on 9 September and was re-run on 15 September
and 2 October, after the fire made significant wind-driven runs. Figure 7 provides an
edited version of the Decker Fire TOA from 2 October, comparing three alternative
strategies demonstrating the key components of the TOA. Specific considerations
included the risk to developed and natural resource values, risk to public safety,
social/political/economic concerns, risk to firefighters, the probability of strategy success,
and the consequence of failure. The TOA process utilized RMA analytics, including SDI,
PCL, and snag hazard to inform the initial decision on 9 September to not engage in direct
suppression actions since the protection of values at risk did not justify the risk to
firefighters and the estimated low probability of success, but it did support indirect
suppression to modify fire spread on some portions of the fire. As the fire progressed, and
the risk of negative fire impacts increased, the TOA supported additional indirect fire
actions while still recognizing the value of avoiding direct actions on the fire line. The fire
burned a total of 3626 ha, with fire progression stopped on October 24 due to a major snow
event. Following the conclusion of the fire, Schultz et al. [60] conducted an independent
review of the management of the Decker Fire by interviewing key participants, to better
understand their perceptions of the TOA process. Respondents emphasized the value of
the TOA in structuring conversations regarding objectives across ownerships and
achieving agreement, thoughtful consideration of the risk to firefighters, and providing
documentation of the decision process.
Prioritized Values Risk Comments Risk Comments Risk Comments
Private inholding structures Serious Structures near proposed lines Serious Structures near proposed lines Minor No structures near proposed lines
Private land Serious Private lands outside proposed lines Serious Private lands outside proposed lines Minor Private lands outside proposed lines
Trails Moderate Could change trail thread Moderate Could change trail thread Negligible Fire can be suppressed before threat occurs
Hot Springs supply pipe Serious Fire Could damage pipeline Serious Fire Could damage pipeline Moderate Fire Could damage pipeline Wildlife habitat (Gunnison Sage
Grouse) Serious Full suppression action needed Serious Full suppression action needed Minor Fire can be suppressed before threat occurs
Archaeology site Serious Site near or at fire perimeter Serious Site near or at fire perimeter Serious Site near or at fire perimeter
Suppression Cost Minor limited resource needs Serious moderate resource needs Critical heavy resource needs
Smoke impacts Moderate Smoke flows down canyon Moderate Short duration smoke impact Moderate Short duration smoke impact
Hunter Evacuation Moderate In between seasons, long-term event Moderate In between seasons, long-term event Negligible Could be suppressed by new season
Loss of access Moderate Forest closures in place Moderate Forest closures in place Minor
Public support Serious Multiple days of large smoke plumes Serious Multiple days of large smoke plumes Moderate Several days of large smoke plumes
Public official support Moderate Low activity and low smoke impact Moderate Low activity and low smoke impact Minor
Increased highway distraction Serious High travel speeds, fire in visible locations Serious High travel speeds, fire in visible locations Serious Possible aviation show
Wilderness- Policy degradation Moderate Meeting the ethical intent Moderate Meeting the ethical intent Minor Possibility against values and beliefs
Post fire impacts Critical Runoff, erosion, and road/trail damage Critical Runoff, erosion, and road/trail damage Moderate Runoff, erosion, and road/trail damage
Internal workforce Serious Fire duration fire wears out staff Serious Fire duration fire wears out staff Serious Go against the ethical values of workforce
Driving
Aviation Activities
Distance to care (Evacuation times)
Working environment
Mop up
Fatigue
Rating
Rating High High Moderate
Consequence of Failure
Probability of Success
Social / Political / Economic Concerns
Other Factors
Moderate High Low
Moderate Minor Serious
Moderate Serious Critical
CriticalModerate Moderate
Minor
Strategy A: Strategy B: Preferred Option Strategy C:
Indirect control lines to achieve fire benefits in
wilderness areas and minimize growth elsewhere. Full
suppression on BLM lands where favorable to minimize
growth.
Description:
Conduct direct and indirect suppression actions using
geographic features, favorable fuels conditions,
existing roads, constructed hand lines, and trails.
Full perimeter suppression tactics using a mix of direct, in-
direct, cold trailing to minimize perimeter growth and
incident duration.
Moderate Serious
Moderate Moderate Serious
Serious Serious Critical
Risk to Values
Firefighter Risk
Public Safety
Figure 7. Tradeoff analysis from the Decker Fire on the Rio Grande National Forest, Colorado, USA. This figure is an editedversion of the original document developed on 2 October 2019 to support strategic decision-making.
5. Discussion
RMA has benefited from and supported the maturing of risk management within theUS federal wildfire program, through leadership engagement, improved assessment andplanning, and enhanced capacity and training that is consistent with guidance providedby Thompson et al. [18]. Although the outward focus of the RMA program has beenon the production of risk assessments and other decision support tools, it is importantto note the role of leadership in articulating the intent of the program and supporting itthrough funding and the direct participation of several national-level leaders in a varietyof RMA functions. Additionally, annual after-action reviews have provided importantopportunities for the RMA team to summarize existing barriers and emerging challengesand share those issues with senior agency leadership. Recognition of the importance ofRMA to the Agency’s strategic goals was highlighted on page 1 of the USDA’s Forest Service2021 Budget Justification [61]: “The Risk Management Assistance framework provides fora holistic and integrated approach to incident response and decision-making beginning inthe planning cycle. This new approach, developed in concert with State, local, and county

Forests 2021, 12, 1407 15 of 18
partners to increase the decision space for fire managers and to provide line officers withmore opportunity to influence incident outcomes.”
The application of RMA analytics varies greatly based on the user of the information,the fire environment, and the needs and complexities of the incident. Analytics are beingused in all phases of the life cycle of the fire incident, including strategic decision devel-opment and documentation, public meetings, incident briefings, long-term assessment,situational awareness, tracking, and monitoring and post-fire reviews. With the transitionto pre-staged remote delivery, the tools are often used by out-of-area incident managementteams for accelerated situational awareness and sizing-up. One Type 1 Incident Comman-der described it as follows: “Whenever I know I’m going to a fire I order up about 5 or6 analytics right away even before I get to a fire just because I know their value”.
RMA has accelerated the adoption of new wildfire analytics, using a structured riskmanagement approach to support strategic planning and response for a majority of themost complex wildfire events in the US over the last several years. RMA has both benefitedfrom and helped accelerate the application of pre-event planning. Several of the coreRMA products, most prominently SDI and PCL, are key components of a major wildfiresuppression planning process known as PODs [48,53–55]. The alignment of the PODsprocess with RMA creates a positive feedback loop, where those who are exposed to thePODs process will be more likely to request and utilize RMA assistance while on fireassignments, and those exposed to RMA when participating in incidents will bring thatknowledge back to their home unit, spurring adoption of the PODs planning process [62].Thus, it appears that there are now a significant number of IMT members, local unit leaders,and fire analysts who have some level of experience in the application of RMA productsand our approach to structured decision-making. This represents a major shift in how theAgency prepares for and responds to fire and redeems its risk management responsibilities,as articulated in the Red Book and elsewhere.
During the first two years of RMA, analysts worked directly with field users to tailormodels to fit the individual fire conditions. This helped accelerate the adoption of themodels and helped analysts improve their models but it also posed a challenge. If productusers are looking to analysts to modify their assessments until the output matches theirexpectations, the value of these models is greatly diminished. Those concerns have beenreduced since, currently, most RMA product delivery occurs through standard productsdownloaded from the RMA dashboard.
RMA experiences align with many of the findings and recommendations from [63],including the need to increase analytical capacity and to clearly define the question thatthe decision support system is meant to address, the value of building relationships andsustaining communication over time, of validating and testing products with end-users,and of providing education and training to end-users. The RMA team has recognizedthat the work to improve complex strategic decision-making is both technical (assessmentand planning) as well as social (communication and coordination). RMA had providedscientists with opportunities to test new tools, engage with field operators and managersto better understand the decision environment, and explore areas where future researchwill have the highest impact. Managers have benefited from having critical informationand structured processes available at the time when strategic decisions need to be made,along with improved situational awareness for the initial phases of large fire management.Furthermore, RMA has helped senior leadership understand the complexities, challenges,and opportunities to improve high-impact strategic decisions in wildfire management.
6. Conclusions
Organizational change to address the increasingly complex threat that wildfire posesto society and the natural environment starts with how decisions are made. There is acritical need to ensure that managers are capable of making high-quality decisions incomplex environments and that they are supported with the best science available. TheRMA team has embraced the concept of the co-production of knowledge: “Co-production

Forests 2021, 12, 1407 16 of 18
promises to address the complex nature of contemporary sustainability challenges betterthan more traditional scientific approaches” [64].
RMA has improved the quality of high-impact strategic decisions through enhancedanalytics, structured decision processes, and the co-development of applications that meetthe needs of the fire management community. The engagement of thought leaders intypically siloed components of the organization facilitates fire management and forestleadership alignment and allows scientists to ensure that their work is relevant to the deci-sion environment. The combination of leadership support, management engagement, andscientific and field innovation will continue to be critical in helping wildfire managementaddress the increasingly complex wildfire environment into the future.
Author Contributions: D.E.C. conceived the paper, C.D.O. developed the material provided in thecase study examples, M.P.T. contributed to the development of the manuscript. R.S. contributed tothe development of the manuscript. All authors have read and agreed to the published version ofthe manuscript.
Funding: This research was supported by the U.S. Department of Agriculture, Forest Service.
Institutional Review Board Statement: Not applicable.
Informed Consent Statement: Not applicable.
Data Availability Statement: The data presented in this study are available on request from thecorresponding author.
Acknowledgments: This research was supported by the U.S. Department of Agriculture, ForestService. Crystal Stonesifer and Bradley Pietruszka provided support and review of the manuscript.The findings and conclusions in this report are those of the author(s) and should not be construed torepresent any official USDA or U.S. Government determination or policy.
Conflicts of Interest: The authors declare no conflict of interest.
References1. Tedim, F.; Leone, V.; Amraoui, M.; Bouillon, C.; Coughlan, M.; Delogu, G.; Fernandes, P.; Ferreira, C.; McCaffrey, S.;
McGee, T.; et al. Defining Extreme Wildfire Events: Difficulties, Challenges, and Impacts. Fire 2018, 1, 9. [CrossRef]2. Calkin, D.E.; Thompson, M.P.; Finney, M.A. Negative consequences of positive feedbacks in US wildfire management. For. Ecosyst.
2015, 2, 9. [CrossRef]3. North, M.P.; Stephens, S.L.; Collins, B.M.; Agee, J.K.; Aplet, G.; Franklin, J.F.; Fule, P.Z. Reform forest fire management. Science
2015, 349, 1280–1281. [CrossRef] [PubMed]4. Abatzoglou, J.T.; Williams, A.P. Impact of anthropogenic climate change on wildfire across western US forests. Proc. Natl. Acad.
Sci. USA 2016, 113, 11770–11775. [CrossRef] [PubMed]5. Jolly, W.M.; Cochrane, M.A.; Freeborn, P.H.; Holden, Z.A.; Brown, T.J.; Williamson, G.J.; Bowman, D.M.J.S. Climate-induced
variations in global wildfire danger from 1979 to 2013. Nat. Commun. 2015, 6, 7537. [CrossRef] [PubMed]6. Radeloff, V.C.; Helmers, D.P.; Kramer, H.A.; Mockrin, M.H.; Alexandre, P.M.; Bar-Massada, A.; Butsic, V.; Hawbaker, T.J.;
Martinuzzi, S.; Syphard, A.D.; et al. Rapid growth of the US wildland-urban interface raises wildfire risk. Proc. Natl. Acad. Sci.USA 2018, 115, 3314–3319. [CrossRef]
7. Moritz, M.A.; Batllori, E.; Bradstock, R.A.; Gill, A.M.; Handmer, J.; Hessburg, P.F.; Leonard, J.; McCaffrey, S.; Odion, D.C.;Schoennagel, T.; et al. Learning to coexist with wildfire. Nature 2014, 515, 58–66. [CrossRef]
8. Wunder, S.; Calkin, D.E.; Charlton, V.; Feder, S.; de Arano, I.M.; Moore, P.; Rodríguez, Y.; Silva, F.; Tacconi, L.; Vega-García, C.Resilient landscapes to prevent catastrophic forest fires: Socioeconomic insights towards a new paradigm. For. Policy Econ. 2021,128, 102458. [CrossRef]
9. Ursino, N.; Romano, N. Wild forest fire regime following land abandonment in the Mediterranean region. Geophys. Res. Lett.2014, 41, 8359–8368. [CrossRef]
10. Xanthopoulos, G.; Leone, V.; Delogu, G.M. 7—The Suppression Model Fragilities: The “Firefighting Trap”. In Extreme WildfireEvents and Disasters; Tedim, F., Leone, V., McGee, T.K., Eds.; Elsevier: Amsterdam, The Netherlands, 2020; pp. 135–153.
11. Hessburg, P.F.; Agee, J.K.; Franklin, J.F. Dry forests and wildland fires of the inland Northwest USA: Contrasting the landscapeecology of the pre-settlement and modern eras. For. Ecol. Manag. 2005, 211, 117–139. [CrossRef]
12. Miller, J.D.; Safford, H.D.; Crimmins, M.; Thode, A.E. Quantitative Evidence for Increasing Forest Fire Severity in the SierraNevada and Southern Cascade Mountains, California and Nevada, USA. Ecosystems 2009, 12, 16–32. [CrossRef]
13. Schultz, C.A.; Miller, L.F.; Greiner, S.M.; Kooistra, C. A Qualitative Study on the US Forest Service’s Risk Management AssistanceEfforts to Improve Wildfire Decision-Making. Forests 2021, 12, 344. [CrossRef]

Forests 2021, 12, 1407 17 of 18
14. Thompson, M.P.; Macgregor, D.G.; Dunn, C.J.; Calkin, D.E.; Phipps, J. Rethinking the Wildland Fire Management System. J. For.2018, 116, 382–390. [CrossRef]
15. Thompson, M.; Dunn, C.; Calkin, D. Wildfires: Systemic changes required. Science 2015, 350, 920–921. [CrossRef] [PubMed]16. Finney, M.A. The wildland fire system and challenges for engineering. Fire Saf. J. 2021, 120, 103085. [CrossRef]17. Lane, V.R.; Cordell, K.; Zarnoch, S.J.; Green, G.T.; Poudyal, N.; Fox, S. The Forest Service Safety Survey: Results from an Employee-Wide
Safety Attitude Survey; e-Gen. Tech. Rep. SRS-GTR-191; USDA-Forest Service, Southern Research Station: Asheville, NC, USA,2014; 58p.
18. Thompson, M.P.; MacGregor, D.G.; Calkin, D. Risk Management: Core Principles and Practices, and Their Relevance to Wildland Fire;Gen. Tech. Rep. RMRS-GTR-350; U.S. Department of Agriculture, Forest Service, Rocky Mountain Research Station: Fort Collins,CO, USA, 2016; 29p.
19. Stonesifer, C.S.; Calkin, D.E.; Thompson, M.P.; Belval, E.J. Is This Flight Necessary? The Aviation Use Summary (AUS): AFramework for Strategic, Risk-Informed Aviation Decision Support. Forests 2021, 12, 1078. [CrossRef]
20. Timberlake, T.J.; Schultz, C.A.; Evans, A.; Abrams, J.B. Working on institutions while planning for forest resilience: A case studyof public land management in the United States. J. Environ. Plan. Manag. 2021, 64, 1291–1311. [CrossRef]
21. Life First Initiative. Available online: https://www.wildfirelessons.net/communities/community-home?communitykey=06981750-1dd8-4abf-8846-295d0d148cf9&tab=groupdetails (accessed on 22 July 2021).
22. Interagency Federal Wildland Fire Policy Review Working Group. Review and Update of the 1995 Federal Wildland Fire Manage-ment Policy. Available online: https://www.doi.gov/sites/doi.gov/files/uploads/2001-wfm-policy-review.pdf (accessed on 22July 2021).
23. Council, F.E. Guidance for Implementation of Federal Wildland Fire Management Policy. Available online: https://www.bia.gov/sites/bia.gov/files/assets/public/pdf/idc1-027146.pdf (accessed on 22 July 2021).
24. Calkin, D.C.; Finney, M.A.; Ager, A.A.; Thompson, M.P.; Gebert, K.M. Progress towards and barriers to implementation of a riskframework for US federal wildland fire policy and decision making. For. Policy Econ. 2011, 13, 378–389. [CrossRef]
25. Wilson, R.S.; Winter, P.L.; Maguire, L.A.; Ascher, T. Managing Wildfire Events: Risk-Based Decision Making Among a Group ofFederal Fire Managers. Risk Anal. 2011, 31, 805–818. [CrossRef]
26. Donovan, G.H.; Prestemon, J.P.; Gebert, K. The effect of newspaper coverage and political pressure on wildfire suppression costs.Soc. Nat. Resour. 2011, 24, 785–798. [CrossRef]
27. Thompson, M.P. Social, institutional, and psychological factors affecting wildfire incident decision making. Soc. Nat. Resour. 2014,27, 636–644. [CrossRef]
28. Thompson, M.P.; Calkin, D.E. Uncertainty and risk in wildland fire management: A review. J. Environ. Manag. 2011, 92, 1895–1909.[CrossRef]
29. Thompson, M.P.; Rodríguez, Y.; Silva, F.; Calkin, D.E.; Hand, M.S. A review of challenges to determining and demonstratingefficiency of large fire management. Int. J. Wildland Fire 2017, 26, 562. [CrossRef]
30. Drews, F.A.; Siebeneck, L.; Cova, T. Information Search and Decision Making in Computer-Based Wildfire Simulations. J. Cogn.Eng. Decis. Mak. 2015, 9, 229–240. [CrossRef]
31. Rapp, C.; Rabung, E.; Wilson, R.; Toman, E. Wildfire decision support tools: An exploratory study of use in the United States. Int.J. Wildland Fire 2020, 29, 581–594. [CrossRef]
32. Klein, G. A Recognition Primed Decision (RPD) Model of Rapid Decision Making. In Decision Making in Action: Models andMethods; Klein, G.A., Orasanu, J., Calderwood, R., Zsambok, C., Eds.; Ablex: Norwood, NJ, USA, 1993; pp. 138–147.
33. Kahneman, D.; Klein, G. Conditions for intuitive expertise: A failure to disagree. Am. Psychol. 2009, 64, 515. [CrossRef]34. Thompson, M.P.; Wei, Y.; Calkin, D.E.; O’Connor, C.D.; Dunn, C.J.; Anderson, N.M.; Hogland, J.S. Risk Management and Analytics
in Wildfire Response. Curr. For. Rep. 2019, 5, 226–239. [CrossRef]35. Marcot, B.G.; Thompson, M.P.; Runge, M.C.; Thompson, F.R.; McNulty, S.; Cleaves, D.; Tomosy, M.; Fisher, L.A.; Bliss, A. Recent
advances in applying decision science to managing national forests. For. Ecol. Manag. 2012, 285, 123–132. [CrossRef]36. Thompson, M.P.; Marcot, B.G.; Thompson, F.R.; McNulty, S.; Fisher, L.A.; Runge, M.C.; Cleaves, D.; Tomosy, M. The Science
of Decisionmaking: Applications for Sustainable Forest and Grassland Management in the National Forest System; Gen. Tech. Rep.WO-GTR-88; U.S. Department of Agriculture, Forest Service: Washington, DC, USA, 2013; 54p.
37. Hand, M.S.; Wibbenmeyer, M.J.; Calkin, D.E.; Thompson, M.P. Risk preferences, probability weighting, and strategy tradeoffs inwildfire management. Risk Anal. 2015, 35, 1876–1891. [CrossRef]
38. Pacheco, A.P.; Claro, J.; Fernandes, P.M.; De Neufville, R.; Oliveira, T.M.; Borges, J.G.; Rodrigues, J.C. Cohesive fire managementwithin an uncertain environment: A review of risk handling and decision support systems. For. Ecol. Manag. 2015, 347, 1–17.[CrossRef]
39. Martell, D.L. A Review of Recent Forest and Wildland Fire Management Decision Support Systems Research. Curr. For. Rep. 2015,1, 128–137. [CrossRef]
40. Noble, P.; Paveglio, T.B. Exploring Adoption of the Wildland Fire Decision Support System: End User Perspectives. J. For. 2020,118, 154–171. [CrossRef]
41. Hunter, M.E.; Colavito, M.M.; Wright, V. The Use of Science in Wildland Fire Management: A Review of Barriers and Facilitators.Curr. For. Rep. 2020, 6, 354–367. [CrossRef]

Forests 2021, 12, 1407 18 of 18
42. Greiner, S.M.; Schultz, C.A.; Kooistra, C. Pre-season fire management planning: The use of Potential Operational Delineations toprepare for wildland fire events. Int. J. Wildland Fire 2020, 30, 170–178. [CrossRef]
43. Thompson, M.P.; Gannon, B.M.; Caggiano, M.D.; O’Connor, C.D.; Brough, A.; Gilbertson-Day, J.W.; Scott, J.H. Prototyping aGeospatial Atlas for Wildfire Planning and Management. Forests 2020, 11, 909. [CrossRef]
44. Vásquez, F.; Cravero, A.; Castro, M.; Acevedo, P. Decision Support System Development of Wildland Fire: A Systematic Mapping.Forests 2021, 12, 943. [CrossRef]
45. Noonan-Wright, E.; Seielstad, C.A. Patterns of wildfire risk in the United States from systematic operational risk assessments:How risk is characterised by land managers. Int. J. Wildland Fire 2021, 30, 569–584. [CrossRef]
46. Monedero, S.; Ramirez, J.; Cardil, A. Predicting fire spread and behaviour on the fireline. Wildfire analyst pocket: A mobile appfor wildland fire prediction. Ecol. Model. 2019, 392, 103–107. [CrossRef]
47. Taber, M.A.; Elenz, L.M.; Langowski, P.G. Decision Making for Wildfires: A Guide for Applying a Risk Management Process at theIncident Level; Gen. Tech. Rep. RMRS-GTR-298WWW; Department of Agriculture, Forest Service, Rocky Mountain ResearchStation: Fort Collins, CO, USA, 2013; 59p.
48. Dunn, C.J.; Calkin, D.E.; Thompson, M.P. Towards enhanced risk management: Planning, decision making and monitoring of USwildfire response. Int. J. Wildland Fire 2017, 26, 551. [CrossRef]
49. Silva, F.R.y.; O’Connor, C.D.; Thompson, M.P.; Martinez, J.R.M.; Calkin, D.E. Modelling suppression difficulty: Current andfuture applications. Int. J. Wildland Fire 2020, 29, 752. [CrossRef]
50. O’Connor, C.D.; Calkin, D.E.; Thompson, M.P. An empirical machine learning method for predicting potential fire controllocations for pre-fire planning and operational fire management. Int. J. Wildland Fire 2017, 26, 587–597. [CrossRef]
51. Wildland Fire Decision Support System (WFDSS). Available online: https://wfdss.usgs.gov/wfdss/WFDSS_Home.shtml(accessed on 22 July 2021).
52. Stratton, R. Risk Management Assistance Dashboard. Available online: https://nifc.maps.arcgis.com/apps/MapSeries/index.html?appid=c5bc811ee22e4da0bde8abec7c20b8b4 (accessed on 22 July 2021).
53. O’Connor, C.; Thompson, M.; Rodríguez, Y.; Silva, F. Getting Ahead of the Wildfire Problem: Quantifying and MappingManagement Challenges and Opportunities. Geosciences 2016, 6, 35. [CrossRef]
54. Caggiano, M. Collaboratively Engaging Stakeholders to Develop Potential Operational Delineations. CFRI-1908. 2019. Availableonline: https://cfri.colostate.edu/wp-content/uploads/sites/22/2019/08/PODs-Collaborative-Engagement-Final-Report.pdf(accessed on 22 July 2021).
55. O’Connor, C.D.; Calkin, D.E. Engaging the fire before it starts: A case study from the 2017 Pinal Fire (Arizona). Wildfire 2019, 28,14–18.
56. Riley, K.L.; Grenfell, I.C.; Finney, M.A.; Wiener, J.M. TreeMap, a tree-level model of conterminous US forests circa 2014 producedby imputation of FIA plot data. Sci. Data 2021, 8, 11. [CrossRef] [PubMed]
57. Dunn, C.J.; O’Connor, C.D.; Reilly, M.J.; Calkin, D.E.; Thompson, M.P. Spatial and temporal assessment of responder exposure tosnag hazards in post-fire environments. For. Ecol. Manag. 2019, 441, 202–214. [CrossRef]
58. Healey, S.P.; Cohen, W.B.; Zhiqiang, Y.; Brewer, K.; Brooks, E.; Gorelick, N.; Gregory, M.; Hernandez, A.; Huang, C.; Hughes,J. Next-Generation Forest Change Mapping across the United States: The Landscape Change Monitoring system (LCMS). InProceedings of the Pushing Boundaries: New Directions in Inventory Techniques and Applications: Forest Inventory andAnalysis (FIA) Symposium 2015, Portland, OR, USA, 8–10 December 2015; Comps. Gen. Tech. Rep. PNW-GTR-931. Stanton,S.M., Christensen, G.A., Eds.; US Department of Agriculture, Forest Service, Pacific Northwest Research Station: Portland, OR,USA, 2015; p. 217.
59. Koltunov, A.; Ramirez, C.M.; Ustin, S.L.; Slaton, M.; Haunreiter, E. eDaRT: The Ecosystem Disturbance and Recovery Trackersystem for monitoring landscape disturbances and their cumulative effects. Remote Sens. Environ. 2020, 238, 111482. [CrossRef]
60. Schultz, C.; Kooistra, C.; Miller, L.; Ferguson, M. Findings from a Third-Party Assessment of the Forest Service’s Risk ManagementAssistance Team. Addendum: 2019 Decker Fire. 2020 Colorado State University Public Lands Policy Group Practitioner Paper 4,Winter. 2020. Available online: https://www.dropbox.com/s/z45p4yrgqsrmooc/Decker%20Fire%20Addendum_RMAT%20Report_CSU_PLPG.pdf?dl=0 (accessed on 12 September 2021).
61. United States Department of Agriculture. USDA Budget Justification. Available online: https://www.fs.usda.gov/sites/default/files/2020-02/usfs-fy-2021-budget-justification.pdf (accessed on 22 July 2021).
62. Stratton, R.D. The path to strategic wildland fire management planning. Wildfire Mag. 2020, 29, 24–31.63. Colavito, M. The Role of Risk Management Prioritization Decision Support Tools. Forests 2021, 12, 483. [CrossRef]64. Norström, A.V.; Cvitanovic, C.; Löf, M.F.; West, S.; Wyborn, C.; Balvanera, P.; Bednarek, A.T.; Bennett, E.M.; Biggs, R.; de Bremond,
A. Principles for knowledge co-production in sustainability research. Nat. Sustain. 2020, 3, 182–190. [CrossRef]