Embed Size (px)
Citation preview

Strategies for Evaluating the Impact of Climate Change on Your Favorite Plant
Disease
Eugene S. TakleProfessor of Atmospheric Science
Professor of Agricultural MeteorologyDirector, Climate Science Program
Iowa State UniversityAmes, IA 50011
Midwest Weather Working Group3rd Annual Meeting
Charlotte, NCAugust 6, 2010

Strategy being proposed herein is built on our experience with assessing impact of climate change on:
Streamflow in the Upper Mississippi River BasinWater quality (nitrates, sediment) in the Upper Mississippi River BasinCracking and rutting potential of roadwaysSoil carbon
Strategy for binary occurrence model development (Hit, Miss, False Alarm, Correct non-occurrence) is built on our experience with forecasting occurrence of frost on roadways (also analogous to forecasting occurrence of severe weather)

Iowa State-Wide Average Data
D. Herzmann, Iowa Environmental Mesonet

31.5”
34.0”8% increase
Iowa State-Wide Average Data

Totals above 40”2 years
Iowa State-Wide Average Data

Totals above 40” 8 years2 years
Iowa State-Wide Average Data

Cedar Rapids Data
“One of the clearest trends in the United States observational record is an increasing frequency and intensity of heavy precipitation events… Over the last century there was a 50% increase in the frequency of days with precipitation over 101.6 mm (four inches) in the upper midwestern U.S.; this trend is statistically significant “
Karl, T. R., J. M. Melillo, and T. C. Peterson, (eds.), 2009: Global Climate Change Impacts in the United States. Cambridge University Press, 2009, 196pp.

4.2 days 57% increase 6.6 days
Cedar Rapids Data

4.2 days 57% increase 6.6 days
2
11Years having more than 8 days
Cedar Rapids Data

IPCC 2007

December-January-February Temperature Change
A1B Emission Scenario2080-2099 minus1980-1999
7.2oF
6.3oF
IPCC 2007

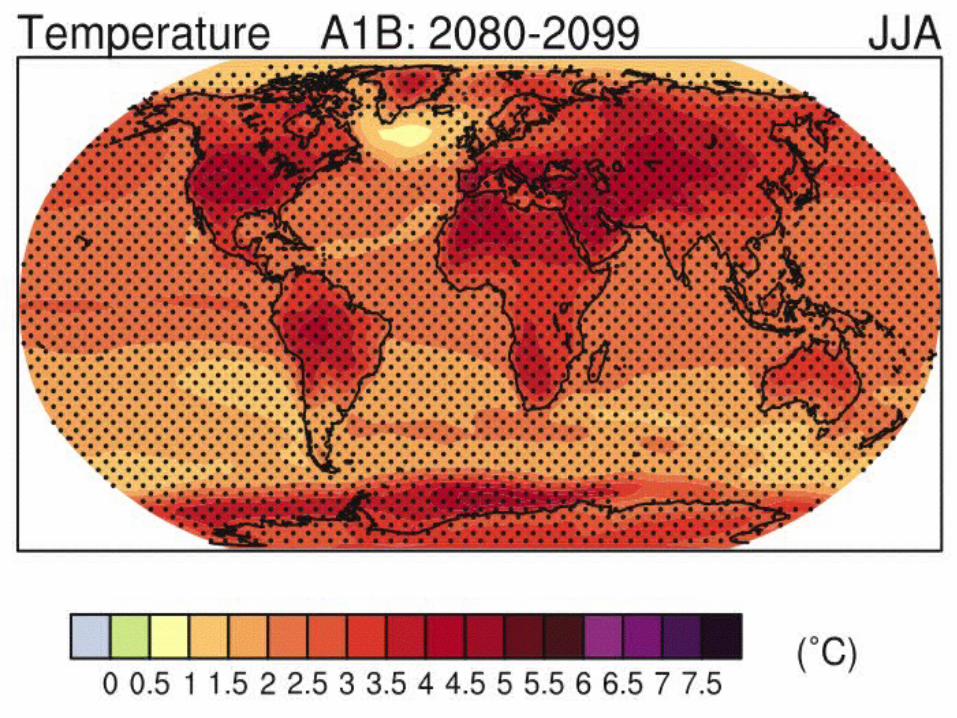
June-July-August Temperature Change
A1B Emission Scenario2080-2099 minus1980-1999
4.5oF
5.4oF

Karl, T. R., J. M. Melillo, and T. C. Peterson, (eds.), 2009: Global Climate Change Impacts in the United States. Cambridge University Press, 2009, 196pp.

Karl, T. R., J. M. Melillo, and T. C. Peterson, (eds.), 2009: Global Climate Change Impacts in the United States. Cambridge University Press, 2009, 196pp.
Low confidence

What environmental conditions promote your favorite plant disease?+ High humidity? Extended periods of high humidity?+ High temperature? Daytime? Nighttime? Both? Extended periods?+ Water-logged soils? Duration? Re-occurrence? + Dew? Duration? Re-occurrence?+ Excessive cloudiness?+ Some combination of the above? Something else?
Are there conditions antecedent to these that allow or accelerate disease development?+ Insect damage?+ Drought?+ Wind damage
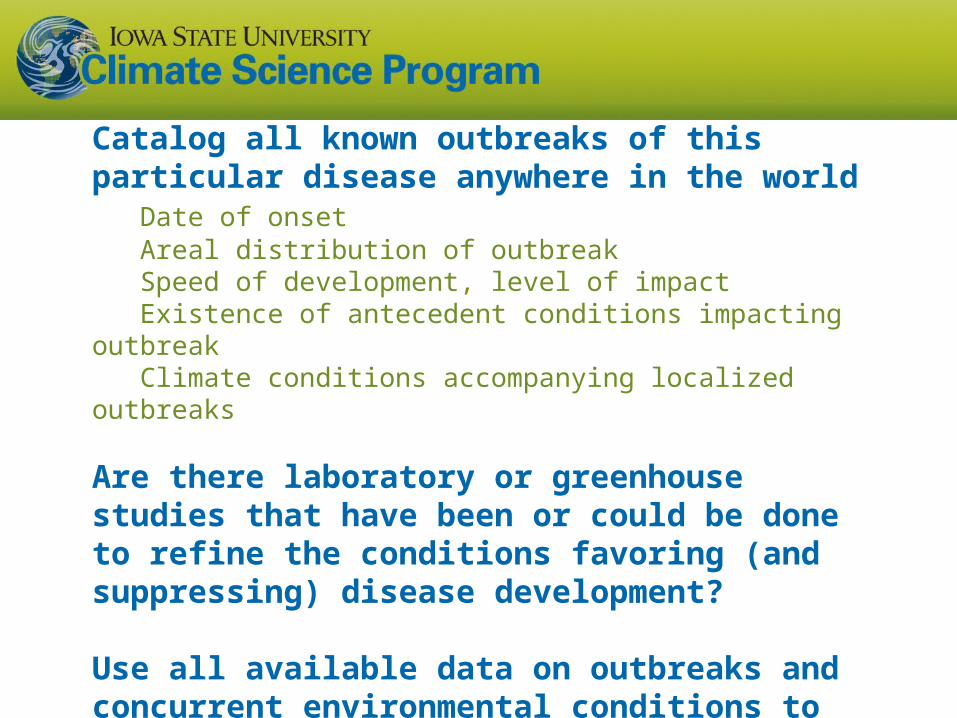
Catalog all known outbreaks of this particular disease anywhere in the world
Date of onsetAreal distribution of outbreakSpeed of development, level of impactExistence of antecedent conditions impacting outbreakClimate conditions accompanying localized outbreaks
Are there laboratory or greenhouse studies that have been or could be done to refine the conditions favoring (and suppressing) disease development?
Use all available data on outbreaks and concurrent environmental conditions to develop a disease outbreak probability model (DM) . Use professional judgment to develop hypotheses.

Climate Change DataProducing Climate Scenario Databases for Studying Impacts of Climate Change
Use climate models based on fundamental physical science principles:Conservation of momentum (Newton’s laws of motion)Conservation of energy (First law of thermodynamics)Conservation of massEquation of state (Ideal gas law: pV = nRT)
Select a scenario of future trends of emissions of greenhouse gasesWidespread adoption of energy conservation and renewable energyContinued upward trend of dependence on fossil fuels
Use model to create a “virtual contemporary” (1980-2004) and a “virtual future” (2040-2070) climate at county level for US
Create values of all measured meteorological variables and many others not measured (evapo-transpiration, long-wave upward radiation, etc.)
Archive values every 3 hours for 30 years

Search records of observed climate data (1980-2004) for the US using the DM to hindcast location and time of disease outbreaks
+ Compare with observed outbreaks; evaluate “false alarms”, etc.+ This provides a model validation for the DM
Search records of virtual contemporary modeled data (1980-2004) for the US using the DM to hindcast location and time of disease outbreaks
+ This validates the climate-model/DM combination (quantifies uncertainty)
Search records of future scenario modeled data (2040-2070) for the US using the DM to predict the location and frequency of disease outbreaks in the future climate
+ This predicts the change in disease outbreak with climate change

For More Information Contact me directly:
[email protected] Current research on regional climate and climate
change is being conducted at Iowa State University under the Regional Climate Modeling Laboratory http://rcmlab.agron.iastate.edu/
North American Regional Climate Change Assessment Program
http://www.narccap.ucar.edu/ For current activities on the ISU campus, regionally
and nationally relating to climate change see the Climate Science Program website:
http://climate.engineering.iastate.edu/
Or just Google Eugene Takle

Climate Model Resolution
global
regional (land)
regional (water)
Only every second RCM grid point is shown in eachdirection

NARCCAP Plan
A2 Emissions Scenario
GFDL CCSM HADAM3link to EU programs
CGCM3
1960-1990 current 2040-2070 futureProvide boundary conditions
MM5Iowa State/
PNNL
RegCM3UC Santa Cruz
ICTP
CRCMQuebec,Ouranos
HADRM3Hadley Centre
RSMScripps
WRFNCAR/PNNL
Reanalyzed climate , 1979-2000

Sub-Basins of theUpper MississippiRiver Basin
119 sub-basins
Outflow measuredat Grafton, IL
Approximately oneobserving stationper sub-basin
Approximately onemodel grid pointper sub-basin
Impact of Climate Change on UMRB Streamflow

SWAT Output with Various Sources of Climate Input