Embed Size (px)
Citation preview
Strategies for Growth: Centraland Eastern Europe
The collapse of the Soviet Union’s political and economic system,epitomized by the fall of the Berlin Wall in 1989, started the transi-tion from central planning to a market economy. From a historicalperspective, the transition economies have undergone an unprece-dented transformation, which has been difficult, but increasinglysuccessful. In particular, these countries have converted their state-owned economies into vibrant, albeit often still imperfect, marketeconomies based primarily on private ownership.
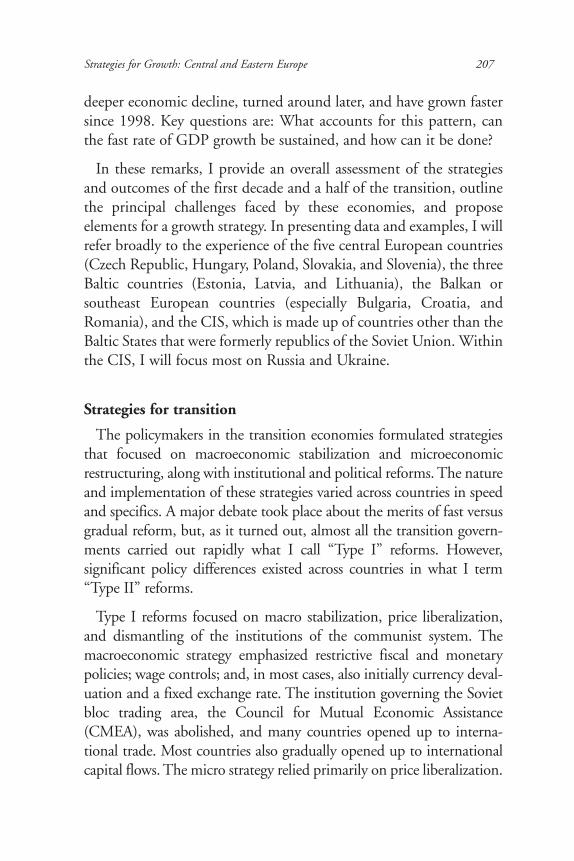
There are two key features related to performance of theseeconomies in terms of their gross domestic product (GDP). First, asmay be seen from Chart 1, which captures the evolution of GDP inselected countries since 1989, there was a large decline in economicactivity in the first several years of the transition. The decline wasunexpected, given that the transition economies were substituting ademonstrably inferior economic system with a superior one. Second,there has been a different pattern in GDP evolution between thecentral European countries in the west and those in the former SovietUnion (the Baltic and Commonwealth of Independent States, CIS,countries) further east. In particular, the more western transitioneconomies stopped the decline and started growing sooner, and theyalso grew faster in the 1990s. Charts 1 and 2 together indicate thatthe more eastern countries in the Baltic and CIS areas experienced a
205
Jan Svejnar
206 Jan Svejnar
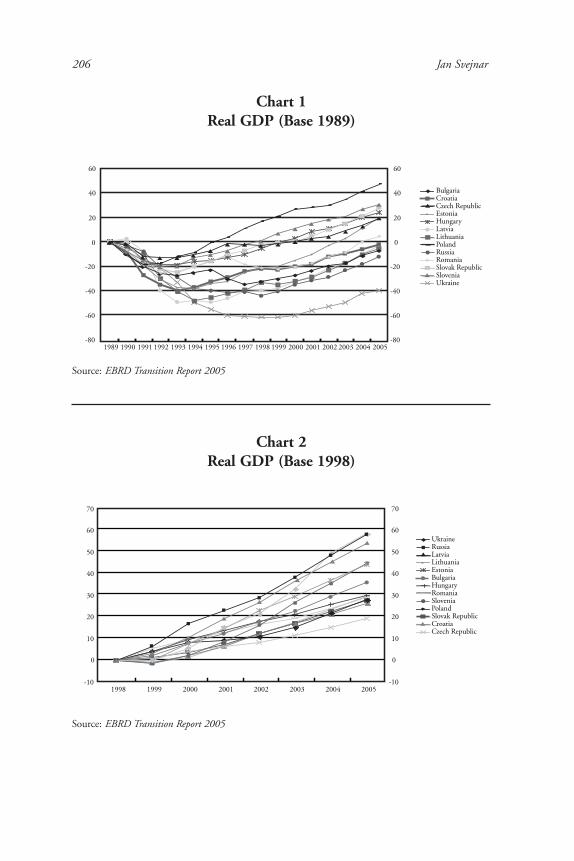
Chart 2Real GDP (Base 1998)
UkraineRussiaLatviaLithuaniaEstoniaBulgariaHungaryRomaniaSloveniaPolandSlovak RepublicCroatiaCzech Republic
-10
0
10
20
30
40
50
60
70
-10
0
10
20
30
40
50
60
70
1998 1999 2000 2001 2002 2003 2004 2005
Source: EBRD Transition Report 2005
Chart 1Real GDP (Base 1989)
-80
-60
-40
-20
0
20
40
60
-80
-60
-40
-20
0
20
40
60
1989 1990 1991 1992 1993 1994 1995 1996 1997 1998 1999 2000 2001 2002 2003 2004 2005
BulgariaCroatiaCzech RepublicEstoniaHungaryLatviaLithuaniaPolandRussiaRomaniaSlovak RepublicSloveniaUkraine
Source: EBRD Transition Report 2005
Strategies for Growth: Central and Eastern Europe 207
deeper economic decline, turned around later, and have grown fastersince 1998. Key questions are: What accounts for this pattern, canthe fast rate of GDP growth be sustained, and how can it be done?
In these remarks, I provide an overall assessment of the strategiesand outcomes of the first decade and a half of the transition, outlinethe principal challenges faced by these economies, and proposeelements for a growth strategy. In presenting data and examples, I willrefer broadly to the experience of the five central European countries(Czech Republic, Hungary, Poland, Slovakia, and Slovenia), the threeBaltic countries (Estonia, Latvia, and Lithuania), the Balkan orsoutheast European countries (especially Bulgaria, Croatia, andRomania), and the CIS, which is made up of countries other than theBaltic States that were formerly republics of the Soviet Union. Withinthe CIS, I will focus most on Russia and Ukraine.
Strategies for transition
The policymakers in the transition economies formulated strategiesthat focused on macroeconomic stabilization and microeconomicrestructuring, along with institutional and political reforms. The natureand implementation of these strategies varied across countries in speedand specifics. A major debate took place about the merits of fast versusgradual reform, but, as it turned out, almost all the transition govern-ments carried out rapidly what I call “Type I” reforms. However,significant policy differences existed across countries in what I term“Type II” reforms.
Type I reforms focused on macro stabilization, price liberalization,and dismantling of the institutions of the communist system. Themacroeconomic strategy emphasized restrictive fiscal and monetarypolicies; wage controls; and, in most cases, also initially currency deval-uation and a fixed exchange rate. The institution governing the Sovietbloc trading area, the Council for Mutual Economic Assistance(CMEA), was abolished, and many countries opened up to interna-tional trade. Most countries also gradually opened up to internationalcapital flows. The micro strategy relied primarily on price liberalization.
208 Jan Svejnar
Many countries also quickly reduced direct subsidies to state-ownedenterprises and allowed them to restructure. They removed barriers tothe creation of new firms and carried out small-scale privatizations.Moreover, most governments broke up the “monobank” system,whereby a single state bank functioned as a country’s central bank aswell as a nationwide commercial and investment bank, and theyallowed the creation of independent banks. A final feature was theintroduction of some elements of a social safety net. The Type I reformsproved relatively sustainable.
Type II reforms involved the development and enforcement of laws,regulations, and institutions that would be conducive to the function-ing of a market economy. These reforms included the privatization oflarge enterprises; establishment and enforcement of a market-orientedlegal system and accompanying institutions; an in-depth developmentof a viable commercial banking sector and the appropriate regulatoryinfrastructure; labor market regulations; and institutions related topublic unemployment and retirement systems.
Type II reforms were designed and implemented differently acrosscountries. For example, in the strategy of privatizing large- andmedium-sized firms, Poland and Slovenia moved slowly, relyinginstead on “commercialization”; Estonia and Hungary proceededeffectively by selling state-owned enterprises virtually one-by-one tooutside owners; Russia and Ukraine opted for rapid mass privatiza-tion with a reliance on subsidized management-employee buyouts;and the Czech Republic and Lithuania carried out equal-accessvoucher privatization by distributing a majority of shares of mostfirms to citizens at large.
Similarly, in the development of the banking system, Russia allowedspontaneous growth of new banks, resulting in a bottom-up creation ofhundreds of banks virtually overnight, while in central Europe theprocess was much more government-controlled. The banking systemsdiffered in various ways, but they shared two discouraging patterns.First, many of the small banks quickly collapsed. Second, in mostcountries, the large banks started with a sizable portfolio of nonper-forming enterprise loans and, upon restructuring, they rapidly
Strategies for Growth: Central and Eastern Europe 209
accumulated new nonperforming loans. The need for repeatedbailouts of banks since the mid-1990s has led most central Europeanand a number of the Balkan countries to privatize virtually all domes-tic banks to western banks.
While some countries did better than others, virtually no transitioncountry succeeded in rapidly developing a legal system and institu-tions that were highly conducive to the functioning of a marketeconomy. Many policymakers underestimated the importance of awell-functioning legal system, many newly rich individuals andgroups in the transition economies did not desire a strong legalsystem, and corruption was rampant. The countries that have madethe greatest progress in limiting corruption and establishing a func-tioning legal framework and institutions are the central European andBaltic countries. Interestingly, since the mid-1990s, an importantimpetus for carrying out legal and institutional reforms in many ofthese countries has been the need to develop a system that conformsto that of the European Union (EU) as a prerequisite for accession tothe EU. In this sense, the central European and Baltic countries bene-fited from both favorable initial conditions as well as propitious“terminal” conditions. The impact of the terminal conditions associ-ated with EU entry is currently observed in the Balkan states.
Performance of the transition economies since 1989 economic growth
In reporting economic growth in Charts 1 and 2, it is important toemphasize that in the early 1990s it was difficult to calculate theevolution of GDP. With this caveat, the official data suggest that allof the transition economies experienced large declines in output atthe start of the transition. The decline varied from 13 percent to 25percent in central Europe; more than 40 percent in the Baltic coun-tries; as much as 45 percent or more in Russia; and even more inmany of the other nations of the CIS, such as the drop of almost 65percent in Ukraine. The central European countries reversed thedecline after three to four years,1 but in Russia and most of the CIS,the turnaround did not occur until the late 1990s. Russia’s GDP, forinstance, declined until 1996, showed signs of growth in 1997, butthen declined again during Russia’s 1998 financial crisis.
210 Jan Svejnar
Most central European and Baltic countries have generated sustainedeconomic growth since the early to mid-1990s. The CIS countriesstarted growing in 1999, but since then their rate of GDP growth,together with that of the Baltic countries, has exceeded that of thecentral and east European economies (Chart 2). Since 1999, all thetransition economies have, thus, been growing at a relatively rapid rate.
The depth and length of the depression was unexpected, and anumber of competing explanations have been advanced: tight macro-economic policies (Bhaduri and others, 1993; Rosati, 1994); a creditcrunch stemming from the reduction of state subsidies to firms andrise in real interest rates (Calvo and Coricelli, 1992); disorganizationamong suppliers, producers, and consumers associated with thecollapse of central planning (Blanchard and Kremer, 1997; Rolandand Verdier, 1999); a switch from a controlled to uncontrolledmonopolistic structure in these economies (Li, 1999; Blanchard,1997); difficulties of sectoral shifts in the presence of labor marketimperfections (Atkeson and Kehoe, 1996); and the dissolution in1990 of the CMEA, which governed trade relations across the Sovietbloc nations. While each explanation tells part of the story, none hasstrong empirical support across the board.
What factors account for the early turnaround in central Europeand the subsequent upswing in all the transition economies? Nosingle explanation suffices. Geography provides part of the explana-tion. The central European countries, located farthest to the westamong the transition economies, have historically shared the samealphabet and religions, had similar educational and bureaucraticsystems, and intensively traded and otherwise interacted with coun-tries in western Europe. They, together with Bulgaria and Romania,were under the Soviet system for only four decades, as compared tofive decades in the case of the Baltic countries and seven decades inthe CIS countries. Finally, the central European and Baltic countriesquickly shifted trade from the CMEA area to western Europe andwere the first to prepare for and enter the EU. The physical proxim-ity and historical belongingness to Europe have, hence, provided animportant advantage for the “western” transition economies in the
Strategies for Growth: Central and Eastern Europe 211
first phase of moving from the Soviet-style to a democratic andmarket-oriented system.
The argument that geography provides only part of the explanationis based on the fact that the western-most transition economy, theCzech Republic, grew slower than others in central Europe in the firstdecade and a half of the transition (and was the only one to go into arecession in 1996-1998), as well as the fact that the transitioneconomies lying further east have recorded faster rates of growth since1998 than those located farther west.
Policies and other factors, such as resource prices, clearly matter aswell. In particular, the extent to which countries pursued a combina-tion of key Type II reforms provides some explanatory power. Withthe partial exception of the Czech Republic, the central Europeantransition economies pursued in the early to mid-1990s a relativelycomplete set of reforms, including the establishment of relatively clearproperty rights, legal system, and corporate governance. In contrast,the privatization experience of the Czech Republic, Russia, andUkraine in the 1990s suggests that mass privatization in the absenceof a functioning legal system has strong negative effects on perform-ance. In the 1990s, the economic situation in Russia and other CISeconomies also was aggravated by the political and economic disinte-gration of the Soviet Union, a greater presence of organized crime,and the spread of aggressive rent seeking and corruption.
The strong rebound in economic growth in the 2000s is attributa-ble to more fundamental reforms being carried out in most countries;increases in domestic consumption and in a number of countries’foreign investment; growth in credit to consumers and small- andmedium-sized firms; growth in exports; and, for a number of coun-tries, including Russia, Azerbaijan, and Kazakhstan, the rise in rawmaterial (especially oil) prices.
Inflation
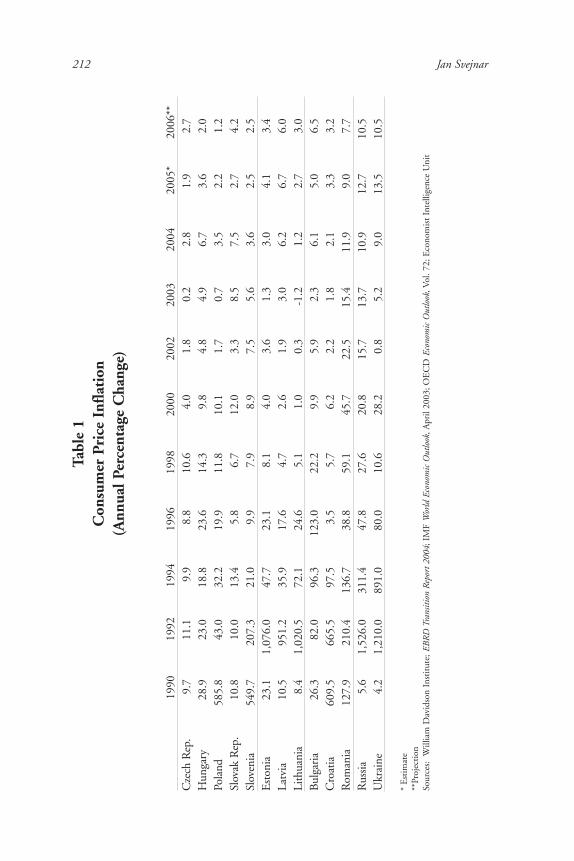
As may be seen from Table 1, a number of the transition economiesexperienced high or hyperinflation as the communist system
212 Jan SvejnarTa
ble
1C
onsu
mer
Pri
ce I
nfla
tion
(A
nnua
l Per
cent
age
Cha
nge)
1990
1992
1994
1996
1998
2000
2002
2003
2004
2005
*20
06**
Cze
ch R
ep.
9.7
11.1
9.9
8.8
10.6
4.0
1.8
0.2
2.8
1.9
2.7
Hun
gary
28.9
23.0
18.8
23.6
14.3
9.8
4.8
4.9
6.7
3.6
2.0
Pola
nd58
5.8
43.0
32.2
19.9
11.8
10.1
1.7
0.7
3.5
2.2
1.2
Slov
ak R
ep.
10.8
10.0
13.4
5.8
6.7
12.0
3.3
8.5
7.5
2.7
4.2
Slov
enia
549.
720
7.3
21.0
9.9
7.9
8.9
7.5
5.6
3.6
2.5
2.5
Est
onia
23.1
1,07
6.0
47.7
23.1
8.1
4.0
3.6
1.3
3.0
4.1
3.4
Latv
ia10
.595
1.2
35.9
17.6
4.7
2.6
1.9
3.0
6.2
6.7
6.0
Lith
uani
a8.
41,
020.
572
.124
.65.
11.
00.
3-1
.21.
22.
73.
0B
ulga
ria
26.3
82.0
96.3
123.
022
.29.
95.
92.
36.
15.
06.
5C
roat
ia60
9.5
665.
597
.53.
55.
76.
22.
21.
82.
13.
33.
2R
oman
ia12
7.9
210.
413
6.7
38.8
59.1
45.7
22.5
15.4
11.9
9.0
7.7
Rus
sia
5.6
1,52
6.0
311.
447
.827
.620
.815
.713
.710
.912
.710
.5U
krai
ne4.
21,
210.
089
1.0
80.0
10.6
28.2
0.8
5.2
9.0
13.5
10.5
* E
stim
ate
**Pr
ojec
tion
Sour
ces:
Will
iam
Dav
idso
n In
stit
ute;
EB
RD
Tra
nsiti
on R
epor
t 200
4; I
MF
Wor
ld E
cono
mic
Out
look
,Apr
il 20
03; O
EC
D E
cono
mic
Out
look
, Vol
. 72;
Eco
nom
ist
Inte
llige
nce
Uni
t
Strategies for Growth: Central and Eastern Europe 213
disintegrated. Sometimes inflation arose after the countries lifted pricecontrols; in other cases, it grew out of financial sector crises. Yet, by thelate 1990s, most countries had shown that they could reduce inflationwith speed and effectiveness. In the 2000s, inflation continued todecline steadily in most of these economies, driven in large part by rela-tively tight monetary policies of the central banks. There weretemporary surges of inflationary pressures in some economies as theywere joining the EU (alignments of excise taxes). But, by 2005,consumer price inflation was below 3 percent in all of central Europe,except Hungary; 4 percent to 6 percent in the Baltics; 0 percent to 9percent in the Balkans, except for Serbia and Montenegro, where it was16.2 percent; and 0 percent to 14 percent in the CIS, with Russia andUkraine being at 12.8 percent and 14.1 percent, respectively. Atpresent, inflation is an issue in the Baltic countries where there havebeen rising wages and increases in food and administrative prices, andit continues to be an issue in Serbia (for similar reasons) and in theresource-rich CIS countries, with booming commodity exports andincomplete sterilization of the resulting increase in base money.
In June 2004, Estonia, Lithuania, and Slovenia joined the ExchangeRate Mechanism (ERM) II system as a first step to adopting the euro,and Latvia followed in January 2005. Slovenia, with a 2.5 percent infla-tion in 2005, qualified for entry into the euro zone and is expected toadopt the euro in January 2007. Other Baltic and central Europeancountries are expected to follow suit over the next five years.
Exchange rates and current account
Most countries adopted a fixed exchange rate after devaluing theircurrency as a means of encouraging and increasing the competitive-ness of exports, as well as to provide competitiveness to domesticproducers vis à vis imports. However, as domestic inflation exceededworld inflation in the 1990s, the fixed exchange rates often becameovervalued, in some cases leading to substantial current accountdeficits. For instance, most countries in the Baltics, Balkans, and theCIS had at least one year in the 1990s when the current accountdeficit was 10 percent of GDP or more. Most countries responded by
214 Jan Svejnar
devaluing their currencies again and adopting more flexible exchangerate regimes, although Bulgaria, Estonia, and Lithuania, for instance,fixed their exchange rate through currency boards.
In the early 2000s, most transition economies succeeded in reign-ing in current account deficits, and a number of them have sincefurther reduced their deficits (for example, Poland and Slovenia) oreven turned them into surpluses (Kazakhstan and Uzbekistan).However, by the mid-2000s a number of countries have experiencedincreased current account deficits, brought about primarily by risingconsumption and investment fueled in a number of instances byexpanding credit and rising imports. The problem is especiallypronounced in the Balkan and Baltic states. In contrast, a number ofcommodity-exporting countries in the CIS have been recordingstrong current account surpluses as world prices have risen in the pastseveral years.
External debt and fnancial crises
A number of transition countries started the 1990s with highforeign indebtedness. In Bulgaria, Hungary, and Poland, externaldebt exceeded 50 percent of GDP, while in Russia it was 148 percentof GDP. Other transition economies, such as Romania, Slovenia, theCzech Republic, and Slovakia, had conservative regimes whereforeign debt was less than 20 percent of GDP in 1990.
In the 1990s, most of the highly indebted countries reduced theirdebt relative to GDP, while a number of the less indebted countriesraised theirs. But in the mid- to late 1990s, foreign indebtedness rosein some of the relatively more indebted countries, and Russia, in fact,defaulted on its sovereign debt in 1998. By the mid-2000s, most tran-sition economies have external debt in excess of 25 percent of GDP, butfew (Croatia, Estonia, Latvia, and the Kyrgyz Republic) have externaldebt higher than 70 percent of GDP. Unless accompanied by otherdestabilizing factors, such as a high proportion of short-term debt thatmay suddenly not be refinanced as investor sentiment shifts (as was thecase in Russia in 1998), this level of debt is not especially alarming.
Strategies for Growth: Central and Eastern Europe 215
Government budget and taxes
Under communism, the government owned almost everything,with taxes and expenditures being transfers among centrally deter-mined activities. During the transition, governments had to developnew fiscal institutions for collecting taxes. This institutional develop-ment was one of the hardest reforms to achieve. While tax collectionwas relatively effective in central Europe and the Baltic States alreadyin the early 1990s, Russia and the other CIS countries faced signifi-cant shortfalls in tax revenue as many producers operated throughbarter and accumulated tax arrears. At the same time, the govern-ments faced numerous transition-related public expenditures,including those on infrastructure and the new social safety net. Theinitial relative inability of Russia and the CIS nations to collect taxesis one reason why their social safety nets, and the implementation ofType II reforms in general, were much weaker than those in centralEurope and the Baltics.
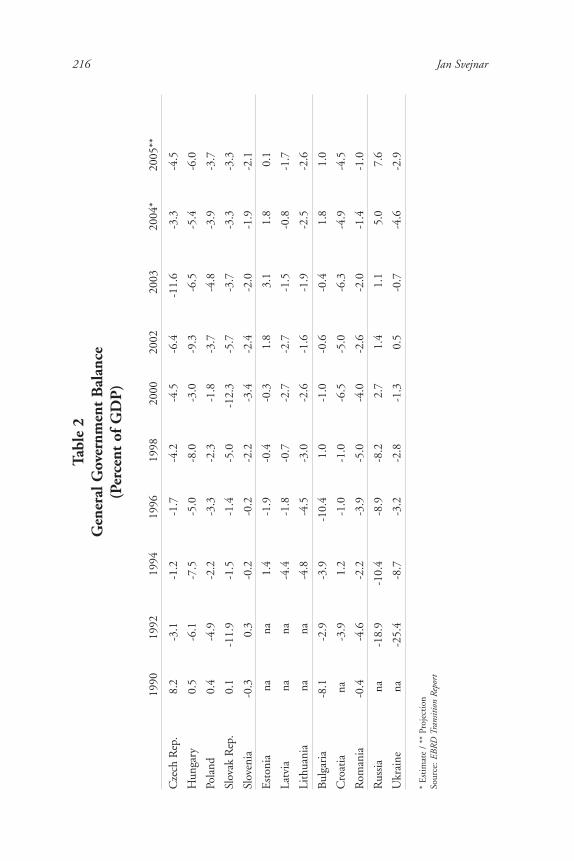
A number of transition economies, particularly those in centralEurope, quickly established relatively high tax rates, especially incomparison to other countries at a similar level of GDP per capita. Yet,many of the transition economies have been running budget deficits.Thus, Albania, Bulgaria, the Czech Republic, Hungary, Lithuania, Kazakhstan, Russia, Slovakia, and Ukraine in a number of years havehad annual budget deficits in excess of 5 percent of GDP. Table 2shows the evolution of government budget balance as a share of GDPin selected economies. As may be seen from the table, a number ofcountries managed to reduce the initial budget deficits by the late1990s or around 2000, but some (especially in central Europe) havewitnessed increasing deficits in the early to mid-2000s. A number offactors account for this development, including the tax harmonizationwith the EU, compensating for the economic slowdown in the EUwith domestic expansionary fiscal policies, expenditures related toelectoral cycles, and the growing burden of social transfers. The dete-riorating fiscal situation and inability to carry out fiscal expenditurereforms have led the Czech, Hungarian, and Polish governments to
216 Jan SvejnarTa
ble
2G
ener
al G
over
nmen
t B
alan
ce
(Per
cent
of
GD
P)
1990
1992
1994
1996
1998
2000
2002
2003
2004
*20
05**
Cze
ch R
ep.
8.2
-3.1
-1.2
-1.7
-4.2
-4.5
-6.4
-11.
6-3
.3-4
.5
Hun
gary
0.5
-6.1
-7.5
-5.0
-8.0
-3.0
-9.3
-6.5
-5.4
-6.0
Pola
nd0.
4-4
.9-2
.2-3
.3-2
.3-1
.8-3
.7-4
.8-3
.9-3
.7
Slov
ak R
ep.
0.1
-11.
9-1
.5-1
.4-5
.0-1
2.3
-5.7
-3.7
-3.3
-3.3
Slov
enia
-0.3
0.3
-0.2
-0.2
-2.2
-3.4
-2.4
-2.0
-1.9
-2.1
Est
onia
nana
1.4
-1.9
-0.4
-0.3
1.8
3.1
1.8
0.1
Latv
iana
na-4
.4-1
.8-0
.7-2
.7-2
.7-1
.5-0
.8-1
.7
Lith
uani
ana
na-4
.8-4
.5-3
.0-2
.6-1
.6-1
.9-2
.5-2
.6
Bul
gari
a-8
.1-2
.9-3
.9-1
0.4
1.0
-1.0
-0.6
-0.4
1.8
1.0
Cro
atia
na-3
.91.
2-1
.0-1
.0-6
.5-5
.0-6
.3-4
.9-4
.5
Rom
ania
-0.4
-4.6
-2.2
-3.9
-5.0
-4.0
-2.6
-2.0
-1.4
-1.0
Rus
sia
na-1
8.9
-10.
4-8
.9-8
.22.
71.
41.
15.
07.
6
Ukr
aine
na-2
5.4
-8.7
-3.2
-2.8
-1.3
0.5
-0.7
-4.6
-2.9
* E
stim
ate
/ **
Pro
ject
ion
Sour
ce: E
BR
D T
rans
ition
Rep
ort
Strategies for Growth: Central and Eastern Europe 217
delay the planned entry into the euro zone, beyond the originallyplanned 2007 date. Among the commodity-exporting countries in theCIS, high commodity prices have generated fiscal surpluses, especiallyin Kazakhstan and Russia, some of which have been channeled intospecial long-term stabilization funds. However, there are increasingpressures on the governments to relax fiscal policies.
An especially problematic aspect of the public finances in a numberof the transition economies is the increasing strain from the publicpension and health-care systems. These economies entered the transi-tion with publicly funded pension systems, almost universal coverageof the population, low retirement ages, a high and growing ratio ofretirees to workers, high payroll tax contribution levels, and unsus-tainably high levels of promised benefits (World Bank, 1994; Svejnar,1997). Similarly, the health-care systems were by and large fullypublicly funded and inefficient. Several countries have already carriedout major reforms of pensions and health care, but these reforms arepolitically unpopular.
Overall, the principal challenge facing the transition economies is howto reduce wasteful expenditures in order to create fiscal space for devel-opment spending (especially infrastructure), improving the quality andefficiency of public sector delivery, and increasing the formation ofhuman capital. Moreover, while some economies have already reducedtaxes, others still need to reduce tax burdens in order to enhance effi-ciency, competitiveness, and employment (World Bank, 2006).
Finally, given the fiscal pressure under which most of the transitioneconomies operate, it is interesting that they collected very littlerevenue (5 percent of GDP, on average) from privatization (Tanzi andTsiboures, 2000).
Privatization and creation of new firms
In the early 1990s, most transition economies rapidly privatized smallenterprises, restructured many large state-owned firms and theirmanagement, and allowed the creation of new private firms. However,in most countries, the majority of private assets were generated through
218 Jan Svejnar
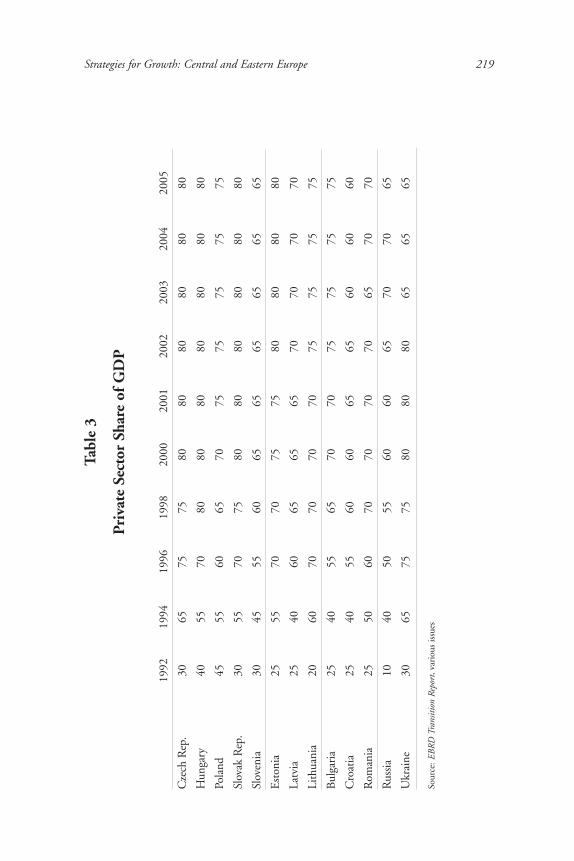
large-scale privatization, which differed in its method across countries.What is remarkable is how quickly most countries generated privateownership, irrespective of the particular privatization methods used. In1990, the private sector had perhaps 20 percent to 25 percent of GDPin Hungary and Poland, but typically only 5 percent to 10 percent ofGDP in other transition economies. But, as may be seen from Table 3,these figures increased quickly. As early as 1994, the private sector wasmore than 30 percent of GDP in all of the transition economies andrepresented half or more of GDP in many countries, including Russia.By 2000, the private sector share of GDP was equal to or more than 60percent in all of the transition economies, and in most of them, itconstituted 70 percent to 80 percent.
The effect of privatization on economic performance has not beeneasy to determine. A large number of early microeconometric studieshave found mixed effects, but many of these early studies suffer froma number of serious problems: small and unrepresentative samples offirms; misreported or mismeasured data; limited controls for othermajor shocks that occurred at the same time as privatization; a shortperiod of observations after privatization; and, above all, not control-ling adequately for selectivity bias. Selectivity bias is likely to be aparticularly serious problem since better-performing firms tend to beprivatized first (Gupta, Ham, and Svejnar, 2001). Thus, comparingthe postprivatization performance of privatized firms to the perform-ance of the remaining state-owned firms without controlling forselectivity bias, as many studies do, will erroneously attribute thesuperior performance of the privatized firms to privatization. Recentstudies suggest that in the first decade after privatization, relativeperformance improved considerably in firms privatized to foreignowners but not (or not much) in those privatized to domestic owners(for example, Hanousek, Kocenda, and Svejnar, 2005; Sabirianova,Svejnar, and Terrell, 2005). This provides sobering evidence becausethe general expectation was that there would be much improvementin the efficiency of firms as a result of privatization.
Strategies for Growth: Central and Eastern Europe 219
Tabl
e 3
Pri
vate
Sec
tor
Shar
e of
GD
P
1992
1994
1996
1998
2000
2001
2002
2003
2004
2005
Cze
ch R
ep.
3065
7575
8080
8080
8080
Hun
gary
4055
7080
8080
8080
8080
Pola
nd45
5560
6570
7575
7575
75
Slov
ak R
ep.
3055
7075
8080
8080
8080
Slov
enia
3045
5560
6565
6565
6565
Est
onia
2555
7070
7575
8080
8080
Latv
ia25
4060
6565
6570
7070
70
Lith
uani
a20
6070
7070
7075
7575
75
Bul
gari
a25
4055
6570
7075
7575
75
Cro
atia
2540
5560
6065
6560
6060
Rom
ania
2550
6070
7070
7065
7070
Rus
sia
1040
5055
6060
6570
7065
Ukr
aine
3065
7575
8080
8065
6565
Sour
ce: E
BR
D T
rans
ition
Rep
ort,
vari
ous
issu
es
220 Jan Svejnar
Domestic and foreign direct investment
The communist countries, like the East Asian tigers, were knownfor high rates of investment, often exceeding 30 percent of GDP. Theinvestment rates slowed down to about 30 percent in the 1980s in anumber of countries. They declined further to about 20 percent ofGDP in the 1990s in a number of transition economies (EBRD,1996), although countries such as the Czech and Slovak Republicsmaintained relatively high levels of investment. In the 2000s, invest-ment has been maintained at relatively high levels, ranging in mostcountries between 20 percent and 30 percent of GDP. The issue,outside of foreign-owned firms, has been the efficiency of investment.
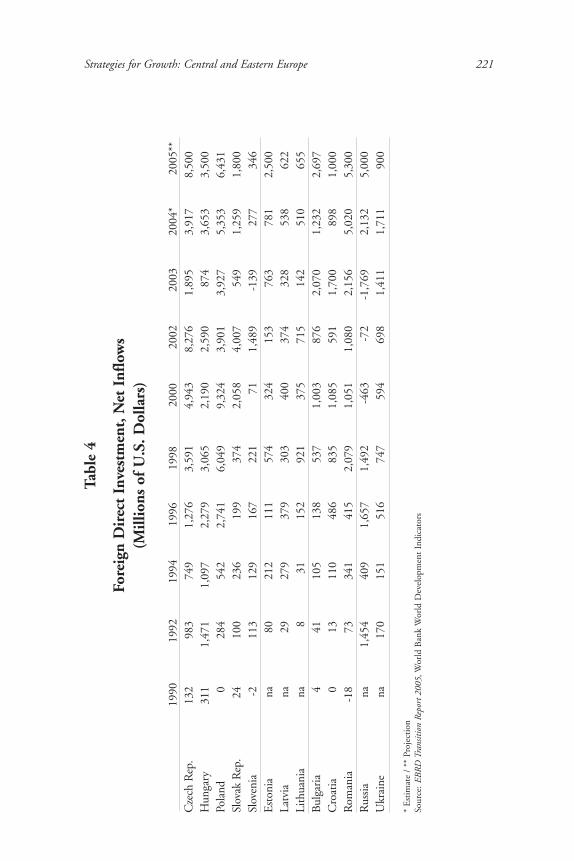
As Table 4 shows, in the early 1990s, Hungary was the only transi-tion economy receiving a significant flow of foreign direct investment(FDI) as a result of being the only country that was hospitable to andhad well-defined rules for FDI. But starting in the mid- to late 1990s,major foreign investments went to the Czech Republic, Poland,Slovakia, and the Baltic States. In the last few years, FDI inflows haveincreased dramatically throughout the transition economies, risingfrom $20 million to $30 million per year in 1998-2003 to $39million in 2004 and an estimated $48 million in 2005 (EBRD,2005). Estonia has been the largest recipient of FDI on a per capitabasis, but a number of other countries, including Azerbaijan, Croatia,the Czech Republic, Hungary, Kazakhstan, Latvia, and Slovakia, havebeen receiving considerable per capita inflows of FDI. Even Russiareversed capital inflows and has started receiving significant FDIinflows over the last three years.
The rate of FDI appears to increase with several factors: the prox-imity of the perceived date of accession of a given country to the EU;the desirability of the country’s political, economic, and legal environ-ment; and the availability of attractive privatization projects in thecountry. At the micro level, FDI is associated with both higher levelsand higher rates of improvement in efficiency of firms (Sabirianova,Svejnar, and Terrell, 2005).
Strategies for Growth: Central and Eastern Europe 221
Tabl
e 4
Fore
ign
Dir
ect
Inve
stm
ent,
Net
Inf
low
s (M
illio
ns o
f U
.S. D
olla
rs)
1990
1992
1994
1996
1998
2000
2002
2003
2004
*20
05**
Cze
ch R
ep.
132
983
749
1,27
63,
591
4,94
38,
276
1,89
53,
917
8,50
0H
unga
ry31
11,
471
1,09
72,
279
3,06
52,
190
2,59
087
43,
653
3,50
0Po
land
028
454
22,
741
6,04
99,
324
3,90
13,
927
5,35
36,
431
Slov
ak R
ep.
2410
023
619
937
42,
058
4,00
754
91,
259
1,80
0Sl
oven
ia-2
113
129
167
221
711,
489
-139
277
346
Est
onia
na80
212
111
574
324
153
763
781
2,50
0La
tvia
na29
279
379
303
400
374
328
538
622
Lith
uani
ana
831
152
921
375
715
142
510
655
Bul
gari
a4
4110
513
853
71,
003
876
2,07
01,
232
2,69
7C
roat
ia0
1311
048
683
51,
085
591
1,70
089
81,
000
Rom
ania
-18
7334
141
52,
079
1,05
11,
080
2,15
65,
020
5,30
0R
ussi
ana
1,45
440
91,
657
1,49
2-4
63-7
2-1
,769
2,13
25,
000
Ukr
aine
na17
015
151
674
759
469
81,
411
1,71
190
0
* E
stim
ate
/ **
Pro
ject
ion
Sour
ce: E
BR
D T
rans
ition
Rep
ort 2
005,
Wor
ld B
ank
Wor
ld D
evel
opm
ent
Indi
cato
rs
222 Jan Svejnar
Employment adjustment, wage setting, and unemployment
State-owned enterprises in all the transition economies absorbed theoutput decline by rapidly decreasing employment and/or real wages inthe early 1990s (Svejnar, 1999). In most transition economies, theemployment decline reached 15 percent to 30 percent in the 1990sand was followed by stagnation or only modest increases in employ-ment thereafter (Boeri and Terrell, 2001; World Bank, 2005). Whencombined with the GDP data in Chart 1, the employment datasuggest that restructuring in the transition economies involved aninitial decline in labor productivity as output fell faster than employ-ment and a subsequent rise in productivity as output grew andemployment stagnated. This development has become known as“jobless growth.”2
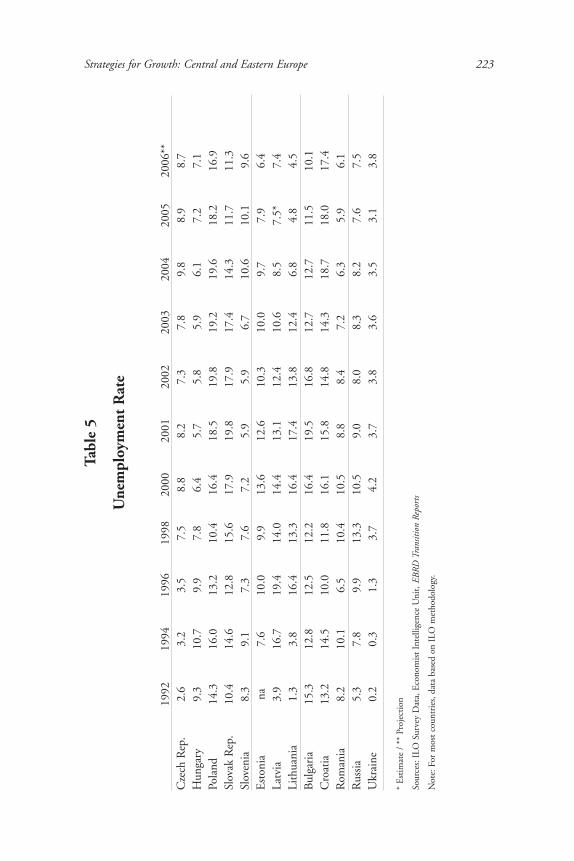
Unemployment was unknown before the transition, but it emergedrapidly and openly in the central European countries (except for theCzech Republic), and as both open and hidden unemployment in theBaltic countries and the CIS (Table 5). In particular, in the early tomid-1990s, the Czech Republic was a model of a transition labormarket, characterized by high inflows of workers into and outflows ofworkers out of unemployment. Unemployment, hence, represented ashort, transitory state between old and new jobs (Ham, Svejnar, andTerrell, 1998, 1999). Unemployment rose more slowly in the CISand the Baltic countries, as firms were slower to lay off workers andused wage declines and arrears as devices to hold on to workers.
Over time, the patterns of unemployment have shown considerabledifferentiation as well as gradual convergence. The Czech Republic,the CIS, and the Baltic countries experienced gradual increases inunemployment as their transition proceeded and, in the 2000s, mostcountries have had high unemployment rates that are at least as high,and often significantly exceed, those observed in the EU. It is notablethat two of the fastest growing economies, Poland and Slovakia, havecontinued to suffer from chronically high (15 percent to 20 percent)unemployment rates.
Strategies for Growth: Central and Eastern Europe 223
Tabl
e 5
Une
mpl
oym
ent
Rat
e
1992
1994
1996
1998
2000
2001
2002
2003
2004
2005
2006
**C
zech
Rep
.2.
63.
23.
57.
58.
88.
27.
37.
89.
88.
98.
7H
unga
ry9.
310
.79.
97.
86.
45.
75.
85.
96.
17.
27.
1Po
land
14.3
16.0
13.2
10.4
16.4
18.5
19.8
19.2
19.6
18.2
16.9
Slov
ak R
ep.
10.4
14.6
12.8
15.6
17.9
19.8
17.9
17.4
14.3
11.7
11.3
Slov
enia
8.3
9.1
7.3
7.6
7.2
5.9
5.9
6.7
10.6
10.1
9.6
Est
onia
na7.
610
.09.
913
.612
.610
.310
.09.
77.
96.
4La
tvia
3.9
16.7
19.4
14.0
14.4
13.1
12.4
10.6
8.5
7.5*
7.4
Lith
uani
a1.
33.
816
.413
.316
.417
.413
.812
.46.
84.
84.
5B
ulga
ria
15.3
12.8
12.5
12.2
16.4
19.5
16.8
12.7
12.7
11.5
10.1
Cro
atia
13.2
14.5
10.0
11.8
16.1
15.8
14.8
14.3
18.7
18.0
17.4
Rom
ania
8.2
10.1
6.5
10.4
10.5
8.8
8.4
7.2
6.3
5.9
6.1
Rus
sia
5.3
7.8
9.9
13.3
10.5
9.0
8.0
8.3
8.2
7.6
7.5
Ukr
aine
0.2
0.3
1.3
3.7
4.2
3.7
3.8
3.6
3.5
3.1
3.8
* E
stim
ate
/ **
Pro
ject
ion
Sour
ces:
ILO
Sur
vey
Dat
a, E
cono
mis
t In
telli
genc
e U
nit,
EBR
D T
rans
ition
Rep
orts
Not
e: F
or m
ost
coun
trie
s, d
ata
base
d on
ILO
met
hodo
logy
.
224 Jan Svejnar
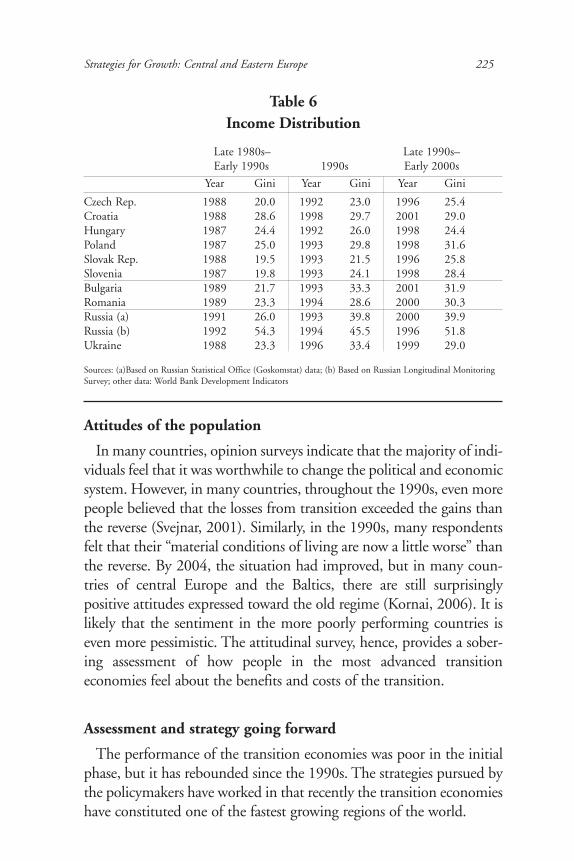
Data on income distribution, expressed in the form of Gini coeffi-cients, are summarized in Table 6.3 The communist countries hadhighly egalitarian income distributions, but inequality increased duringthe 1990s, with the Gini coefficient rising from 20 to 25 in the late1980s to 24 to 32 in central Europe, low 20s to low 30s in Bulgaria andRomania, 23 to 30 in Ukraine, and 26 to 40 in Russia. These coeffi-cients bring inequality in the transition economies into the rangespanned by capitalist economies and in line with developing countries,such as India. However, the Russian and Ukrainian data in Table 6 maywell understate the extent of inequality. In particular, the data from theRussian Statistical Office (Goskomstat) are based on wages that firmsare supposed to be paying to workers, but, until recently, many Russianfirms were not paying contractual wages (Desai and Idson, 2000).Inequality calculations based on survey data from the Russian Longi-tudinal Monitoring of households, for instance, suggest that incomeinequality in Russia has reached much higher levels—a Gini coeffi-cient of 52—resembling the level of inequality found in developingeconomies with the most inegalitarian distribution of income. Inter-estingly, the relatively egalitarian structure of income distribution incentral European countries has been brought about by their socialsafety nets, which rolled back inequality that would have beenbrought about by market forces alone (Garner and Terrell, 1998).The Russian social safety net has been regressive, making the distri-bution of income more unequal than it would have been without it(Commander, Tolstopiatenko, and Yemtsov, 1999).
The key finding is that inequality has increased during the transi-tion; the increase has been greater in the east and has depended onthe relative importance of changes in the distribution of wages,employment, entrepreneurial incomes, and social safety nets. Unlikein central Europe, in Russia, there has been a rapid rise in wageinequality, which, in turn, has had a strong effect on income inequal-ity dynamics. What seems to have been a dominant common driverof inequality in all the transition economies is wage decompression,resulting from the attenuation of the centralized wage setting and thehigh return to skills associated with globalization (Munich, Svejnar,and Terrell, 2005; Gupta and Yemtsov, 2005).
Strategies for Growth: Central and Eastern Europe 225
Attitudes of the population
In many countries, opinion surveys indicate that the majority of indi-viduals feel that it was worthwhile to change the political and economicsystem. However, in many countries, throughout the 1990s, even morepeople believed that the losses from transition exceeded the gains thanthe reverse (Svejnar, 2001). Similarly, in the 1990s, many respondentsfelt that their “material conditions of living are now a little worse” thanthe reverse. By 2004, the situation had improved, but in many coun-tries of central Europe and the Baltics, there are still surprisinglypositive attitudes expressed toward the old regime (Kornai, 2006). It islikely that the sentiment in the more poorly performing countries iseven more pessimistic. The attitudinal survey, hence, provides a sober-ing assessment of how people in the most advanced transitioneconomies feel about the benefits and costs of the transition.
Assessment and strategy going forward
The performance of the transition economies was poor in the initialphase, but it has rebounded since the 1990s. The strategies pursued bythe policymakers have worked in that recently the transition economieshave constituted one of the fastest growing regions of the world.
Table 6Income Distribution
Late 1980s– Late 1990s– Early 1990s 1990s Early 2000s
Year Gini Year Gini Year Gini
Czech Rep. 1988 20.0 1992 23.0 1996 25.4Croatia 1988 28.6 1998 29.7 2001 29.0Hungary 1987 24.4 1992 26.0 1998 24.4Poland 1987 25.0 1993 29.8 1998 31.6Slovak Rep. 1988 19.5 1993 21.5 1996 25.8Slovenia 1987 19.8 1993 24.1 1998 28.4Bulgaria 1989 21.7 1993 33.3 2001 31.9Romania 1989 23.3 1994 28.6 2000 30.3Russia (a) 1991 26.0 1993 39.8 2000 39.9Russia (b) 1992 54.3 1994 45.5 1996 51.8Ukraine 1988 23.3 1996 33.4 1999 29.0
Sources: (a)Based on Russian Statistical Office (Goskomstat) data; (b) Based on Russian Longitudinal MonitoringSurvey; other data: World Bank Development Indicators
226 Jan Svejnar
Geography has been an important factor, with the transition coun-tries farther east, on average, performing worse than their morewestern counterparts in the 1990s, but better in the 2000s. Interest-ingly, geography had little impact on whether the countries carried outType I reforms—macroeconomic stabilization; price liberalization;small-scale privatization; opening up to trade and gradually to capitalflows; reduction of subsidies to state-owned enterprises; elimination ofthe monobank system; removal of barriers to the creation of newfirms; and introduction of a social safety net—which all transitioneconomies carried out relatively fast. However, geography did affectthe nature and speed of Type II reforms: large-scale privatization; in-depth development of a commercial banking sector and effectivetax system; labor market regulations and institutions related to thesocial safety net; and establishment and enforcement of a market-oriented legal system and accompanying institutions. The reform ofgreatest importance seems to be the development of a functioninglegal framework and corporate governance of firms. Countries thatplaced emphasis on this reform early on, such as Hungary, Poland, andSlovenia, performed better in the 1990s than those that did not, suchas the Czech Republic, Russia, and Ukraine.
What does the experience imply for strategies going forward? Theoverview provided in this paper suggests that there are six importantelements for a successful strategy in the mid- to late 2000s.
1. Maintaining macroeconomic stability is a key element of successfor these countries. The central banks have succeeded to bring infla-tion under control and provide investors with an important sense ofstability. In this respect, maintaining a noninflationary environment isa key element of a successful strategy going forward. It is indispensa-ble for those aspiring to join the EU and adopt the euro. The challengeis how to accomplish stability while carrying out important fiscalreforms, especially in the areas of pensions and health (where existingprograms are expensive and unsustainable), and infrastructure, educa-tion, and research (where investment is needed for growth).
2. Retaining competitiveness and creating “good” jobs is a high-priority item for the transition economies. The record to date is one
Strategies for Growth: Central and Eastern Europe 227
of an initial drop in the employment rate, followed by “joblessgrowth,” which may be worse than growth of both output and jobs.But it signals major increases in productivity and is obviously muchbetter than “jobless stagnation” that is observed in a number of othercountries around the world. The challenge for many of the transitioneconomies is how to make their labor markets more flexible and lessburdened by payroll taxes. Using American-style layoff taxes togetherwith reduction in employment protection would be sensible, since itmakes employment protection financial rather than administrativeand provides compatible incentives to firms and workers. Combiningthis with a shift of taxes from payroll to another base would havebeneficial effects in discouraging layoffs and encouraging hires.
3. Maintaining or increasing FDI inflows and increasing the effi-ciency of domestic firms is an important priority. The transitioncountries have been increasingly attracting foreign investment, andforeign firms have created high-paying jobs and led these economiesin innovation and increases in efficiency. They appear to have hadpositive spillovers on local suppliers, though not on local competitors.In central Europe, the Baltic states, and increasingly the Balkan coun-tries, one observes a major improvement in the efficiency of theeconomy, with FDI being a key catalyst of the observed change. InRussia and the other CIS countries, one observes a boom driven by acombination of rising natural resource prices and real turnaround ofeconomic activity in industry and services. The latter phenomenon isrecent and still somewhat fragile. Ensuring that both foreign anddomestic producers become the engine of economic growth is animportant element of a successful strategy.
4. Improving the levels and effectiveness of human capital is animportant driver of future economic growth. The transitioneconomies historically have had high levels of education relative toother developing countries. Most have failed to invest adequately inhuman capital (and research and development) during the last twodecades, however, as fiscal pressures restricted government expendi-tures in this area. Yet, at least for the resource-poor economies,specializing in higher-value-added activities based on human capital isa sensible strategy to pursue in the future.
228 Jan Svejnar
5. Containing the discontent of the population with respect to thetransition reforms is crucial. Inequality, poverty, and uncertainty haverisen in virtually all the transition economies, resulting in considerablediscontent on the part of many citizens. The strategy going forwardneeds to contain and reduce these phenomena, while addressing thetradeoff between “inequality as a determinant of poverty” and “inequal-ity as a factor that provides incentives for effort and risk taking.”
6. Finally, maintaining liberal democracy and protecting humanrights needs to be taken as a prerequisite for future development ofthese countries. The transition economies have been carrying outeconomic reforms while striving to create democratic systems andprotect human rights. (China and Vietnam have pursued a differentmodel.) These aspects of the transition have been widely recognizedas being inherently important, despite the fact that they have occa-sionally made economic reforms difficult to implement. As such, theyneed to be part of future growth strategies.
Author’s note: The author benefited from many useful comments by the participants at the2006 Federal Reserve Bank of Kansas City Economic Symposium in Jackson, Wyo. He alsowould like to thank Tomislav Ladika and Brian McCauley for valuable research assistance.

Strategies for Growth: Central and Eastern Europe 229
Endnotes1The exception is the Czech Republic, which experienced a recession in the late
1990s and, on average, hence, achieved a somewhat lower rate of economic growth.
2With production shifting from large to small firms, the decline in employment(and output) may have been less pronounced than suggested by the official databecause small firms are harder to capture in official statistics.
3The Gini coefficient, which was invented by statistician Corado Gini, variesfrom 0 to 100, with 0 representing a perfectly egalitarian distribution of income(every individual or household receiving the same income) and 100 denoting themost inegalitarian distribution (one person or household receiving all income).
230 Jan Svejnar
References
Atkeson, A., and P.J. Kehoe. “Social Insurance and Transition,” InternationalEconomic Review, vol. 37, 1996, 377-402.
Basu, Swati, Saul Estrin, and Jan Svejnar. 1997. “Employment and wage behaviourof industrial enterprises in transition economies: The cases of Poland andCzechoslovakia,” Economics of Transition, 5(2), 271-187.
___________. 2000. “Employment and Wages in Enterprises under Communismand in Transition: Evidence from Central Europe and Russia,” The WilliamDavidson Institute Working Papers no. 114b (1995, revised 2000).
Bevan, Alan, Saul Estrin, and Mark Schaffer. “Determinants of Enterprise Perfor-mance during Transition” Centre for Economic Reform and Transformation(CERT) Working Paper 99/03, January 1999.
Bhaduri, A., K. Kaski, and F. Levcik. “Transition from the Command to theMarket System: What Went Wrong and What to do for Now?” mimeo, ViennaInstitute for Comparative Economic Studies, 1993.
Blanchard, Olivier J. The Economics of Post-Communist Transition, Oxford: Claren-don Press, 1997.
Blanchard, O., and M. Kremer. “Disorganization,” Quarterly Journal of Economics,1997, vol. 112(4), 1091-1126
Boeri, Tito. Structural Change, Welfare Systems and Labor Allocation, Oxford:Oxford University Press, 2000.
Brada, Josef C., Arthur E. King, and Ali M. Kutan. “Inflation bias and productiv-ity shocks in transition economies: The case of the Czech Republic,” EconomicSystems, 24(2), 2000, 119-138.
Bruno, Michael, and William Easterly. “Inflation Crises and Long-Run Growth,”NBER Working Paper no. 5209, 1995.
Calvo, Guilermo A., and Fabrizio Coricelli. “Capital Market Imperfections andOutput Response in Previously Centrally Planned Economies,” in G. Caprio, D.Folkerts-Landau, and T. Lane, eds. Building Sound Finance in Emerging MarketEconomies, Washington, D.C., IMF, 1992.
Commander, Simon, Andrei Tolstopiatenko, and Ruslan Yemtsov. “Channels ofredistribution: Inequality and poverty in the Russian transition,” Economics ofTransition, 7(1), 1999, 411-465.
Desai, Padma, and Todd Idson. Work without Wages: Russia’s Nonpayment Crisis,Cambridge, Mass.: MIT Press, 2000.
Strategies for Growth: Central and Eastern Europe 231
Djankov, Simeon, and Peter Murrell. “Enterprise Restructuring in Transition: AQuantitative Survey,” Working Paper, University of Maryland, College Park, Md.
EBRD. Transition Report, London: European Bank for Reconstruction and Devel-opment, 1996-2001.
Filer, Randall K., and Jan Hanousek. “Output changes and inflationary bias intransition,” Economic Systems, 24(3), 2000, 285-294.
Fischer, Stanley, Ratna Sahay, and Carlos Vegh. “Stabilization and Growth in Tran-sition Economies: The Early Experience,” Journal of Economic Perspectives, 10(2),45-66, Spring 1996.
Garner, Thesia, and Katherine Terrell. “A Gini Decompositon Analysis of Inequal-ity in the Czech and Slovak Republics during the Transition,” The Economics ofTransition, 1998, vol. 6, no. 1, 23-46.
Gelb, Alan. “The End of Transition?” Chapter 2 in Annette Brown, ed. When isTransition Over? Kalamazoo, Mich.: W.E. Upjohn Institute for EmploymentResearch, 1999.
Gomulka. “Obstacles to Recovery in Transition Economies,” in P. Aghion and N.Stern, eds. Obstacles to Enterprise Restructuring in Transition, 1994, EBRDWorking Paper no. 16.
Gregory, Paul, and Robert Stuart. Comparative Economic Systems, Boston:Houghton-Mifflin, 6th edition, 1997.
Gupta, Nandini, John Ham, and Jan Svejnar. “Priorities and Sequencing in Priva-tization: Theory and Evidence from the Czech Republic,” Working Paper no.323, The William Davidson Institute, May 2000 (revised September 2001).
Ham, John, Jan Svejnar, and Katherine Terrell. “Women’s Unemployment Duringthe Transition: Evidence from Czech and Slovak Micro Data,” Economics of Tran-sition, 1999, vol. 7, no. 1, 47-78.
___________. “Unemployment and the Social Safety Net During Transitions to aMarket Economy: Evidence from the Czech and Slovak Republics,” AmericanEconomic Review, December 1998, vol. 88, no. 5, pp. 1117-1142.
Hanousek, Jan, Evzen Kocenda, and Jan Svejnar. “Origin and Concentration:Corporate Ownership, Control and Performance,” Working Paper, 2005.
Jurajda, Stepan, and Katherine Terrell. “Optimal Speed of Transition: MicroEvidence from the Czech Republic and Estonia,” Working Paper no. 355,William Davidson Institute, Revised 2001.
232 Jan Svejnar
Kornai, Janos. “Reforming the Welfare State in Postsocialist Economies,” Chapter6 in Annette Brown, ed. When is Transition Over? Kalamazoo, Mich.: W.E.Upjohn Institute for Employment Research, 1999.
Li, Wei. “A Tale of Two Reforms,” RAND Journal of Economics, vol. 30 (1) 1999, 120-136.
Lizal, Lubomir, Miroslav Singer, and Jan Svejnar. “Enterprise Break-ups and Perfor-mance During the Transition from Plan to Market,” The Review of Economicsand Statistics, 2001, vol. 83 (1) 92-99.
Lizal, Lubomir, and Jan Svejnar. “Investment, Credit Rationing and the SoftBudget Constraint: Evidence from Czech Panel Data, The Review of Economicsand Statistics, 2002.
Megginson, William, and Jeffrey Netter. “From State to Market: A Survey ofEmpirical Studies on Privatization,” Journal of Economic Literature, vol. 39, no. 2, June 2001.
Roland, Gerard, and T. Verdier. “Transition and the Output Fall,” Economics ofTransition, 1999, vol. 7 (1), pp.1-28.
Rosati, Dariusz. “Output Decline During Transition from Plan to Market,”Economics of Transition, 1994, vol. 2 (4) 419-442.
Sabirianova, Klara. “The Great Human Capital Reallocation: An Empirical Analy-sis of Occupational Mobility in Transitional Russia,” Working Paper no. 309,The William Davidson Institute, October 2000.
Sabirianova, Klara, Jan Svejnar, and Katherine Terrell. “Foreign Investment, Corpo-rate Ownership, and Development: Are Firms in Emerging Markets CatchingUp to the World Standard?” Working Paper, 2005.
Sachs, Jeffrey, Clifford Zinnes, and Yair Eilat. “The Gains from Privatization inTransition Economies: Is Change of Ownership Enough?” CAER II DiscussionPaper 63, Harvard Institute for International Development, Cambridge, Mass.
Shirley, Mary, and Patrick Walsh. “Public versus Private Ownership: The CurrentState of the Debate,” The World Bank, Washington, D.C., 2000.
Svejnar, Jan. “Pensions in the Former Soviet Bloc: Problems and Solutions,” inCouncil on Foreign Relations, The Coming Global Pension Crisis, New York, 1977.
___________. “Labor Markets in the Transitional Central and East EuropeanEconomies,” Chapter 42 in Orley Ashenfelter and David Card, eds. Handbookof Labor Economics, North Holland, vol. 3B, 1999.
Tanzi, Vito, and George Tsiboures. “Fiscal Reform over Ten Years of Transition,”IMF Working Paper WP/00/113, 2000.

Strategies for Growth: Central and Eastern Europe 233
World Bank. Averting the Old Age Crisis, New York: Oxford University Press, 1994.
___________. Current Issues in Fiscal Reform in Central Europe and the Baltic States,Warsaw, Poland: Studio 44 Publishing House, 2006.