Embed Size (px)
Citation preview

Strategies for HPLC Method Development and Validation for Pharmaceutical Products containing several Active Ingredients, Brett Miles1, Philippe Toret1, Tyrone Spiva1, Kathie Schlipp2, Dr. Ann O’Neil1, Dr. Dean Shirazi2 and Dr. Pierre L. Boulas1 1 AAI Development Services, a division of aai Pharma, 2320 Scientific Park Drive, Wilmington, NC 28412 2aaiPharma, 2320 Scientific Park Drive, Wilmington, NC 28412

INTRODUCTION Pharmaceutical products formulated with more than one drug, typically referred to as combination products1, are intended to meet previously unmet patients need by combining the therapeutic effects of two or more drugs in one product. These combination products can present daunting challenges to the analytical chemist responsible for the development and validation of analytical methods. This presentation will discuss various strategies for the development and validation of HPLC methods with UV detection for drug products containing more than one active ingredient. 1As defined in 21 CFR § 3.2(e), the term combination product includes: “A product comprised of two or more regulated components, i.e. drug / device, biologic / device, drug / biologic, or drug / device / biologic, that are physically, chemically, or otherwise combined or mixed as a single entity.” (Reference: http://www.fda.gov/oc/combination/definition.html).

OBJECTIVES • Present typical challenges encountered while developing and
validating methods for pharmaceutical products containing more than one active ingredient.
• Provide the analytical chemist with a list of key points to consider
while developing and validating analytical methods for pharmaceutical products that contain more than one active ingredient.
• Provide rationale for the proposed strategies using selected
monographs listed in the current United States Pharmacopeia for combination products.

REVIEW OF USP 26 MONOGRAPHS FOR SELECTED PRODUCTS CONTAINING MULTIPLE ACTIVES The monographs for combination products containing Acetaminophen, Caffeine and other actives were reviewed. The main focus of the review was to determine how the USP addresses the assay of several actives and their related substances within the same product. The results are summarized in Tables 1 and 2. The conclusions from this review were:
1. USP monographs for product containing more than one active may require the use of one or several methods.
2. The use of more than one method is necessary when the two actives have
markedly different chemical properties.
3. The USP monographs typically do not provide methods for the analysis of the different related substances from each active.

TABLE 1: REVIEW OF SELECTED USP MONOGRAPHS FOR COMBINATION PRODUCTS CONTAINING ACETAMINOPHEN YES= One Method for all Actives; NO= Several Methods for all Actives
Actives1: Acetaminophen and … Assay Dissolution Impurity Ref.2 Aspirin YES YES YES3 19Caffeine YES YES N/A4 21Aspirin, Caffeine YES YES YES3 20Chlorpheniramine, Dextromethorphan Phenylpropanolamine
NO NO N/A 22
Codeine NO NO N/A 34Dextromethorphan, Doxylamine Pseudoephedrine
NO NO N/A 36
Diphenhydramine NO NO N/A 37Pseudoephedrine YES YES N/A 39
1 All products contain Acetaminophen and the actives listed below 2 USP 26 page number 3 Salicylic Acid is the only related substance listed in the monograph 4 N/A: no impurity listed in the monograph

TABLE 2: REVIEW OF SELECTED USP MONOGRAPHS FOR COMBINATION PRODUCTS CONTAINING CAFFEINE YES= One Method for all Actives; NO= Several Methods for all Actives
Actives1: Caffeine and … Assay Dissolution Impurity Ref.2 Acetaminophen YES YES N/A5 21Aspirin, Acetaminophen YES YES YES3 20Aspirin, Butalbital YES4 NO YES3 289Aspirin, Propoxyphene NO NO YES3 1571Aspirin, Butalbital, Codeine YES4 NO YES3 291
1 All products contain Caffeine and the actives listed below 2 USP 26 page number 3 Salicylic Acid is the only related substance listed in the monograph 4 One set of chromatographic conditions for all actives but two different wavelengths of detection 5 N/A: no impurity listed in the monograph
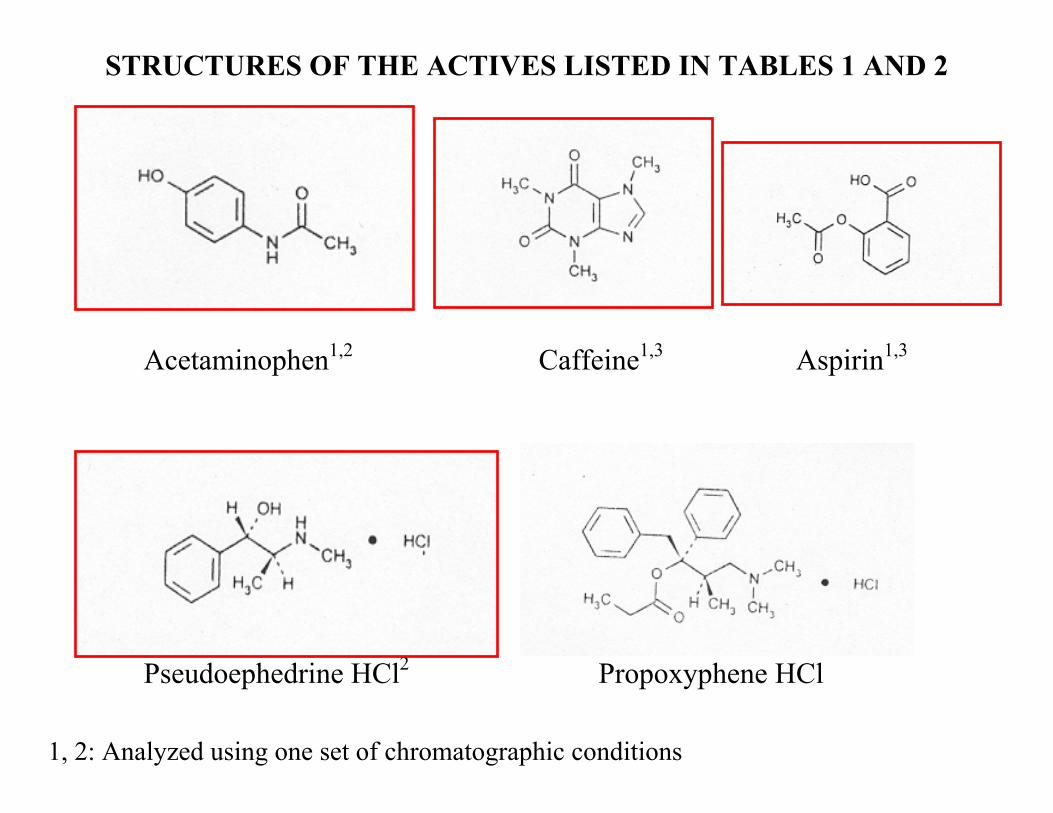
STRUCTURES OF THE ACTIVES LISTED IN TABLES 1 AND 2
Acetaminophen1,2 Caffeine1,3 Aspirin1,3
Pseudoephedrine HCl2 Propoxyphene HCl
1, 2: Analyzed using one set of chromatographic conditions

STRUCTURES OF THE ACTIVES LISTED IN TABLES 1 AND 2
Phenylpropanolamine HCl Dextromethorphan Butalbital3
Codeine3 Chlorpheniramine Maleate Diphenydramine HCl 3: Analyzed using one set of chromatographic conditions

CASE STUDY #1: COMBINATION PRODUCT CONTAINING TWO ACTIVES Product containing two actives, Actives A and B. Both actives are small molecules with well-characterized chemistry and chromatographic properties. Active A degrades mainly in Deg. A1 and Deg. A2. Active B degrades mainly in Deg. B1 and Deg. B2. Both actives have different polarities / functional groups:
- Active A: secondary amine and hydroxyphenyl group (most polar) - Active B: tertiary amine, ester and phenyl groups (least polar)
Both actives have different UV spectra (See Figures 1 and 2).

UV SPECTRA OF ACTIVE A AND ACTIVE B
nm220 240 260 280 300 320 340 360 380
Norm.
0
100
200
300
400
500
280 nm (shoulder)
245 nm
n m2 2 0 2 4 0 2 6 0 2 8 0 3 0 0 3 2 0 3 4 0 3 6 0 3 8 0
R n o r m
0
2 0
4 0
6 0
8 0
1 0 0
~260 nm (broad band)
217 nm
Active A Active B Figure 1 Figure 2

CONTENT UNIFORMITY ASSAY Both Actives Analyzed in the Same Run
HPLC Conditions
mV
0.00
50.00
100.00
150.00
200.00
250.00
300.00
350.00
400.00
450.00
500.00
550.00
600.00
650.00
700.00
Minutes0.00 2.00 4.00 6.00 8.00 10.00 12.00 14.00 16.00 18.00 20.00 22.00
Wavelength Switch
Active B
Active A
Detection: Time (min) Wavelength
0 28012 217
MOBILE PHASE A [Phosphate Buffer: Acetonitrile (95:5)] MOBILE PHASE B [Phosphate Buffer: Acetonitrile (40:60)] Gradient: Time (min) %MP A %MP B
0 90 108 90 10
8.5 5 9514 5 95
14.5 90 1020 90 10
C18 column (4.6 mm x 150 mm) Flow rate: 1 mL/min
Figure 3

ASSAY OF RELATED SUBSTANCES – ACTIVE A
Two Different Methods used for Active A and B
Minutes0.0 2.0 4.0 6.0 8.0 10.0 12.0 14.0 16.0 18.0 20.0
Active B
Deg. A2
Deg. A1
Active AHPLC Conditions MOBILE PHASE A [Phosphate Buffer: Acetonitrile (95:5)] MOBILE PHASE B [Phosphate Buffer: Acetonitrile (40:60)] Gradient: Time (min) %MP A %MP B
0 90 108 90 10
8.5 5 9514 5 95
14.5 90 1020 90 10
C18 column (4.6 mm x 150 mm) Detection: UV at 245 nm Flow rate: 1 mL/min
Figure 4
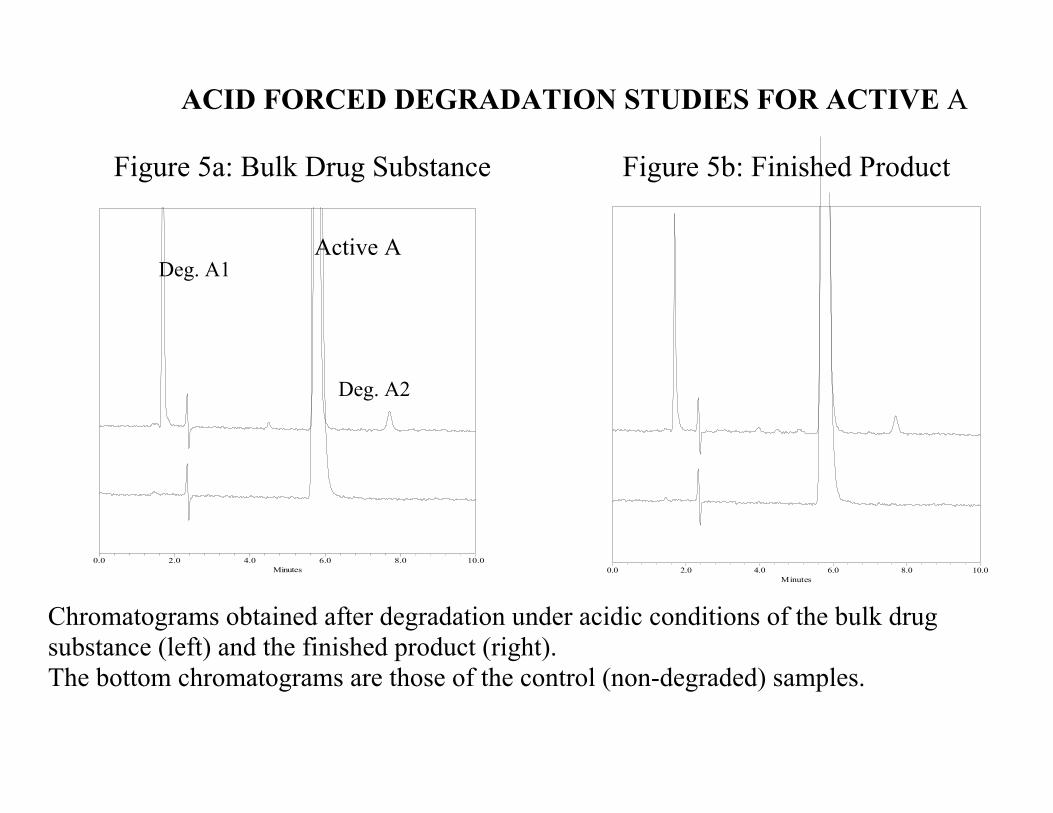
ACID FORCED DEGRADATION STUDIES FOR ACTIVE A
Figure 5a: Bulk Drug Substance Figure 5b: Finished Product
Minutes0.0 2.0 4.0 6.0 8.0 10.0
Active ADeg. A1
Deg. A2
Chromatograms obtained after degradation under acsubstance (left) and the finished product (right). The bottom chromatograms are those of the control
Minutes0.0 2.0 4.0 6.0 8.0 10.0
idic conditions of the bulk drug
(non-degraded) samples.
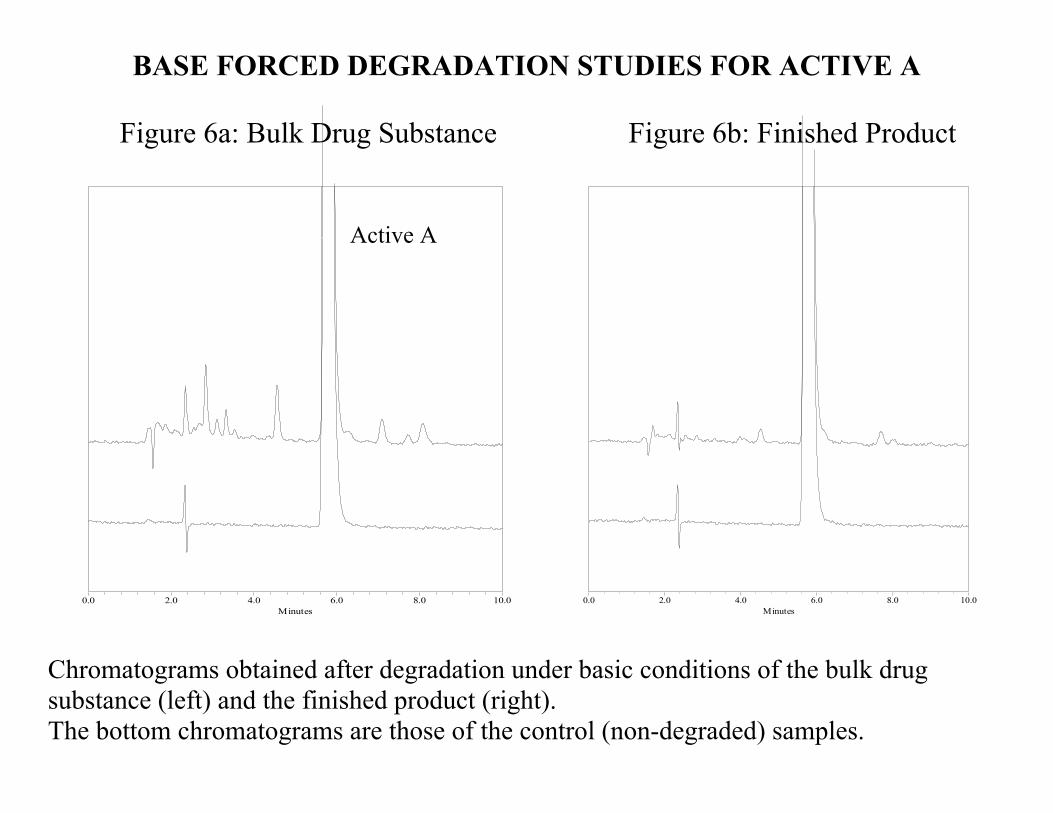
BASE FORCED DEGRADATION STUDIES FOR ACTIVE A Figure 6a: Bulk Drug Substance Figure 6b: Finished Product
Minutes0.0 2.0 4.0 6.0 8.0 10.0
Active A
0.0
Chromatograms obtained after degradation under bassubstance (left) and the finished product (right). The bottom chromatograms are those of the control (
Minutes2.0 4.0 6.0 8.0 10.0
ic conditions of the bulk drug
non-degraded) samples.

KEY POINTS FROM CASE STUDY#1: PRODUCT CONTAINING TWO ACTIVES • One method was developed and validated for content uniformity testing. A wavelength switch was necessary because of the difference in the UV absorption profiles of the two actives. The same approach was selected and validated for dissolution testing (See Figures 1-3). • Two methods were developed and validated for the assay of related substances from each active because of the difference in the UV responses and the difference in polarity between the two actives (See Figure 4). • Validation of the methods for the assay of related substances for the two actives were performed as per current ICH guidelines. Special emphasis was placed on forced degradation studies to identify which related substance is coming from each active (See Figures 5-6).

CASE STUDY #2: COMBINATION PRODUCT CONTAINING THREE ACTIVES Product containing three actives, Actives C, D and E. All actives are small molecules with well-characterized chemistry and chromatographic properties. Actives C and E are stable in aqueous solution but active D is not. Active C has no known degradation product. Active D degrades mainly into one degradation product, Deg. D1. Active E degrades mainly into two degradation products Deg. E1 and E2. All actives have different polarities / functional groups (Active C is most polar and Active E is least polar). All actives have different UV spectra (See Figure 7-9).

UV SPECTRA FOR ACTIVES C, D AND E nm220 240 260 280 300 320 340
Anorm
0
20
40
60
80
nm220 240 260 280 300 320 340
Anorm
0
20
40
60
80
Figure 7: Active C Figure 8: Active D
Wavelength Selected for analysis of related susbtances for all actives: 217 nm
Figure 9: Active E
n m2 2 0 2 4 0 2 6 0 2 8 0 3 0 0 3 2 0 3 4 0 3 6 0 3 8 0
R n o r m
0
2 0
4 0
6 0
8 0
1 0 0

SELECTED HPLC CONDITIONS FOR THE ASSAY OF RELATED SUBSTANCES
HPLC Conditions MOBILE PHASE A [50 mM Phosphate buffer: ACN (95:5)]
mV
100.00
200.00
300.00
400.00
500.00
600.00
700.00
800.00
900.00
1000.00
Minutes0.00 2.00 4.00 6.00 8.00 10.00 12.00 14.00 16.00 18.00 20.00 22.00 24.00
Active E
Active DActive C
MOBILE PHASE B [50 mM Phosphate buffer: ACN (35:65)] Gradient: Time (min) %A %B 0 93 7 12 33 6714 9 9119 9 9119.1 93 725 93 7
C8 Column (4.6 x 150 mm) Detection at 217 nm Flow Rate: Time (min) mL/min0 1.0 19.1 2.023 2.025 1.0
Figure 10

EXAMPLE CHROMATOGRAMS FOR THE ASSAY OF RELATED SUBSTANCES
mV
50.00
55.00
60.00
65.00
70.00
75.00
80.00
85.00
90.00
95.00
100.00
105.00
Minutes0.00 2.00 4.00 6.00 8.00 10.00 12.00 14.00 16.00 18.00 20.00 22.00 24.00
Deg. E2
Deg. E1
Deg. D1
Act
ive
D
Act
ive
E
Act
ive
C
Figure 11

SAMPLE SOLUTION STABILITY DAY 0 TO DAY 3
mV
100.00
200.00
300.00
400.00
500.00
600.00
700.00
800.00
900.00
1000.00
Minutes0.00 2.00 4.00 6.00 8.00 10.00 12.00 14.00 16.00 18.00 20.00 22.00 24.00
Day 1
Day 3
Day 0
Active E
Active DActive C
Deg. D1
Figure 12 Active D is degrading in the sample diluent (phosphate buffer:acetonitrile (95:5)) overtime and Deg. D1 is generated.
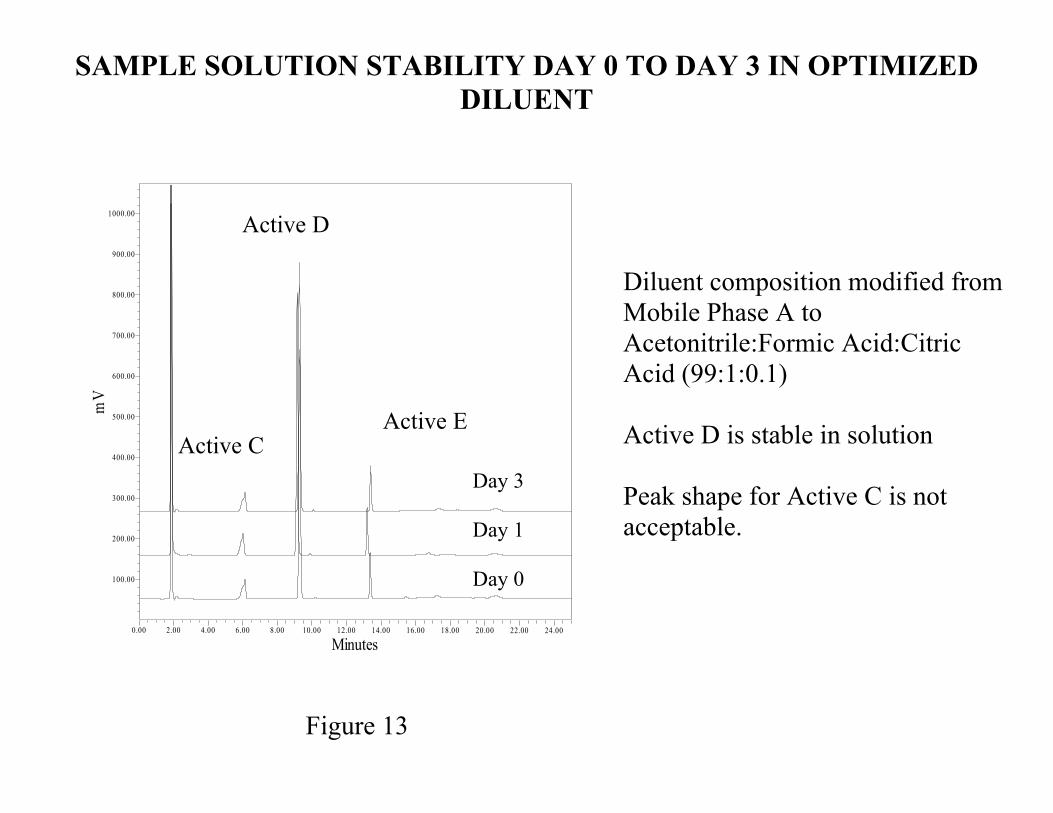
SAMPLE SOLUTION STABILITY DAY 0 TO DAY 3 IN OPTIMIZED DILUENT
mV
100.00
200.00
300.00
400.00
500.00
600.00
700.00
800.00
900.00
1000.00
Minutes0.00 2.00 4.00 6.00 8.00 10.00 12.00 14.00 16.00 18.00 20.00 22.00 24.00
Day 1
Day 3
Day 0
Active E
Active D
Active C
Diluent composition modified from Mobile Phase A to Acetonitrile:Formic Acid:Citric Acid (99:1:0.1) Active D is stable in solution Peak shape for Active C is not acceptable.
Figure 13

KEY POINTS FROM CASE STUDY#2: PRODUCT CONTAINING THREE ACTIVES • One set of chromatographic conditions was developed and validated for the assay of all three actives and their related substances (See Figures 10-11). • Different diluents were required for the assay of the related substances because of instability of Active D (See Figure 12) and poor chromatography for Active C (See Figure 13). • Different sample solution concentrations were required for assay of related substances because of the differences in responses at the wavelength of detection for all three actives. • Validation was performed as per ICH guidelines. Special emphasis was placed on forced degradation studies to identify which related substance is coming from which active. Linearity was also carefully evaluated for each active as a single wavelength of detection was selected for all three actives.
CONCLUSION SPECIFIC CHALLENGES FOR PHARMACEUTICAL PRODUCTS CONTAINING MORE THAN ONE ACTIVE INGREDIENT • If one method for all active is being developed, the diversity in the
chromatographic properties between the different actives will most likely require the use of a gradient method.
• If one method is being developed, different wavelengths may be used for
each active and their related substances (wavelength switch during the chromatographic run).
• If one wavelength is used for all actives and their related substances, the
sensitivity and linearity of the method for each active must be carefully evaluated.
• Special attention must be brought to forced degradation studies to clearly
identify which degradation product is coming from which actives. This will ensure a more accurate determination of the related substances.

CONCLUSION KEY POINTS TO CONSIDER DURING THE DEVELOPMENT AND VALIDATION OF ANALYTICAL METHODS FOR THE ANALYSIS OF PHARMACEUTICAL PRODUCTS CONTAINING MORE THAN ONE ACTIVE INGREDIENT
1. Evaluate the similarities / differences between the chemical properties of all the actives. Focus on the following: chemical structures, chromatographic properties, UV absorption spectra.
2. Evaluate the intended use of the data:
a. For exploratory programs of new formulation: multiple methods may be preferred (shortest development timeline)
b. For full development program: a single method is highly recommended (significant time saving during QC work)
3. Evaluate the intended use of the method: content uniformity and dissolution assays
are the best candidates for development of a single method for products containing multiple actives; justifying the suitability of a single related substance assay will require that historical data on each active is available and thoroughly evaluated.


![2 4 Method Validation HPLC Case Study Auto Saved]](https://img.pdfslide.net/doc/110x75/5571fe5349795991699b2635/2-4-method-validation-hplc-case-study-auto-saved.jpg)