Embed Size (px)
Citation preview
Mishra, S. 1
Strategies for Maintaining State of Good Repair for Mixed Transit Fleet
By
Sabyasachee Mishra, Ph.D., P.E.
Assistant Professor
Department of Civil Engineering
University of Memphis
3815 Central Avenue, Memphis, TN 38152
Phone: (901) 678-5043
Email: [email protected]
Word Count:
Number of Tables: 6
Number of Figures: 2
Total Count: = 5,383 + (8x250) = 7,383
Date Submitted: August 1, 2013
Submitted for Presentation at the 2014 Transportation Research Board Annual Meeting and Publication
Consideration in Transportation Research Record
Mishra, S. 2
ABSTRACT
Maintaining state of good repair is one of the imperative goals of Moving Ahead for Progress in the 21st
Century (MAP-21) vision of U.S Department of Transportation (USDOT). The aging transit fleet if not
adequately preserved may have adverse effect on public transportation. Many state DOTs and local
agencies are concerned about the escalating costs of new buses and lack of funds to keep up with the
replacement needs of the aging fleet. Lack of adequate resource allocation mechanism creates challenges
for agencies to determine whether to purchase or rehabilitate/rebuild existing buses in an era of
constrained budgets. This paper presents a novel approach that maximizes the total remaining life of
buses at the state level consisting of many transit agencies with varying bus types. A branch and bound
integer programing is proposed to optimize total remaining life of buses subjected to policy, budget and
other constraints. Two scenarios are presented as options to assist transit agencies to assess better
strategies. The first scenario analyzes improvement options applicable to buses with zero years of
remaining life. The second scenario is mileage based improvement which allows for buses to be eligible
for improvement after they reach a certain mileage. The proposed model is applied for transit agencies in
the state of Michigan. The results show that mileage based improvement produces better outcomes than
replacement when buses reach service life of zero years. The proposed approach is generalized for use by
any transit agency to efficiently allocate resources and preserve the aging transit fleet.
INTRODUCTION
In an effort to implement goals set by Moving Ahead for Progress in the 21st Century (MAP-21), transit
agencies are required to measure the condition of their assets, and set targets for improvement as a
benchmark of advancement. One of the critical assets of public transportation agencies is transit buses. In
constrained budget conditions transit agencies are facing challenges in maintaining the bus system in a
state of good repair (SGR) (1). MAP-21 defines SGR as ―a state that results from application of
transportation asset management concepts in which a transit agency maintains its physical assets
according to a policy that minimizes asset life-cycle costs while avoiding negative impacts to transit
service‖ (2). The goal of improved transit asset management is to preserve and maintain the bus system in
a good condition through strategic approach for assessing needs and prioritizing investments to sustain a
SGR.
Fleet management programs in a state Department of Transportation (DOT) in the United States
(U.S) are designed to ensure that the buses are kept in productive operation for a minimum normal service
life (MNSL). MNSL is defined as the number of years or miles of service that the vehicle must provide
before it ―qualifies‖ for federal funds for replacement. Each agency, at any given time, has fleet of
varying spans of remaining life (RL), where RL is the difference between the MNSL and vehicle age,
expressed either as the number of years, or number of miles (kilometers). A bus that completes its service
life should ideally be replaced. However, lack of capital funds often prevents states from procuring new
buses for their constituent agencies. While the state DOT’s may not have enough capital funds to procure
new buses for its constituent agencies, it may be possible for them to allocate capital funds partly for the
purchase of new buses, and partly for rebuilding of existing buses, and to distribute the funds among
transit agencies in an equitable manner. The question of resource allocation becomes:
Mishra, S. 3
“When a state has limited budget, how to allocate funds to constituent agencies to maintain
SGR when each agency have variety of buses (by age and size) and how to decide whether to
replace, rehabilitate or to rebuild the existing bus with service life of zero years”
Considering the statewide transit fleet as a major public investment, resolving the question of
allocation and distribution of funds for new buses and rebuilding of existing buses would require the
development of an asset management strategy. Unfortunately, very little research is reported in the
literature on management strategies to allocate scarce resources to meet the fleet requirements by a
combination of new and rebuilt buses. The problem addressed in this paper relates to the question of
allocation of resources among transit agencies for fleet management purposes when each agency carries
buses with varying MNSL. Specifically the problem can be stated as follows.
“How to best allocate resources to transit agencies carrying buses with varying MNSL in a
state so that the remaining life can be maximum while maintaining same number of fleet in a
planning period subjected to budget and other policy constraints”
Transit agencies generally carry three types of buses with more than 20 passenger capacity: medium
buses (MNSL 7 years), medium-heavy buses (MNSL 10 years), and large-heavy buses (MNSL 12 years).
Buses with higher MNSL involve larger capital cost. Improvements given to the buses when they reach
MNSL are different for each bus type. The problem defined is of four dimensions in nature: (1) each state
has number of transit agencies, (2) each transit agencies have variety of bus types with each bus has a
remaining life associated with it, (3) based on the type of bus and remaining life, different improvement
options can be chosen when a fleet reaches MNSL of zero years (4) the budget available for each year to
be distributed to each agency and further to be used for a particular bus. The challenge is to track each
and every individual bus through the planning period and obtain the type of improvement needed when a
bus of specific size reaches MNSL of zero years. Another question remains as do agencies need to wait
till the bus reach service life of zero years or it will be helpful to allow the bus to become eligible for
improvement before it reaches zero year of service life. While transit resource allocation is a challenging
task, this paper attempts to analyze the aforementioned questions using optimization. The paper is
organized as follows. In the next section literature review is presented followed by methodology and
model formulation. The data section describes fleet composition, budget and policies, used for fleet
management. The result section describes findings from the proposed approach. The summary and
conclusions are presented in the final section.
LITERATURE REVIEW
Literature review section is organized into three areas: (i) transit fleet improvement options, (ii)
quantitative measures for fleet management, (iii) modeling approaches in resource allocation. The review
is not intended to be exhaustive, but to highlight some of the general trends in addressing the allocation
problem.
Transit Fleet Improvement Options
Transit improvement options drew significant attention in the 1980s, and received renewed research
interest in the late 1990s. A number of studies found replacement, rehabilitation, and remanufacturing are
the preferred options (3–5). The studies mentioned above stressed the importance of proper preventive
maintenance as a primary factor contributing to the success of rehabilitation programs. These studies
emphasized that rehabilitation, ―if properly done,‖ can be a successful strategy, clearly referring to the
Mishra, S. 4
quality of maintenance and steps taken by the agency to prevent major breakdowns in machine
components or bus body infrastructure. For the purpose of this paper, the following terms are adapted
from the literature.
i. Replacement (REPL): Process of retiring an existing vehicle and procuring a completely new
vehicle. Vehicles replaced using federal dollars must have completed their MNSL requirements.
ii. Rehabilitation (REHAB): Process by which an existing vehicle is rebuilt to the original
manufacturer’s specification, with primary focus on the vehicle interior and mechanical system.
iii. Remanufacturing (REBUILD): Process by which the structural integrity of the vehicle is restored
to original design standards. This includes remanufacturing the body, the chassis, the drive train,
and the vehicle interior and mechanical system.
Quantitative Measures for Fleet Management
Service life maximization is the most commonly adopted measure of effectiveness (MOE) for the
resource allocation in conjunction with budgetary constraints. Some prominent bus maintenance
management studies include: bus maintenance programs for cost-effective reliable transit service (6, 7), a
generalized framework for transit bus maintenance operation (8), manpower allocation for transit bus
maintenance program (9), framework for evaluating a transit agency's maintenance program (10), a
simulation model for comparing a bus maintenance system's performance under various repair policies
(11), and performance indicators for maintenance management (12). These problems primarily cater to an
operator, who is concerned with the day to day maintenance for an efficient fleet operation.
Modeling Approaches in Resource Allocation
Similar to the diverse objectives and requirements of the allocation problem, the modeling and solution
approaches also vary. However, the most common modeling approach is optimization, with linear
programming as the most popular tool because of its faster convergence feature (13, 14). Non-linear
programming can be used to model different systems realistically. However, convergence to unique
solution is computationally intensive (15, 16). Some of these problems require complex non-convex
formulation; and Branch and Bound Algorithm (BBA) has been used to solve specifically large scale
allocation problems. Examples include forecasting of energy consumption in multi-facility locations (17),
generating signal timing plans to maximize bandwidth for traffic networks (18), a single-track train
timetabling problem to minimize the total train travel time (19), and journey planning procedures for
multi modal passenger transport services (20), and optimum allocation of resources for replacement and
rehabilitation of transit fleet (21, 22).
METHODOLOGY
In the methodology section we propose mathematical formulation of the optimization model, the
objective function, and associated constraints. A quality measure can be considered as the remaining life
of the fleet system. An agency’s objective is to maximize the quality measure. Recent studies attempted to
improve upon the original model by suggesting both structural and methodological changes (21, 22).
Mishra, S. 5
These studies attempted to maximize the quality of the bus fleet by optimizing different surrogates of
Remaining Life (RL)1. In this context, Mean Remaining Life (MRL) for one agency can be defined as:
∑
∑
(1)
where, is the number of buses for an agency i with remaining life of j years for bus type (e.g.
medium, medium-heavy, and large-heavy) on mth planning year;
is the remaining life of j years for
bus type for an agency i on mth planning year for a corresponding bus; i is the agency, j is the remaining
life, is the bus type, and m is the planning year in consideration. In a state, the total mean remaining life
(TMRL) is obtained by sum of MRL across all agencies (i)
∑∑
∑
(2)
States often plan for preserving fleet for a planning period. Total System Mean Remaining Life (TSMRL)
for a planning period is given by:
∑∑∑
∑
(3)
Where, m refers to the number of years in a planning period. Both TMRL and TSMRL can be
looked upon as surrogates of the quality of the fleet and need to be maximized. The following subsections
present the objective function and constraints used to analyze the transit fleet management to obtain SGR.
Objective Function
The objective function (4) represents the sum total of the mean remaining life of the mixed fleet of all the
constituent agencies for the whole planning period, designated as TSMRL or Z(x). The decision variable
is defined in equation (5) with the help of an auxiliary variable
.
∑ ∑∑
∑
(4)
{
{ }
(5)
This definitional constraint ensures that the life of the buses is improved by either
years. and represents two types of REHAB options, represents REBUILD options, and
represents REPL option; represents a specific bus type.
1RL can be defined as the difference between the minimum normal service life (MNSL) and the age of the bus. The
MNSL of a medium-sized bus, the subject matter of this study is taken as seven years per guidelines of the U. S.
Department of Transportation.
Mishra, S. 6
Constraint: Budget
The equations (6) and (7) represent the budget constraints for the planning period. The former (6)
represents a fixed total budget (B) that cannot be exceeded in the planning period. Equation (7) states that
total budget is the sum of annual budgets ( ) for each year. It is assumed that the planner has flexibility
of borrowing funds from the future years without exceeding the total budget for the planning period.
∑ ∑ ∑
(6)
∑
(7)
Constraint: Eligibility for Improvement
Eligibility of improvement is suggested in two ways. The equation (8) ensures that all the buses that have
completed their Minimum Normal Service Life (MNSL) requirements will be eligible for improvement as
per Federal Transit Administration (FTA) standards. MNSL can be defined as the number of years or
miles of service that the vehicle must provide before it ―qualifies‖ for federal funds for rehabilitation,
remanufacturing and replacement. However agencies also prefer mileage based improvement. The
advantage of mileage based continual improvement is that buses do need to wait for MNSL of zero years
rather are eligible for improvement when they reach a certain threshold of mileage as shown in equation
(9).
∑
(8)
∑
(9)
Constraint: Restriction for Multiple Rehabilitation
Equation (10) represents policy constraints which ensure that the buses that have been rehabilitated twice
or remanufactured once will be replaced. The two terms in this constraint are defined in equations (11)
and (11). These three constraints are specific to the case study presented in this paper, and can be revised
at the discretion of the user. Thus, equations (10) and (11) ensure that a bus that was rebuilt twice (each
time its life is increased by or years is replaced. This policy is applicable only after years.
Similarly, a bus that is remanufactured resulting in an increase in life by years must be replaced
(equations 10 and 12) and is applicable only after years. This constraint presented in equations (10, 11,
and 12) is specific to the case study presented in this paper, and can be revised at the discretion of the
user. Equation (13) is a non-negativity constraint to ensure that the number of buses chosen for
improvement is never negative. The formulation involves non-linear functions, non-differentiable
functions, step functions, and integer variables. Although the step function can be generalized to linear
forms, the formulation will require additional variables which may result in variable explosion rendering
the model unsuitable for large/real world problems.
Mishra, S. 7
∑
(10)
{
{
}
(11)
{
(12)
(13)
SOLUTION APPROACH
A Branch and Bound Algorithm (BBA) is used in this paper because of the integer nature of decision
variables in transit fleet resource allocation. The BBA approach is applied in three steps. The first step
involves coding of the decision variable cells. The second step involves model initialization, where the
convexity and the size of the problem in terms of number of variables, integers, bounds and surface nature
are determined. A diagnosis of the model is performed to check the nature of the desired model (linear,
quadratic, conic, non-linear, etc.). Finally, the third step involves the development of constraint coded
cells. Budget constraints (Equation 6 and 7), mandatory replacement constraints (Equation (10)), and
REBUILD constraints are coded. The BBA approach is explained below.
Let
is the number of buses to be added to a fleet when it reaches a zero remaining life for
type of improvement for agency i, on mth year. If
is not an integer, we can always find an integer
[
] such that:
[
]
[
] (14)
Equation (12) results in the formulation of two sub problems, with an additional upper bound constraint
[
] (15)
and another with lower bound constraint
[
] (16)
If the decision variables with integer constraints already have integer solutions, no further action
is required. If one or more integer variables have non-integer solutions, the Branch and Bound method
chooses one such variable and creates two new sub-problems where the value of that variable is more
tightly constrained. These sub problems are solved and the process is repeated, until a solution is found
where all of the decision variables have integer values (within a small tolerance). The complete
methodology is implemented in a VBA based solver platform (23), on an Intel (R) Xeon (R) Core 2
Quad, 4GB memory, 2.0 GHz under Windows 7 operating system. A precision value of 1.0E-6 is used to
determine how closely the estimated constraints match with the given values. Each optimization run
requires approximately 20,000 iterations to find the optimal value. Each iteration requires 0.10 seconds,
and one complete optimization run requires approximately 33 minutes.
Mishra, S. 8
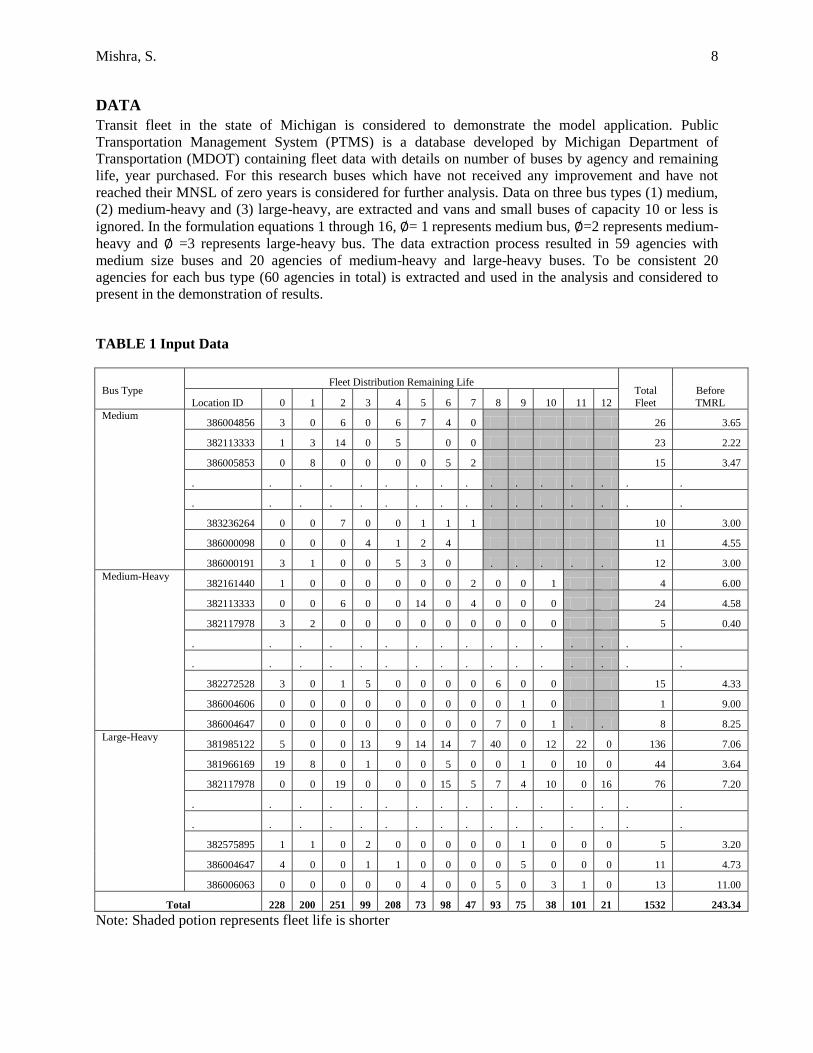
DATA
Transit fleet in the state of Michigan is considered to demonstrate the model application. Public
Transportation Management System (PTMS) is a database developed by Michigan Department of
Transportation (MDOT) containing fleet data with details on number of buses by agency and remaining
life, year purchased. For this research buses which have not received any improvement and have not
reached their MNSL of zero years is considered for further analysis. Data on three bus types (1) medium,
(2) medium-heavy and (3) large-heavy, are extracted and vans and small buses of capacity 10 or less is
ignored. In the formulation equations 1 through 16, = 1 represents medium bus, =2 represents medium-
heavy and =3 represents large-heavy bus. The data extraction process resulted in 59 agencies with
medium size buses and 20 agencies of medium-heavy and large-heavy buses. To be consistent 20
agencies for each bus type (60 agencies in total) is extracted and used in the analysis and considered to
present in the demonstration of results.
TABLE 1 Input Data
Bus Type
Fleet Distribution Remaining Life Total
Fleet
Before
TMRL Location ID 0 1 2 3 4 5 6 7 8 9 10 11 12
Medium 386004856 3 0 6 0 6 7 4 0 26 3.65
382113333 1 3 14 0 5 0 0 23 2.22
386005853 0 8 0 0 0 0 5 2 15 3.47
. . . . . . . . . . . . . . . .
. . . . . . . . . . . . . . . .
383236264 0 0 7 0 0 1 1 1 10 3.00
386000098 0 0 0 4 1 2 4 11 4.55
386000191 3 1 0 0 5 3 0 . . . . . 12 3.00
Medium-Heavy 382161440 1 0 0 0 0 0 0 2 0 0 1 4 6.00
382113333 0 0 6 0 0 14 0 4 0 0 0 24 4.58
382117978 3 2 0 0 0 0 0 0 0 0 0 5 0.40
. . . . . . . . . . . . . . . .
. . . . . . . . . . . . . . . .
382272528 3 0 1 5 0 0 0 0 6 0 0 15 4.33
386004606 0 0 0 0 0 0 0 0 0 1 0 1 9.00
386004647 0 0 0 0 0 0 0 0 7 0 1 . . 8 8.25
Large-Heavy 381985122 5 0 0 13 9 14 14 7 40 0 12 22 0 136 7.06
381966169 19 8 0 1 0 0 5 0 0 1 0 10 0 44 3.64
382117978 0 0 19 0 0 0 15 5 7 4 10 0 16 76 7.20
. . . . . . . . . . . . . . . .
. . . . . . . . . . . . . . . .
382575895 1 1 0 2 0 0 0 0 0 1 0 0 0 5 3.20
386004647 4 0 0 1 1 0 0 0 0 5 0 0 0 11 4.73
386006063 0 0 0 0 0 4 0 0 5 0 3 1 0 13 11.00
Total 228 200 251 99 208 73 98 47 93 75 38 101 21 1532 243.34
Note: Shaded potion represents fleet life is shorter
Mishra, S. 9
Table 1 shows distribution of remaining life of buses for each agency by bus type. Total fleet and
MRL for each agency are also shown in Table 1. For example for the first location ID, MRL is estimated
as (3*0+0*1+6*2+…. +4*6+0*7)/26 = 3.65. MRL of 3.65 represents as the mean remaining life of the
first agency is 3.65 years. Similarly, MRL is estimated for all agencies. TMRL for all agencies for the
year 2013 is 243.34 years.
The following improvement options are used in the case study:
• Replacement (REPL)—process of retiring an existing vehicle and procuring a completely new
vehicle. Buses proposed to be replaced using federal dollars are expected to be at the end of their
MNSLs, as described above.
• Rehabilitation (REHAB)—process by which an existing bus is rebuilt to the original
manufacturer’s specification. The focus of rehabilitation is on the vehicle interior and mechanical
systems, including rebuilding engines, transmission, brakes, and so on. Two types of
rehabilitation: REHAB1 and REHAB2 with moderate to higher levels of engine rebuilds are
considered in this study.
• Remanufacturing (REBUILD)—process by which the structural integrity of the bus is restored to
original design standards. This includes remanufacturing the bus chassis as well as the drivetrain,
suspension system, steering components, engine, transmission, and differential with new and
manufactured components and a new bus body.
• Further, it was assumed that a vehicle may be rehabilitated (REHAB1 or REHAB2) only up to
two consecutive terms, and then must be replaced (REPL) with a new bus. A vehicle with
REHAB1 and REHAB2 (or vice versa) in two consecutive terms also should be replaced. A
vehicle may be remanufactured (REBUILD) only one time, and then must be replaced (REPL)
with a new bus. A vehicle rehabilitated (REHAB1 and REHAB2) once can be eligible for
remanufacturing (REBUILD) before it is replaced (REPL).
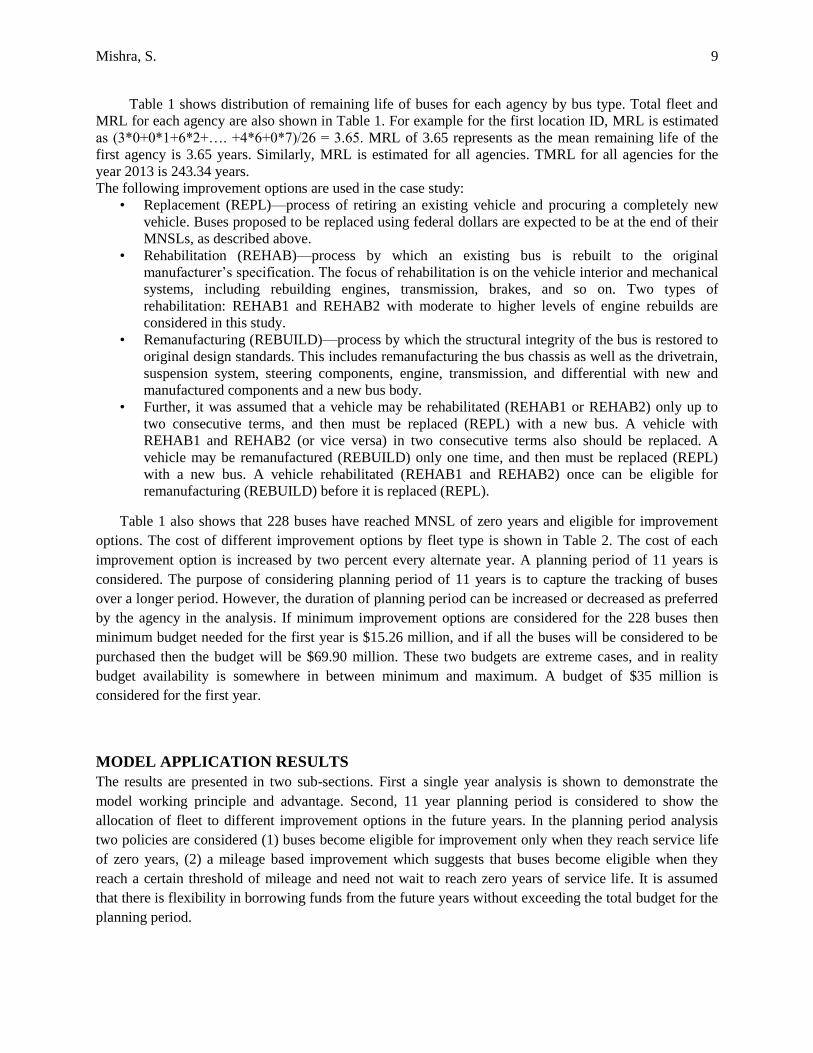
Table 1 also shows that 228 buses have reached MNSL of zero years and eligible for improvement
options. The cost of different improvement options by fleet type is shown in Table 2. The cost of each
improvement option is increased by two percent every alternate year. A planning period of 11 years is
considered. The purpose of considering planning period of 11 years is to capture the tracking of buses
over a longer period. However, the duration of planning period can be increased or decreased as preferred
by the agency in the analysis. If minimum improvement options are considered for the 228 buses then
minimum budget needed for the first year is $15.26 million, and if all the buses will be considered to be
purchased then the budget will be $69.90 million. These two budgets are extreme cases, and in reality
budget availability is somewhere in between minimum and maximum. A budget of $35 million is
considered for the first year.
MODEL APPLICATION RESULTS
The results are presented in two sub-sections. First a single year analysis is shown to demonstrate the
model working principle and advantage. Second, 11 year planning period is considered to show the
allocation of fleet to different improvement options in the future years. In the planning period analysis
two policies are considered (1) buses become eligible for improvement only when they reach service life
of zero years, (2) a mileage based improvement which suggests that buses become eligible when they
reach a certain threshold of mileage and need not wait to reach zero years of service life. It is assumed
that there is flexibility in borrowing funds from the future years without exceeding the total budget for the
planning period.
Mishra, S. 10
TABLE 2 Cost of Improvement Options and Budget
Year
Mid Size ($) Mid Size- Heavy ($) Large-Heavy ($)
Annual Budget ($) Rehab-I Rehab-II REBUILD Replace Rehab-I Rehab-II REBUILD Replace Rehab-I Rehab-II REBUILD Replace
Life=2 Life=3 Life=4 Life=7 Life=3 Life=4 Life=6 Life=10 Life=4 Life=5 Life=7 Life=12
2013 17,800 24,500 30,320 81,540 43,660 60,093 74,368 200,000 76,404 105,163 130,145 350,000 35,000,000
2014 17,800 24,500 30,320 81,540 43,660 60,093 74,368 200,000 76,404 105,163 130,145 350,000 35,000,000
2015 18,690 25,725 31,836 85,617 45,843 63,098 78,087 210,000 80,224 110,421 136,652 367,500 36,750,000
2016 18,690 25,725 31,836 85,617 45,843 63,098 78,087 210,000 80,224 110,421 136,652 367,500 36,750,000
2017 19,625 27,011 33,428 89,898 48,135 66,253 81,991 220,500 84,236 115,942 143,485 385,875 38,587,500
2018 19,625 28,362 35,099 94,393 50,541 69,565 86,091 231,525 88,447 121,739 150,659 405,169 38,587,500
2019 20,606 29,780 36,854 99,112 53,068 73,044 90,395 243,101 92,870 127,826 158,192 425,427 40,516,875
2020 20,606 29,780 36,854 99,112 53,068 73,044 90,395 243,101 92,870 127,826 158,192 425,427 40,516,875
2021 21,636 31,269 38,697 104,068 55,722 76,696 94,915 255,256 97,513 134,218 166,101 446,699 42,542,719
2022 21,636 31,269 38,697 104,068 55,722 76,696 94,915 255,256 97,513 134,218 166,101 446,699 42,542,719
2023 22,718 32,832 40,632 109,271 58,508 80,531 99,661 268,019 102,389 140,929 174,406 469,033 44,669,855
Total 137,983,970
Mishra, S. 11
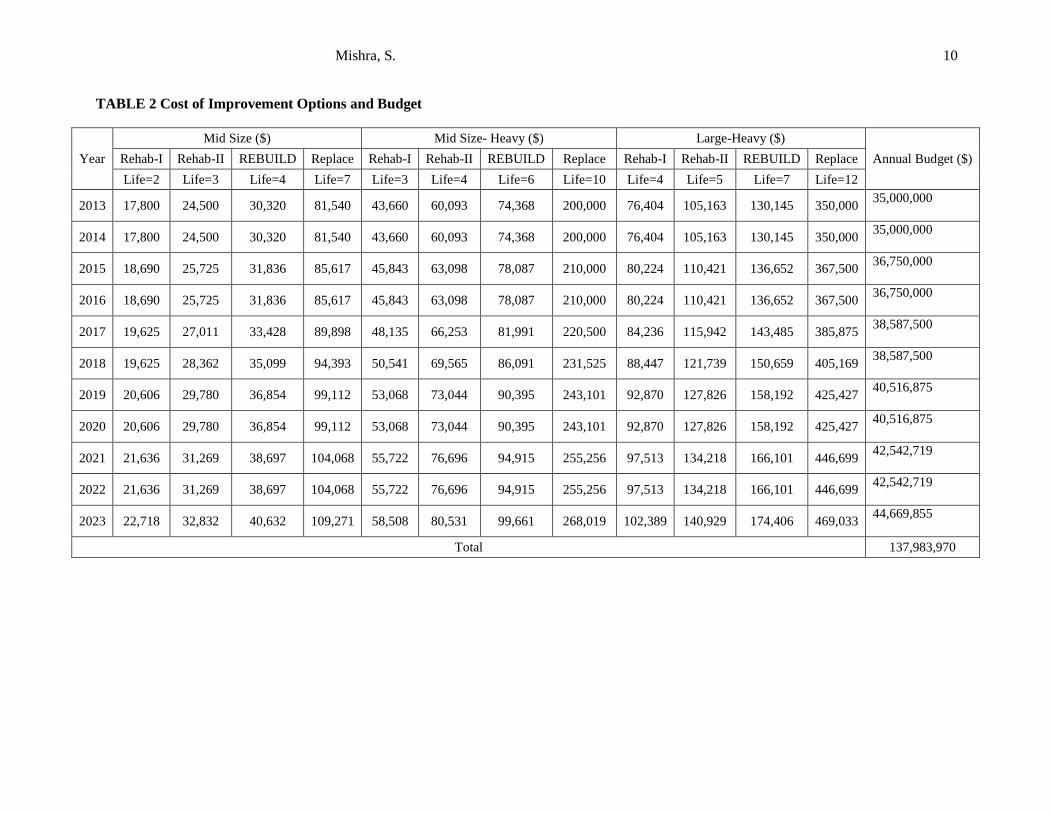
One Year Analysis
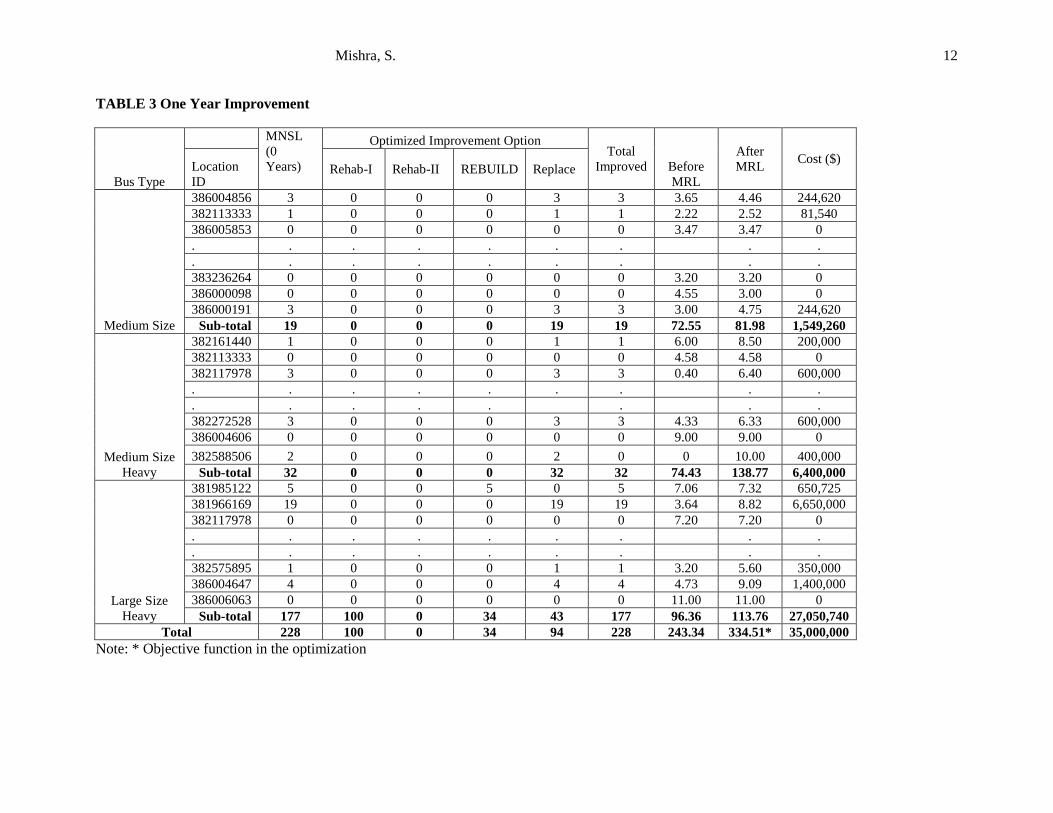
Results of the first year optimization are shown in Table 3. 19 medium buses, 32 medium-heavy buses
and 177 large-heavy buses have zero years of service life (Table 3, column 3). These buses are eligible for
improvement in different options. If these buses are to be replaced then a total cost of $69,899,260 is
needed (i.e. 19*$81,540 + 32*200,000 + 177*350,000). A budget of $35 million is available for
allocation (Table 2). The need for an optimization model is very helpful in this situation to provide
optimal allocation of buses to different improvement options. The objective function for one year analysis
is maximization of TMRL, subjected to budget constraint. All the fleet eligible for improvement must be
allocated.
Table 3 shows results for a subset of agencies. For example, for agency (ID= 386004856), 3
medium size buses needs to be replaced, optimization model allocates these three buses to REHAB-I
option. Because of this improvement MRL for this agency has increased from 3.65 to 4.46 years. The cost
for this improvement is $244,620. For all agencies in medium size, 19 buses are chosen for REPL option.
TMRL for medium size buses have improved from 72.55 years to 81.98 years at an expenditure of $1.549
million. Similarly, for medium-heavy buses, all 32 buses are chosen for REPL improvement option
resulting in TMRL improvement from 74.43 years to 138.77 years at an expense of $6.4 million. For
large-heavy buses, 100 in REHAB-I, 34 in REBUILD, and 43 in REPL options are chosen. The TMRL
has improved from 96.36 years to 113.76 years at an expense of $27.05 million. . For all types of buses in
one year analysis total TMRL has improved from 243.34 years to 334.51 years at an expense of $35
million. A detailed analysis showing all the agencies are not shown in Table 3 for brevity. The allocation
for the first year shows that 100 buses are chosen for REHAB-I, none for REHAB-II, 34 for REBUILD,
and 43 for REPL option. The advantage of the optimization model is that it allows an optimal distribution
of fleet to various improvement options in such a way that TMRL is maximized. It is nearly impossible to
do such an analysis without an optimization model.
Multiple Year Analysis
Case-1: Zero Remaining Life Based Improvement (ZRLBI)
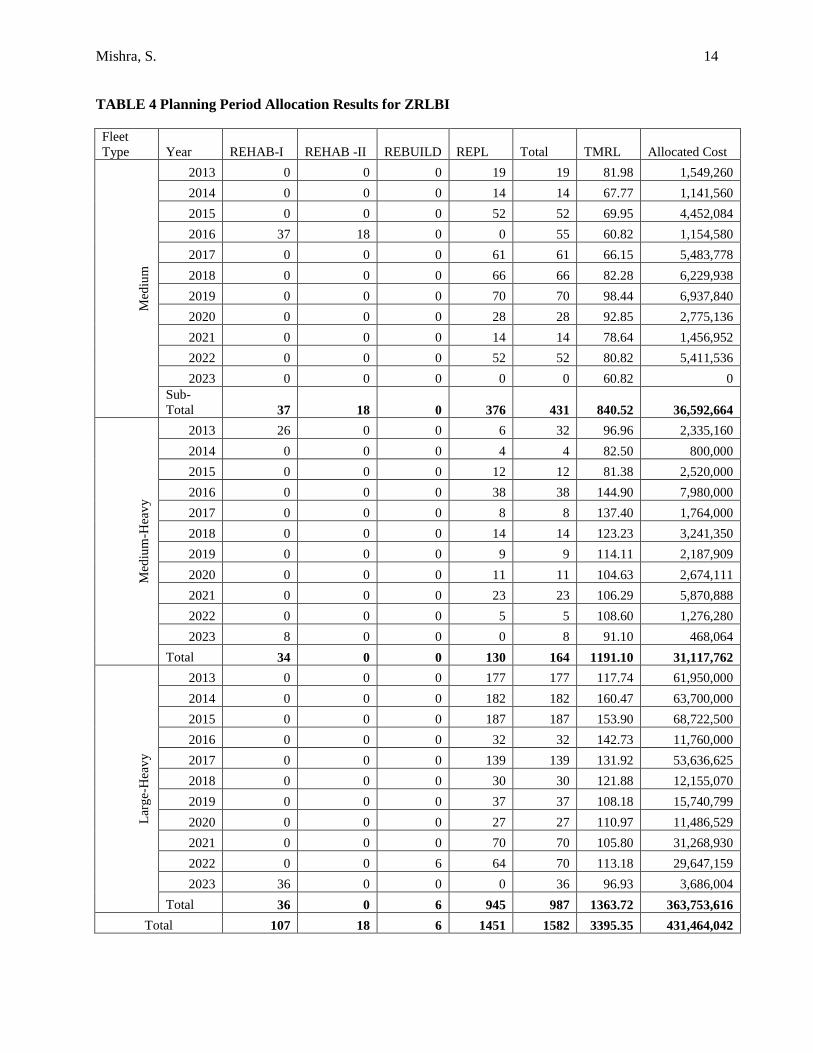
Table 4 shows resource allocation for 11 year planning period (2013 to 2023) for the mixed transit fleet in
Michigan. Results are presented by each type of transit fleet over the planning period. For example, for
medium buses in the year 2013, 19 buses are chosen for REPL category, resulting in a TMRL of 81.98
years with allocated cost of $1.549 million. For 2014, 14 buses are chosen for REPL category resulting in
TMRL of 67.77 years. Similar allocations can be observed for other years in the planning period. At the
end of the planning period a total of 431 buses were chosen for improvement. Among these, 37 buses for
REHAB-I, 18 buses for REHAB-II, none for REBUILD, and 376 for REPL are chosen with a TSMRL of
840.52 at expense of $36.59 million.
Mishra, S. 12
TABLE 3 One Year Improvement
Bus Type
MNSL
(0
Years)
Optimized Improvement Option Total
Improved Before
MRL
After
MRL Cost ($)
Location
ID Rehab-I Rehab-II REBUILD Replace
Medium Size
386004856 3 0 0 0 3 3 3.65 4.46 244,620
382113333 1 0 0 0 1 1 2.22 2.52 81,540
386005853 0 0 0 0 0 0 3.47 3.47 0
. . . . . . .
. .
. . . . . . .
. .
383236264 0 0 0 0 0 0 3.20 3.20 0
386000098 0 0 0 0 0 0 4.55 3.00 0
386000191 3 0 0 0 3 3 3.00 4.75 244,620
Sub-total 19 0 0 0 19 19 72.55 81.98 1,549,260
Medium Size
Heavy
382161440 1 0 0 0 1 1 6.00 8.50 200,000
382113333 0 0 0 0 0 0 4.58 4.58 0
382117978 3 0 0 0 3 3 0.40 6.40 600,000
. . . . . . .
. .
. . . . .
.
. .
382272528 3 0 0 0 3 3 4.33 6.33 600,000
386004606 0 0 0 0 0 0 9.00 9.00 0
382588506 2 0 0 0 2 0 0 10.00 400,000
Sub-total 32 0 0 0 32 32 74.43 138.77 6,400,000
Large Size
Heavy
381985122 5 0 0 5 0 5 7.06 7.32 650,725
381966169 19 0 0 0 19 19 3.64 8.82 6,650,000
382117978 0 0 0 0 0 0 7.20 7.20 0
. . . . . . .
. .
. . . . . . .
. .
382575895 1 0 0 0 1 1 3.20 5.60 350,000
386004647 4 0 0 0 4 4 4.73 9.09 1,400,000
386006063 0 0 0 0 0 0 11.00 11.00 0
Sub-total 177 100 0 34 43 177 96.36 113.76 27,050,740
Total 228 100 0 34 94 228 243.34 334.51* 35,000,000
Note: * Objective function in the optimization
Mishra, S. 13
For medium-heavy buses in 2013, 26 buses are chosen for REHAB-I and six buses for REPL
with a resulting TMRL of 96.96 years. For the planning period, a total of 164 buses (34 for REHAB-I and
130 for REPL) are chosen for improvement resulting in TSMRL of 1191.10 years at an expense of $31.11
million. Similarly, for large-heavy buses, for the first year 177 buses were chosen for REPL option
resulting in TMRL of 117.74 years. For the planning period, 36 buses were chosen for REHAB-I, none
for REHAB-II, six for REBUILD, and 987 for REPL option resulting in TSMRL of 1363.72 years at an
expense of $363.75 million. Overall for including all bus types, 107 buses were chosen for REHAB-I, 18
for REHAB-II, six for REBUILD, and 1582 in REPL option were chosen. Overall, TSMRL of 3395.35 is
attained with an expenditure of $431.46 million.
In a comparison, it is noted that the TMRL achieved in one year analysis is 334.51 years (Table
3) and the corresponding value for multi-year analysis is 296.68 years (Table 4, sum of TMRL for first
year). This difference is because of the fact that in multi-year analysis the optimization works in such a
way that TMRL is maximized while in one year analysis the model is blind for future years. A number of
constraints come into play for multiyear analysis such as a bus that receives twice REHAB-I and
REHAB-II, or REBUILD or a combination of REHAB and REBUILD must be replaced (constraints as
shown in equation 8-10). These constraints do not apply to one year analysis. One has an option of
conducting optimization one year at a time at the discretion of obtaining sub-optimal or infeasible
solution. Previous research has already established that multi-year analysis has several benefits over
annual allocation (24).
Case-2: Continual Mileage Based Improvement (CMBI)
In mileage based continual replacement buses are eligible for improvement when they reach a threshold
of mileage. It is assumed that each bus reach a mileage threshold in every three years. In practice each bus
is used for a fixed route and also mileage travelled by buses at the end of every year is also nearly
constant (25–27). With the mileage threshold these assumptions are made based on recent statewide
practices:
Only new buses whose life is three years or more become eligible for continual improvement for
a maximum of three times.
Buses as they reach normal service life of zero years also become eligible for improvement
Cost of buses continual improvement is 50% of that of an option REHAB-I, REHAB-II, and
REBUILD as the improvement is applied not at the end of the service life but when the bus has
completed a threshold of mileage.
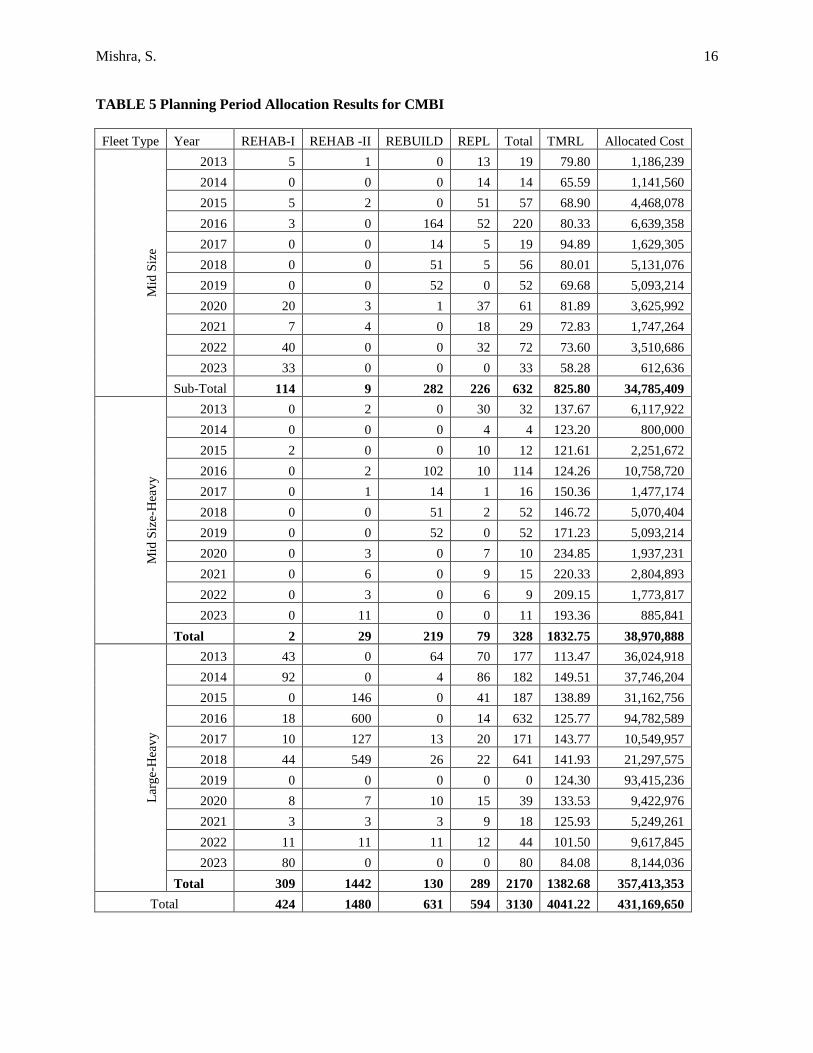
Table 5 shows result of CMBI strategy for all types of fleet for the planning period. For medium-
buses, in the year 2013, 5 buses are chosen for REHAB-I, one for REHAB-II, none for REBUILD, and 13
for REPL, resulting in TMRL of 79.80 and allocated cost of $1.186 million. During the planning period
for medium size buses 114 buses are chosen for REHAB-I, 9 for REHAB-II, 282 for REBUILD, and 632
for REPL option. The resulting TSMRL is 825.80 years, and the corresponding cost is $34.785 million.
Mishra, S. 14
TABLE 4 Planning Period Allocation Results for ZRLBI
Fleet
Type Year REHAB-I REHAB -II REBUILD REPL Total TMRL Allocated Cost M
ediu
m
2013 0 0 0 19 19 81.98 1,549,260
2014 0 0 0 14 14 67.77 1,141,560
2015 0 0 0 52 52 69.95 4,452,084
2016 37 18 0 0 55 60.82 1,154,580
2017 0 0 0 61 61 66.15 5,483,778
2018 0 0 0 66 66 82.28 6,229,938
2019 0 0 0 70 70 98.44 6,937,840
2020 0 0 0 28 28 92.85 2,775,136
2021 0 0 0 14 14 78.64 1,456,952
2022 0 0 0 52 52 80.82 5,411,536
2023 0 0 0 0 0 60.82 0
Sub-
Total 37 18 0 376 431 840.52 36,592,664
Med
ium
-Hea
vy
2013 26 0 0 6 32 96.96 2,335,160
2014 0 0 0 4 4 82.50 800,000
2015 0 0 0 12 12 81.38 2,520,000
2016 0 0 0 38 38 144.90 7,980,000
2017 0 0 0 8 8 137.40 1,764,000
2018 0 0 0 14 14 123.23 3,241,350
2019 0 0 0 9 9 114.11 2,187,909
2020 0 0 0 11 11 104.63 2,674,111
2021 0 0 0 23 23 106.29 5,870,888
2022 0 0 0 5 5 108.60 1,276,280
2023 8 0 0 0 8 91.10 468,064
Total 34 0 0 130 164 1191.10 31,117,762
Lar
ge-
Hea
vy
2013 0 0 0 177 177 117.74 61,950,000
2014 0 0 0 182 182 160.47 63,700,000
2015 0 0 0 187 187 153.90 68,722,500
2016 0 0 0 32 32 142.73 11,760,000
2017 0 0 0 139 139 131.92 53,636,625
2018 0 0 0 30 30 121.88 12,155,070
2019 0 0 0 37 37 108.18 15,740,799
2020 0 0 0 27 27 110.97 11,486,529
2021 0 0 0 70 70 105.80 31,268,930
2022 0 0 6 64 70 113.18 29,647,159
2023 36 0 0 0 36 96.93 3,686,004
Total 36 0 6 945 987 1363.72 363,753,616
Total 107 18 6 1451 1582 3395.35 431,464,042
Mishra, S. 15
For medium-heavy buses, in the year 2013, two buses were chosen for REHAB-II and 30 buses for REPL
option, resulting in a TMRL of 137.67 years at an expense of $6.11 million. In the planning period, two
buses were chosen for REHAB-I, 29 for REHAB-II, 219 for REBUILD, and 79 for REPL. A total of 328
buses were eligible for improvement resulting in TMRL of 1,832.75 years at an expense of $38.97
million. For large-heavy buses in the year 2013, 43 buses were chosen for REHAB-I, none for REHAB-
II, 64 for REBUILD and 70 for REPL option. A total of 177 buses were improved for year 2013 resulting
in TMRL of 113.47 years at an expense of $36.024 million. In the planning period a total of 2,170 buses
were improved (309 for REHAB-I, 1442 for REHAB-II, 130 for REBUILD, and 289 for REPL) with
resulting TSMRL of 1382.68 years and allocated cost of $357.41 million. When allocation of all buses is
combined, 424 buses for REHAB-I, 1480 REHAB-II, 631 for REBUILD, and 594 REPL are used. A total
of 3130 buses were improved using different options resulting in TSMRL of 4041.22 years at cost of
$431.169 million.
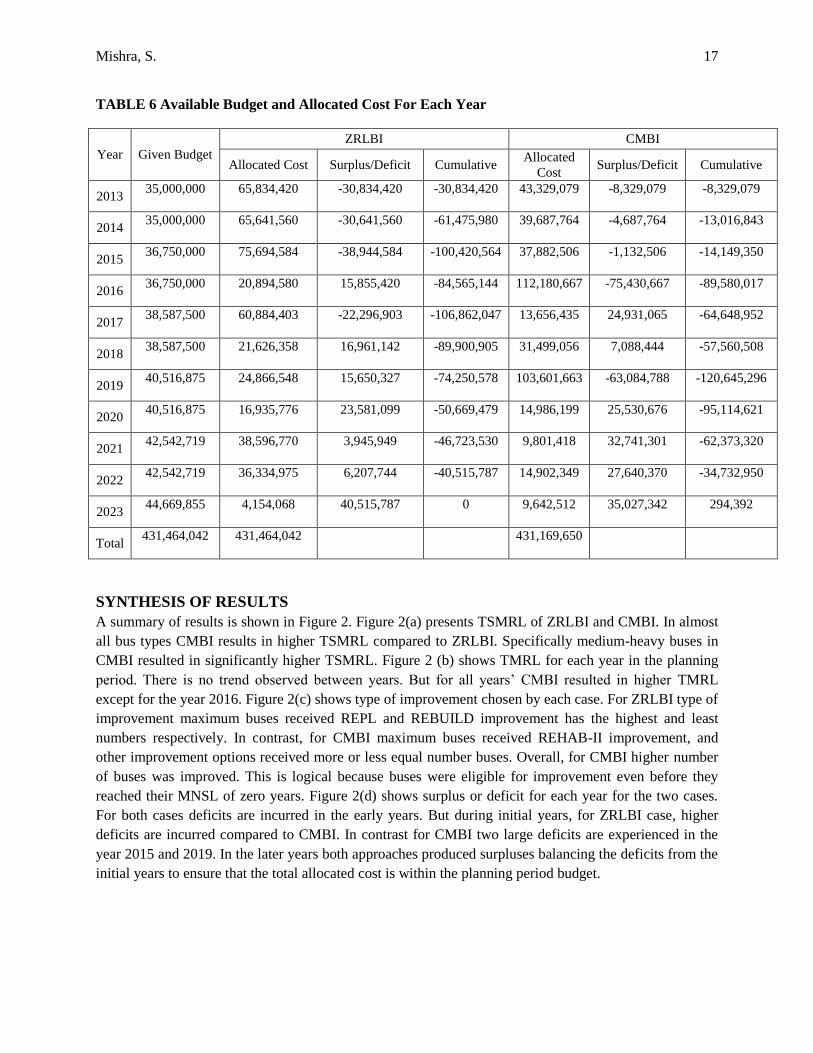
Annual Expenditures
Table 6 shows budget allocation for each year and for both cases (ZRLBI and CMBI). Year and given
budget is shown in the first and second column of Table 6. For each case allocated budget, surplus/deficit,
and cumulative surplus/deficit is shown. For ZRLBI case, in the first year allocated budget is $65.83
million resulting in a deficit of $30.83 million. In the multiple year analysis it is assumed that there is
flexibility in borrowing funds from the future years ensuring that budget in the planning period is not
exceeded (equation 6). Similarly deficit and surplus for other years for the base case is shown in Table 6.
It is seen that for base case model large deficits are incurred in the beginning years of the planning period
but surplus remained in the later years ensuring the rule of not violating total budget constraint. At the
end of the planning period, the allocated budget $431.464 million is used leaving no surplus or deficit.
During the planning period deficit are incurred in the year 2013, 2014, 2015, and 2017.
Similarly annual allocated costs for all years in CMBI strategy suggest that deficits were incurred
in multiple years in the planning period but in lesser amount. For example, in the year 2013, allocated
cost is $43.32 million resulting in a deficit of 8.32 million (compared to $30.83 million deficit for the
base case). For the planning period total allocated cost is $431.16 million resulting in a surplus of
$294,392. It is observed that deficit is incurred from 2013 through 2016 and 2019.
Mishra, S. 16
TABLE 5 Planning Period Allocation Results for CMBI
Fleet Type Year REHAB-I REHAB -II REBUILD REPL Total TMRL Allocated Cost M
id S
ize
2013 5 1 0 13 19 79.80 1,186,239
2014 0 0 0 14 14 65.59 1,141,560
2015 5 2 0 51 57 68.90 4,468,078
2016 3 0 164 52 220 80.33 6,639,358
2017 0 0 14 5 19 94.89 1,629,305
2018 0 0 51 5 56 80.01 5,131,076
2019 0 0 52 0 52 69.68 5,093,214
2020 20 3 1 37 61 81.89 3,625,992
2021 7 4 0 18 29 72.83 1,747,264
2022 40 0 0 32 72 73.60 3,510,686
2023 33 0 0 0 33 58.28 612,636
Sub-Total 114 9 282 226 632 825.80 34,785,409
Mid
Siz
e-H
eav
y
2013 0 2 0 30 32 137.67 6,117,922
2014 0 0 0 4 4 123.20 800,000
2015 2 0 0 10 12 121.61 2,251,672
2016 0 2 102 10 114 124.26 10,758,720
2017 0 1 14 1 16 150.36 1,477,174
2018 0 0 51 2 52 146.72 5,070,404
2019 0 0 52 0 52 171.23 5,093,214
2020 0 3 0 7 10 234.85 1,937,231
2021 0 6 0 9 15 220.33 2,804,893
2022 0 3 0 6 9 209.15 1,773,817
2023 0 11 0 0 11 193.36 885,841
Total 2 29 219 79 328 1832.75 38,970,888
Lar
ge-
Hea
vy
2013 43 0 64 70 177 113.47 36,024,918
2014 92 0 4 86 182 149.51 37,746,204
2015 0 146 0 41 187 138.89 31,162,756
2016 18 600 0 14 632 125.77 94,782,589
2017 10 127 13 20 171 143.77 10,549,957
2018 44 549 26 22 641 141.93 21,297,575
2019 0 0 0 0 0 124.30 93,415,236
2020 8 7 10 15 39 133.53 9,422,976
2021 3 3 3 9 18 125.93 5,249,261
2022 11 11 11 12 44 101.50 9,617,845
2023 80 0 0 0 80 84.08 8,144,036
Total 309 1442 130 289 2170 1382.68 357,413,353
Total 424 1480 631 594 3130 4041.22 431,169,650
Mishra, S. 17
TABLE 6 Available Budget and Allocated Cost For Each Year
Year Given Budget
ZRLBI CMBI
Allocated Cost Surplus/Deficit Cumulative Allocated
Cost Surplus/Deficit Cumulative
2013 35,000,000 65,834,420 -30,834,420 -30,834,420 43,329,079 -8,329,079 -8,329,079
2014 35,000,000 65,641,560 -30,641,560 -61,475,980 39,687,764 -4,687,764 -13,016,843
2015 36,750,000 75,694,584 -38,944,584 -100,420,564 37,882,506 -1,132,506 -14,149,350
2016 36,750,000 20,894,580 15,855,420 -84,565,144 112,180,667 -75,430,667 -89,580,017
2017 38,587,500 60,884,403 -22,296,903 -106,862,047 13,656,435 24,931,065 -64,648,952
2018 38,587,500 21,626,358 16,961,142 -89,900,905 31,499,056 7,088,444 -57,560,508
2019 40,516,875 24,866,548 15,650,327 -74,250,578 103,601,663 -63,084,788 -120,645,296
2020 40,516,875 16,935,776 23,581,099 -50,669,479 14,986,199 25,530,676 -95,114,621
2021 42,542,719 38,596,770 3,945,949 -46,723,530 9,801,418 32,741,301 -62,373,320
2022 42,542,719 36,334,975 6,207,744 -40,515,787 14,902,349 27,640,370 -34,732,950
2023 44,669,855 4,154,068 40,515,787 0 9,642,512 35,027,342 294,392
Total 431,464,042 431,464,042 431,169,650
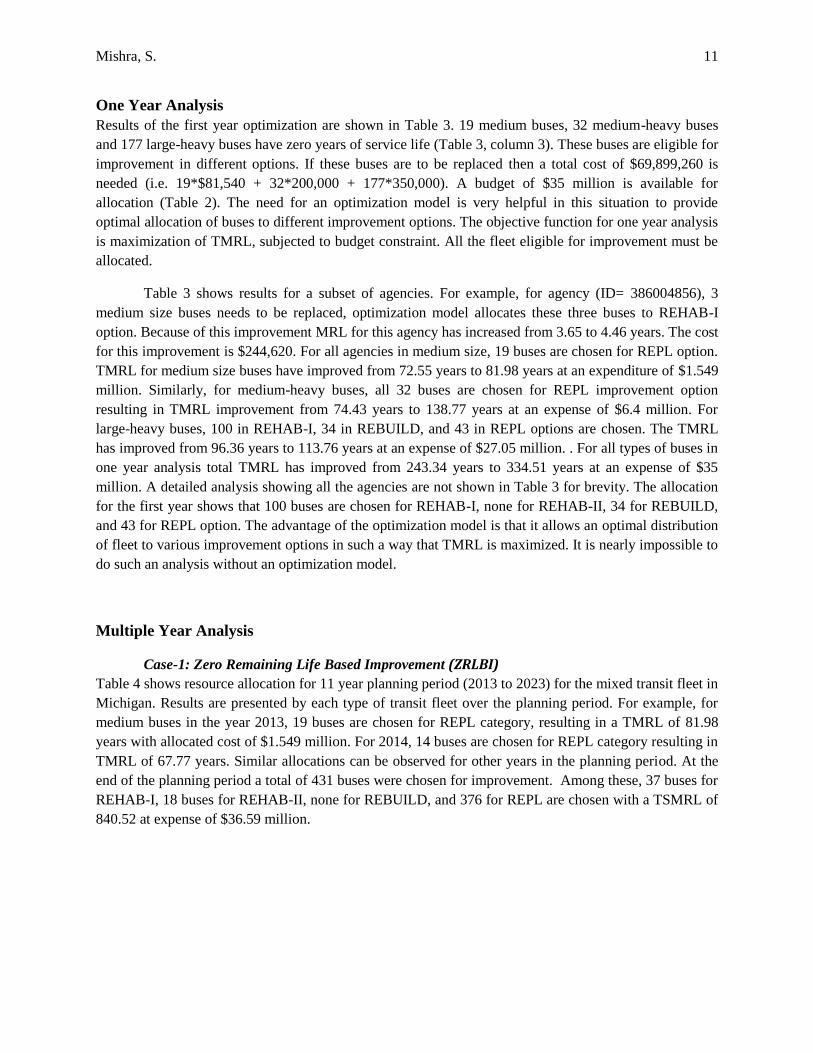
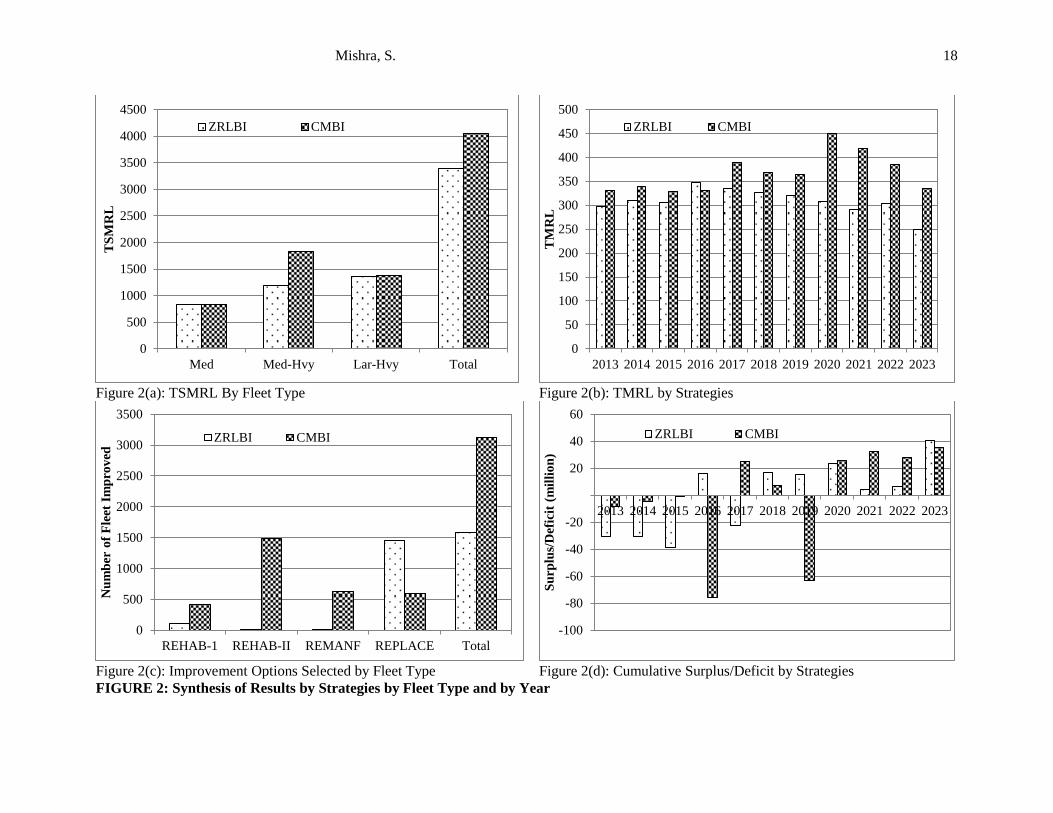
SYNTHESIS OF RESULTS
A summary of results is shown in Figure 2. Figure 2(a) presents TSMRL of ZRLBI and CMBI. In almost
all bus types CMBI results in higher TSMRL compared to ZRLBI. Specifically medium-heavy buses in
CMBI resulted in significantly higher TSMRL. Figure 2 (b) shows TMRL for each year in the planning
period. There is no trend observed between years. But for all years’ CMBI resulted in higher TMRL
except for the year 2016. Figure 2(c) shows type of improvement chosen by each case. For ZRLBI type of
improvement maximum buses received REPL and REBUILD improvement has the highest and least
numbers respectively. In contrast, for CMBI maximum buses received REHAB-II improvement, and
other improvement options received more or less equal number buses. Overall, for CMBI higher number
of buses was improved. This is logical because buses were eligible for improvement even before they
reached their MNSL of zero years. Figure 2(d) shows surplus or deficit for each year for the two cases.
For both cases deficits are incurred in the early years. But during initial years, for ZRLBI case, higher
deficits are incurred compared to CMBI. In contrast for CMBI two large deficits are experienced in the
year 2015 and 2019. In the later years both approaches produced surpluses balancing the deficits from the
initial years to ensure that the total allocated cost is within the planning period budget.
Mishra, S. 18
Figure 2(a): TSMRL By Fleet Type Figure 2(b): TMRL by Strategies
Figure 2(c): Improvement Options Selected by Fleet Type Figure 2(d): Cumulative Surplus/Deficit by Strategies
FIGURE 2: Synthesis of Results by Strategies by Fleet Type and by Year
0
500
1000
1500
2000
2500
3000
3500
4000
4500
Med Med-Hvy Lar-Hvy Total
TS
MR
L
ZRLBI CMBI
0
50
100
150
200
250
300
350
400
450
500
2013 2014 2015 2016 2017 2018 2019 2020 2021 2022 2023
TM
RL
ZRLBI CMBI
0
500
1000
1500
2000
2500
3000
3500
REHAB-1 REHAB-II REMANF REPLACE Total
Nu
mb
er o
f F
leet
Im
pro
ved
ZRLBI CMBI
-100
-80
-60
-40
-20
20
40
60
2013 2014 2015 2016 2017 2018 2019 2020 2021 2022 2023
Su
rplu
s/D
efic
it (
mil
lio
n)
ZRLBI CMBI
Mishra, S. 19
Clearly CMBI provided better results than ZRLBI in terms of the TSWRL values (objective function) and
the budget (constraint). However, a careful examination of the results shows that CMBI case arrived at
larger TSMRL by adopting large investments in the interim years. On the other hand, the ZRLBI based
improvement results that tend to use all the available options at somewhat moderate spending rate over
the years (with deficits in the initial years), may be the preferred alternative for some agencies. Overall,
both approaches provide intuitive results, but CMBI surpasses its counterpart because of the ability to
make buses eligible for improvement before they reach service life of zero years at a lower cost.
CONCLUSION
MAP-21 clearly identifies SGR as one of the critical aspects to maintain and preserve the current public
transit system. Each state has number of transit agencies, and each transit agencies have variety of bus
types. The remaining life associated with each bus is different. The challenge is to find optimal
improvement strategy through an allocation process when each bus is eligible for improvement in such a
way that the total remaining life of the bus system is maximized subjected to budget and other constraints.
The proposed approach can be considered to have four dimensions, namely the choice of fleet
improvement program, allocation of funds among the constituent transit agencies, and allocation of funds
over the planning period, and fleet type. The model is formulated as a mathematical program that
maximizes total weighted average of remaining life of the fleet, subject to budget, demand, rebuild and
non-negativity constraints. Two variants of the model are formulated: Zero Remaining Life Based
Improvement (ZRLBI) and Continual Mileage Based Improvement (CMBI). ZRLBI model is based on
the principle that a fleet is eligible for improvement when it reaches zero years of service life. In contrast,
CMBI model allows a bus to be eligible for improvement after it reaches a threshold and not necessarily
waiting for zero years of service life.
Model application is demonstrated using mixed fleet data from state of Michigan. Three types of
buses (medium, medium-heavy, large-heavy) with varying service life, capital and O&M cost is
considered in model application. First, one year allocation of funds is shown to demonstrate the model
working principle and then a planning period of 11 years is considered to show a multi-year allocation of
resources for the transit bus system in Michigan. Results show that CMBI performs better in obtaining a
higher mean remaining life but involves in very large borrowing for one to two years within the planning
period. ZRLBI also involves in borrowing but in lesser amount compared to CMBI. Both models incur
deficit in the initial years of the planning period and have surplus in the later years ensuring that the total
amount committed in improvement is not exceeded than the total budget.
Overall the results show efficiency of proposed transit fleet resource allocation model. The
proposed model is compact and offers flexibility for an agency to choose between both short-term and
long-term planning. This study clearly demonstrates the benefit of the new model in providing a better
solution and comparing results between two variants of improvement options. Further, this model is
expected to be a rational tool in deciding the federal/state fund allocation to competing transit agencies by
maintaining SGR and to keep a healthy transit fleet. In future research the model can be structured to
analyze annual budget constraint where agencies might not have the flexibility of borrowing funds from
the future years. Also the model ignores unexpected need of improvement because of uncertain events
and bus failures.
Mishra, S. 20
ACKNOWLEDGEMENTS
The author would like to thank Michigan Department of Transportation for providing the data for this
research. Computing facilities at University of Memphis is greatly acknowledged. The findings and errors
are solely by the author.
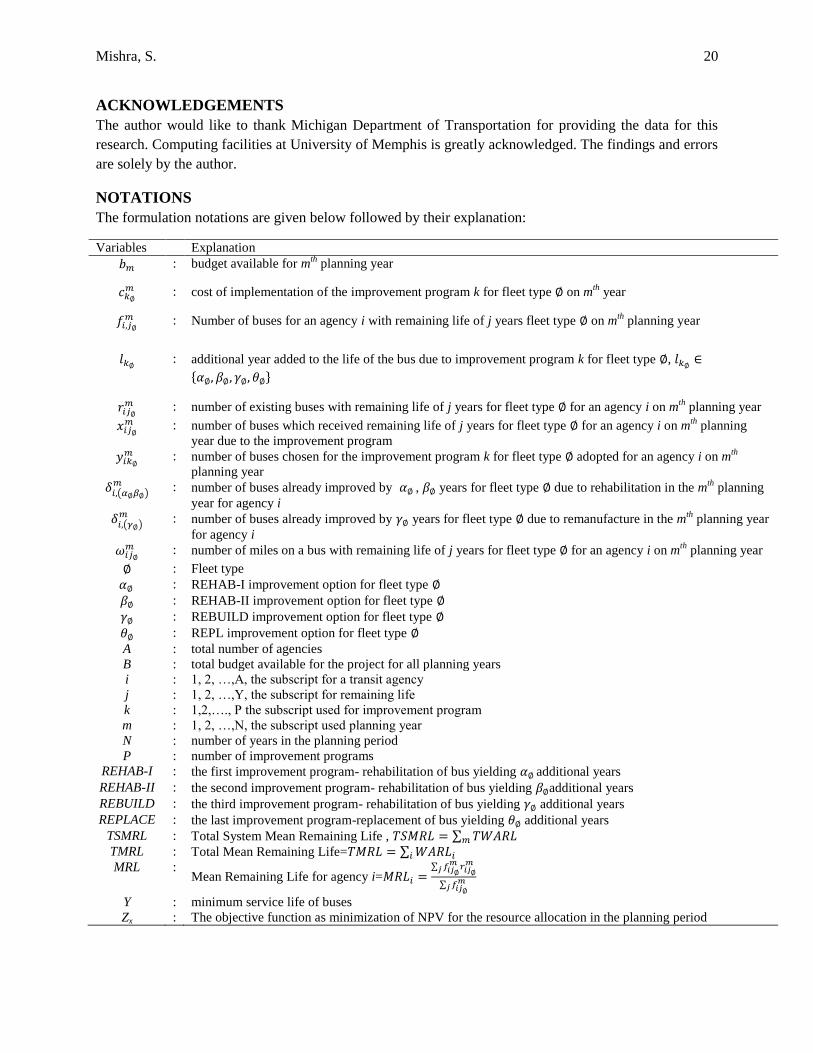
NOTATIONS
The formulation notations are given below followed by their explanation:
Variables Explanation
: budget available for mth
planning year
: cost of implementation of the improvement program k for fleet type on mth
year
: Number of buses for an agency i with remaining life of j years fleet type on m
th planning year
: additional year added to the life of the bus due to improvement program k for fleet type ,
{ }
: number of existing buses with remaining life of j years for fleet type for an agency i on m
th planning year
: number of buses which received remaining life of j years for fleet type for an agency i on m
th planning
year due to the improvement program
: number of buses chosen for the improvement program k for fleet type adopted for an agency i on mth
planning year
( ) : number of buses already improved by , years for fleet type due to rehabilitation in the m
th planning
year for agency i
( ) : number of buses already improved by years for fleet type due to remanufacture in the m
th planning year
for agency i
: number of miles on a bus with remaining life of j years for fleet type for an agency i on m
th planning year
: Fleet type
: REHAB-I improvement option for fleet type
: REHAB-II improvement option for fleet type
: REBUILD improvement option for fleet type
: REPL improvement option for fleet type
A : total number of agencies
B : total budget available for the project for all planning years
i : 1, 2, …,A, the subscript for a transit agency
j : 1, 2, …,Y, the subscript for remaining life
k : 1,2,…., P the subscript used for improvement program
m : 1, 2, …,N, the subscript used planning year
N : number of years in the planning period
P : number of improvement programs
REHAB-I : the first improvement program- rehabilitation of bus yielding additional years
REHAB-II : the second improvement program- rehabilitation of bus yielding additional years
REBUILD : the third improvement program- rehabilitation of bus yielding additional years
REPLACE : the last improvement program-replacement of bus yielding additional years
TSMRL : Total System Mean Remaining Life , ∑
TMRL : Total Mean Remaining Life= ∑
MRL : Mean Remaining Life for agency i=
∑
∑
Y : minimum service life of buses
Zx : The objective function as minimization of NPV for the resource allocation in the planning period
Mishra, S. 21
REFERENCES
1. USDOT. Moving Ahead for Progress in 21st Century (MAP-21). Publication HR.4348. U.S.
Department of Transportation, Federal Highway Administration, Washington DC, Jul. 2012, p. 303.
2. USDOT. Transportation for a new generation-Strategic Plan forFiscal Years 2012-2016. United
States Department of Transportation, Washington, D.C., 2012, p. 70.
3. Balzer, B. B., A. E. Savage, and R. C. Stark. Survey and Analysis Of Bus Rehabilitation In The
Mass Transportation Industry. Nov. 1980.
4. Bridgman, M. S., S. R. McInerney, W. E. Judnick, M. Artson, and B. Fowler. Feasibility Of
Determining Economic Differences Between New Buses And Rehab Buses. Jun. 1984.
5. Bridgman, M. S., B. M. I. C. Laboratories, S. Hjalmar, and K., Rolland D. Economic Comparison of
New Buses Versus Rehabilitated Buses for Department of Transportation/UMTA Office of Bus and
Paratransit Systems. Battelle Columbus Laboratories, 1983.
6. Foerster, J. F. Bus maintenance cost control. Innovative strategies to improve urban transportation
performance : proceedings of a specialty conference., 1985.
7. Giuliani, C. Bus inspection guidelines. Transportation Research Board, National Research Council,
Washington, D.C., 1987.
8. Pake, B. E., M. J. Demetsky, and L. A. Hoel. Evaluation of Bus Maintenance Operations.
Transportation Research Record, No. 1019, 1985.
9. Drake, R. W., and D. W. Carter. Evaluation Of Bus Maintenance Manpower Utilization.
Transportation Research Record, No. 1019, 1985.
10. Pake, B. E., M. J. Demetsky, and L. A. Hoel. Application of a Transit Maintenance Management
Evaluation Procedure. Transportation Research Record, No. 1066, 1986.
11. Dutta, U. Model for comparing performance of various transit maintenance repair policies. 1989.
12. Maze, T. H. Theory and Practice of Transit Bus Maintenance Performance Measurement. 1987.
13. Bartus, J., R. Ellis, and S. Khasnabis. Asset Management Strategy To Meet Long-Term Transit
Fleet Needs Of State Departments Of Transportation. World Transit Research, Jan. 2004.
14. Kozanidis, G., and E. Melachrinoudis. A branch & bound algorithm for the 0-1 mixed integer
knapsack problem with linear multiple choice constraints. Computers & Operations Research, Vol.
31, No. 5, Apr. 2004, pp. 695–711.
15. Basso, A., and L. A. Peccati. Optimal resource allocation with minimum activation levels and fixed
costs. European Journal of Operational Research, Vol. 131, No. 3, Jun. 2001, pp. 536–549.
16. Tsiakis, P., and L. G. Papageorgiou. Optimal production allocation and distribution supply chain
networks. International Journal of Production Economics, Vol. 111, No. 2, Feb. 2008, pp. 468–483.
17. Haggag, A. A. A variant of the generalized reduced gradient algorithm for non-linear programming
and its applications. European Journal of Operational Research, Vol. 7, No. 2, Jun. 1981, pp. 161–
168.
18. Pillai, R. S., A. K. Rathi*, and S. L. Cohen. A restricted branch-and-bound approach for generating
maximum bandwidth signal timing plans for traffic networks. Transportation Research Part B:
Methodological, Vol. 32, No. 8, 1998, pp. 517–529.
19. Zhou, X., and M. Zhong. Single-track train timetabling with guaranteed optimality: Branch-and-
bound algorithms with enhanced lower bounds. Transportation Research Part B: Methodological,
Vol. 41, No. 3, Mar. 2007, pp. 320–341.
20. Horn, M. E. T. Procedures for Planning Multi-Leg Journeys With Fixed-Route and Demand-
Responsive Passenger Transport Services. World Transit Research, Jan. 2004.
21. Mishra, S., T. V. Mathew, S. Khasnabis, and others. Single-Stage Integer Programming Model for
Long-Term Transit Fleet Resource Allocation. Journal of Transportation Engineering, Vol. 136,
2010, p. 281.
Mishra, S. 22
22. Mathew, T. V., S. Khasnabis, and S. Mishra. Optimal resource allocation among transit agencies for
fleet management. Transportation Research Part A: Policy and Practice, Vol. 44, No. 6, Jul. 2010,
pp. 418–432.
23. PSP. 12. Premium Solver Platform. Frontline Systems, Nevada, USA, 2013.
24. Mishra, S., S. Sharma, S. Khasnabis, and T. V. Mathew. Preserving an aging transit fleet: An
optimal resource allocation perspective based on service life and constrained budget. Transportation
Research Part A: Policy and Practice, Vol. 47, Jan. 2013, pp. 111–123.
25. FTA. Useful Life of Transit Buses and Vans. Publication FTA VA-26-7229-07.1. U.S. Department
of Transportation, Federal TransitAdministration, Washington, D.C., 2007, p. 195.
26. EPA. Transit Bus Efficiency: Climate Leaders Greenhouse Gas Inventory Protocol Offset Project
Methodology. Publication Version 1.3. Washington, D.C., 2008, p. 18.
27. NASDPTS. School Bus Replacement Considerations. National Association of State Directors of
Pupil Transportation Services, Steamboat Springs, CO, USA, 2002, pp. 1–4.