Embed Size (px)
Citation preview

Strategies for Managing N for Improved Nitrogen Use Efficiency in
Spring Wheat
Joel RansomNDSU Extension Agronomist

Background
• Nitrogen is needed by the wheat plant for growth, yield and protein
• Fertilizer is the most expensive direct cost in spring wheat production
• $68 of $190 in 2018 (NDSU for northern valley)
• There is generally a negative relationship between yield and protein
• Environment has a huge effect on N fertilizer requirements but difficult to predict the environment

Relationship between yield and protein for varieties in state yield trials, Langdon and Williston, 2017.
y = ‐0.071x + 18.725R² = 0.3962
8
9
10
11
12
13
14
15
16
50 60 70 80 90 100 110
Protein (%
)
Yield (bu/acre)
Langdon
y = ‐0.2384x + 25.028R² = 0.2942
10
12
14
16
18
20
22
21 23 25 27 29 31 33
Yield (bu/acre)
Williston

y = ‐0.0437x + 17.904R² = 0.3873
8
10
12
14
16
18
20
20 30 40 50 60 70 80 90 100
Protein (%
)
Yield (bu/acre)
Relationship between yield (bu/acre) and protein (%) from spring wheat variety trials conducted in ND in 2017

Slide prepared by D. Franzen

Slide prepared by D. Franzen

Recommendations optimizing yield and protein
• Variety selection• Apply adequate N prior to or at planting• Respond to in‐season N needs• Apply post anthesis foliar N when determined to be profitable

1. Variety Selection for yield and protein• Profitability depends on both yield and protein • Predicting protein premiums not easy
• If everyone has protein, then less premium• If winter wheat quality is low, difference between spring and winter wheat increases, but does not always guarantee a premium for protein
• Yield and protein characteristics are inherent to a variety and are difficult to balance
• Over environments, a variety with above average yield and above average protein will provide the most consistent returns

Relative performance of varieties in MN (averaged over locations) using $5.70/bu price.Highest Yielding Gross return P=.2 Gross return P=.5 Gross return P=1.0 Highest protein
SY Valda SY Valda SY Valda Linkert BollesHRS 3419 HRS 3504 Linkert Bolles TCG‐ClimaxHRS 3504 HRS 3530 WB9479 TCG‐Climax LinkertProsper HRS 3419 HRS 3530 WB9479 RollagShelly Shelly TCG‐Climax HRS 3616 HRS 3616 LCS Prime TCG‐Spitfire Bolles Rollag ND‐VitProWB9653 WB9653 WB9590 WB‐Mayville Dyna‐Gro CaliberTCG‐Spitfire WB9590 WB‐Mayville WB9590 WB9479Faller Prosper Surpass Lang‐MN LCS AnchorLCS Albany LCS Prime Dyna‐Gro Ambush Boost Boost

2‐Apply adequate N –how to determine an optimum N rate
• Use North Dakota Wheat Nitrogen Calculator
• Uses prices of wheat and N fertilizer• Requires fall soil test
• Yield goal = 2.5 lbs N per expected bu yield minus credit and soil test
• Past experience• Adjust for variety grown (higher yielding varieties often require extra N to reach 14% protein)

12
13
14
15
16
17
18
50 70 90 110 130 150 170 190 210
Protein (%
)
N rate (lbs/acre)
Effect of N rate on protein content of four spring wheat varieties, Crookston, MN 2011‐2013 (adapted from Farmaha, Sims and Wiersma, 2016).
Faller Glenn Samson Vantage
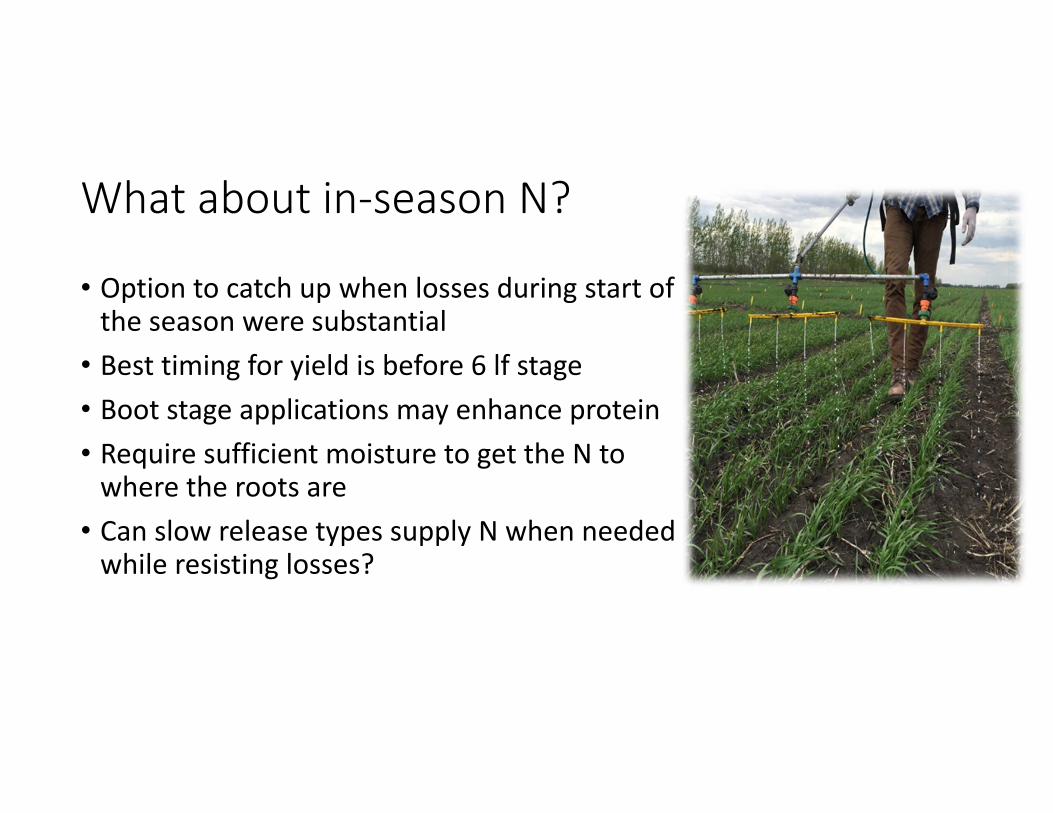
What about in‐season N?
• Option to catch up when losses during start of the season were substantial
• Best timing for yield is before 6 lf stage• Boot stage applications may enhance protein• Require sufficient moisture to get the N to where the roots are
• Can slow release types supply N when needed while resisting losses?

0
10
20
30
40
50
60
70
80
90
No N Base rate At planting 5 lf Boot Flowering
Yield (bu/acre)
Timing
Effect of time of application on 30 Ibs N on yield of spring wheat, two locations in MN, 2017

12
12.5
13
13.5
14
14.5
15
No N Base rate At planting 5 lf Boot Flowering
Protein %
Timing of extra N application
Effect of N timing on protein of spring wheat, average of two locations, 2017.

0
10
20
30
40
50
60
70
80
90
100
Check Urea Spring ESN Spring 50:50Spring
UreaOctober
ESNOctober
50:50October
Urea Nov ESN Nov 50:50 Nov 150% Urea
Yield (bu/acre)
Effect of N source and timing of a 75% N rate (90lb per acre) on yield, Ada, 2017

10
10.5
11
11.5
12
12.5
13
13.5
14
14.5
Check UreaSpring
ESNSpring
50:50Spring
UreaOctober
ESNOctober
50:50October
Urea Nov ESN Nov 50:50Nov
150%Urea
Protien (%
)Effect of N source and timing of a 75% rate of N (90lb
per acre) on protein, Ada, 2017.

3‐ What about post anthesis UAN, does it have a role?• Often increases protein by 0.5 to 1.0%• Most efficient way to increase protein using 30 lb N?
• No impact on yield (negative or positive)• Best timing about 5 days post‐anthesis• Can we predict a need?
• Premiums high• Yields high• Crop running out of nitrogen

14
14.5
15
15.5
16
16.5
70 100 70 + 30 4lf 70 +30 PA
Protein conten
t (%)
Impact of fertilizer nitrogen rate and timing on protein content, two locations in Minnesota, 2015
Ada Argyle Combined

-1.500
-1.000
-0.500
0.000
0.500
1.000
1.500
1999
/00
2000
/01
2001
/02
2002
/03
2003
/04
2004
/05
2005
/06
2006
/07
2007
/08
2008
/09
2009
/10
2010
/11
2011
/12
2012
/13
2013
/14
2014
/15
2014
/15
Prem
ium
or
Dis
coun
t
Date
Daily Protein Spreads for Hard Red Spring Wheat -Minneapolis, MN
June 1, 1999 - Jan. 28, 2016
13% Discount (13% - 14%) 15% Premium (15% - 14%)
Data from USDA-AMSGraph prepared byFrayne Olson - NDSU
Protein premiums and discounts can be substantial and hard to predict.

When does it pay (assuming a 1% protein bump and $30 treatment cost)?
ProteinPremium ($/point)
$30 application cost $20 application cost
‐‐‐‐‐‐‐‐‐‐Bushel per acre yield‐‐‐‐‐‐‐‐‐‐‐
50 70 90 50 70 90
0.25 ($17.50) ($12.50) ($7.50) ($7.50) ($2.50) $2.50
0.50 ($5.00) $5.00 $15.00 $5.00 $15.00 $25.00
0.75 $7.50 $22.50 $37.50 $17.50 $32.50 $47.50
1.00 $20.00 $40.00 $60.00 $30.00 $50.00 $70.00
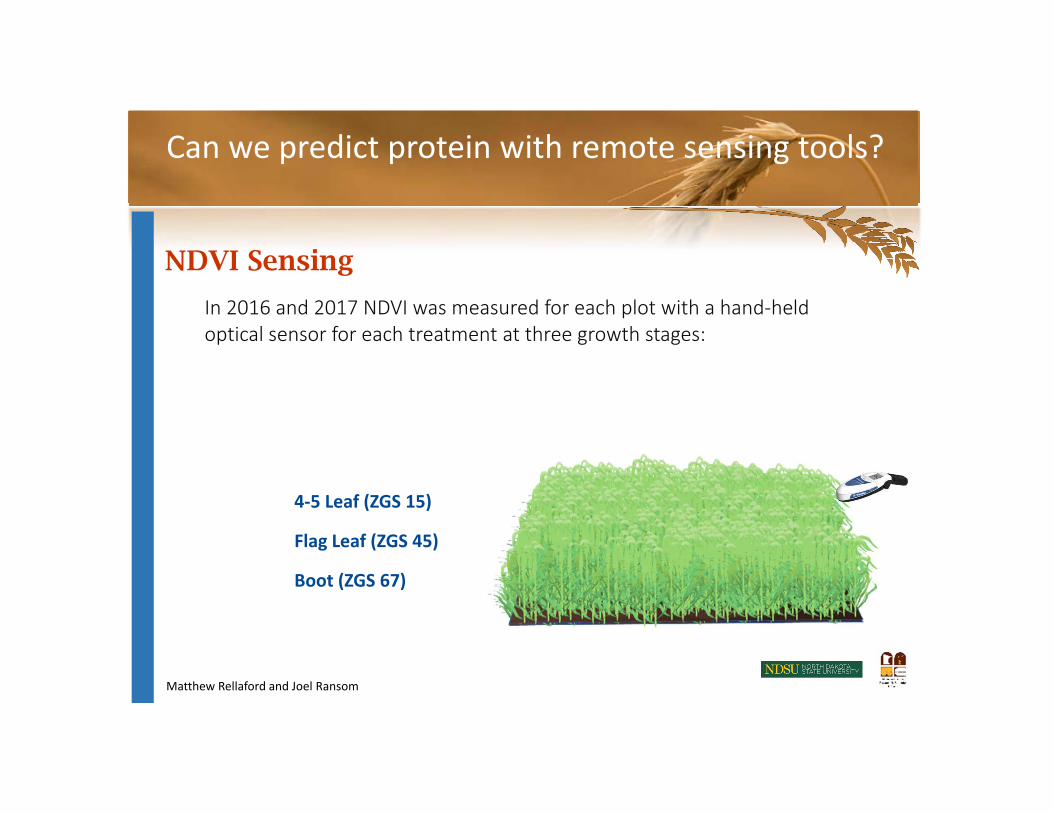
Can we predict protein with remote sensing tools?
NDVI Sensing
In 2016 and 2017 NDVI was measured for each plot with a hand‐held optical sensor for each treatment at three growth stages:
4‐5 Leaf (ZGS 15)
Flag Leaf (ZGS 45)
Boot (ZGS 67)
Matthew Rellaford and Joel Ransom

Predictiveness of NDVI
Matthew Rellaford and Joel Ransom
y = 28.017x ‐ 15.039R² = 0.591
9
10
11
12
13
14
15
0.9 0.92 0.94 0.96 0.98 1 1.02 1.04 1.06
Grain Protein Con
tent (%
)
Boot Stage NDVI Normalized by Rep
Boot NDVI Normalized by Rep vs GPC Red Lake Falls, MN 2016

Matthew Rellaford and Joel Ransom
y = 7.3721x + 6.4483R² = 0.0598
9
10
11
12
13
14
15
16
0.86 0.88 0.9 0.92 0.94 0.96 0.98 1 1.02 1.04
Grain Protein Con
tent %
Boot Stage NDVI Normalized by Rep
NDVI Normalized by Rep vs GPC Casselton, ND 2017
Predictiveness of NDVI

Results & Discussion
NDVI
The variability in the predictive ability of NDVI may be due to environmental differences
• Precipitation
• Soil
#*
#*
#* #*#*
#*
#*
Esri, HERE, DeLorme, MapmyIndia, ©OpenStreetMap contributors, and the GISuser community, Source: Esri, DigitalGlobe,GeoEye, Earthstar Geographics,CNES/Airbus DS, USDA, USGS, AeroGRID,IGN, and the GIS User Community
1
Minnesota1.6 cm
3.4 cm
2.6 cm
8.2 cm
5.1 cm
8.1 cm
Range of Total Protein (GPC x Yield)
NDVI Predictivenessof GPC
R2=0.59**
R2=0.43** R2=0.41**
R2=0.09
R2=0.06R2=0.18**
R2=0.06
2016 Trial
2017 Trial
2016 May
Precipitation
2017 May
Precipitation
393
275597
446
193
285
467
2016 Total
Protein Range
(kg ha‐1)
2017 Total
Protein Range
(kg ha‐1)North Dakota
Matthew Rellaford and Joel Ransom

Proposed Research
N-rich Strip
Matthew Rellaford and Joel Ransom
• The post anthesis application is one tool that allows a grower to respond to developments during the season. Knowing when to use it can significantly impact profitability.
• Can we finally put this past research on predicting protein into a framework that will work at a farm level?
• The research will look at N rich strips and NDVI from drones as key components

What are the costs of N strategies
•UAN $215/ton = $0.38/lb N•Urea $345/ton = $0.375/lb N•ESN $485/ton = $0.55/lb N•Instinct ~$10/acre??

Questions?