Embed Size (px)
Citation preview

STRATEGIES FOR ORGANIZATION, VALIDATION AND DISTRIBUTION OF TRANSIT GEOGRAPHIC INFORMATION SYSTEMS DATA
Jonathan WadeManager, Service Development SupportRegional Transpiration District, Denver, CO
GIS in Transit Conference, October 16-17, 2013, Washington, D.C.

QUALITY STRATEGIES IN SYSTEMS DESIGN
• Base routes and schedules on real, quantitative data to constantly monitor to improve the customer experience
• One database of record for each data element• Use best available database and consolidate data wherever logical• Fix errors at their source• Immediate feedback loops to fix errors• Frequent, automated processes to incorporate revisions and fixes
in downstream systems• Constant and continuous incremental upgrades to data and
systems

BASE ROUTES AND SCHEDULES ON REAL, QUANTITATIVE DATA
• Requirements for persuasive presentations of data:• The data is complete
• Stop data• Ridership data
• The data is accurate• Passes all validation
processes• Updated frequently
• The data is readily available• Uses know where and how to
access the data quickly

CONSTANTLY MONITOR TO IMPROVE THE CUSTOMER EXPERIENCERouting
defined
Timepoints
Trapeze scheduling
Bus stops defined
Bus stops
defined
TIES DB for error
checking, production and data collection
Ridecheck Plus
ridership analysis
and reporting
INIT CAD/AVL /
APCdata
collection
Other schedule
data
TriTapt on-time
performance analysis
Can we improve
the customer
experience?

IMPROVING THE CUSTOMER EXPERIENCE
Scope of GIS and Schedule Data Changes
• 3 Major run boards year (usually in August, January and May)
• 30 to 50 revisions to each run board after voting• Minor changes: footnotes, running time changes• Major changes: rerouting, modifying operator run
• 50-75 Special Services each year (scheduled in Trapeze)• Examples: Broncos Ride (football), Rockies Ride (baseball), etc.
• About 1100 Special Service orders per year (scheduled in TIES)

Points SchedulesLines Polygons
Schedule Development Database (Trapeze)
Production Database(TIES – developed at RTD)
Customer Interfaces
Operations Interfaces
HIGH-LEVEL DATA FLOW• Data entered by Service
Planner/Schedules• Customer interfaces • Trip planners• Web schedules• Paper schedules
• Operations Interfaces • CAD-AVL Systems• Operator pay• Ridership and schedule
adherence systems

GPS BUS STOP DATA FLOWDATABASES OF RECORD FOR STOP DATA
Method 2: GPS Field
Data Collection
Method 1:
Stop Tool Data Entry
Method 3:
Edits
Upload GPS Arc Catalog
Visual GPS Verificatio
n
Append New GPS Data - Shape file
Merge Shape file to Staging Table (Model Builder, Arc Toolbox,
Arc Catalog)
Update SDE Bus Stops in Oracle
Trapeze, database of record for geographic
coordinates and relationships of stops to routes
TIES
Maximus (Asset Works) database of
record for stop names and
stop amenities
Trapeze FX
Processing1. Sequence on route
2. Extract stops on patterns 3. Calculate distance
4. Calculate estimated stop times for each trip
Coordinates only
No Coordinates Convert stop names to all upper case
Convert stop names from upper
case
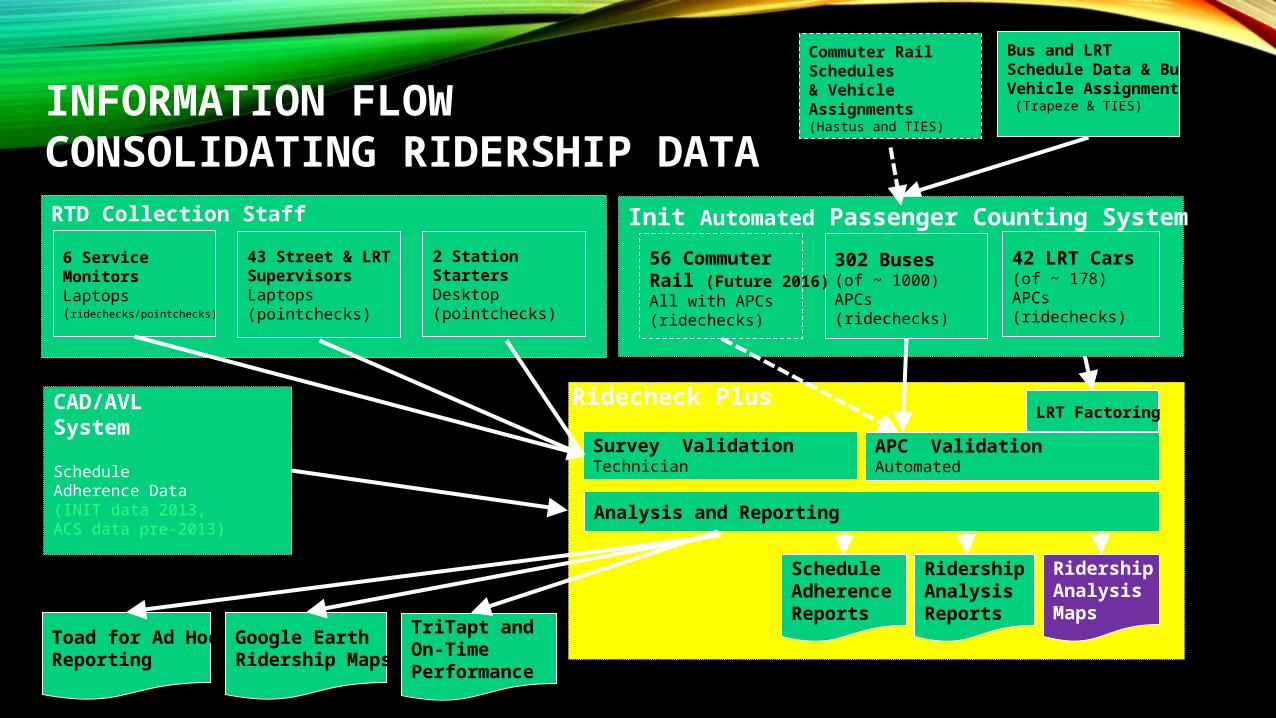
RTD Collection Staff
43 Street & LRTSupervisorsLaptops (pointchecks)
6 ServiceMonitors Laptops (ridechecks/pointchecks)
2 StationStartersDesktop(pointchecks)
Bus and LRT Schedule Data & Bus Vehicle Assignments (Trapeze & TIES)
CAD/AVLSystem
Schedule Adherence Data (INIT data 2013, ACS data pre-2013)
Schedule Adherence Reports
Ridership Analysis Reports
Ridership Analysis Maps
Init Automated Passenger Counting System
302 Buses(of ~ 1000)APCs(ridechecks)
42 LRT Cars(of ~ 178)APCs(ridechecks)
LRT Factoring
APC ValidationAutomated
Survey ValidationTechnician
Analysis and Reporting
INFORMATION FLOW CONSOLIDATING RIDERSHIP DATA
Google EarthRidership Maps
TriTapt andOn-Time Performance
Toad for Ad Hoc Reporting
56 CommuterRail (Future 2016)All with APCs(ridechecks)
Commuter Rail Schedules& Vehicle Assignments(Hastus and TIES)
Ridecheck Plus

Points SchedulesLines Polygons
Schedule Development Database (Trapeze)
Production Database(TIES – developed at RTD)
Customer Interfaces
Operations Interfaces
New Validation Needed?
Errors?
FIX ERRORS AT THEIR SOURCE• Validations conducted as
data is created• On demand by scheduling
staff• Currently 65 custom
validations for route, pattern, trip, block, time point and run cut data
• Adding a new validation rule at the rate of about one a month
Data Valid?

IMMEDIATE FEEDBACK LOOPS TO FIND AND FIX ERRORS
• Automated queries check schedule data via a web-based interface
• Suite of validations complete in about a minute
• On demand by Schedulers/Planners
• Summarizes errors and provides drill-down for details

FREQUENT, AUTOMATED PROCESSES TO INCORPORATE REVISIONS AND FIXES
Daily or more frequent update
• Stop data • Every 3 hours
• Customer schedules on website
• Customer schedules on mobile website
• Electronic passenger information displays
Every few days to weekly update• 2-3 times a week
• Dispatch electronic schedules
• Operator web site
• Weekly• CAD-AVL data for
operations• External GIS
System Map
Less frequently, less automated• Internal Trip Planner
• Every other month• Goal is weekly in
2014
• External Trip Planner• About Monthly• Goal is weekly in
2014
• GTFS• About Monthly• 3 week lag time a
major hindrance

BENEFITS OF APPROACH• Credibility, better decision making• All stakeholders within RTD are working with the same data• Reporting can consider a variety of data sources at one time• Minimizes frustration by eliminating errors before they get to downstream systems• The persons most likely to have created the error gets information needed to fix it quickly• Customers and operations benefit from accurate, timely schedule and GIS data