Embed Size (px)
Citation preview

Strategies for training or supporting teachers to integrate technology into the classroom
Sujata GamageTushar Tanwar
September 2017
i
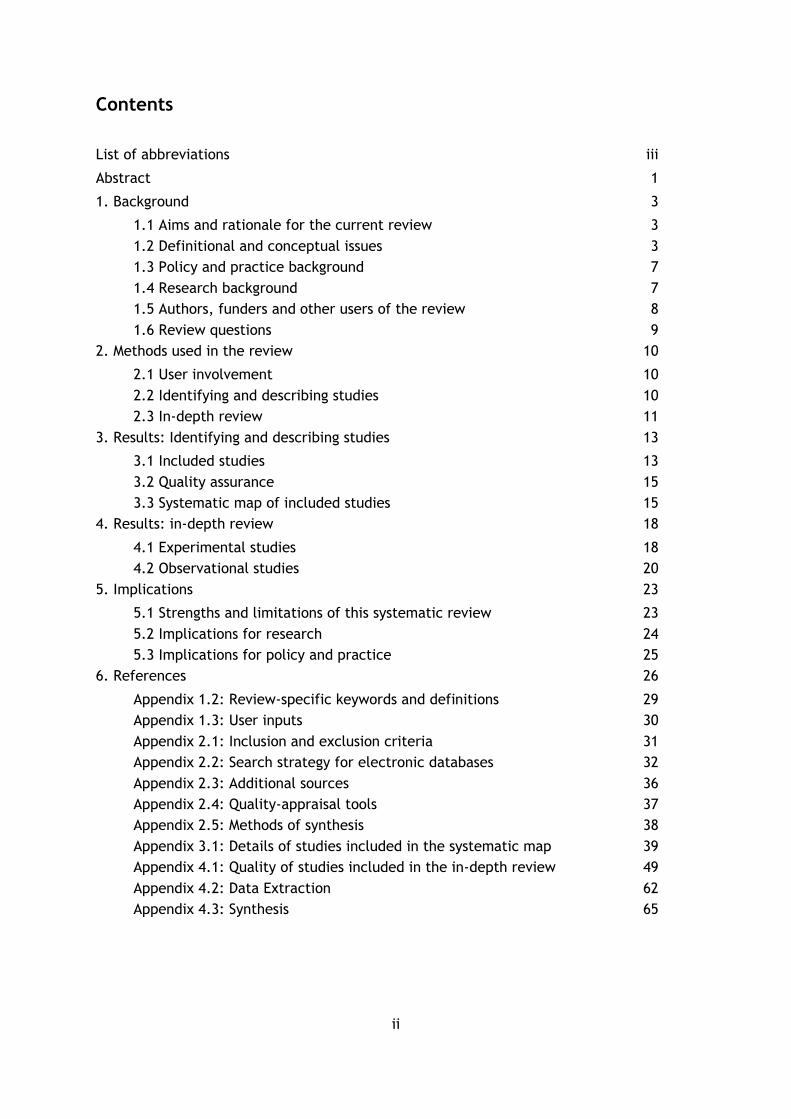
This systematic review was commissioned by LIRNEasia. This work was carried out with a
grant from the International Development Research Centre (IDRC) of Canada and the
Department for International Development (DfID) of the UK. The views expressed do not
necessarily reflect the views of these departments. The authors are part of LIRNEAsia, Sri
Lanka and IIM, Bangalore, India.
This paper can be found on the DFID Research for Development website:
http://r4d.dfid.gov.uk/ and the EPPI-Centre website: http://eppi.ioe.ac.uk/
The authors of this review are:
Sujata Gamage
Tushar Tanwar
This report should be cited as:
Gamage SN, Tanwar T (2017) Strategies for training or supporting teachers to integrate
technology into the classroom. International Development Research Centre, Ottawa,
Canada, and the Department for International Development, UK.
© Copyright
Authors of the review hold the copyright for the text of the review. The authors give
permission to display and print the contents of the review for their own non-commercial
use, providing that the materials are not modified, copyright and other proprietary notices
contained in the materials are retained, and the source of the material is cited clearly
following the citation details provided. Otherwise users are not permitted to duplicate,
reproduce, re-publish, distribute, or store material from this review without express written
permission.
ii
Contents
List of abbreviations iii
Abstract 1
1. Background 3
1.1 Aims and rationale for the current review 3
1.2 Definitional and conceptual issues 3
1.3 Policy and practice background 7
1.4 Research background 7
1.5 Authors, funders and other users of the review 8
1.6 Review questions 9
2. Methods used in the review 10
2.1 User involvement 10
2.2 Identifying and describing studies 10
2.3 In-depth review 11
3. Results: Identifying and describing studies 13
3.1 Included studies 13
3.2 Quality assurance 15
3.3 Systematic map of included studies 15
4. Results: in-depth review 18
4.1 Experimental studies 18
4.2 Observational studies 20
5. Implications 23
5.1 Strengths and limitations of this systematic review 23
5.2 Implications for research 24
5.3 Implications for policy and practice 25
6. References 26
Appendix 1.2: Review-specific keywords and definitions 29
Appendix 1.3: User inputs 30
Appendix 2.1: Inclusion and exclusion criteria 31
Appendix 2.2: Search strategy for electronic databases 32
Appendix 2.3: Additional sources 36
Appendix 2.4: Quality-appraisal tools 37
Appendix 2.5: Methods of synthesis 38
Appendix 3.1: Details of studies included in the systematic map 39
Appendix 4.1: Quality of studies included in the in-depth review 49
Appendix 4.2: Data Extraction 62
Appendix 4.3: Synthesis 65
iii
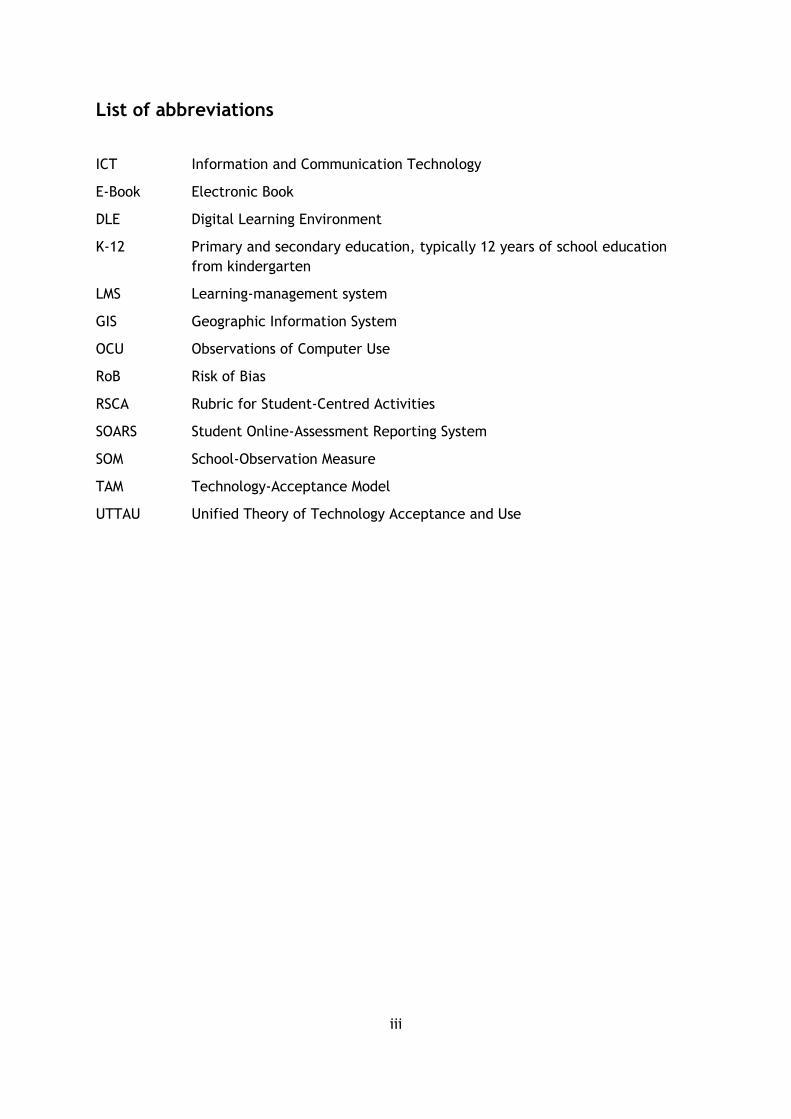
List of abbreviations
ICT Information and Communication Technology
E-Book Electronic Book
DLE Digital Learning Environment
K-12 Primary and secondary education, typically 12 years of school education
from kindergarten
LMS Learning-management system
GIS Geographic Information System
OCU Observations of Computer Use
RoB Risk of Bias
RSCA Rubric for Student-Centred Activities
SOARS Student Online-Assessment Reporting System
SOM School-Observation Measure
TAM Technology-Acceptance Model
UTTAU Unified Theory of Technology Acceptance and Use
1
Abstract
The review question
ICT for education holds great potential in terms of improving student-learning outcomes,
but the results to date have been less than spectacular. Perhaps in response, more
attention is now being paid to teachers' roles as intermediaries in the use of ICT in
education. Through our systematic review, we seek to discover what has worked in terms
of strategies for training and/or supporting teachers, and to what effect.
Who wants to know and why?
Teacher-training colleges wishing to train teachers in technology use; school
administrators wishing to introduce specific technologies into their schools or school
systems; corporate donors and other stakeholders in education; and policymakers at the
international, national, or regional level would be interested in the answers to the
research question.
Methods of the review
We searched five electronic databases (ERIC, EBSCO, SCOPUS, SSCI and Proquest), and
hand-searched a selected set of other sources including scholar.google.com. In the title
and abstract screening step, we included all empirical studies that measure technology
use in primary or secondary education and published in 1990 or after, and excluded
sources such as book reviews or textbooks that dealt with theoretical issues only, studies
that were about technology use by pre-service teachers or studies that were about
technology use in special education.
After the screening, we mapped out all the included studies according to the type of study
designs in addressing the review questions. After the mapping exercise, a second set of
inclusion/exclusion criteria was developed and applied to the observational studies that
specified the technology and used a technology acceptance model or Technology-
Acceptance Model (TAM)-based theory of change and excluded all other observational
studies.
We used the Risk of Bias assessment tool developed by Waddington and Hombrados (2014)
to assess the internal validity of both experimental and observational studies. The effect
size of the interventions and the effect of other miscellaneous factors on the outcome
were both calculated using the standardized mean difference (SMD) method.
Results
A search for studies evaluating the impact of technology use in classrooms and published
between 1990 and July 2014 yielded 11,419 citations. Initial screening led to 64 citations,
for all of which we were able to obtain full reports or extended abstracts. After a follow-
up screening and quality-appraisal steps, three experimental studies (from two reports)
and eight observational studies (from seven reports) were identified as being of sufficient
internal and external validity for statistical synthesis.
The experimental studies show that teacher training, along with facilitating conditions in
the form of (1) one laptop per child or (2) on-site coaches, increase technology integration
2
by effect sizes of +0.49 to +1.31 as compared to the control situations with no such
facilitation. An effect size of 0.2 to 0.3 is considered a "small" effect; 0.5 a "medium"
effect and 0.8 to infinity, a "large" effect, under certain conditions (see, for example,
Sullivan and Feinn 2014). The effect sizes found in the present review can be considered
medium-to-large. The costs of the interventions were not reported.
The observational studies exploring the various factors affecting the use of technology by
teachers showed that teachers' perceptions regarding the usefulness of a particular
technology is twice as important as their perception of the ease of use of that technology
in the classroom, if the technology is specified and related to a specific teaching or
learning use. It is difficult to make generalizations when the technology intervention is not
specified and not related to a specific use.
Implications
Studies on the effect on student learning of ICT use in the classroom are often conducted
without exploring the logical requirement of acceptance and use of ICT by teachers.
Eight observational studies from Belgium (4), Netherlands (1), Singapore (1), South Korea
(1) and Taiwan (1) point to the importance of teachers' perceptions regarding the
usefulness and the ease of use of a technology, with perceptions of usefulness being twice
as important as perceptions of ease of use, underscoring the importance of understanding
and responding to "teacher factors" in the effective use of ICT in improving student-
learning outcomes.
Three experimental studies, all from the US, are seemingly more concerned with the ease-
of-use aspects. They show that teachers use ICT in increased amount if professional
development of ICT use is accompanied by adequate follow-up support for the teachers, or
provision of one laptop per child in the classroom. While more attention should be paid to
teachers' perceptions of usefulness in introducing ICTs in system-wide initiatives, such
initiatives should be planned and executed as experiments to evaluate the effect of ICT on
teacher perceptions and the effect of perceptions and/or use on student-learning
outcomes.
3
1. Background
1.1 Aims and rationale for the current review
ICT for education holds much promise for improving student-learning outcomes, but the
results to date have been less than spectacular (see Bingimalas 2009, Cheung and Slavin
2013, Lagrange et al. 2001, Means 2010, Tamim et al. 2013, Tolani-Brown et al. 2009 and
also OECD 2015).
Perhaps in response, more attention is now paid to teachers' roles as intermediaries in the
use of ICT in education. More recent research includes a series of in-depth studies
originating from Europe (for example, Van der Linde 2014) and many unpublished PhD
theses from faculties of education in the US (for example, Tweed 2013).
Through our systematic review, we intend to discover what has worked in respect of
strategies for training and/or supporting teachers, and to what effect. Strategies of
interest include various modes of professional development and other facilitating
conditions to influence technology acceptance and use by teachers.
1.2 Definitional and conceptual issues
1.2.1 Theories of technology use
In a paper introducing a Unified Theory of Technology Acceptance and Use (UTTAU),
Venkatesh et al. (2013) identified three major theories prevalent at time of publication:
the Technology-Acceptance Model (TAM), Social Cognition Theory and Innovation Diffusion
Theory. Other theories found in the literature are the Expectancy Value Theory and the
Technology, Pedagogy, Content Knowledge (TPCK) framework. In describing and coding
reports included in the review, we will be noting which of these theories or their
variations, or which other theories, are used in those reports.
1.2.1.1 TPCK framework
The TPCK framework (Koehler and Mishra 2007) is found in many PhD theses emerging
from colleges of Education (Fordham 2004, Hastings 2009, Hong 2009 and Johnson 2006).
The TPCK framework seems to stand on its own. The other theories discussed in this
section are related to each other and addressed in the paper by Venkatesh et al. (op cit.)
to develop the UTTAU framework.
1.2.1.2 Social Cognition Theory
Social Cognition Theory is a learning theory based on the idea that people learn by
observing others. The observed behaviour of an individual is influenced by the interaction
of the following three determinants: (1) Personal: whether the individual has high or low
self-efficacy toward the behaviour; (2) Behavioural: the response an individual receives
after they perform a behaviour); and (3) Environmental: aspects of the environment or
setting that influence the individual’s ability successfully to complete a behaviour
(Bandura 1986).
Many variations of Social Cognition Theory are used in the "ICT for education" literature,
with self-efficacy used as a key determinant of ICT use (see, for example, Tweed 2013).
Self-efficacy is defined as people's beliefs about their capabilities to produce designated
4
levels of performance that exercise influence over events that affect their lives (Bandura
1994). The TPCK model, or the idea that the technological, pedagogical and content
knowledge of the teachers are determinants of technology acceptance, is one variation of
self-efficacy-based theory (Koehler and Mishra 2007).
1.2.1.3 Innovation diffusion theory (IDT)
According to Rogers (2003), the characteristics of an innovation as perceived by the
members of a social system determine its rate of adoption. These characteristics are
relative advantage, compatibility, complexity, trialability and observability. When an
innovation is perceived by users to have these attributes, it is more likely to be adopted.
In a review of different models of technology acceptance, Venkatesh et al. (2003) found
that the complexity attribute in IDT overlaps with the Perceived Ease of Use (PEoU)
attribute in their model, and, in fact, all the IDT attributes can be captured by the UTAUT
model.
1.2.1.4 Expectancy Value Theory
According to Wozney et al. (2003), models of expectancy-value have largely been applied
to industrial and occupational settings and have been found to be an accurate predictor of
productivity. They applied the theory to technology use by teachers and rationalized this
choice as follows:
Innovations are more likely to be adopted if the perceived value of the innovation and the
likelihood (or expectancy) of success are high, as well as if these benefits outweigh the
perceived costs of implementation. That is to say, teachers’ decisions to use an
innovation, such as computer technology, in the classroom relate to (a) how highly they
value the innovation; (b) how successful they expect their application of the innovation to
be; and (c) how highly they perceive the costs of implementation and use to be.
1.2.1.5 Technology Acceptance Models
The Technology Acceptance Model (TAM) by Davis (1989) is essentially an application of
the Theory Reasoned Action (TRA) by Fishbein and Ajzen (1975) in relation to the
acceptance of technology. According to the 1975 version of TRA, intention regarding a
behaviour is the strongest predictor of a particular behaviour and that intention, in turn,
is determined by attitude towards the behaviour. In the case of technology acceptance by
a teacher, the two attitude determinants are perceived usefulness and perceived ease of
use of the technology by the teacher.
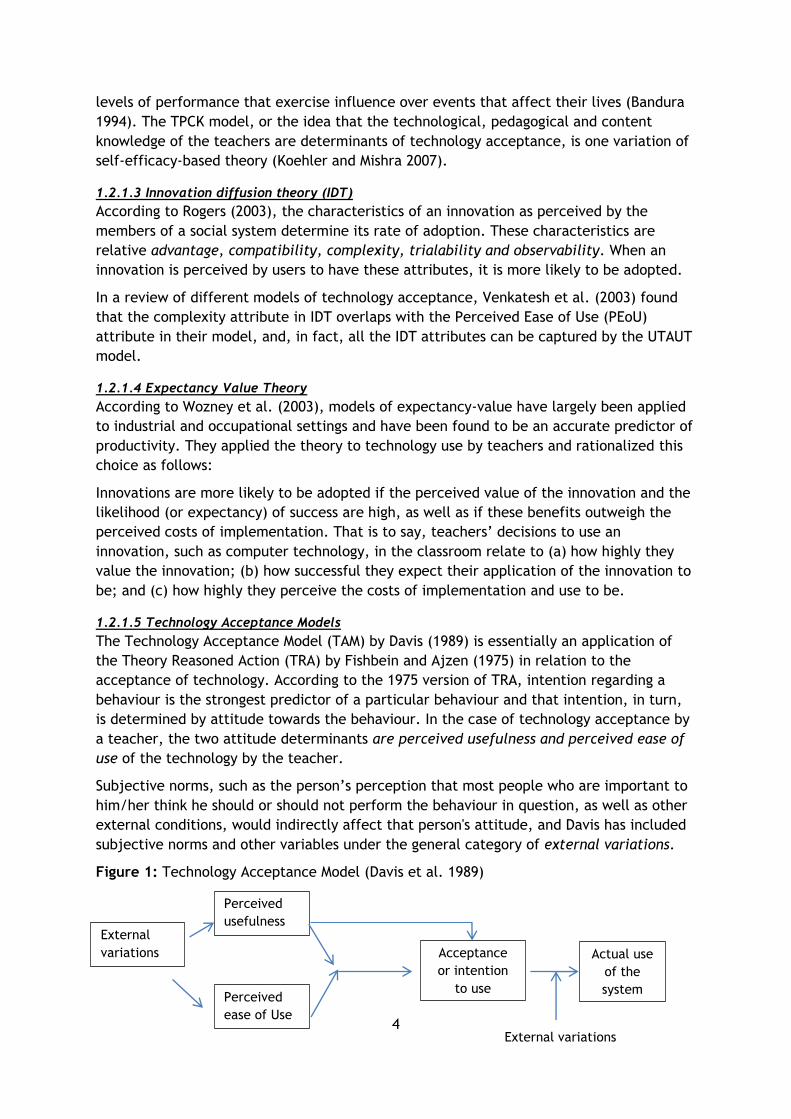
Subjective norms, such as the person’s perception that most people who are important to
him/her think he should or should not perform the behaviour in question, as well as other
external conditions, would indirectly affect that person's attitude, and Davis has included
subjective norms and other variables under the general category of external variations.
Figure 1: Technology Acceptance Model (Davis et al. 1989)
External variations
External
variations
Perceived
ease of Use
Perceived
usefulness
Acceptance
or intention
to use
Actual use
of the
system
5
To improve the explanatory power of the TAM model, Venkatesh, Davis and others (2003),
evaluated 12 other models used in the literature to come up with what they called the
Unified Theory of the Acceptance and Use of Technology (UTAUT).
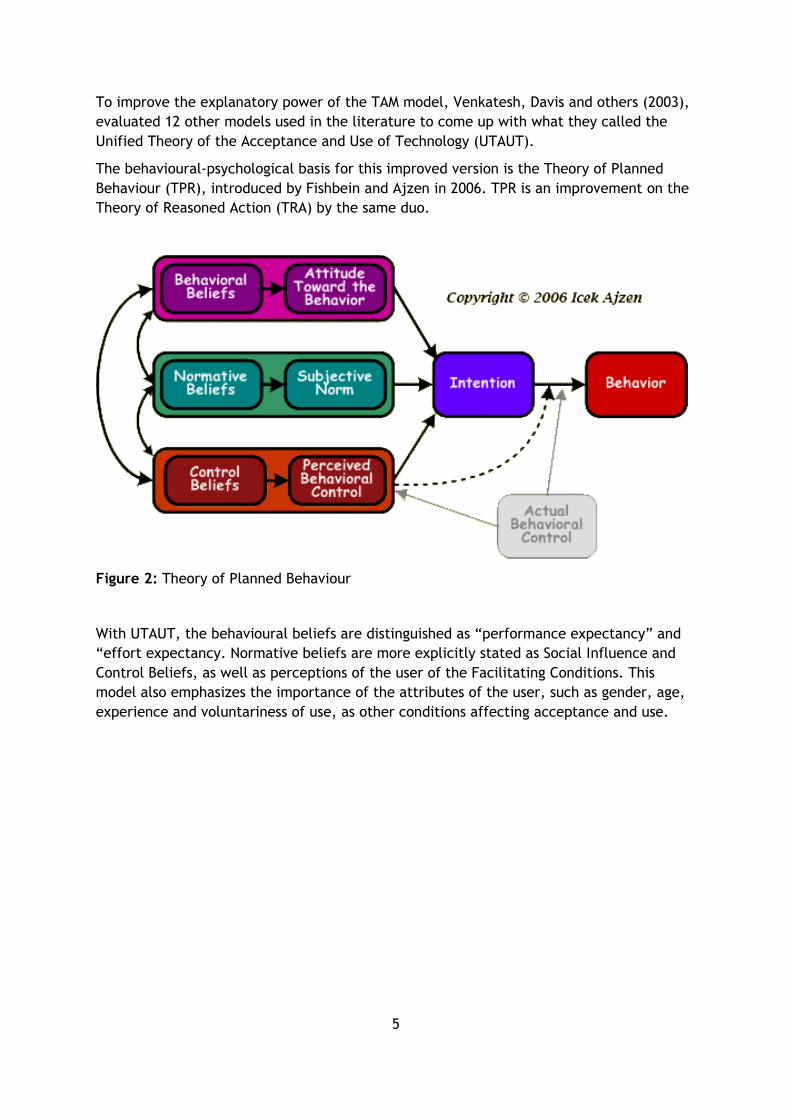
The behavioural-psychological basis for this improved version is the Theory of Planned
Behaviour (TPR), introduced by Fishbein and Ajzen in 2006. TPR is an improvement on the
Theory of Reasoned Action (TRA) by the same duo.
Figure 2: Theory of Planned Behaviour
With UTAUT, the behavioural beliefs are distinguished as “performance expectancy” and
“effort expectancy. Normative beliefs are more explicitly stated as Social Influence and
Control Beliefs, as well as perceptions of the user of the Facilitating Conditions. This
model also emphasizes the importance of the attributes of the user, such as gender, age,
experience and voluntariness of use, as other conditions affecting acceptance and use.
6
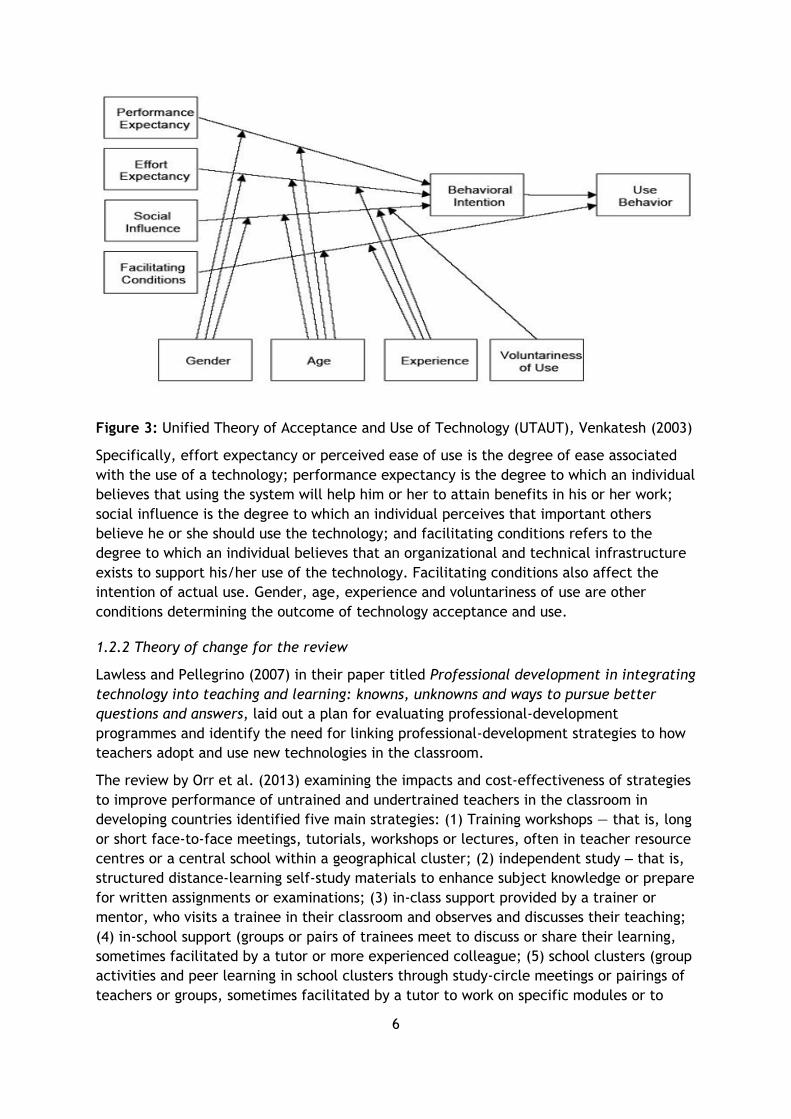
Figure 3: Unified Theory of Acceptance and Use of Technology (UTAUT), Venkatesh (2003)
Specifically, effort expectancy or perceived ease of use is the degree of ease associated
with the use of a technology; performance expectancy is the degree to which an individual
believes that using the system will help him or her to attain benefits in his or her work;
social influence is the degree to which an individual perceives that important others
believe he or she should use the technology; and facilitating conditions refers to the
degree to which an individual believes that an organizational and technical infrastructure
exists to support his/her use of the technology. Facilitating conditions also affect the
intention of actual use. Gender, age, experience and voluntariness of use are other
conditions determining the outcome of technology acceptance and use.
1.2.2 Theory of change for the review
Lawless and Pellegrino (2007) in their paper titled Professional development in integrating
technology into teaching and learning: knowns, unknowns and ways to pursue better
questions and answers, laid out a plan for evaluating professional-development
programmes and identify the need for linking professional-development strategies to how
teachers adopt and use new technologies in the classroom.
The review by Orr et al. (2013) examining the impacts and cost-effectiveness of strategies
to improve performance of untrained and undertrained teachers in the classroom in
developing countries identified five main strategies: (1) Training workshops — that is, long
or short face-to-face meetings, tutorials, workshops or lectures, often in teacher resource
centres or a central school within a geographical cluster; (2) independent study ‒ that is,
structured distance-learning self-study materials to enhance subject knowledge or prepare
for written assignments or examinations; (3) in-class support provided by a trainer or
mentor, who visits a trainee in their classroom and observes and discusses their teaching;
(4) in-school support (groups or pairs of trainees meet to discuss or share their learning,
sometimes facilitated by a tutor or more experienced colleague; (5) school clusters (group
activities and peer learning in school clusters through study-circle meetings or pairings of
teachers or groups, sometimes facilitated by a tutor to work on specific modules or to
7
discuss practice). Since the desired outcome in their review is broadly defined as
performance, the strategies identified are equally broad. What is missing is a theory or
theories of change as to how the professional-development interventions may lead to
behavioural change in teachers.
In the protocol for the present systematic review, we left the theory of change loosely
defined as "A training of a support intervention that would lead to teacher change, where
teacher change is a change in the teacher's behaviour and the desired behaviour is the
integration of technology in the classroom."
It was necessary to leave the theory of change undefined, because each study may involve
its own theory of change in relation to intervention. A mapping of included reports was
used to select one or more prevalent theories of change for the review.
1.3 Policy and practice background
The potential of ICT in terms of its application for basic education1 is of much interest
from a development perspective, since completion of basic education is widely accepted
as a necessary condition for development (UNESCO2). The objective of using ICT in
education is to improve student-learning outcomes, but, according to the large body of
reviews on the success or otherwise of various technology interventions (for example,
Lagrange et al. 2001, Means 2010, Tolani-Brown et al. 2009), the promise of ICT has not
been borne out. Studies of governmental interventions in the US, Canada, the UK and
Europe corroborate these academic studies. In spite of massive efforts by these
governments to provide technology to schools, the results have been disappointing
(European Commission 2013, Means 2002 and 2010, Ringstaff and Kelley 2002, Robertson
2002, Ungeleider 2002, OECD 2015).
1.4 Research background
Tamim et al. (2013), in their review of the impact of ICT on education, noted that, since
the early 1980s, thousands of studies have compared computing and non-computing
classrooms to see what impact technology has had in a face-to-face setting. To make
sense of these disparate investigations, many researchers performed meta-analysis on
these studies. Eventually, the number of meta‐analyses themselves rose to over 60. The
review by Tamim et al. included a second-order meta-analysis of a selected set of 25
meta-analyses, in order to capture the combined effect of 1,055 primary studies. They
find the average effect size associated with direct-instruction utilization of technology at
+0.35, a moderate effect size.3 In a more conventional systematic review of the literature
on the impact of tablets on learning, Tamim et al. (2015) found higher effect sizes:
A significant average effect size was found for studies comparing tablet-use contexts with
no-tablet-use contexts (g+ = 0.23, k = 28). For studies comparing two different uses of
1According to UNESCO’s International Standard for Classification of Education (ISCED), basic education is
primary education covering six years of full-time schooling (age of entrance normally being not younger than
five years or older than seven), followed by three years of lower-secondary schooling.
2http://www.unesco.org/new/en/unesco/themes/icts/
3 Low:0.0-0.2; Med:0.3-0.5; High: 0.6-2.0. Source: http://www.uccs.edu/lbecker/effect-size.html.
8
tablets by students, the average effect size (g+ = 0.68, k = 12) showed a significant
favouring of more student-centred pedagogical use of technology.
In contrast, systematic reviews of technology interventions targeting specific outcomes,
such as learning of mathematics, results are disappointing (Cheung and Slavin 2013).
Perhaps in response to the conflicting reports on technology and learning-outcome gains,
there is an emerging recognition that learning outcomes indeed depend on how well
teachers integrate technology into the classroom.
Reviewers and researchers often treat the limited time devoted to technology as an
implementation problem, but perhaps it speaks to a fundamental problem that separate
CAI programs are not well accepted or seen as central to instruction by teachers, so
teachers may not make sure that students get the full amount of time on technology
recommended by vendors. Future studies should investigate more closely the impact of
the time and integration factors for various grade levels. (Cheung and Slavin 2013)
Lack of attention paid to acceptance of technology by teachers seems to be an old
problem. In their study of Integrated Learning Systems (ILS), Van Dusen and Worthen
(1995) found that few teachers followed the actual ILS-usage guidelines. As a
consequence, students typically only ended up spending between 15% and 30% of the
recommended time on the computer. Some used a computer for less than 10 minutes per
week. Teachers, who often saw ILS as supplemental technology, rarely integrated ILS
instruction into regular classroom instruction.
There is, indeed, a large body of literature on technology acceptance or non-acceptance
by teachers and the factors affecting their behaviour. Unfortunately, that literature seems
to exist independently of the literature on computer use and learning outcomes.
Sheingold and Hadley (1990) surveyed teachers who were considered exemplars in the
application of ICT in order to identify good practices and learn about the obstacles faced
by teachers. More recent studies include a series of in-depth studies originating from
Europe (for example, Van der Linde 2014) and many unpublished PhD theses from faculties
of education in the US (for example, Tweed 2013).
In an effort to develop a typology of studies, Lagrange et al. (2000) analysed 671 studies
on technology use published in the period 1990-94. They found that two-thirds of the
studies dealt with descriptions of innovations and only one-third to be research-based.
They noted that “Innovations present a wealth of ideas and propositions whose diffusion is
problematic; research struggles to tackle the complexity of the integration of evolving
technologies.”
Since then, there have been attempts to summarize the literature on the teacher
dimension in the use of technology in the classroom (see, for example, Bingimalas 2009
and Tondeur et al. 2013), but, to our knowledge, no systematic review has been
undertaken.
1.5 Authors, funders and other users of the review
Institution:
LIRNEasia is a pro-poor, pro-market think-tank with the mission of catalysing policy change
through research to improve people’s lives in the emerging Asia Pacific, by facilitating
9
their use of hard and soft infrastructures through the application of knowledge,
information and technology
Authors:
Sujata Gamage, PhD MPA, specializes in data analytics for public policy, including scoping
studies, systematic reviews and institutional research using statistical methods and
simulations, with a focus on education, research and research networks. She is currently
the Team Leader of the Human Capital Research Programme at LIRNEasia, a regional
think-tank based in Colombo, Sri Lanka.
Tushar Tanwar is a doctoral student specializing in Quantitative Methods at IIM Bangalore,
India. Her research interests include applications of Operations Research and Statistical
Modelling in management, especially in the healthcare sector. She is currently working on
her thesis on Optimal Healthcare Pricing.
Funders:
This work was carried out with a grant from the International Development Research
Centre (IDRC) of Canada and the Department for International Development (DfID) of the
UK.
Users:
Some of the users are included in Appendix 1.3.
1.6 Review questions
Two review questions follow from the title of the systematic review:
1. Which strategies are used to train and/or support teachers to integrate ICT in the
classroom?
3. How has each strategy impacted the success of teachers in integrating ICT in the
teaching-learning process?
10
2. Methods used in the review
Outline of chapter
This chapter presents the method used in the review including user involvment,
identifying and describing studies, data extraction and quality appraisal and synthesis.
2.1 User involvement
There was no direct involvement of users in the review process, except at a dissemination
event held on 26 November 2015 in committee room D of the Bandaranaike Memorial
International Conference Hall in Colombo, attended by stakeholders in ICT for education in
Sri Lanka, Bangladesh and Singapore (APPENDIX 1.2). Presentation of this report was
improved as a result of input from that meeting.
2.2 Identifying and describing studies
2.2.1 Inclusion/exclusion criteria
The inclusion and exclusion (I/E) criteria for the study were derived from the research
question of interest and presented in Appendix 1.1. The criteria for title and abstract
screening were applied in two different stages. First, we included any citations that (1)
concern integration of technology in a classroom, school or school system; (2) were
published in 1990 or later; or (3) focus on primary, secondary education. We excluded any
citations that consist of an entirely secondary source only (that is, book reviews or
textbooks) or deal with theoretical issues only, and studies concerning technology use in
tertiary institutions, including the technology use by pre-service teachers or technology
use in special education.
A second set of I/E criteria was applied in a second round of title and abstract screening
(with full-text screening as needed), where we included only experimental or
observational reports that measured technology use in the classroom.
A third set of I/E criteria were developed using a mapping exercise. Here, all included
citations were downloaded as full texts and the reports were coded and mapped according
to the study design, specificity of the technology, and the theory of change used in one or
more studies in each report. Noting the need for a third screening step, we included all
experimental or quasi-experimental studies, but excluded observational studies that did
not specify the technology or used TAM or a related theory of change (see Appendix 1.3
for definitions of types of studies). This last focus was necessary, since the theories of
change used in observational studies were broad and varied, and only those that used TAM
were comparable in respect of the relationships explored.
2.2.2 Search strategy
Searches were carried out using established research databases (Appendix 2.2), as well as
the grey literature from the three additional sources: (1) scholar.google.com, (2) selected
institutional databases and (3) ICT4D development projects (Appendix 2.3).
The research-database search was carried out with the assistance of a data scientist. The
databases used include ERIC, SCOPUS, SSCI and ProQuest. The instructions to the data
scientist were to capture as many records as possible under the criteria “Teacher AND [ICT
11
OR Technology] AND [Integration OR Adoption] AND [Training OR Development]”,
published between 1990 and the day of the search in 2014. Details of search terms are
given in Appendix 2.2.
The grey-literature search was carried out using the same ““Teacher AND [ICT OR
Technology] AND [Integration OR Adoption] AND [Training OR Development]” search terms.
2.2.3 Title and abstract screenings I & II
Three sets of I/E criteria were used in the screening. The first two sets of I/E criteria were
applied to the titles and abstracts in consecutive steps. Where we had insufficient
information to confirm inclusion or exclusion, full reports were obtained. An electronic-
review system provided by the EPPI Centre was used to keep track of reports during the
screening.
2.2.4 Full-report acquisition and mapping
Full reports were obtained for the citations identified after the first two screening steps,
and the reports were mapped according to the attributes relevant to the present
systematic review. EPPI-Centre (2003) Core Keywording Strategy: version 0.9.7 was used,
where applicable for definitions of the attributes. A systematic map of the reports was
derived by summarizing the number of papers included according to the choses attributes
such population, intervention and study design. Coding and mapping results from full-
document screening were recorded on Microsoft Excel software.
2.2.5 Full-text screening
A third set of I/E criteria, based on the specificity of the technology and theory of change,
was developed after reviewing the map of the included reports. This third set of I/E
criteria were applied to each of the studies in the included reports for a full-text
screening and generating the final list of studies to be included for the in-depth review.
2.2.6 Quality assurance
Application of the 'I/E criteria' and the keywording were conducted by pairs of review-
group members working independently and then comparing their decisions and coming to a
consensus. In-depth review was carried out by the two co-authors in consultation with
each other.
2.3 In-depth review
In the in-depth-review step, the included studies from the third screening were evaluated
for internal and external validity, followed by data extraction and synthesis. The in-depth
review, including data extraction and synthesis of data reported on effects was also
carried out using Microsoft Excel software. The Forest plots were produced using Stata
software (REF).
2.3.1 Assessing quality and relevance
We used the 3ie Risk of Bias assessment tool designed by Waddington and Hombrados
(2014) to assess the internal validity of the studies. The 3ie Tool consists of seven
categories of bias: (1) sample-selection bias; (2) confounding-variables bias (3) motivation
12
bias or Hawthorne effect; (4) spill-over bias (5) reporting bias and (6) other risks of bias,
such as placebo effects, courtesy bias, survey effects, inadequate survey instruments,
etc.; and (7) bias due to misinterpretation of significance of effects (see Appendix 2.4 for
details).
For the first two criteria, the risk of bias was rated: 1-High, 2-Medium and 3-Low, and all
other biases were rated together as "'other" biases. If any of the three biases received a
"high" rating, such studies were excluded. All studies included in the in-depth review were
extracted and quality-assessed independently by two authors of this review. Discrepancies
were resolved through discussion. External validity with regard to review questions was
evaluated and it was noted whether they were negative or positive
2.3.2 Data extraction
The data-extraction step included the following variables:
Experimental studies: population, intervention, comparisons and outcomes, including
effect sizes and standard errors.
Observational studies: the variables of perceived ease-of-use; perceived usefulness; social
influence; facilitating conditions; gender; age; experience; voluntariness and other
variables, as indicated in the studies contained in the reports and statistical results
associated with those variables.
2.3.3 Synthesis of evidence
In development research, there are two major methods of calculating effect size: (1)
response ratio and (2) standardized mean difference (SMD). Where effect sizes were not
reported, they were calculated using the SMD method, as given in Appendix 2.5.
2.3.4 Quality assurance
The data-extraction and synthesis steps were carried out jointly by the two authors in
consultation with each other.
2.3.5 Deriving conclusions and implications
The conclusions and implications were modified upon review received from EPPI, for a
first draft of this report. The results were also presented to LIRNEasia researchers at an
internal colloquium to receive their inputs regarding the conclusions made. A stakeholder
consultation was held on 26 November 2015, to receive further inputs before finalizing the
conclusions and implications.
13
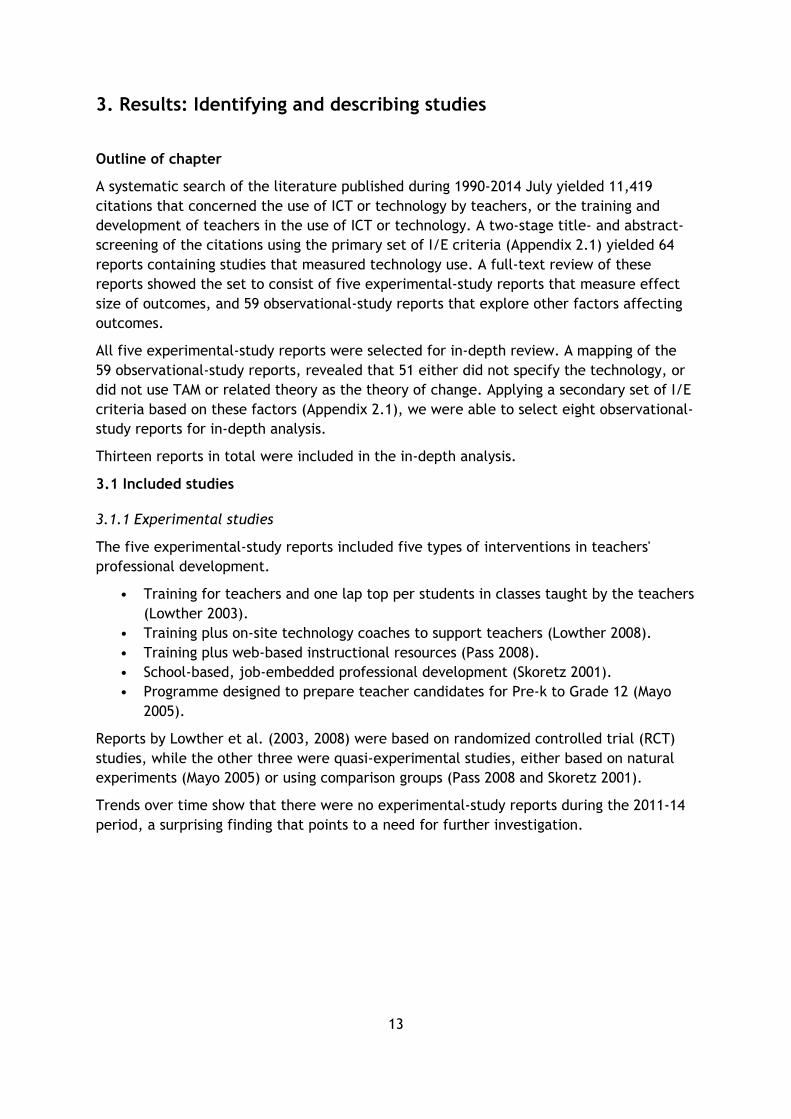
3. Results: Identifying and describing studies
Outline of chapter
A systematic search of the literature published during 1990-2014 July yielded 11,419
citations that concerned the use of ICT or technology by teachers, or the training and
development of teachers in the use of ICT or technology. A two-stage title- and abstract-
screening of the citations using the primary set of I/E criteria (Appendix 2.1) yielded 64
reports containing studies that measured technology use. A full-text review of these
reports showed the set to consist of five experimental-study reports that measure effect
size of outcomes, and 59 observational-study reports that explore other factors affecting
outcomes.
All five experimental-study reports were selected for in-depth review. A mapping of the
59 observational-study reports, revealed that 51 either did not specify the technology, or
did not use TAM or related theory as the theory of change. Applying a secondary set of I/E
criteria based on these factors (Appendix 2.1), we were able to select eight observational-
study reports for in-depth analysis.
Thirteen reports in total were included in the in-depth analysis.
3.1 Included studies
3.1.1 Experimental studies
The five experimental-study reports included five types of interventions in teachers'
professional development.
• Training for teachers and one lap top per students in classes taught by the teachers
(Lowther 2003).
• Training plus on-site technology coaches to support teachers (Lowther 2008).
• Training plus web-based instructional resources (Pass 2008).
• School-based, job-embedded professional development (Skoretz 2001).
• Programme designed to prepare teacher candidates for Pre-k to Grade 12 (Mayo
2005).
Reports by Lowther et al. (2003, 2008) were based on randomized controlled trial (RCT)
studies, while the other three were quasi-experimental studies, either based on natural
experiments (Mayo 2005) or using comparison groups (Pass 2008 and Skoretz 2001).
Trends over time show that there were no experimental-study reports during the 2011-14
period, a surprising finding that points to a need for further investigation.
14
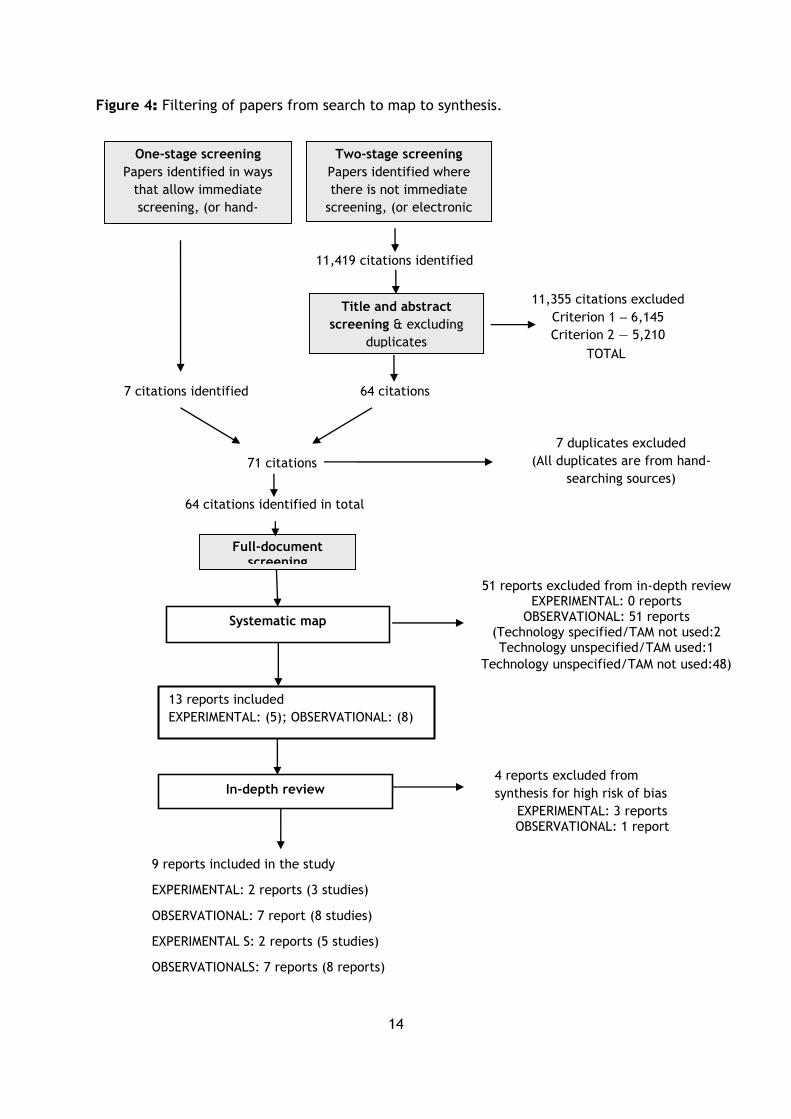
Figure 4: Filtering of papers from search to map to synthesis.
Full-document screening
Systematic map
In-depth review
51 reports excluded from in-depth review
EXPERIMENTAL: 0 reports OBSERVATIONAL: 51 reports
(Technology specified/TAM not used:2 Technology unspecified/TAM used:1
Technology unspecified/TAM not used:48)
4 reports excluded from
synthesis for high risk of bias
EXPERIMENTAL: 3 reports OBSERVATIONAL: 1 report
One-stage screening
Papers identified in ways
that allow immediate
screening, (or hand-
searching)
11,419 citations identified
Title and abstract
screening & excluding
duplicates
11,355 citations excluded
Criterion 1 ‒ 6,145
Criterion 2 — 5,210
TOTAL
7 citations identified
64 citations
71 citations
7 duplicates excluded
(All duplicates are from hand-
searching sources)
64 citations identified in total
Two-stage screening
Papers identified where
there is not immediate
screening, (or electronic
searching)
9 reports included in the study
EXPERIMENTAL: 2 reports (3 studies)
OBSERVATIONAL: 7 report (8 studies)
EXPERIMENTAL S: 2 reports (5 studies)
OBSERVATIONALS: 7 reports (8 reports)
13 reports included
EXPERIMENTAL: (5); OBSERVATIONAL: (8)
15
Observational studies
The 59 observational-study reports were mapped according to the specificity of the
technology and theory of change used in each report.
Only ten reports concerned a specified technology and the acceptance of that particular
technology by the teacher. The technologies studied ranged from learning management
systems (LMS), e-books, GIS technology in Geography, digital learning materials (DLM) and
Mathematics software, all mandated or made widely available by the relevant school or
school system. The rest of the reports concerned technology acceptance in a generic
sense, in largely unspecified ICT environments.
Nine reports used TAM or related theories of change in their analysis. All other reports
except two were based on report-specific theories using some variation of the self-efficacy
concept. The two exceptions used the innovation-diffusion theory and expectancy-value
theory.
Eight reports in total specified the technology used AND used TAM or a related theoretical
framework. Since all TAM-based reports used the perceived ease-of-use and perceived
usefulness of a technology as predictors of acceptance and use of technology, only these
reports were amenable to the desired synthesis of findings. It was not possible to get
predictors that are comparable across studies in the other 51 studies included from the
initial title- and abstract-screening, prior to the mapping step.
3.2 Quality assurance
The coding of reports for (1) specificity of technology/non-specificity and (2) TAM-related
or not criteria were determined through discussions between the principal researcher and
second researcher.
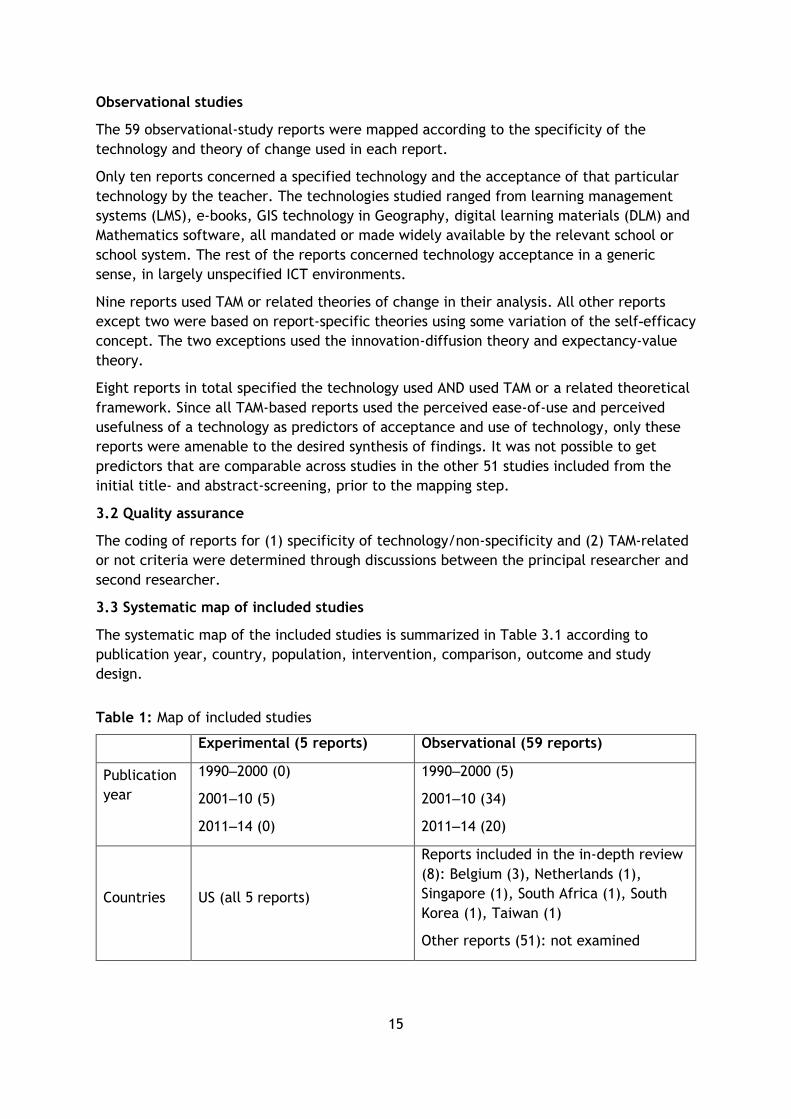
3.3 Systematic map of included studies
The systematic map of the included studies is summarized in Table 3.1 according to
publication year, country, population, intervention, comparison, outcome and study
design.
Table 1: Map of included studies
Experimental (5 reports) Observational (59 reports)
Publication
year
1990‒2000 (0)
2001‒10 (5)
2011‒14 (0)
1990‒2000 (5)
2001‒10 (34)
2011‒14 (20)
Countries US (all 5 reports)
Reports included in the in-depth review
(8): Belgium (3), Netherlands (1),
Singapore (1), South Africa (1), South
Korea (1), Taiwan (1)
Other reports (51): not examined
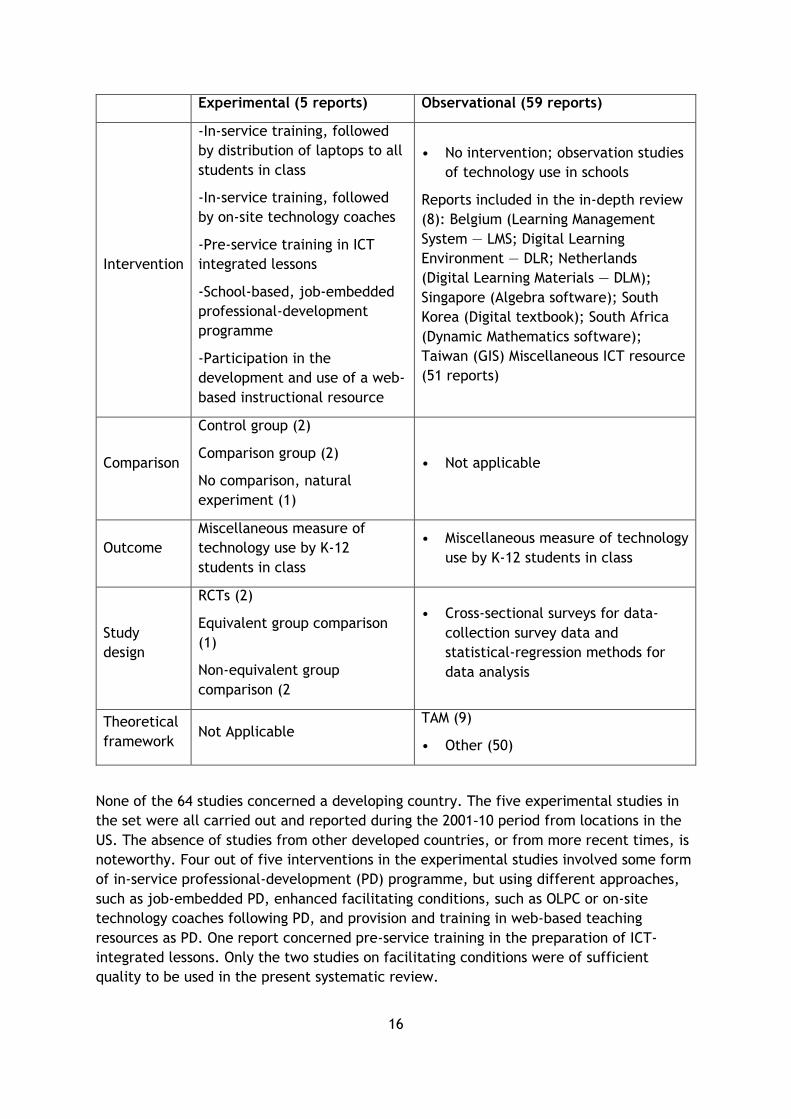
16
Experimental (5 reports) Observational (59 reports)
Intervention
-In-service training, followed
by distribution of laptops to all
students in class
-In-service training, followed
by on-site technology coaches
-Pre-service training in ICT
integrated lessons
-School-based, job-embedded
professional-development
programme
-Participation in the
development and use of a web-
based instructional resource
• No intervention; observation studies
of technology use in schools
Reports included in the in-depth review
(8): Belgium (Learning Management
System — LMS; Digital Learning
Environment — DLR; Netherlands
(Digital Learning Materials — DLM);
Singapore (Algebra software); South
Korea (Digital textbook); South Africa
(Dynamic Mathematics software);
Taiwan (GIS) Miscellaneous ICT resource
(51 reports)
Comparison
Control group (2)
Comparison group (2)
No comparison, natural
experiment (1)
• Not applicable
Outcome
Miscellaneous measure of
technology use by K-12
students in class
• Miscellaneous measure of technology
use by K-12 students in class
Study
design
RCTs (2)
Equivalent group comparison
(1)
Non-equivalent group
comparison (2
• Cross-sectional surveys for data-
collection survey data and
statistical-regression methods for
data analysis
Theoretical
framework Not Applicable
TAM (9)
• Other (50)
None of the 64 studies concerned a developing country. The five experimental studies in
the set were all carried out and reported during the 2001-10 period from locations in the
US. The absence of studies from other developed countries, or from more recent times, is
noteworthy. Four out of five interventions in the experimental studies involved some form
of in-service professional-development (PD) programme, but using different approaches,
such as job-embedded PD, enhanced facilitating conditions, such as OLPC or on-site
technology coaches following PD, and provision and training in web-based teaching
resources as PD. One report concerned pre-service training in the preparation of ICT-
integrated lessons. Only the two studies on facilitating conditions were of sufficient
quality to be used in the present systematic review.

17
All the observational studies were based on cross-sectional surveys of selected schools or
school systems, using a variety of ICT facilities. The eight studies that were used for in-
depth review originated in Europe (Belgium and Netherlands) or developed Asia
(Singapore, South Korea and Taiwan) and concerned a variety of technologies summarized
in and detailed in Appendix 1.3.
18
4. Results: in-depth review
Outline of chapter
The search, screen and mapping process yielded five experimental-study reports (Lowther
2003 and 2008, Mayo 2005, Pass 2008 and Skoretz 2001) and eight observational-study
reports (De Smet 2012, Kim 2009, Lay 2013, Pynoo 2011, Pynoo 2012, Stols 2011, Teo 2001
and Van Acker 2013) as meeting I/E criteria.
Of the five experimental-study reports, only Lowther 2003 and 2008 were found to be of
low-to-medium risk of bias. Lowther (2008) contained two distinct studies to yield a total
of three studies to be used for data extraction and synthesis. These three experimental
studies show that teacher training, along with facilitating conditions in the form of (1) one
laptop per child or (2) on-site coaches, increase technology integration by effect sizes of
+0.49 to +1.31 as compared to the control situations with no such facilitation.
Of the eight observational-study reports, all except Stols (2011) were found to be of low-
to-medium risk of bias and hence usable. Further, De Smet (2012) contains two distinct
studies yielding eight observational studies out of seven usable reports. All eight studies
used teachers' perceptions regarding the usefulness and ease of use of the technology as a
predictor of technology use. In predicting the use of technology by teachers in five of the
studies, the standardized beta coefficient (Effect size 1 or ES1) for perceptions of
usefulness of a particular technology (Effect size 2 or ES2) were found to be 2.43 times
(with a confidence interval of 0.40) larger than the standardized beta coefficient) for the
perception of the ease of use of that technology on average. The ratio was reduced to
1.23 when the three studies concerned with learning management systems (LMS) or
digital-learning environments (DLE) were added to the set. LMSs or DLEs are different from
subject-specific tools used in class, such as e-books, Algebra software or GIS use, in that
they offer more administrative and communication features that go beyond the subject
matter. The fact that measures of technology use varied across studies did not affect this
finding, since we are concerned only with the relative importance of two predictors in
each of the eight exploratory studies in question.
4.1 Experimental studies
4.1.1 Assessing quality and weight of evidence
The search, screen and mapping process yielded five experimental-study reports (Lowther
2003 and 2008, Mayo 2005, Pass 2008 and Skoretz 2001; details in Appendix 3.1). Of these,
only Lowther (2003) and (2008) were judged to be of low-to-medium risk in terms of bias
(Appendix 3.2).
4.1.2 Data extraction and synthesis
Lowther (2008) contains two distinct studies, yielding a total of three studies to be used
for data extraction and synthesis. These three experimental studies show that teacher
training, along with facilitating conditions in the form of (1) one laptop per child or (2) on-
site coaches, increased technology integration by effect sizes of +0.49 to +1.31 as
compared to the control situations with no such facilitation.
19
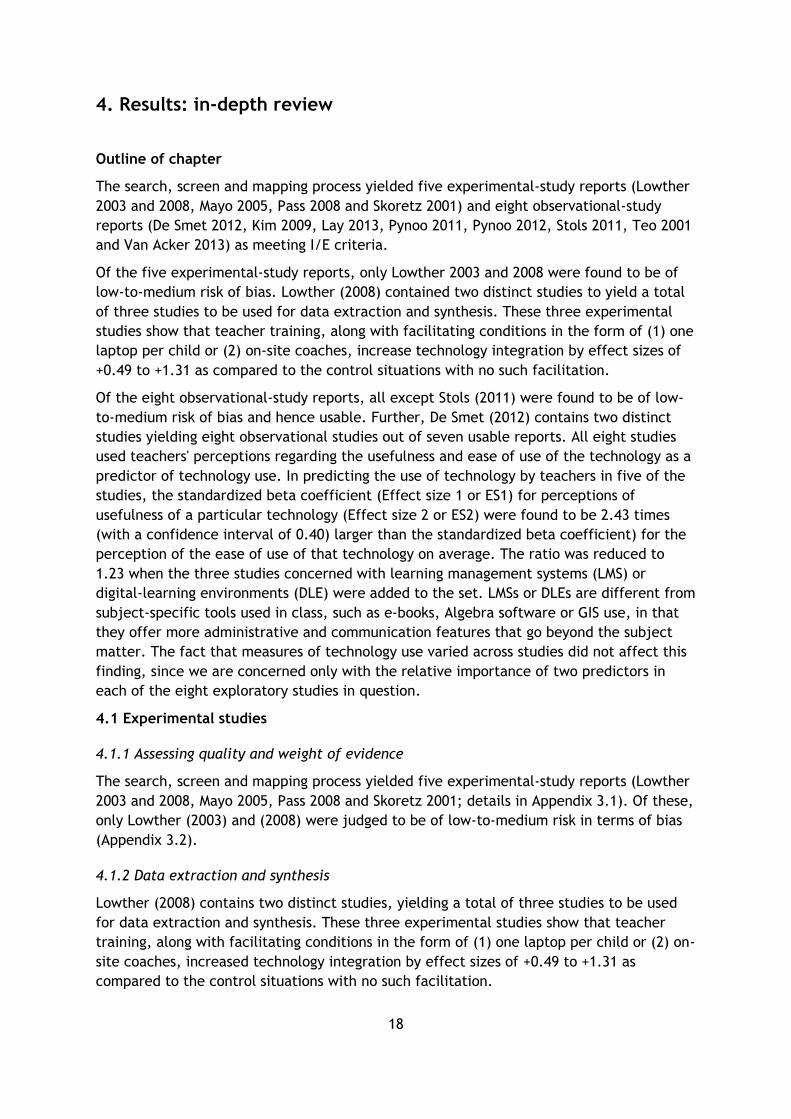
Figure 5: Forest plots for experimental studies on ICT use
Table 2: Effect sizes for three professional-development interventions
Intervention Outcome Mean (Std. Error)
Range
Lowther (2003): Professional development with one laptop per child
Use of technology as a learning tool, Grade 5 (Lowther 2003, Table 5, SOM)
1.25 (0.52) 0.24‒2.27
Lowther (2008) Professional development with on-site technology coach (Launch 1)
Use of technology as a learning tool or resource (Table 4, SOM)
1.13 (0.19) 0.77‒1.50
Meaningful use of computers (Table 7, OCU)
1.06 (0.19) 0.7‒1.42
Lowther (2008) Professional development with on-site technology coach (Launch 2)
Use of technology as a learning tool or resource (Table 4, SOM)
0.90 (0.18) 0.55 1.25
Meaningful use of computers, Launch 2 (Lowther 2008, Table 7, OCU)
0.48 (0.17) 0.14-0.81
NOTE: Weights are from random effects analysis
Overall (I-squared = 46.9%, p = 0.093)
Meaningful use of computers, Launch 2(Lowther-2008)
Use of technology , Grade 5 (Lowther-2003)
Technology as a learning tool , Launch 2 (Lowther-2008)
Technology as a learning tool , Launch 1 (Lowther-2008)
Meaningful use of computers, Launch 1 (Lowther-2008)
Use of technology , Grade 6 (Lowther-2003)
Study
0.93 (0.67, 1.18)
0.48 (0.14, 0.81)
1.25 (0.24, 2.27)
0.90 (0.55, 1.25)
1.13 (0.77, 1.50)
1.06 (0.70, 1.42)
1.31 (0.30, 2.31)
ES (95% CI)
0.93 (0.67, 1.18)
0.48 (0.14, 0.81)
1.25 (0.24, 2.27)
0.90 (0.55, 1.25)
1.13 (0.77, 1.50)
1.06 (0.70, 1.42)
1.31 (0.30, 2.31)
ES (95% CI)
0-2.31 0 2.31
20
4.2 Observational studies
4.2.1 Assessing quality and weight of evidence
Of the eight observational-study reports, all except Stols (2011) were found to have low-
to-medium risk of bias and, hence, seven usable reports (Appendix 2.4).
4.2.2 Data extraction and synthesis
The report by De Smet (2012) contained two distinct studies, yielding eight studies out of
seven usable reports. All eight studies were observation studies that use teachers'
perceptions regarding the usefulness and ease of use of the technology as a predictor of
technology use and other factors as dependent variables, and technology-use outcome as
the dependent variable in regression analyses. The standardized beta coefficients in
regression models tell us the effect of each independent variable or predictor on the
dependent variable. Standardized beta coefficients were available only for Kim (2009) and
Pynoo (2011). Standardized beta coefficients in the other five studies were calculated as
described in Appendix 2.5.
The effect sizes for perceived ease of use (ES1) ranged from a low of -0.28 to 1.24, and
those for perceived usefulness (ES2) ranged from a low of -0.13 to 2.45 (Appendix XX).
This range is not surprising, given the diverse nature of technologies and technology-use
measures used.
4.2.3 Usefulness vs. ease of use
In technology use in business settings, it is observed that the perception of usefulness is
the strongest predictor of intention to use technology (Venkatesh et al. 2003, p. 447).4 To
our knowledge, no such generalization has been made with regard to technology use in
educational settings. In predicting the use of technology by teachers in five of the studies,
the standardized beta coefficient for perceptions of usefulness of a particular technology
(Effect size 1 or ES1) were found to 2.43 times (with a confidence interval of 0.40) larger
than the standardized beta coefficient for the perception of the ease of use of that
technology (Effect size 1 or ES1) on average. The ratio was reduced to 1.23 when the
three studies concerned with LMS DLE were added to the set. LMSs or DLEs are different
from subject-specific tools used in class, such as e-books, Algebra software or GIS, in that
they involve more administrative and communication features that go beyond the subject
matter. For example, in Pynoo (2011), teachers in the target group used the Smartschool
DLE or digital learning environment, which, in turn, consists of three different modules
(digital learning, communication and administration). The use measures do not distinguish
between these. In De Smet (2012), measures of use distinguish between informational use
and communication use, but the target group uses one of three commercial LMSs known as
Dokeos, Blackboard and Smartschool. In future studies, LMSs should be excluded from the
"specific applications" category, since an LMS has multiple uses of a highly diverse nature.
4 Venkatesh et al. use the term "performance expectancy", 2003.
21
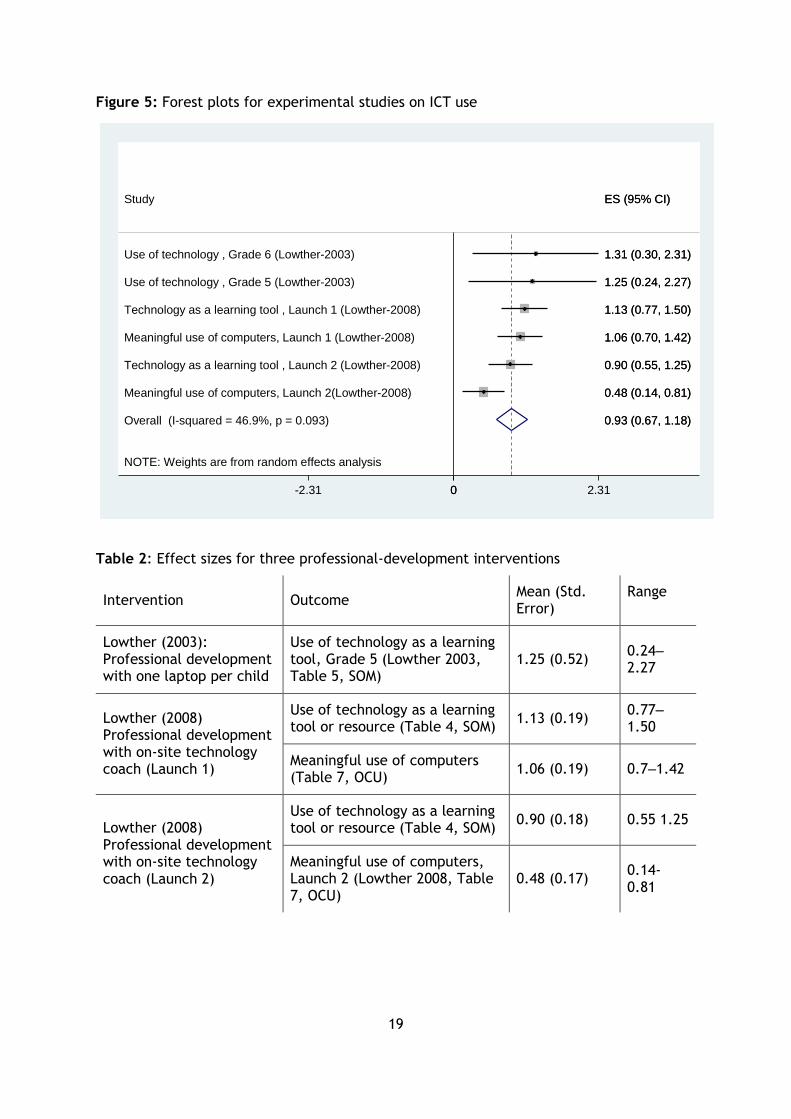
Table 3: Ratio of perceived usefulness to perceived ease of use
Paper Intervention RoB Mean *(Std Error) Range
Van Acker (2013) Netherlands
Digital learning materials (DLM)
Low 2.79 (0.05) 2.7-2.9
Kim (2009) Korea
Digital-textbook pilot Med 2.70 (0.70) 1.3-4.1
Lay (2013)Taiwan
GIS for geography curriculum
Low 2.65 (0.07) 2.5-2.8
Pynoo (2012) Belgium
"KlasCement" proprietary portal for sharing teaching resources
Med 2.09 (0.06) 2.0-2.2
Teo (2001) Singapore
ICT use by Algebra teachers Low 2.05 (0.20) 1.6-2.4
De Smet (2012) Belgium
Learning management system (LMS) for communication use
Low 1.29 (0.09) 1.1-1.5
De Smet (2012)Belgium
Learning management system (LMS) for information use
Low 0.89 (0.08) 0.7-1.0
Pynoo (2011) Belgium
Digital learning environment (DLE)
Low 0.50 (0.21) 0.1-0.9
Figure 6: Forest plot for ratios of perceived usefulness to perceived ease of use
NOTE: Weights are from random effects analysis
Overall (I-squared = 98.9%, p = 0.000)
DLE (Pynoo-2011-Belgium)
Algebra software (Teo-2001-Singapore)
LMS-information use (DeSmet-2012-Belgium)
GIS(Lay-2013-Taiwan)
LMS-Communication (DeSmet-2012-Belgium)
DLM (Van Acker-2013-Netherlands)
DLM Portal (Pynoo-2012-Belgium)
E-book (Kim-2009-Korea)
Study
1.83 (1.26, 2.40)
0.50 (0.10, 0.90)
2.05 (1.60, 2.40)
0.89 (0.70, 1.00)
2.65 (2.50, 2.80)
1.29 (1.10, 1.50)
2.79 (2.70, 2.90)
2.09 (2.00, 2.20)
2.70 (1.30, 4.10)
ES (95% CI)
1.83 (1.26, 2.40)
0.50 (0.10, 0.90)
2.05 (1.60, 2.40)
0.89 (0.70, 1.00)
2.65 (2.50, 2.80)
1.29 (1.10, 1.50)
2.79 (2.70, 2.90)
2.09 (2.00, 2.20)
2.70 (1.30, 4.10)
ES (95% CI)
0-4.1 0 4.1
22
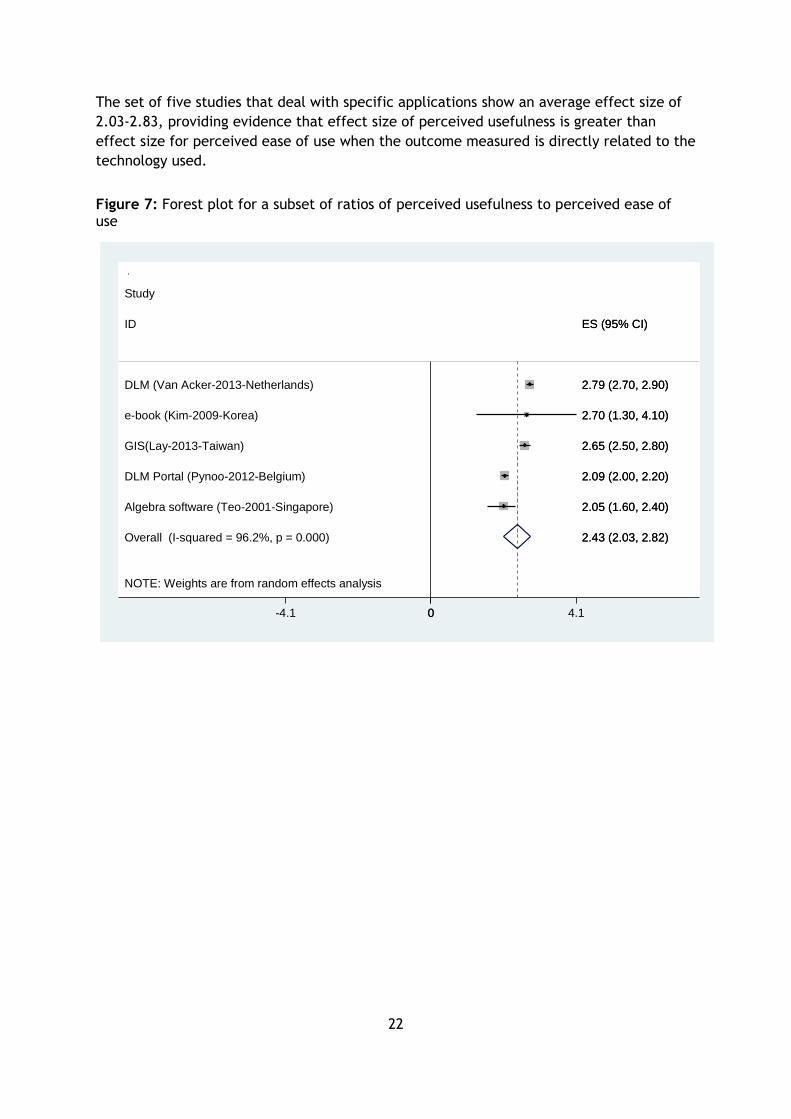
The set of five studies that deal with specific applications show an average effect size of
2.03-2.83, providing evidence that effect size of perceived usefulness is greater than
effect size for perceived ease of use when the outcome measured is directly related to the
technology used.
Figure 7: Forest plot for a subset of ratios of perceived usefulness to perceived ease of use
NOTE: Weights are from random effects analysis
Overall (I-squared = 96.2%, p = 0.000)
e-book (Kim-2009-Korea)
DLM (Van Acker-2013-Netherlands)
Algebra software (Teo-2001-Singapore)
ID
DLM Portal (Pynoo-2012-Belgium)
Study
GIS(Lay-2013-Taiwan)
2.43 (2.03, 2.82)
2.70 (1.30, 4.10)
2.79 (2.70, 2.90)
2.05 (1.60, 2.40)
ES (95% CI)
2.09 (2.00, 2.20)
2.65 (2.50, 2.80)
2.43 (2.03, 2.82)
2.70 (1.30, 4.10)
2.79 (2.70, 2.90)
2.05 (1.60, 2.40)
ES (95% CI)
2.09 (2.00, 2.20)
2.65 (2.50, 2.80)
0-4.1 0 4.1
23
5. Implications
Outline of chapter
The observational studies show that the effect of perceptions of usefulness on technology
use is twice as important as the effect of perceptions of the ease of use on technology
use, implying that, in selecting ICT applications for K-12 classrooms, policymakers should
regard both perceptions as important, but it is particularly important to get teacher
feedback in selecting and purchasing technology for school systems.
The experimental studies show that teacher training, along with facilitating conditions,
increased technology use by effect sizes of +0.49 to +1.31 as compared to the control
situations with no such facilitation. The two facilitating conditions are one laptop per
child and on-site coaches. While adding those two conditions to the repertoire of
strategies for training teachers, more experimental studies should be carried out to
identify and quantify other interventions, such as peer-to-peer learning by teachers or
structured long-distance assistance (Orr 2014) and the cost of such. In all such
interventions, weight should be accorded to teachers' perceptions regarding the usefulness
and ease of use of the technology, with particular attention paid to perceptions of
usefulness.
5.1 Strengths and limitations of this systematic review
The present systematic review set out to determine the effect of different types of
teacher training and support programmes on the use of technology in the classroom by
teachers. Only two such reports and three studies therein were revealed in the process.
This is unfortunate, but not totally surprising. As mentioned in the introduction, the focus
of most of the research on ICT in education is on technology interventions for learning
outcomes in students, by-passing the critical intervening step of acceptance and use of
the technology by the teacher in the classroom. It is difficult to discern teacher factors in
a field where student-learning outcomes are prioritized. All three studies found in the
present review show that, if teachers are given sufficient post-training support in the form
of better access to computers for students, as well as in-house technical support, they will
use technology in the classroom, but we may have missed some studies where the focus
was on learning outcomes, but teacher use measures were reported in passing.
An additional limitation of the study is that the literature search was limited to citations
with title and/or abstract given in English. The complexity of review question, with a
range of strategies for training teachers and ways of measuring technology, was a
limitation, but we managed to overcome it by using a mapping study to screen out studies
that were not comparable.
The strength of this systematic review is in establishing the relative importance of the
effect of teachers' perceptions of the usefulness compared to the effect of teachers'
perceptions of the ease of use. Although the relationship has been established in
corporate settings, to our knowledge, the present review is the first time the relationship
has been established in an educational setting. The other strength of the review is the
reporting of effect size of two interventions on teachers' use of technology in the
classroom.
24
5.2 Implications for research
5.2.1 Specificity of technology used
The present systematic review brings to the fore the importance of the technologies
assessed in educational settings being directly linked to the teaching-learning process.
Van Acker (2013) observed as follows:
We believe that studies focusing on general ICT use might miss certain effects,
because the behaviour lacks sufficient specificity. Teachers may, for example,
have a positive attitude towards using e-mail to communicate with their students,
but might feel quite anxious when using an electronic blackboard. As a
consequence, measures of a general attitude towards ICT, or of the intention to
use ICT, might include a lot of variability, due to the different ICT applications
teachers consider when completing these instruments.
These concerns are supported by theories of behavioural psychology. Fishbein and Ajzen
(1985) identified three major factors that determine the correspondence between
intention and behaviour: (1) specificity of the behaviour; (2) stability of the intention; and
(3) volitional control; they went on to highlight the more important role played by
specificity.
“Perhaps the most important factor influencing the size of the intention-
behaviour relation is the degree to which the intention is measured at the same
level of specificity as the behaviour to be predicted" (Fishbein and Ajzen, 1985, p.
369-372).
In the future, any research into ICT use should be about specific ICT tools, with the
surveys designed to elicit responses regarding that specific tool. For example, if the
technology is specified as, say, “one e-book per student provided to all students by the
school Board” and the survey instrument is designed to take this into account, it is
possible to make greater use of the responses made by the teachers to questions
pertaining to their attitude, acceptance, intention and use in relation to the particular
technology intervention.
5.2.2 Theory of technology use
ICT in education researchers may explore the effect of different variables on technology
acceptance and use, but they need to be encouraged to situate their findings in the
UTTAU or another well-established theory of change to make their studies more
comparable. We were not able to use the bulk of exploratory observational studies that
we had uncovered, because the independent variables used were not consistent across the
studies. In contrast, where TAM theory was used, the variables were always clustered
within the four major variables of perceived ease of use, perceived usefulness, social
influence and facilitating conditions.
5.2.3 System-wide surveys of ICT use
Descriptive studies were excluded in the title and abstract screening II step of the
screening process, but, system-wide surveys of ICT-use patterns and learning outcomes
can help flesh out the findings from experimental or observational studies. For example,
25
the PISA survey by OECD provides comparable information on ICT use and learning
outcomes for 29 out of 34 OECD countries and 13 out of 30 partner countries. A synthesis
of results from such surveys and the present systematic review will be detailed elsewhere.
5.2.4 Search strategies
Searches for grey literature on Scholar.google.com were time-consuming, and did not
yield a single publication that we could not have uncovered through a search of electronic
databases.
5.3 Implications for policy and practice
Understanding the relative importance of factors affecting technology use is important for
leaders of schools or school systems as they try to introduce a certain new technology or
decide between one or more technologies. Often, teachers are provided training in the
use of the technology, but they may not be consulted as to the usefulness of that
technology.
Eight observational studies from Belgium (4), Netherlands (1), Singapore (1), South Korea
(1) and Taiwan (1) point to the importance of the perceptions of teachers regarding the
usefulness and the ease of use of a technology, with perceptions of usefulness being as
twice as important as perceptions of ease of use, underscoring the importance of
understanding and responding to "teacher factors" in the effective use of ICT in improving
student-learning outcomes.
Three experimental studies, all from the US, are seemingly more concerned with the ease-
of-use aspect. They show that teachers use ICT to a greater degree if professional
development on ICT use is accompanied by adequate follow-up support for the teachers,
or through provision of one laptop per child in the classroom. While more attention should
be paid to teachers' perceptions of usefulness in introducing ICTs in system-wide
initiatives, such initiatives should be planned and executed as experiments to evaluate the
effect of ICT on teacher perceptions and the effect of perceptions and/or use on student-
learning outcomes.
26
6. References
Ajzen I (2006) Model of theory of planned behaviour.
http://people.umass.edu/aizen/tpb.diag.html. Accessed June 2015.
Baek Y, Jong J, and Kim B (2008) What makes teachers use technology in the classroom?
Exploring the factors affecting facilitation of technology with a Korean sample. Computers
and Education 50: 224-234.
Bandura, A (1986) Social foundations of thought and action: a social cognitive theory.
Englewood Cliffs, NJ: Prentice-Hall.
Bandura A (1994) Self-efficacy. In Corsini RJ (ed.), Encyclopedia of psychology, 2nd ed.,
Vol. 3, pages 368-369. New York: Wiley.
Berlinski S, Busso M (2015) Challenges in educational reform: an experiment on active
learning in Mathematics. IDB WORKING PAPER SERIES No. IDB-WP-561. Inter-American
Development Bank.
Bingimlas KA (2009) Barriers to the successful integration of ICT in teaching and learning
environments: a review of the literature, Eurasia Journal of Mathematics, Science &
Technology Education 5(3): 235-245.
Cheung ACK, Slavin RE (2013) The effectiveness of educational technology applications for
enhancing Mathematics achievement in K-12 classrooms: a meta-analysis. Educational
Research Review 9: 88–113.
European Commission (2013) ICT in Education benchmarking access, use and attitudes to
technology in Europe’s schools. https://ec.europa.eu/digital-agenda/en/pillar-6-
enhancing-digital-literacy-skills-and-inclusion. Accessed in June 2015.
Fishbein M, Ajzen, I (1975). Belief, attitude, intention, and behaviour: an introduction to
theory and research. Reading, MA: Addison-Wesley. (book is out of print, but online access
available at http://people.umass.edu/aizen/f&a1975.html).
Hermans R, Tondeur J, van Braak J, Valcke, M (2008) The impact of primary school
teachers' educational beliefs on the classroom use of computers. Computers & Education,
51: 1,499–1,509.
Koehler MJ, Mishra, P (2009) What is technological pedagogical content knowledge?
Contemporary issues in technology and teacher education 9(1): 60-70.
Lagrange J-B, Artigue M, Laborde C, Trouche L (2000) A meta study on ICT technologies in
education: towards a multidimensional framework to tackle their integration.
http://citeseerx.ist.psu.edu/viewdoc/download?doi=10.1.1.471.262&rep=rep1&type=pdf.
Lawless K, Pellegrino JW (2007) Professional development in integrating technology into
teaching and learning: knowns, unknowns, and ways to pursue better questions and
answers. Review of Educational Research, December 77(4): 575–614.
27
Low G, Beverton S (2004) A systematic review of the impact of ICT on literacy learning in
English of learners between 5 and 16, for whom English is a second or additional language.
London: EPPI-Centre Report, Social Science Research Unit, Institute of Education,
University of London.
McCormick J, Ayres PL (2009) Teacher self-efficacy and occupational stress: a major
Australian curriculum reform revisited. Journal of Educational Administration 47(4): 463-
476.
Means B, Toyama Y, Murphy R, Bakia M, Jones K (2010) Evaluation of evidence-based
practices in online learning: a meta-analysis and review of online learning. Center for
Technology in Learning, US Department of Education.
http://www.ed.gov/about/offices/list/opepd/ppss/reports.html.
OECD (2015). Students, computers and learning: making the connection. PISA, OECD
Publishing. http://dx.doi.org/10.1787/9789264239555-en
Orr D, Westbrook J, Pryor J Durrani N, Sebba J, Adu-Yeboah C (2013) What are the impacts
and cost-effectiveness of strategies to improve performance of untrained and
undertrained teachers in the classroom in developing countries? London: EPPI-Centre,
Social Science Research Centre, Institute of Education, University of London.
Ringstaff C, Kelley L (2002) The learning return on our educational-technology investment:
a review of findings from research improving education through research, development,
and service. WestEd: San Francisco, CA.
Sheingold K, Hadley M (1990) Accomplished teachers: integrating computers into classroom
practice. ERIC: http://files.eric.ed.gov/fulltext/ED322900.pdf. Accessed 15 May 2014.
Sullivan GM, Feinn R (2012) Using effect size—or why the P value is not enough. J Grad
Med Educ. September 4(3): 279–282.
http://www.ncbi.nlm.nih.gov/pmc/articles/PMC3444174/
Tamim, RM, Robert MB, Borokhovski E, Abrami PC, Schmid RF (2013) What forty years of
research says about the impact of technology on learning: a second-order meta-analysis
and validation study. Review of Educational Research 81(4): 4-28.
Tamim RM., Borokhovski E, Pickup D, Bernard RM and El Saadi L (2015) Tablets for
teaching and learning: a systematic review and meta-analysis. Commonwealth of Learning.
Sang Guoyuan, Valcke M, van Braak J, Tondeur J (2010) Student teachers’ thinking
processes and ICT integration: predictors of prospective teaching behaviours with
educational technology. Computers & Education. 54(1), January: 103-112
Tolani-Brown N, McCormac MA, Zimmermann R (2009) An analysis of the research and
impact of ICT in education in developing-country contexts. Journal of Education for
International Development 4(2): 1-12.
Tondeur J, van Braak J, Ertmer PA, Ottenbreit-Leftwich A (2013) The link between
teachers' pedagogical beliefs and technology use in the classroom: a systematic review of
qualitative evidence.
https://www.academia.edu/4450476/The_link_between_teachers_pedagogical_beliefs_an
d_technology_use_in_the_classroom_A_systematic_review_of_qualitative_evidence.
Accessed June 2015.
28
Tweed SR (2013) Technology implementation: teacher age, experience, self-efficacy and
professional development as related to classroom technology integration. Electronic
Theses and Dissertations. Paper 1109. http://dc.etsu.edu/etd/1109
Ungerleider CC and Burns TC (2002) Information and communication technologies in
elementary and secondary education: a state-of-the-art review. Pan-Canadian Education
Research Agenda Symposium “Information Technology and Learning”, Montreal, Quebec.
van Braak J, Tondeur J, Valcke M (2004) Explaining different types of computer use among
primary-school teachers. European Journal of Psychology of Education XIX(4): 407-422.
Van Dusen LM and Worthen BR (1995) Can integrated instructional technology transform
the classroom? Education and Leadership. 53(2): 28-33.
Venkatesh V, Michael G, Morris GB, Davis F, Davis D (2003) User acceptance of information
technology: towards a unified view. MIS Quarterly Vol. 27( 3): 425-478.
Waddington H, White H, Snilstveit B, Hombrados JG, Vojtkova M, Davies P, Bhavsar A,
Eyers J, Perez Koehlmoos T, Petticrew M, Valentine JC, Tugwell P (2012) How to do a good
systematic review of effects in international development: a tool kit. Journal of
Development Effectiveness 4(3) 359-387, DOI: 10.1080/19439342.2012.711765
Waddington H, Hombrados JG (2012) Risk of bias assessment for experimental and quasi-
experimental designs based on statistical methods
http://www.3ieimpact.org/media/filer_public/2012/12/26/jorge_hombrados_and_hugh_
waddington_conference-session12-b_3ie_dhaka_colloquium.pdf
29
Appendix 1.2: Review-specific keywords and definitions
Review-specific keywords
ICT integration; ICT use; ICT in education; ICT in school education; ICT in K-12; In-service
training; Professional development; Teacher training, Teacher training and support;
Technology integration; Technology integration in the classroom; Technology use;
Technology use in the classroom
Glossary
Citation: Citation is a reference to a report, including details of the author, title and
source information for the report; a report may contain one or more studies.
Digital learning environments (DLEs): Digital learning environments is a term that refers to
the total of digital resources (computers, software, storage and systems) used to manage
an academic enterprise and support, enable or manage learning.
Experimental designs: The purpose is to assess the impact of an intervention or a
phenomenon. Allocation or exposure of subjects/participants is controlled or manipulated
fully or partly by investigators. Includes (1) Randomized controlled trials (RCTs), which are
"true" experimental designs and (2) quasi-experimental designs.
Observational studies: The purpose is to assess causality or factors affecting an outcome.
Allocation or exposure of subjects/participants is not controlled or manipulated by
investigators. Data collection can be through cohort, case control or cross-sectional
methods. Statistical methods are used to control for bias and to derive conclusions.
Learning-management systems (LMSs): A learning-management system (LMS) is a software
application for the administration, documentation, tracking, reporting and delivery of
electronic educational technology (also called e-learning) courses or training programmes.
Quasi-experimental designs: The purpose is to assess the impact of an intervention or a
phenomenon. Allocation or exposure of subjects/participants is not conducted randomly,
but undertaken by an investigator using a known allocation rule, such as regression
discontinuity, or natural experiment, or using a method to control for confounding, such
as difference-in-differences estimation, instrumental-variables estimation, statistical
matching, Interrupted time series, etc.
Randomized controlled trials (RCTs): The purpose of RCTs is to assess the impact of an
intervention or a phenomenon. The investigator randomly assigns people to groups that
will receive (intervention group) or not receive (control group) one or more interventions.
The outcomes measured are then compared between the groups.
30
Appendix 1.3: User inputs
Participants in the user-group consultation
(26 November 2015, Colombo, Sri Lanka)
Ahamed Nishadh, Information and Communication Technology Agency (ICTA)
Anir Chowdhury, Access to Information (a2i), Prime Minister’s Office, Bangladesh
Anoja Obeysekera, IT consultant
Chrishan Pereira, e-learning consultant to ADB
DA Jayalal, National Institute of Education
Dhamitu Kirtisinghe, Mobitel
Dumindra Ratnayaka, Former CEO, Etisalat
GM Niel Gunadasa, Director of Education, IT Unit, Ministry of Education
Gayani Hurulle, LIRNEasia
Hasitha Dela, Headstart, dialog Axialata
Ishara Madushanka, Infogate, Kantale
Janakie Karunarathne, Microsoft
Kamal Abeysinghe, EDEX
Kyle Coenraad, Digital Services Dialog Axiata PLC
Longkai Wu, National Institute of Education, Singapore
Nanda Wanninayaka, Horizon Lanka, Mahavilachchiya
Nimali Baduraliya, Department of Education, Western Province
Rohan Samarajiva, LIRNEasia
Shirani Elasinghe, Sarvodaya Fusion
Sujata Gamage, LIRNEasia
Thanaraj Thaiyamuthu, Faculty of Education, Horizon Campus, Formerly Open University
Thushara Silva, Wijeya Newspapers
Vishaka Nanayakkara, University of Moratuwa
Wasantha Deshapriya, Secretary, Ministry of Telecommunication & Digital Technology
Wimal Gunarathna, Department of Education, Western Province
Yashinka Jayasinghe Alles, Microsoft
Yudhanjaya Wijeratne, WSO2
31
Appendix 2.1: Inclusion and exclusion criteria
Title and abstract screening I
INCLUDE: Any studies that (1) concern integration of technology in a classroom, school or
school system (2) published in 1990 or after and (3) focus on primary and secondary
education.
EXCLUDE: Studies that consist of an entirely secondary source only (that is, book review or
textbook) or deal with theoretical issues only; studies concerning technology use in
tertiary institutions, including technology use by pre-service teachers or technology use in
special education.
Title and abstract screening II
INCLUDE: Reports that include one or more empirical studies that measure technology use
in K-12 classrooms.
EXCLUDE: All other reports.
Full-text screening
We first coded all reports according to type of study (experimental/observational/other)
included in them, the specificity of technology (specific/generic), and the theory of
change used (TAM-based/other)
INCLUDE: All experimental5 or quasi-experimental6 studies, or all observational studies
that specify the technology and used TAM or related theory of change.
EXCLUDE: All other studies.
5 Experimental studies are studies using RCTs.
6 Quasi-experimental designs include: Difference in difference design (DiD); Interrupted time series (ITS);
Instrumental variable design (IV); propensity score-matching designs (PSM); regression-discontinuity design
(RDD); single differences designs (SDD) and other designs that evaluate the effect sizes experimentally,
without the use of RCTs for comparison.
32
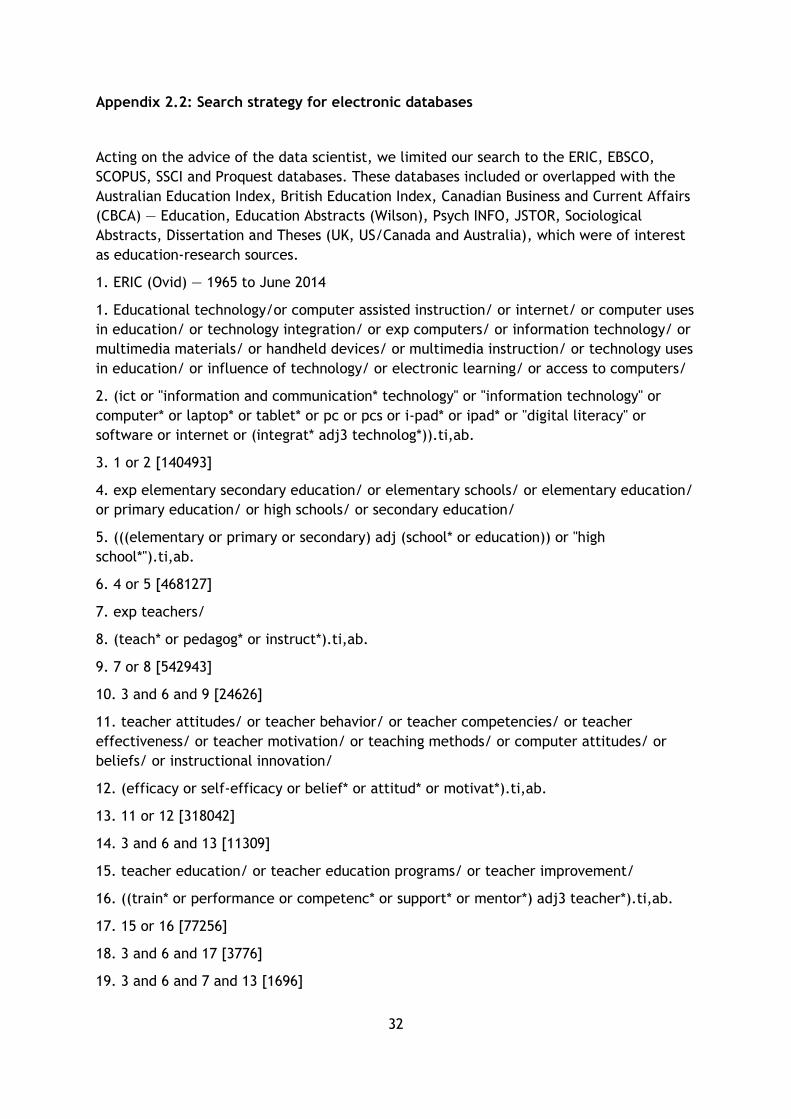
Appendix 2.2: Search strategy for electronic databases
Acting on the advice of the data scientist, we limited our search to the ERIC, EBSCO,
SCOPUS, SSCI and Proquest databases. These databases included or overlapped with the
Australian Education Index, British Education Index, Canadian Business and Current Affairs
(CBCA) — Education, Education Abstracts (Wilson), Psych INFO, JSTOR, Sociological
Abstracts, Dissertation and Theses (UK, US/Canada and Australia), which were of interest
as education-research sources.
1. ERIC (Ovid) — 1965 to June 2014
1. Educational technology/or computer assisted instruction/ or internet/ or computer uses
in education/ or technology integration/ or exp computers/ or information technology/ or
multimedia materials/ or handheld devices/ or multimedia instruction/ or technology uses
in education/ or influence of technology/ or electronic learning/ or access to computers/
2. (ict or "information and communication* technology" or "information technology" or
computer* or laptop* or tablet* or pc or pcs or i-pad* or ipad* or "digital literacy" or
software or internet or (integrat* adj3 technolog*)).ti,ab.
3. 1 or 2 [140493]
4. exp elementary secondary education/ or elementary schools/ or elementary education/
or primary education/ or high schools/ or secondary education/
5. (((elementary or primary or secondary) adj (school* or education)) or "high
school*").ti,ab.
6. 4 or 5 [468127]
7. exp teachers/
8. (teach* or pedagog* or instruct*).ti,ab.
9. 7 or 8 [542943]
10. 3 and 6 and 9 [24626]
11. teacher attitudes/ or teacher behavior/ or teacher competencies/ or teacher
effectiveness/ or teacher motivation/ or teaching methods/ or computer attitudes/ or
beliefs/ or instructional innovation/
12. (efficacy or self-efficacy or belief* or attitud* or motivat*).ti,ab.
13. 11 or 12 [318042]
14. 3 and 6 and 13 [11309]
15. teacher education/ or teacher education programs/ or teacher improvement/
16. ((train* or performance or competenc* or support* or mentor*) adj3 teacher*).ti,ab.
17. 15 or 16 [77256]
18. 3 and 6 and 17 [3776]
19. 3 and 6 and 7 and 13 [1696]
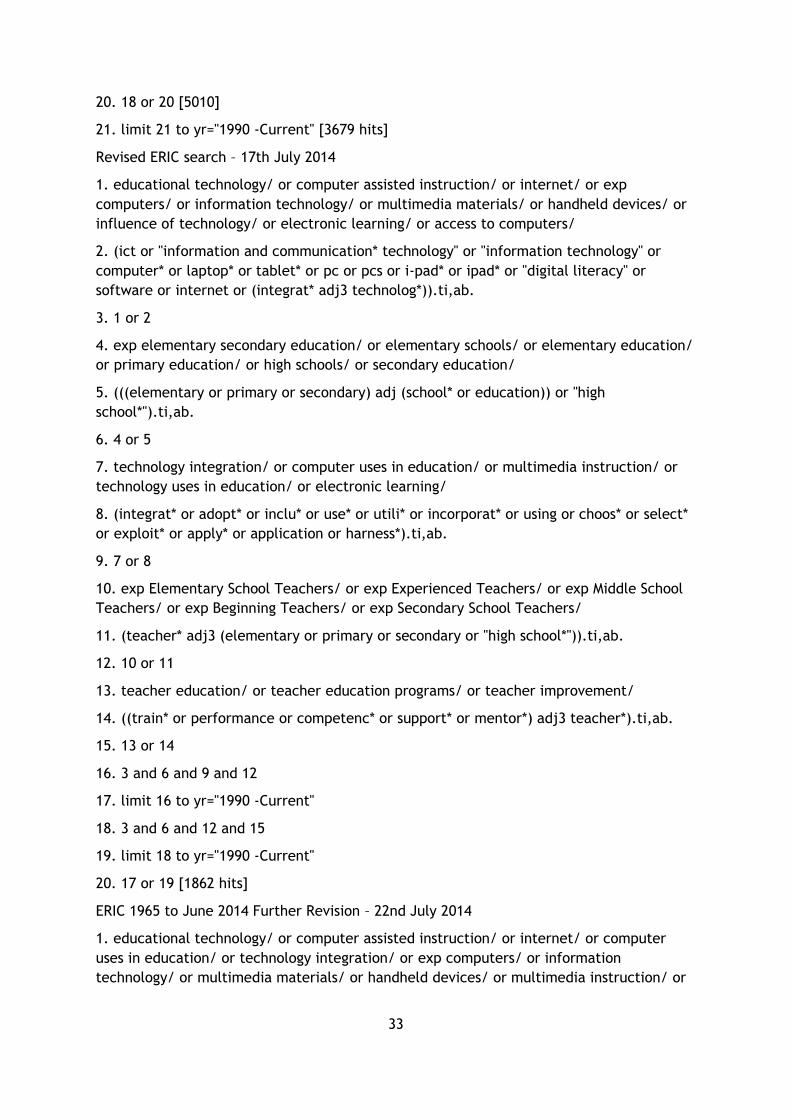
33
20. 18 or 20 [5010]
21. limit 21 to yr="1990 -Current" [3679 hits]
Revised ERIC search – 17th July 2014
1. educational technology/ or computer assisted instruction/ or internet/ or exp
computers/ or information technology/ or multimedia materials/ or handheld devices/ or
influence of technology/ or electronic learning/ or access to computers/
2. (ict or "information and communication* technology" or "information technology" or
computer* or laptop* or tablet* or pc or pcs or i-pad* or ipad* or "digital literacy" or
software or internet or (integrat* adj3 technolog*)).ti,ab.
3. 1 or 2
4. exp elementary secondary education/ or elementary schools/ or elementary education/
or primary education/ or high schools/ or secondary education/
5. (((elementary or primary or secondary) adj (school* or education)) or "high
school*").ti,ab.
6. 4 or 5
7. technology integration/ or computer uses in education/ or multimedia instruction/ or
technology uses in education/ or electronic learning/
8. (integrat* or adopt* or inclu* or use* or utili* or incorporat* or using or choos* or select*
or exploit* or apply* or application or harness*).ti,ab.
9. 7 or 8
10. exp Elementary School Teachers/ or exp Experienced Teachers/ or exp Middle School
Teachers/ or exp Beginning Teachers/ or exp Secondary School Teachers/
11. (teacher* adj3 (elementary or primary or secondary or "high school*")).ti,ab.
12. 10 or 11
13. teacher education/ or teacher education programs/ or teacher improvement/
14. ((train* or performance or competenc* or support* or mentor*) adj3 teacher*).ti,ab.
15. 13 or 14
16. 3 and 6 and 9 and 12
17. limit 16 to yr="1990 -Current"
18. 3 and 6 and 12 and 15
19. limit 18 to yr="1990 -Current"
20. 17 or 19 [1862 hits]
ERIC 1965 to June 2014 Further Revision – 22nd July 2014
1. educational technology/ or computer assisted instruction/ or internet/ or computer
uses in education/ or technology integration/ or exp computers/ or information
technology/ or multimedia materials/ or handheld devices/ or multimedia instruction/ or

34
technology uses in education/ or influence of technology/ or electronic learning/ or
access to computers/
2. (ict or "information and communication* technology" or "information technology" or
computer* or laptop* or tablet* or pc or pcs or i-pad* or ipad* or "digital literacy" or
software or internet or ((integrat* or adopt* or inclu* or use* or utili* or incorporat* or
using or choos* or select* or exploit* or apply* or application or harness*) adj3
technolog*)).ti,ab.
3. 1 or 2
4. exp elementary secondary education/ or elementary schools/ or elementary education/
or primary education/ or high schools/ or secondary education/
5. (((elementary or primary or secondary) adj (school* or education)) or "high
school*").ti,ab.
6. 4 or 5
7. exp teachers/
8. (teach* or pedagog* or instruct*).ti,ab.
9. 7 or 8
10. teacher attitudes/ or teacher behavior/ or teacher competencies/ or teacher
effectiveness/ or teacher motivation/ or teaching methods/ or computer attitudes/ or
beliefs/ or instructional innovation/
11. (efficacy or self-efficacy or belief* or attitud* or motivat*).ti,ab.
12. 10 or 11
13. teacher education/ or teacher education programs/ or teacher improvement/
14. ((train* or performance or competenc* or support* or mentor*) adj3 teacher*).ti,ab.
15. 13 or 14
16. 3 and 6 and 15
17. 3 and 6 and 7
18. 16 or 17
19. limit 18 to yr="1990 -Current"
20. exp Elementary School Teachers/ or exp Experienced Teachers/ or exp Middle School
Teachers/ or exp Beginning Teachers/ or exp Secondary School Teachers/
21. (teacher* adj3 (elementary or primary or secondary or "high school*")).ti,ab.
22. 20 or 21
23. 3 and 6 and 22
24. 17 or 23
25. 3 and 12 and 22
26. 24 or 25
27. limit 26 to yr="1990 -Current" [4256 hits]
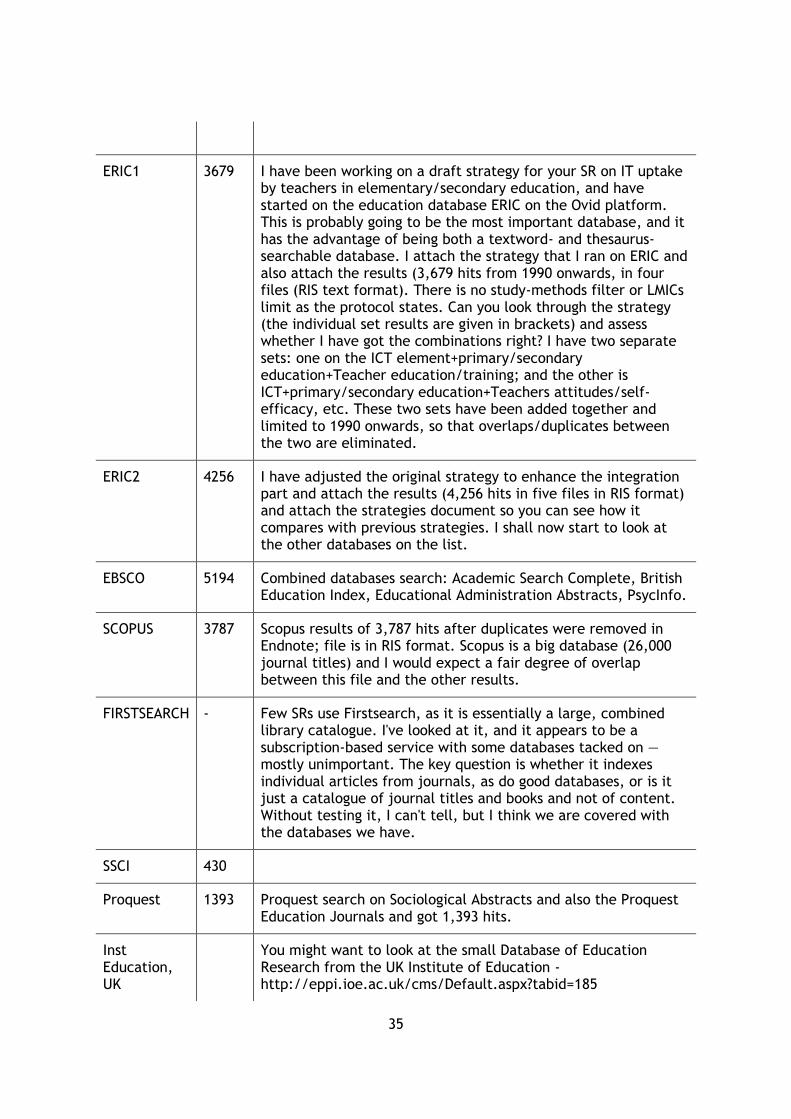
35
ERIC1 3679 I have been working on a draft strategy for your SR on IT uptake by teachers in elementary/secondary education, and have started on the education database ERIC on the Ovid platform. This is probably going to be the most important database, and it has the advantage of being both a textword- and thesaurus-searchable database. I attach the strategy that I ran on ERIC and also attach the results (3,679 hits from 1990 onwards, in four files (RIS text format). There is no study-methods filter or LMICs limit as the protocol states. Can you look through the strategy (the individual set results are given in brackets) and assess whether I have got the combinations right? I have two separate sets: one on the ICT element+primary/secondary education+Teacher education/training; and the other is ICT+primary/secondary education+Teachers attitudes/self-efficacy, etc. These two sets have been added together and limited to 1990 onwards, so that overlaps/duplicates between the two are eliminated.
ERIC2 4256 I have adjusted the original strategy to enhance the integration part and attach the results (4,256 hits in five files in RIS format) and attach the strategies document so you can see how it compares with previous strategies. I shall now start to look at the other databases on the list.
EBSCO 5194 Combined databases search: Academic Search Complete, British Education Index, Educational Administration Abstracts, PsycInfo.
SCOPUS 3787 Scopus results of 3,787 hits after duplicates were removed in Endnote; file is in RIS format. Scopus is a big database (26,000 journal titles) and I would expect a fair degree of overlap between this file and the other results.
FIRSTSEARCH - Few SRs use Firstsearch, as it is essentially a large, combined library catalogue. I've looked at it, and it appears to be a subscription-based service with some databases tacked on — mostly unimportant. The key question is whether it indexes individual articles from journals, as do good databases, or is it just a catalogue of journal titles and books and not of content. Without testing it, I can't tell, but I think we are covered with the databases we have.
SSCI 430
Proquest 1393 Proquest search on Sociological Abstracts and also the Proquest Education Journals and got 1,393 hits.
Inst Education, UK
You might want to look at the small Database of Education Research from the UK Institute of Education - http://eppi.ioe.ac.uk/cms/Default.aspx?tabid=185
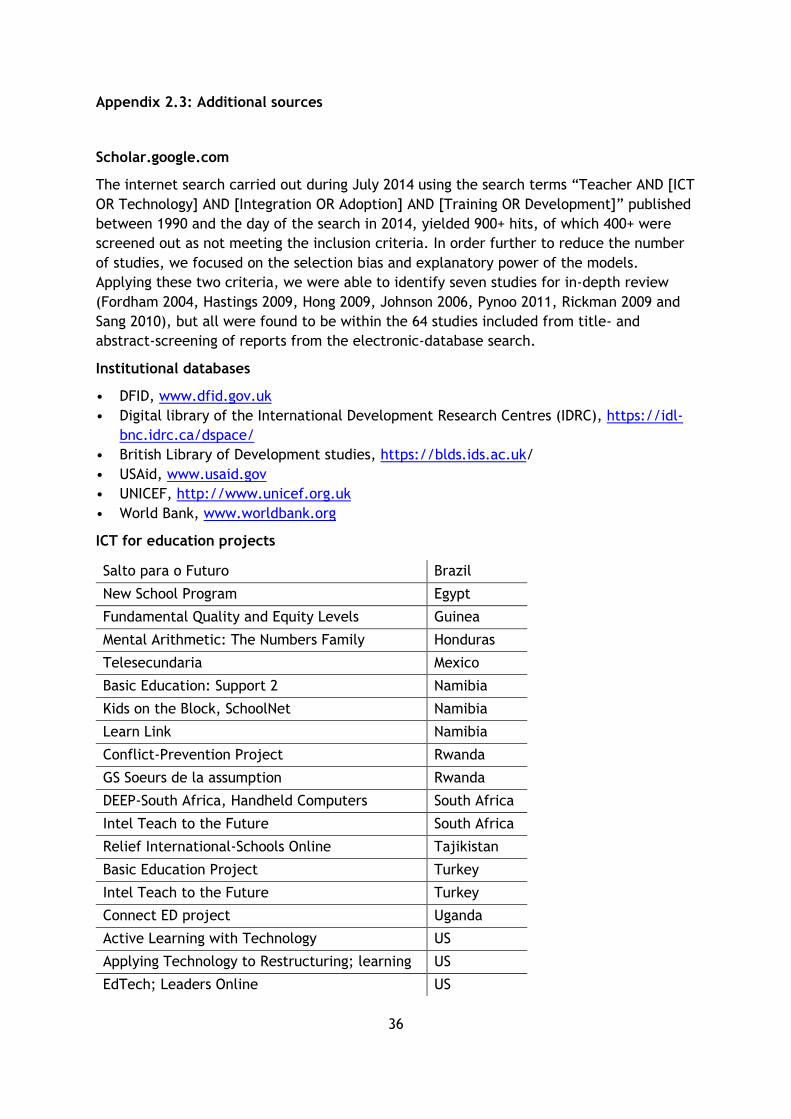
36
Appendix 2.3: Additional sources
Scholar.google.com
The internet search carried out during July 2014 using the search terms “Teacher AND [ICT
OR Technology] AND [Integration OR Adoption] AND [Training OR Development]” published
between 1990 and the day of the search in 2014, yielded 900+ hits, of which 400+ were
screened out as not meeting the inclusion criteria. In order further to reduce the number
of studies, we focused on the selection bias and explanatory power of the models.
Applying these two criteria, we were able to identify seven studies for in-depth review
(Fordham 2004, Hastings 2009, Hong 2009, Johnson 2006, Pynoo 2011, Rickman 2009 and
Sang 2010), but all were found to be within the 64 studies included from title- and
abstract-screening of reports from the electronic-database search.
Institutional databases
• DFID, www.dfid.gov.uk
• Digital library of the International Development Research Centres (IDRC), https://idl-
bnc.idrc.ca/dspace/
• British Library of Development studies, https://blds.ids.ac.uk/
• USAid, www.usaid.gov
• UNICEF, http://www.unicef.org.uk
• World Bank, www.worldbank.org
ICT for education projects
Salto para o Futuro Brazil
New School Program Egypt
Fundamental Quality and Equity Levels Guinea
Mental Arithmetic: The Numbers Family Honduras
Telesecundaria Mexico
Basic Education: Support 2 Namibia
Kids on the Block, SchoolNet Namibia
Learn Link Namibia
Conflict-Prevention Project Rwanda
GS Soeurs de la assumption Rwanda
DEEP-South Africa, Handheld Computers South Africa
Intel Teach to the Future South Africa
Relief International-Schools Online Tajikistan
Basic Education Project Turkey
Intel Teach to the Future Turkey
Connect ED project Uganda
Active Learning with Technology US
Applying Technology to Restructuring; learning US
EdTech; Leaders Online US
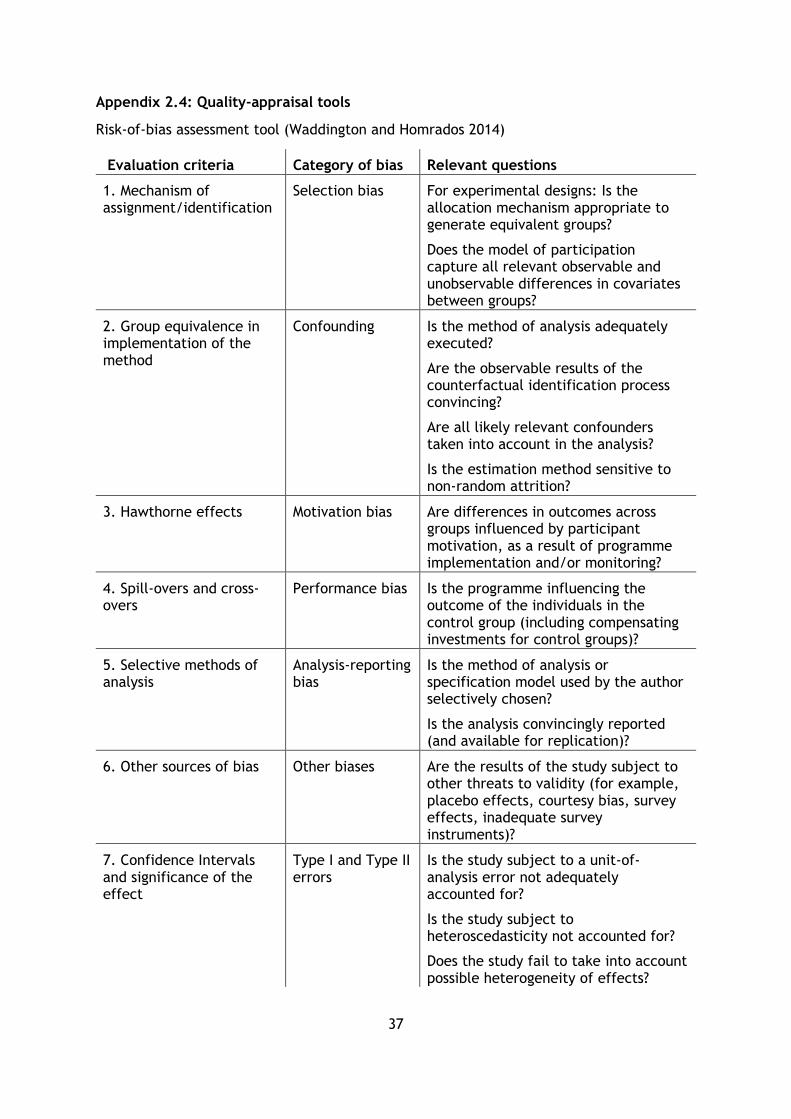
37
Appendix 2.4: Quality-appraisal tools
Risk-of-bias assessment tool (Waddington and Homrados 2014)
Evaluation criteria Category of bias Relevant questions
1. Mechanism of assignment/identification
Selection bias For experimental designs: Is the allocation mechanism appropriate to generate equivalent groups?
Does the model of participation capture all relevant observable and unobservable differences in covariates between groups?
2. Group equivalence in implementation of the method
Confounding Is the method of analysis adequately executed?
Are the observable results of the counterfactual identification process convincing?
Are all likely relevant confounders taken into account in the analysis?
Is the estimation method sensitive to non-random attrition?
3. Hawthorne effects Motivation bias Are differences in outcomes across groups influenced by participant motivation, as a result of programme implementation and/or monitoring?
4. Spill-overs and cross-overs
Performance bias Is the programme influencing the outcome of the individuals in the control group (including compensating investments for control groups)?
5. Selective methods of analysis
Analysis-reporting bias
Is the method of analysis or specification model used by the author selectively chosen?
Is the analysis convincingly reported (and available for replication)?
6. Other sources of bias Other biases Are the results of the study subject to other threats to validity (for example, placebo effects, courtesy bias, survey effects, inadequate survey instruments)?
7. Confidence Intervals and significance of the effect
Type I and Type II errors
Is the study subject to a unit-of-analysis error not adequately accounted for?
Is the study subject to heteroscedasticity not accounted for?
Does the study fail to take into account possible heterogeneity of effects?
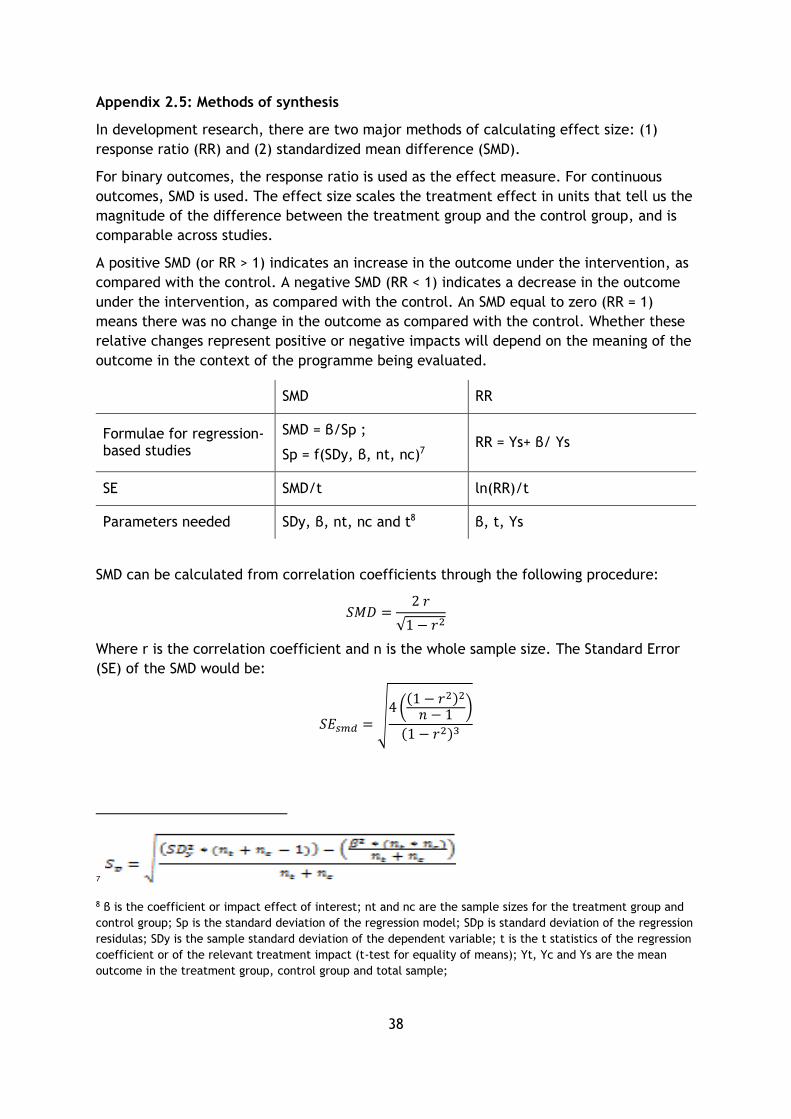
38
Appendix 2.5: Methods of synthesis
In development research, there are two major methods of calculating effect size: (1)
response ratio (RR) and (2) standardized mean difference (SMD).
For binary outcomes, the response ratio is used as the effect measure. For continuous
outcomes, SMD is used. The effect size scales the treatment effect in units that tell us the
magnitude of the difference between the treatment group and the control group, and is
comparable across studies.
A positive SMD (or RR > 1) indicates an increase in the outcome under the intervention, as
compared with the control. A negative SMD (RR < 1) indicates a decrease in the outcome
under the intervention, as compared with the control. An SMD equal to zero (RR = 1)
means there was no change in the outcome as compared with the control. Whether these
relative changes represent positive or negative impacts will depend on the meaning of the
outcome in the context of the programme being evaluated.
SMD RR
Formulae for regression-based studies
SMD = β/Sp ;
Sp = f(SDy, β, nt, nc)7 RR = Ys+ β/ Ys
SE SMD/t ln(RR)/t
Parameters needed SDy, β, nt, nc and t8 β, t, Ys
SMD can be calculated from correlation coefficients through the following procedure:
𝑆𝑀𝐷 =2 𝑟
√1 − 𝑟2
Where r is the correlation coefficient and n is the whole sample size. The Standard Error
(SE) of the SMD would be:
𝑆𝐸𝑠𝑚𝑑 =√
4 ((1 − 𝑟2)2
𝑛 − 1 )
(1 − 𝑟2)3
7
8 β is the coefficient or impact effect of interest; nt and nc are the sample sizes for the treatment group and
control group; Sp is the standard deviation of the regression model; SDp is standard deviation of the regression
residulas; SDy is the sample standard deviation of the dependent variable; t is the t statistics of the regression
coefficient or of the relevant treatment impact (t-test for equality of means); Yt, Yc and Ys are the mean
outcome in the treatment group, control group and total sample;
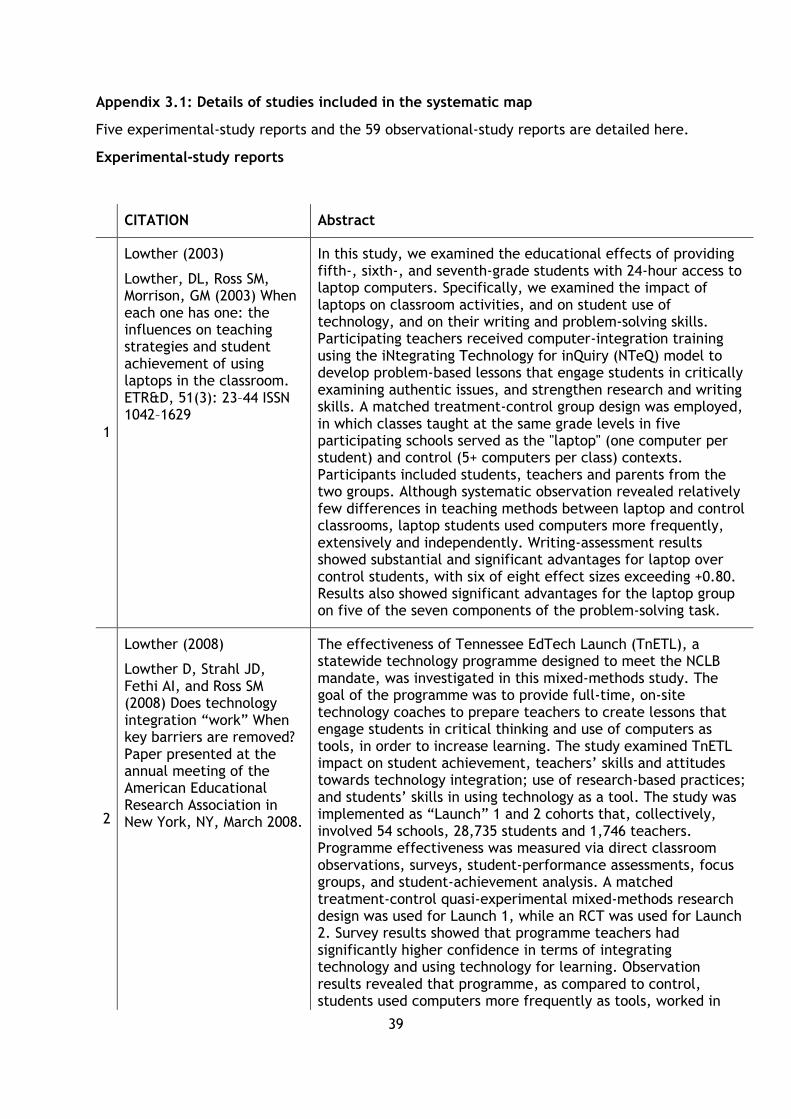
39
Appendix 3.1: Details of studies included in the systematic map
Five experimental-study reports and the 59 observational-study reports are detailed here.
Experimental-study reports
CITATION Abstract
1
Lowther (2003)
Lowther, DL, Ross SM, Morrison, GM (2003) When each one has one: the influences on teaching strategies and student achievement of using laptops in the classroom. ETR&D, 51(3): 23–44 ISSN 1042–1629
In this study, we examined the educational effects of providing fifth-, sixth-, and seventh-grade students with 24-hour access to laptop computers. Specifically, we examined the impact of laptops on classroom activities, and on student use of technology, and on their writing and problem-solving skills. Participating teachers received computer-integration training using the iNtegrating Technology for inQuiry (NTeQ) model to develop problem-based lessons that engage students in critically examining authentic issues, and strengthen research and writing skills. A matched treatment-control group design was employed, in which classes taught at the same grade levels in five participating schools served as the "laptop" (one computer per student) and control (5+ computers per class) contexts. Participants included students, teachers and parents from the two groups. Although systematic observation revealed relatively few differences in teaching methods between laptop and control classrooms, laptop students used computers more frequently, extensively and independently. Writing-assessment results showed substantial and significant advantages for laptop over control students, with six of eight effect sizes exceeding +0.80. Results also showed significant advantages for the laptop group on five of the seven components of the problem-solving task.
2
Lowther (2008)
Lowther D, Strahl JD, Fethi AI, and Ross SM (2008) Does technology integration “work” When key barriers are removed? Paper presented at the annual meeting of the American Educational Research Association in New York, NY, March 2008.
The effectiveness of Tennessee EdTech Launch (TnETL), a statewide technology programme designed to meet the NCLB mandate, was investigated in this mixed-methods study. The goal of the programme was to provide full-time, on-site technology coaches to prepare teachers to create lessons that engage students in critical thinking and use of computers as tools, in order to increase learning. The study examined TnETL impact on student achievement, teachers’ skills and attitudes towards technology integration; use of research-based practices; and students’ skills in using technology as a tool. The study was implemented as “Launch” 1 and 2 cohorts that, collectively, involved 54 schools, 28,735 students and 1,746 teachers. Programme effectiveness was measured via direct classroom observations, surveys, student-performance assessments, focus groups, and student-achievement analysis. A matched treatment-control quasi-experimental mixed-methods research design was used for Launch 1, while an RCT was used for Launch 2. Survey results showed that programme teachers had significantly higher confidence in terms of integrating technology and using technology for learning. Observation results revealed that programme, as compared to control, students used computers more frequently as tools, worked in
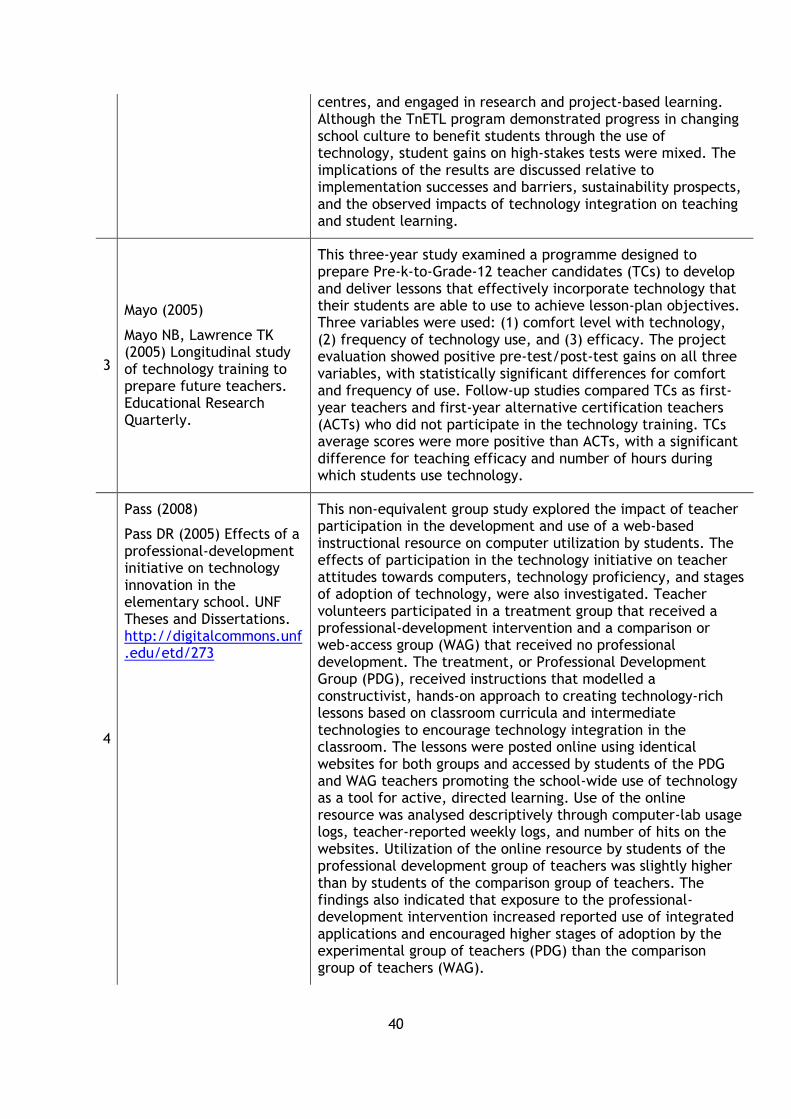
40
centres, and engaged in research and project-based learning. Although the TnETL program demonstrated progress in changing school culture to benefit students through the use of technology, student gains on high-stakes tests were mixed. The implications of the results are discussed relative to implementation successes and barriers, sustainability prospects, and the observed impacts of technology integration on teaching and student learning.
3
Mayo (2005)
Mayo NB, Lawrence TK (2005) Longitudinal study of technology training to prepare future teachers. Educational Research Quarterly.
This three-year study examined a programme designed to prepare Pre-k-to-Grade-12 teacher candidates (TCs) to develop and deliver lessons that effectively incorporate technology that their students are able to use to achieve lesson-plan objectives. Three variables were used: (1) comfort level with technology, (2) frequency of technology use, and (3) efficacy. The project evaluation showed positive pre-test/post-test gains on all three variables, with statistically significant differences for comfort and frequency of use. Follow-up studies compared TCs as first-year teachers and first-year alternative certification teachers (ACTs) who did not participate in the technology training. TCs average scores were more positive than ACTs, with a significant difference for teaching efficacy and number of hours during which students use technology.
4
Pass (2008)
Pass DR (2005) Effects of a professional-development initiative on technology innovation in the elementary school. UNF Theses and Dissertations. http://digitalcommons.unf.edu/etd/273
This non-equivalent group study explored the impact of teacher participation in the development and use of a web-based instructional resource on computer utilization by students. The effects of participation in the technology initiative on teacher attitudes towards computers, technology proficiency, and stages of adoption of technology, were also investigated. Teacher volunteers participated in a treatment group that received a professional-development intervention and a comparison or web-access group (WAG) that received no professional development. The treatment, or Professional Development Group (PDG), received instructions that modelled a constructivist, hands-on approach to creating technology-rich lessons based on classroom curricula and intermediate technologies to encourage technology integration in the classroom. The lessons were posted online using identical websites for both groups and accessed by students of the PDG and WAG teachers promoting the school-wide use of technology as a tool for active, directed learning. Use of the online resource was analysed descriptively through computer-lab usage logs, teacher-reported weekly logs, and number of hits on the websites. Utilization of the online resource by students of the professional development group of teachers was slightly higher than by students of the comparison group of teachers. The findings also indicated that exposure to the professional-development intervention increased reported use of integrated applications and encouraged higher stages of adoption by the experimental group of teachers (PDG) than the comparison group of teachers (WAG).
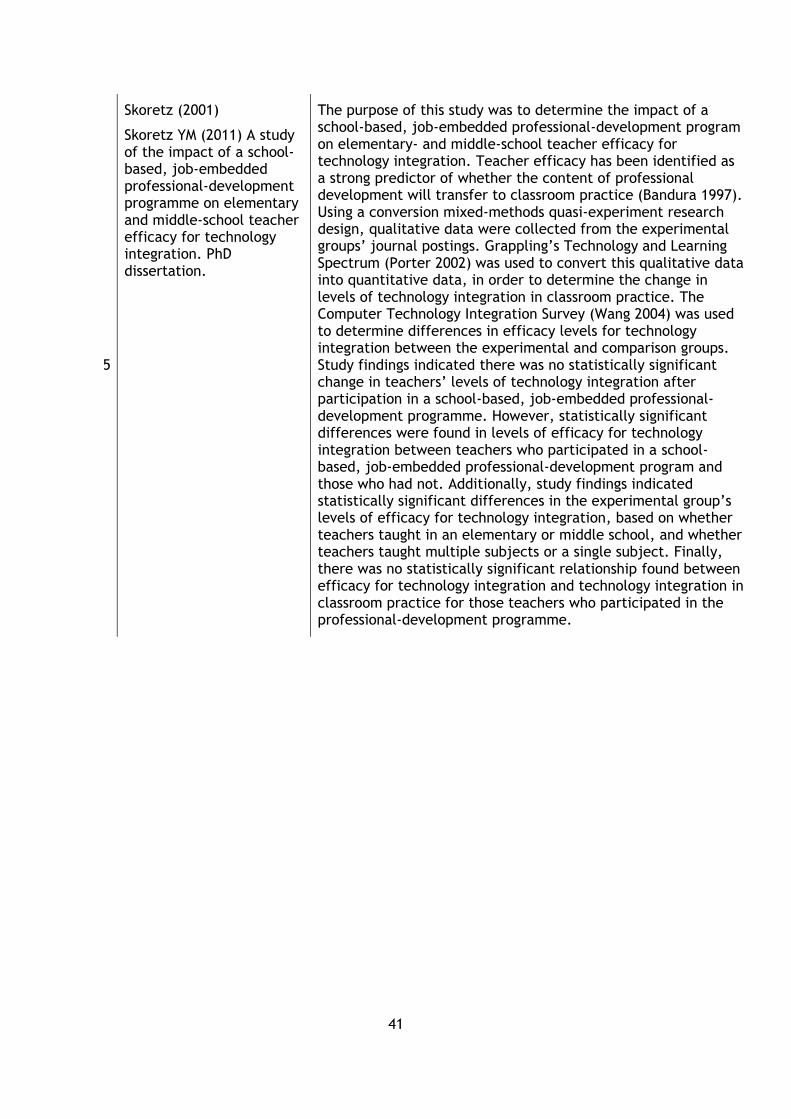
41
5
Skoretz (2001)
Skoretz YM (2011) A study of the impact of a school-based, job-embedded professional-development programme on elementary and middle-school teacher efficacy for technology integration. PhD dissertation.
The purpose of this study was to determine the impact of a school-based, job-embedded professional-development program on elementary- and middle-school teacher efficacy for technology integration. Teacher efficacy has been identified as a strong predictor of whether the content of professional development will transfer to classroom practice (Bandura 1997). Using a conversion mixed-methods quasi-experiment research design, qualitative data were collected from the experimental groups’ journal postings. Grappling’s Technology and Learning Spectrum (Porter 2002) was used to convert this qualitative data into quantitative data, in order to determine the change in levels of technology integration in classroom practice. The Computer Technology Integration Survey (Wang 2004) was used to determine differences in efficacy levels for technology integration between the experimental and comparison groups. Study findings indicated there was no statistically significant change in teachers’ levels of technology integration after participation in a school-based, job-embedded professional-development programme. However, statistically significant differences were found in levels of efficacy for technology integration between teachers who participated in a school-based, job-embedded professional-development program and those who had not. Additionally, study findings indicated statistically significant differences in the experimental group’s levels of efficacy for technology integration, based on whether teachers taught in an elementary or middle school, and whether teachers taught multiple subjects or a single subject. Finally, there was no statistically significant relationship found between efficacy for technology integration and technology integration in classroom practice for those teachers who participated in the professional-development programme.
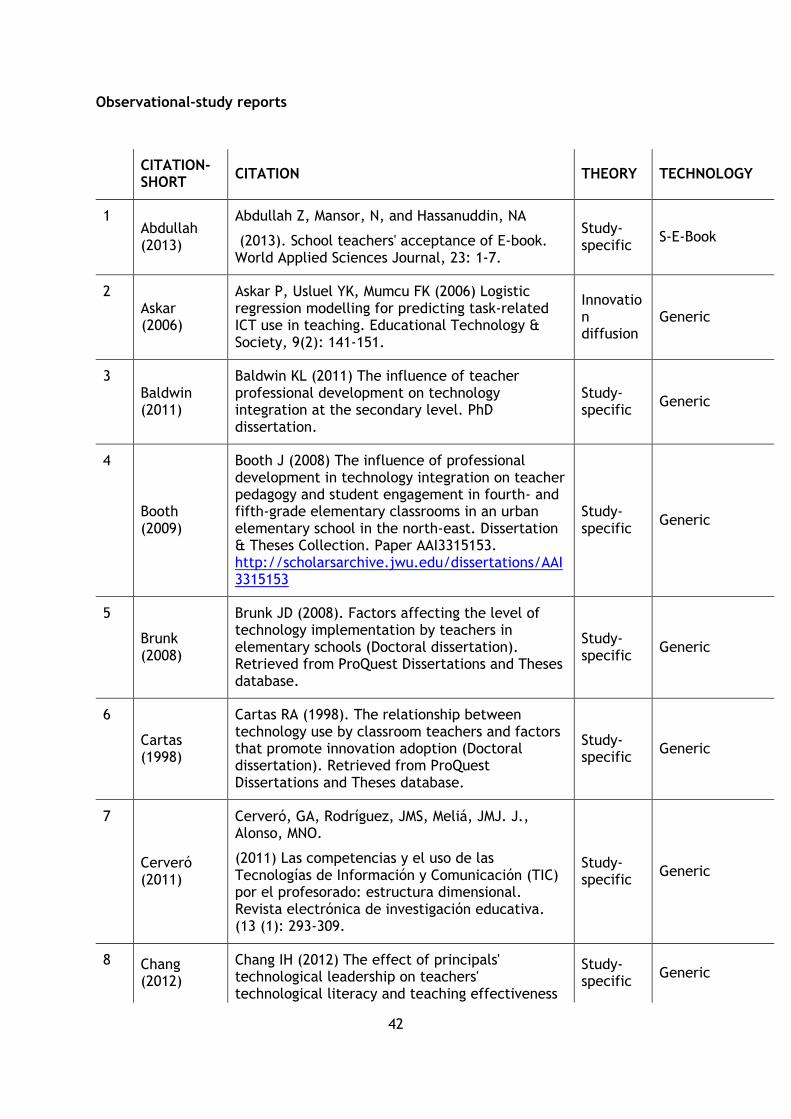
42
Observational-study reports
CITATION-SHORT
CITATION THEORY TECHNOLOGY
1 Abdullah (2013)
Abdullah Z, Mansor, N, and Hassanuddin, NA
(2013). School teachers' acceptance of E-book. World Applied Sciences Journal, 23: 1-7.
Study-specific
S-E-Book
2 Askar (2006)
Askar P, Usluel YK, Mumcu FK (2006) Logistic regression modelling for predicting task-related ICT use in teaching. Educational Technology & Society, 9(2): 141-151.
Innovation diffusion
Generic
3 Baldwin (2011)
Baldwin KL (2011) The influence of teacher professional development on technology integration at the secondary level. PhD dissertation.
Study-specific
Generic
4
Booth (2009)
Booth J (2008) The influence of professional development in technology integration on teacher pedagogy and student engagement in fourth- and fifth-grade elementary classrooms in an urban elementary school in the north-east. Dissertation & Theses Collection. Paper AAI3315153. http://scholarsarchive.jwu.edu/dissertations/AAI3315153
Study-specific
Generic
5
Brunk (2008)
Brunk JD (2008). Factors affecting the level of technology implementation by teachers in elementary schools (Doctoral dissertation). Retrieved from ProQuest Dissertations and Theses database.
Study-specific
Generic
6
Cartas (1998)
Cartas RA (1998). The relationship between technology use by classroom teachers and factors that promote innovation adoption (Doctoral dissertation). Retrieved from ProQuest Dissertations and Theses database.
Study-specific
Generic
7
Cerveró (2011)
Cerveró, GA, Rodríguez, JMS, Meliá, JMJ. J., Alonso, MNO.
(2011) Las competencias y el uso de las Tecnologías de Información y Comunicación (TIC) por el profesorado: estructura dimensional. Revista electrónica de investigación educativa. (13 (1): 293-309.
Study-specific
Generic
8 Chang (2012)
Chang IH (2012) The effect of principals' technological leadership on teachers' technological literacy and teaching effectiveness
Study-specific
Generic
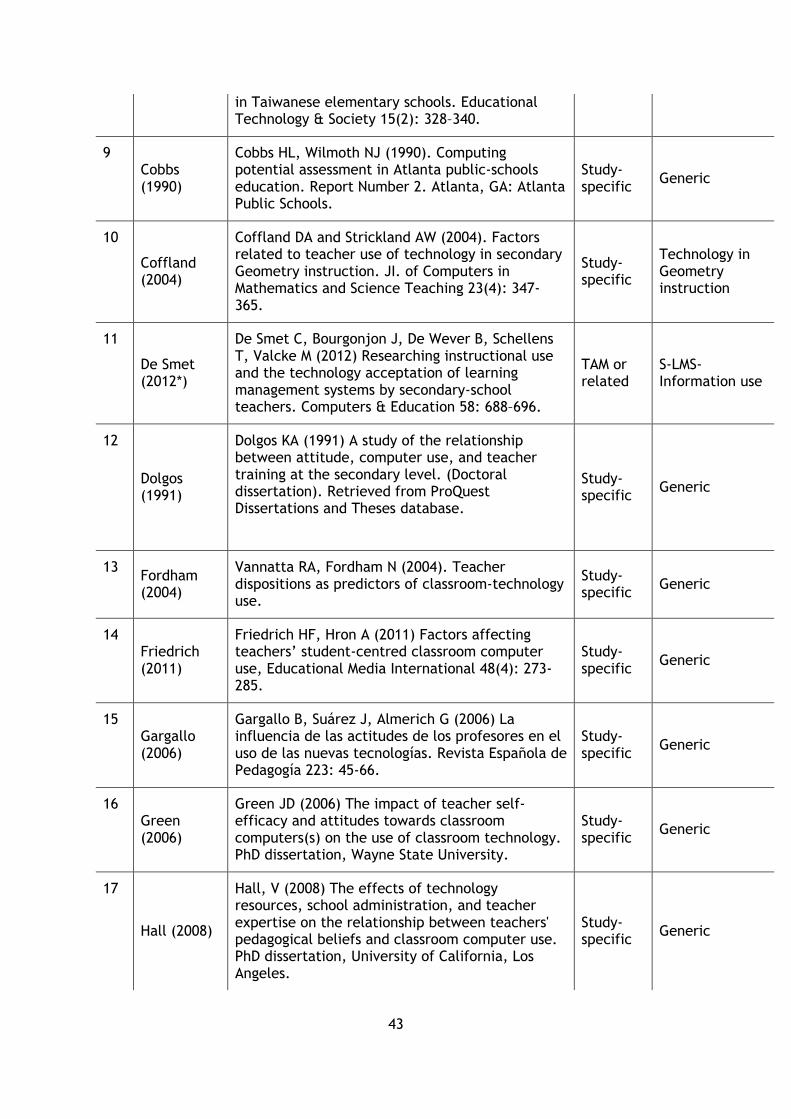
43
in Taiwanese elementary schools. Educational Technology & Society 15(2): 328–340.
9 Cobbs (1990)
Cobbs HL, Wilmoth NJ (1990). Computing potential assessment in Atlanta public-schools education. Report Number 2. Atlanta, GA: Atlanta Public Schools.
Study-specific
Generic
10
Coffland (2004)
Coffland DA and Strickland AW (2004). Factors related to teacher use of technology in secondary Geometry instruction. JI. of Computers in Mathematics and Science Teaching 23(4): 347-365.
Study-specific
Technology in Geometry instruction
11
De Smet (2012*)
De Smet C, Bourgonjon J, De Wever B, Schellens T, Valcke M (2012) Researching instructional use and the technology acceptation of learning management systems by secondary-school teachers. Computers & Education 58: 688–696.
TAM or related
S-LMS-Information use
12
Dolgos (1991)
Dolgos KA (1991) A study of the relationship between attitude, computer use, and teacher training at the secondary level. (Doctoral dissertation). Retrieved from ProQuest Dissertations and Theses database.
Study-specific
Generic
13 Fordham (2004)
Vannatta RA, Fordham N (2004). Teacher dispositions as predictors of classroom-technology use.
Study-specific
Generic
14 Friedrich (2011)
Friedrich HF, Hron A (2011) Factors affecting teachers’ student-centred classroom computer use, Educational Media International 48(4): 273-285.
Study-specific
Generic
15 Gargallo (2006)
Gargallo B, Suárez J, Almerich G (2006) La influencia de las actitudes de los profesores en el uso de las nuevas tecnologías. Revista Española de Pedagogía 223: 45-66.
Study-specific
Generic
16 Green (2006)
Green JD (2006) The impact of teacher self-efficacy and attitudes towards classroom computers(s) on the use of classroom technology. PhD dissertation, Wayne State University.
Study-specific
Generic
17
Hall (2008)
Hall, V (2008) The effects of technology resources, school administration, and teacher expertise on the relationship between teachers' pedagogical beliefs and classroom computer use. PhD dissertation, University of California, Los Angeles.
Study-specific
Generic
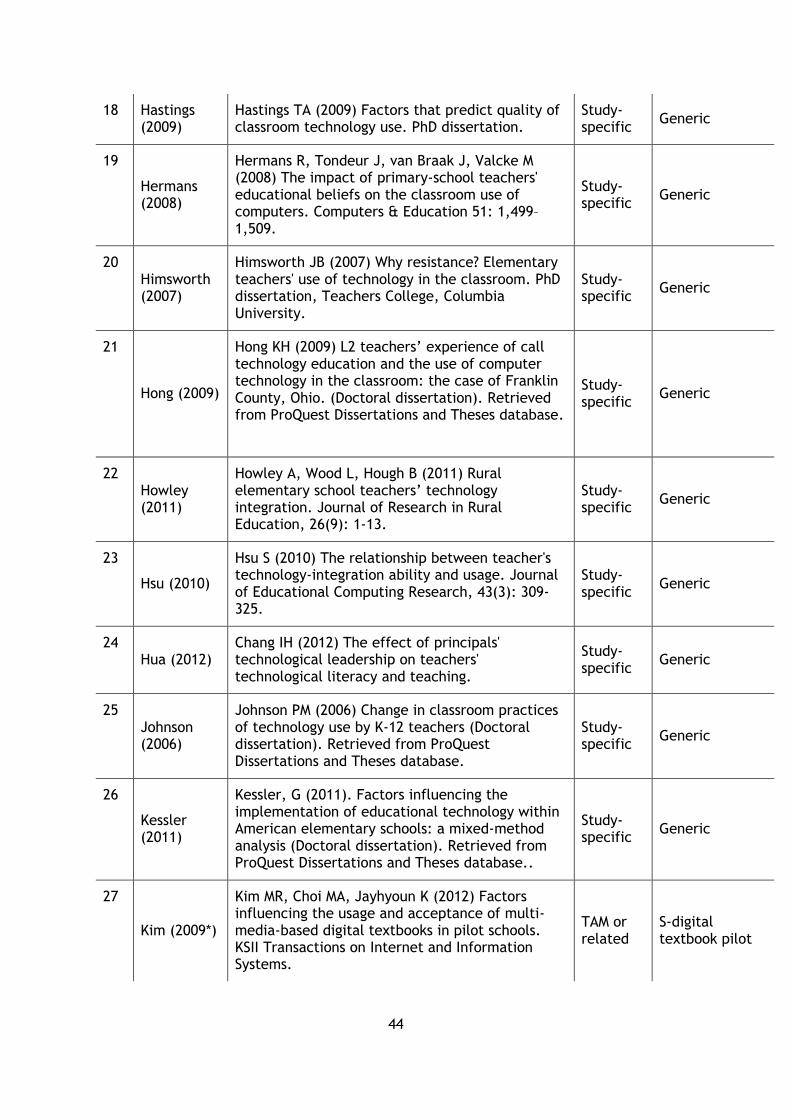
44
18 Hastings (2009)
Hastings TA (2009) Factors that predict quality of classroom technology use. PhD dissertation.
Study-specific
Generic
19
Hermans (2008)
Hermans R, Tondeur J, van Braak J, Valcke M (2008) The impact of primary-school teachers' educational beliefs on the classroom use of computers. Computers & Education 51: 1,499–1,509.
Study-specific
Generic
20 Himsworth (2007)
Himsworth JB (2007) Why resistance? Elementary teachers' use of technology in the classroom. PhD dissertation, Teachers College, Columbia University.
Study-specific
Generic
21
Hong (2009)
Hong KH (2009) L2 teachers’ experience of call technology education and the use of computer technology in the classroom: the case of Franklin County, Ohio. (Doctoral dissertation). Retrieved from ProQuest Dissertations and Theses database.
Study-specific
Generic
22 Howley (2011)
Howley A, Wood L, Hough B (2011) Rural elementary school teachers’ technology integration. Journal of Research in Rural Education, 26(9): 1-13.
Study-specific
Generic
23
Hsu (2010)
Hsu S (2010) The relationship between teacher's technology-integration ability and usage. Journal of Educational Computing Research, 43(3): 309-325.
Study-specific
Generic
24 Hua (2012)
Chang IH (2012) The effect of principals' technological leadership on teachers' technological literacy and teaching.
Study-specific
Generic
25 Johnson (2006)
Johnson PM (2006) Change in classroom practices of technology use by K-12 teachers (Doctoral dissertation). Retrieved from ProQuest Dissertations and Theses database.
Study-specific
Generic
26
Kessler (2011)
Kessler, G (2011). Factors influencing the implementation of educational technology within American elementary schools: a mixed-method analysis (Doctoral dissertation). Retrieved from ProQuest Dissertations and Theses database..
Study-specific
Generic
27
Kim (2009*)
Kim MR, Choi MA, Jayhyoun K (2012) Factors influencing the usage and acceptance of multi-media-based digital textbooks in pilot schools. KSII Transactions on Internet and Information Systems.
TAM or related
S-digital textbook pilot
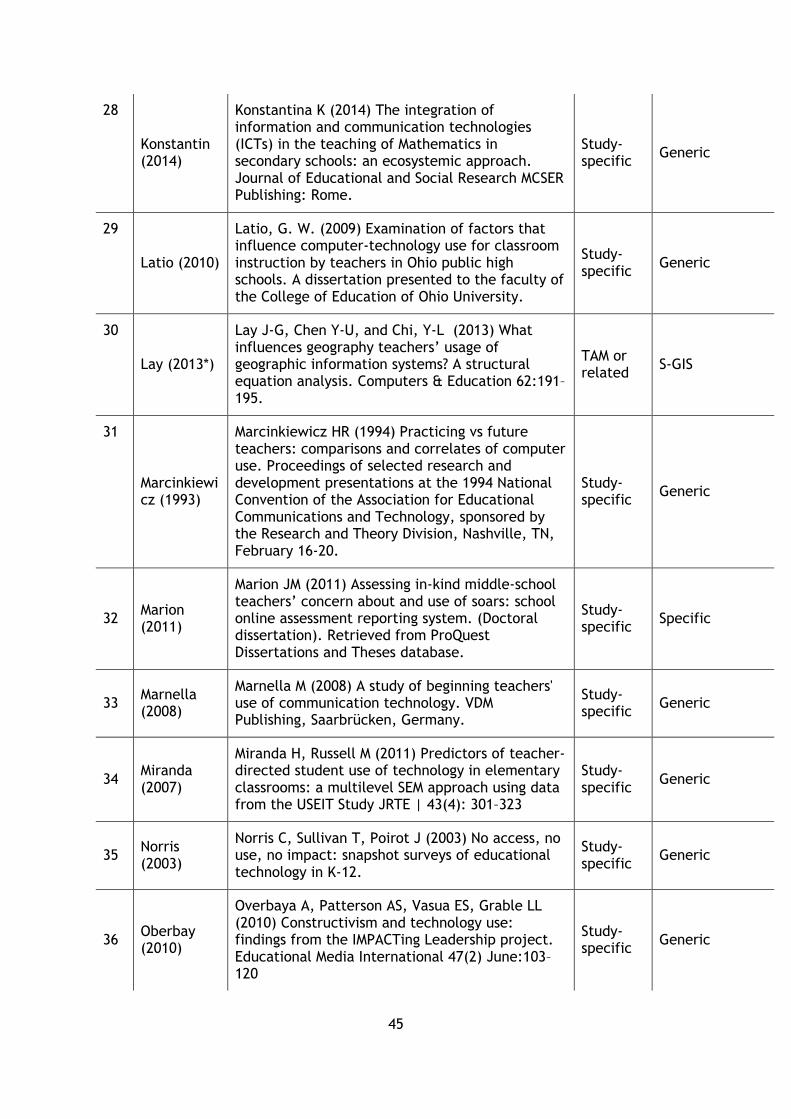
45
28
Konstantin (2014)
Konstantina K (2014) The integration of information and communication technologies (ICTs) in the teaching of Mathematics in secondary schools: an ecosystemic approach. Journal of Educational and Social Research MCSER Publishing: Rome.
Study-specific
Generic
29
Latio (2010)
Latio, G. W. (2009) Examination of factors that influence computer-technology use for classroom instruction by teachers in Ohio public high schools. A dissertation presented to the faculty of the College of Education of Ohio University.
Study-specific
Generic
30
Lay (2013*)
Lay J-G, Chen Y-U, and Chi, Y-L (2013) What influences geography teachers’ usage of geographic information systems? A structural equation analysis. Computers & Education 62:191–195.
TAM or related
S-GIS
31
Marcinkiewicz (1993)
Marcinkiewicz HR (1994) Practicing vs future teachers: comparisons and correlates of computer use. Proceedings of selected research and development presentations at the 1994 National Convention of the Association for Educational Communications and Technology, sponsored by the Research and Theory Division, Nashville, TN, February 16-20.
Study-specific
Generic
32 Marion (2011)
Marion JM (2011) Assessing in-kind middle-school teachers’ concern about and use of soars: school online assessment reporting system. (Doctoral dissertation). Retrieved from ProQuest Dissertations and Theses database.
Study-specific
Specific
33 Marnella (2008)
Marnella M (2008) A study of beginning teachers' use of communication technology. VDM Publishing, Saarbrücken, Germany.
Study-specific
Generic
34 Miranda (2007)
Miranda H, Russell M (2011) Predictors of teacher-directed student use of technology in elementary classrooms: a multilevel SEM approach using data from the USEIT Study JRTE | 43(4): 301–323
Study-specific
Generic
35 Norris (2003)
Norris C, Sullivan T, Poirot J (2003) No access, no use, no impact: snapshot surveys of educational technology in K-12.
Study-specific
Generic
36 Oberbay (2010)
Overbaya A, Patterson AS, Vasua ES, Grable LL (2010) Constructivism and technology use: findings from the IMPACTing Leadership project. Educational Media International 47(2) June:103–120
Study-specific
Generic
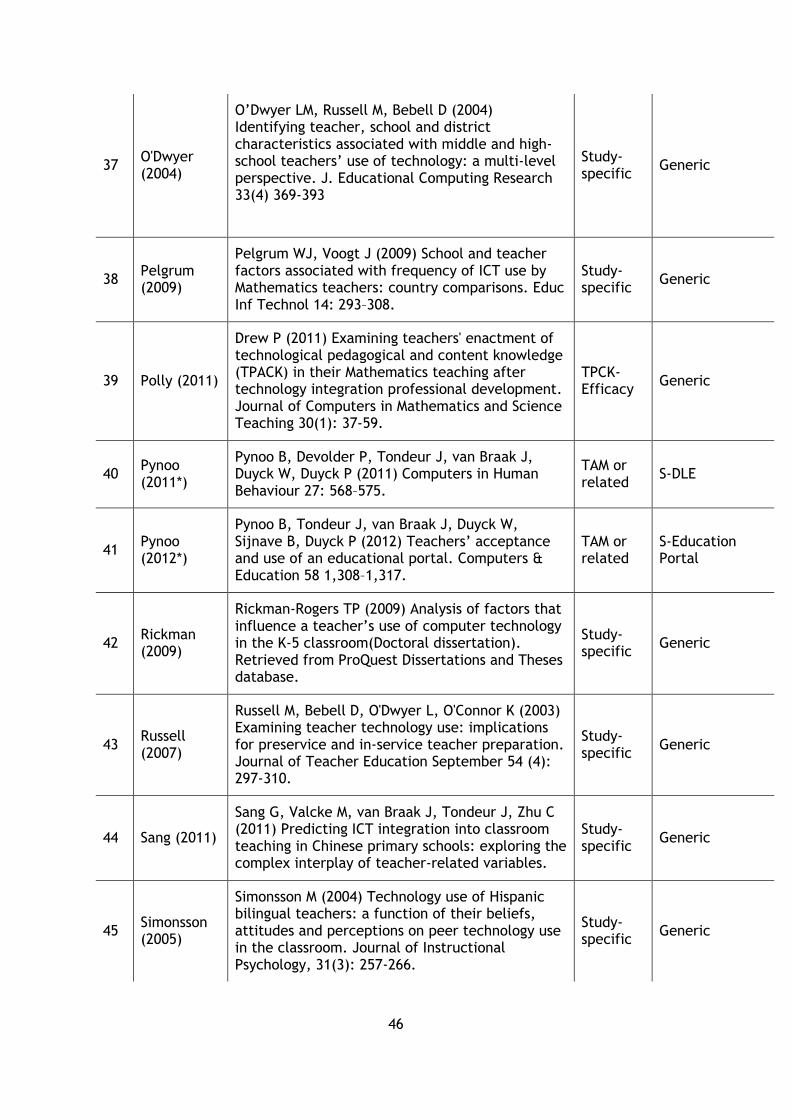
46
37 O'Dwyer (2004)
O’Dwyer LM, Russell M, Bebell D (2004) Identifying teacher, school and district characteristics associated with middle and high-school teachers’ use of technology: a multi-level perspective. J. Educational Computing Research 33(4) 369-393
Study-specific
Generic
38 Pelgrum (2009)
Pelgrum WJ, Voogt J (2009) School and teacher factors associated with frequency of ICT use by Mathematics teachers: country comparisons. Educ Inf Technol 14: 293–308.
Study-specific
Generic
39 Polly (2011)
Drew P (2011) Examining teachers' enactment of technological pedagogical and content knowledge (TPACK) in their Mathematics teaching after technology integration professional development. Journal of Computers in Mathematics and Science Teaching 30(1): 37-59.
TPCK-Efficacy
Generic
40 Pynoo (2011*)
Pynoo B, Devolder P, Tondeur J, van Braak J, Duyck W, Duyck P (2011) Computers in Human Behaviour 27: 568–575.
TAM or related
S-DLE
41 Pynoo (2012*)
Pynoo B, Tondeur J, van Braak J, Duyck W, Sijnave B, Duyck P (2012) Teachers’ acceptance and use of an educational portal. Computers & Education 58 1,308–1,317.
TAM or related
S-Education Portal
42 Rickman (2009)
Rickman-Rogers TP (2009) Analysis of factors that influence a teacher’s use of computer technology in the K-5 classroom(Doctoral dissertation). Retrieved from ProQuest Dissertations and Theses database.
Study-specific
Generic
43 Russell (2007)
Russell M, Bebell D, O'Dwyer L, O'Connor K (2003) Examining teacher technology use: implications for preservice and in-service teacher preparation. Journal of Teacher Education September 54 (4): 297-310.
Study-specific
Generic
44 Sang (2011)
Sang G, Valcke M, van Braak J, Tondeur J, Zhu C (2011) Predicting ICT integration into classroom teaching in Chinese primary schools: exploring the complex interplay of teacher-related variables.
Study-specific
Generic
45 Simonsson (2005)
Simonsson M (2004) Technology use of Hispanic bilingual teachers: a function of their beliefs, attitudes and perceptions on peer technology use in the classroom. Journal of Instructional Psychology, 31(3): 257-266.
Study-specific
Generic
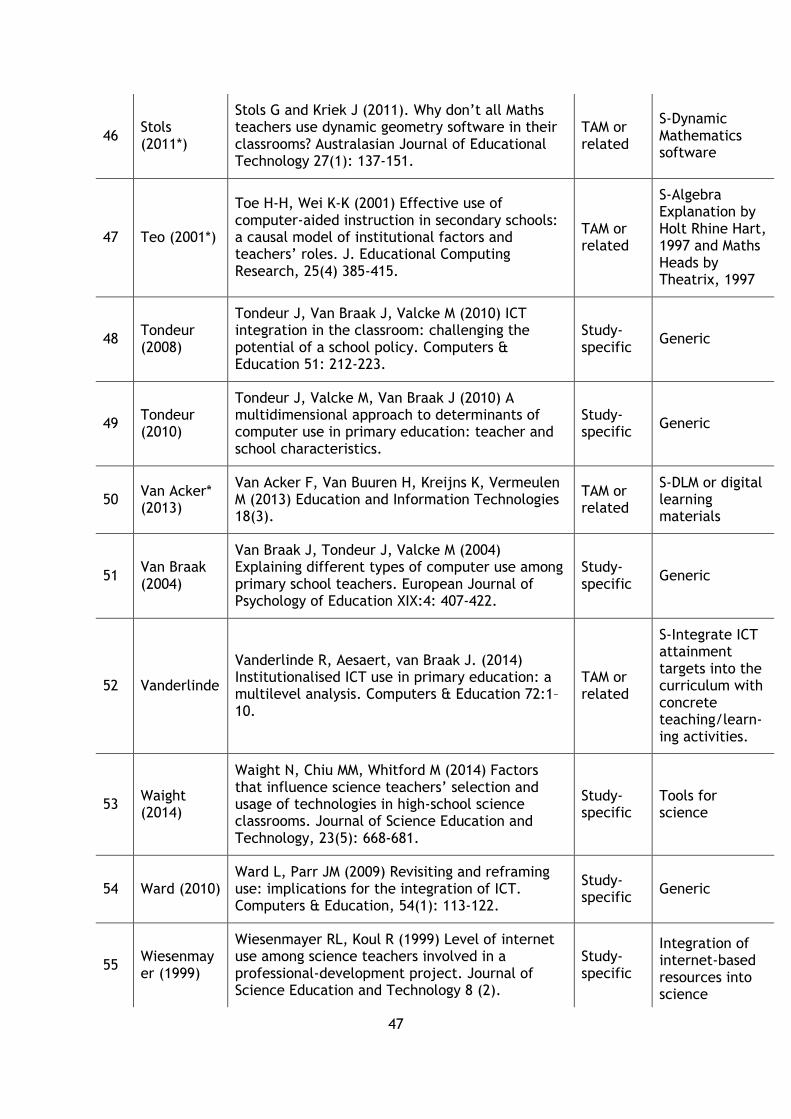
47
46 Stols (2011*)
Stols G and Kriek J (2011). Why don’t all Maths teachers use dynamic geometry software in their classrooms? Australasian Journal of Educational Technology 27(1): 137-151.
TAM or related
S-Dynamic Mathematics software
47 Teo (2001*)
Toe H-H, Wei K-K (2001) Effective use of computer-aided instruction in secondary schools: a causal model of institutional factors and teachers’ roles. J. Educational Computing Research, 25(4) 385-415.
TAM or related
S-Algebra Explanation by Holt Rhine Hart, 1997 and Maths Heads by Theatrix, 1997
48 Tondeur (2008)
Tondeur J, Van Braak J, Valcke M (2010) ICT integration in the classroom: challenging the potential of a school policy. Computers & Education 51: 212-223.
Study-specific
Generic
49 Tondeur (2010)
Tondeur J, Valcke M, Van Braak J (2010) A multidimensional approach to determinants of computer use in primary education: teacher and school characteristics.
Study-specific
Generic
50 Van Acker* (2013)
Van Acker F, Van Buuren H, Kreijns K, Vermeulen M (2013) Education and Information Technologies 18(3).
TAM or related
S-DLM or digital learning materials
51 Van Braak (2004)
Van Braak J, Tondeur J, Valcke M (2004) Explaining different types of computer use among primary school teachers. European Journal of Psychology of Education XIX:4: 407-422.
Study-specific
Generic
52 Vanderlinde
Vanderlinde R, Aesaert, van Braak J. (2014) Institutionalised ICT use in primary education: a multilevel analysis. Computers & Education 72:1–10.
TAM or related
S-Integrate ICT attainment targets into the curriculum with concrete teaching/learn-ing activities.
53 Waight (2014)
Waight N, Chiu MM, Whitford M (2014) Factors that influence science teachers’ selection and usage of technologies in high-school science classrooms. Journal of Science Education and Technology, 23(5): 668-681.
Study-specific
Tools for science
54 Ward (2010) Ward L, Parr JM (2009) Revisiting and reframing use: implications for the integration of ICT. Computers & Education, 54(1): 113-122.
Study-specific
Generic
55 Wiesenmayer (1999)
Wiesenmayer RL, Koul R (1999) Level of internet use among science teachers involved in a professional-development project. Journal of Science Education and Technology 8 (2).
Study-specific
Integration of internet-based resources into science
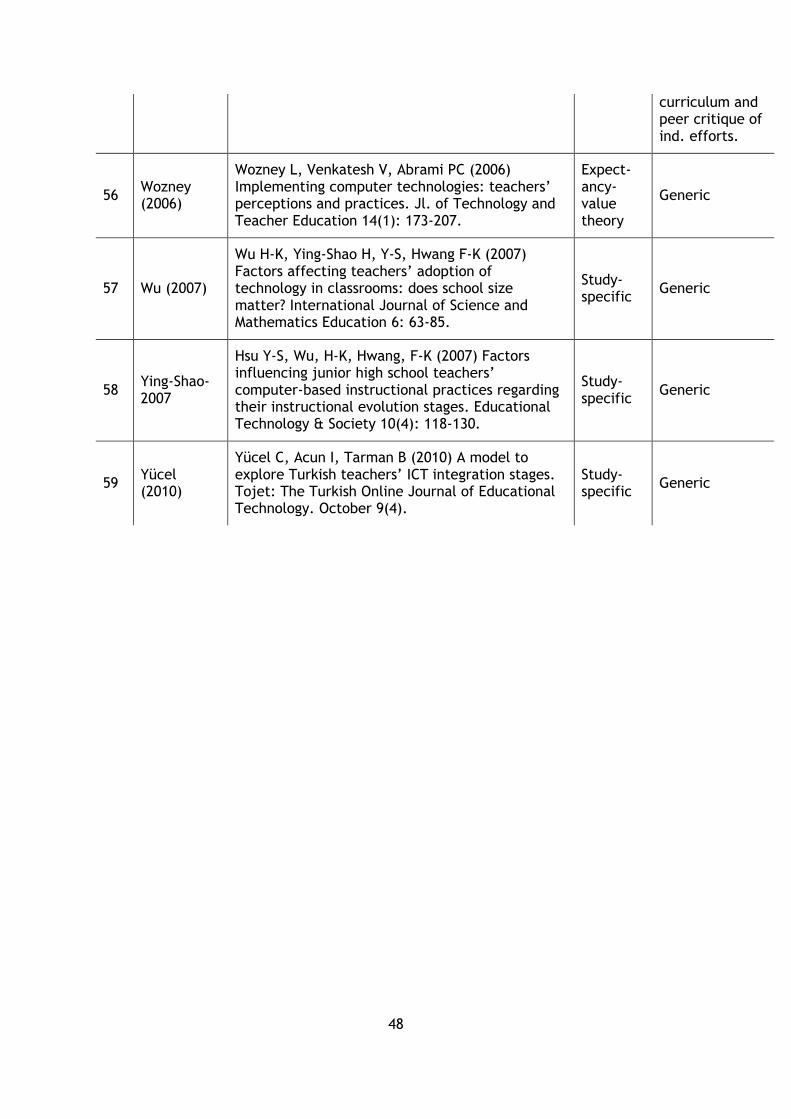
48
curriculum and peer critique of ind. efforts.
56 Wozney (2006)
Wozney L, Venkatesh V, Abrami PC (2006) Implementing computer technologies: teachers’ perceptions and practices. Jl. of Technology and Teacher Education 14(1): 173-207.
Expect-ancy-value theory
Generic
57 Wu (2007)
Wu H-K, Ying-Shao H, Y-S, Hwang F-K (2007) Factors affecting teachers’ adoption of technology in classrooms: does school size matter? International Journal of Science and Mathematics Education 6: 63-85.
Study-specific
Generic
58 Ying-Shao-2007
Hsu Y-S, Wu, H-K, Hwang, F-K (2007) Factors influencing junior high school teachers’ computer-based instructional practices regarding their instructional evolution stages. Educational Technology & Society 10(4): 118-130.
Study-specific
Generic
59 Yücel (2010)
Yücel C, Acun I, Tarman B (2010) A model to explore Turkish teachers’ ICT integration stages. Tojet: The Turkish Online Journal of Educational Technology. October 9(4).
Study-specific
Generic
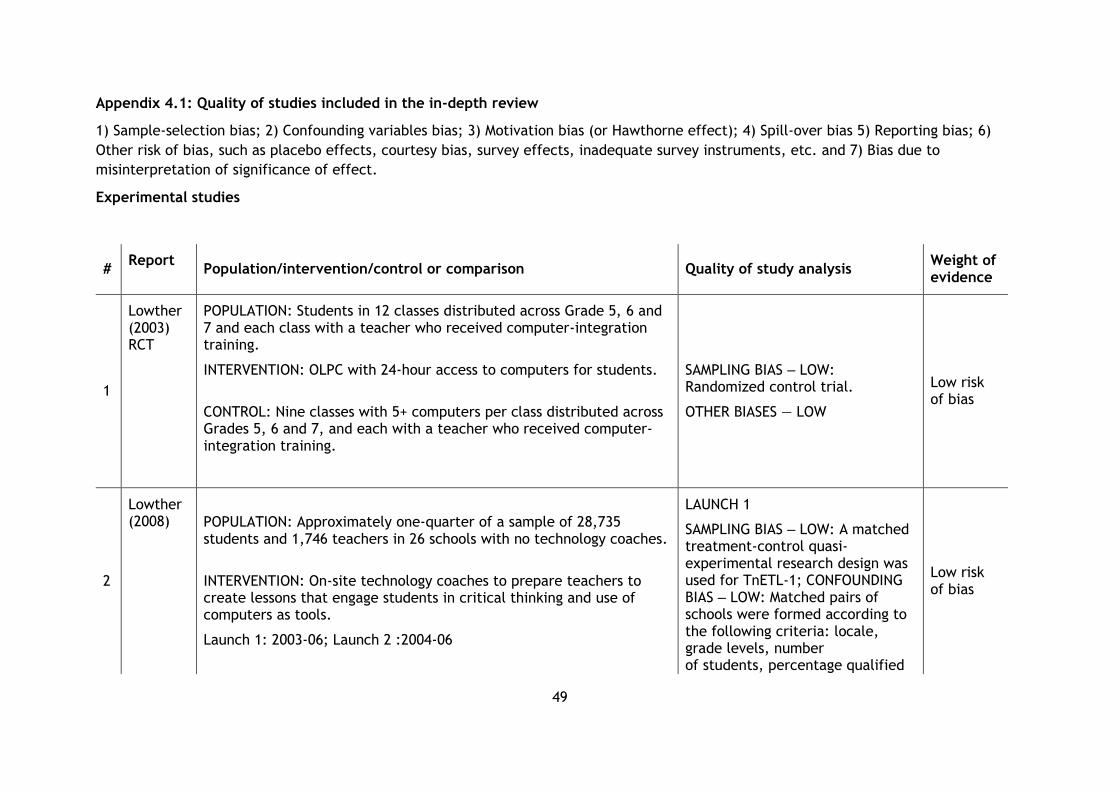
49
Appendix 4.1: Quality of studies included in the in-depth review
1) Sample-selection bias; 2) Confounding variables bias; 3) Motivation bias (or Hawthorne effect); 4) Spill-over bias 5) Reporting bias; 6)
Other risk of bias, such as placebo effects, courtesy bias, survey effects, inadequate survey instruments, etc. and 7) Bias due to
misinterpretation of significance of effect.
Experimental studies
# Report
Population/intervention/control or comparison Quality of study analysis Weight of evidence
1
Lowther (2003) RCT
POPULATION: Students in 12 classes distributed across Grade 5, 6 and 7 and each class with a teacher who received computer-integration training.
INTERVENTION: OLPC with 24-hour access to computers for students.
CONTROL: Nine classes with 5+ computers per class distributed across Grades 5, 6 and 7, and each with a teacher who received computer-integration training.
SAMPLING BIAS ‒ LOW: Randomized control trial.
OTHER BIASES — LOW
Low risk of bias
2
Lowther (2008) POPULATION: Approximately one-quarter of a sample of 28,735
students and 1,746 teachers in 26 schools with no technology coaches.
INTERVENTION: On-site technology coaches to prepare teachers to create lessons that engage students in critical thinking and use of computers as tools.
Launch 1: 2003-06; Launch 2 :2004-06
LAUNCH 1
SAMPLING BIAS ‒ LOW: A matched treatment-control quasi-experimental research design was used for TnETL-1; CONFOUNDING BIAS ‒ LOW: Matched pairs of schools were formed according to the following criteria: locale, grade levels, number of students, percentage qualified
Low risk of bias
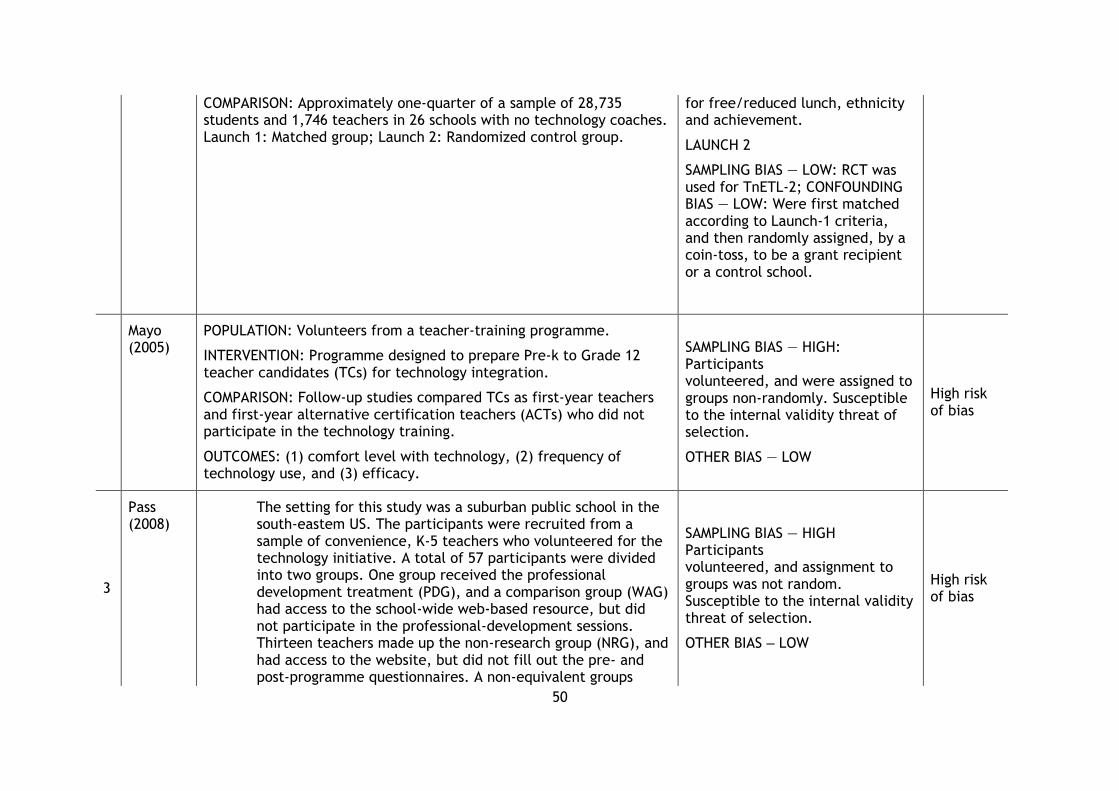
50
COMPARISON: Approximately one-quarter of a sample of 28,735 students and 1,746 teachers in 26 schools with no technology coaches. Launch 1: Matched group; Launch 2: Randomized control group.
for free/reduced lunch, ethnicity and achievement.
LAUNCH 2
SAMPLING BIAS — LOW: RCT was used for TnETL-2; CONFOUNDING BIAS — LOW: Were first matched according to Launch-1 criteria, and then randomly assigned, by a coin-toss, to be a grant recipient or a control school.
Mayo (2005)
POPULATION: Volunteers from a teacher-training programme.
INTERVENTION: Programme designed to prepare Pre-k to Grade 12 teacher candidates (TCs) for technology integration.
COMPARISON: Follow-up studies compared TCs as first-year teachers and first-year alternative certification teachers (ACTs) who did not participate in the technology training.
OUTCOMES: (1) comfort level with technology, (2) frequency of technology use, and (3) efficacy.
SAMPLING BIAS — HIGH: Participants volunteered, and were assigned to groups non-randomly. Susceptible to the internal validity threat of selection.
OTHER BIAS — LOW
High risk of bias
3
Pass (2008)
The setting for this study was a suburban public school in the south-eastem US. The participants were recruited from a sample of convenience, K-5 teachers who volunteered for the technology initiative. A total of 57 participants were divided into two groups. One group received the professional development treatment (PDG), and a comparison group (WAG) had access to the school-wide web-based resource, but did not participate in the professional-development sessions. Thirteen teachers made up the non-research group (NRG), and had access to the website, but did not fill out the pre- and post-programme questionnaires. A non-equivalent groups
SAMPLING BIAS — HIGH Participants volunteered, and assignment to groups was not random. Susceptible to the internal validity threat of selection.
OTHER BIAS ‒ LOW
High risk of bias
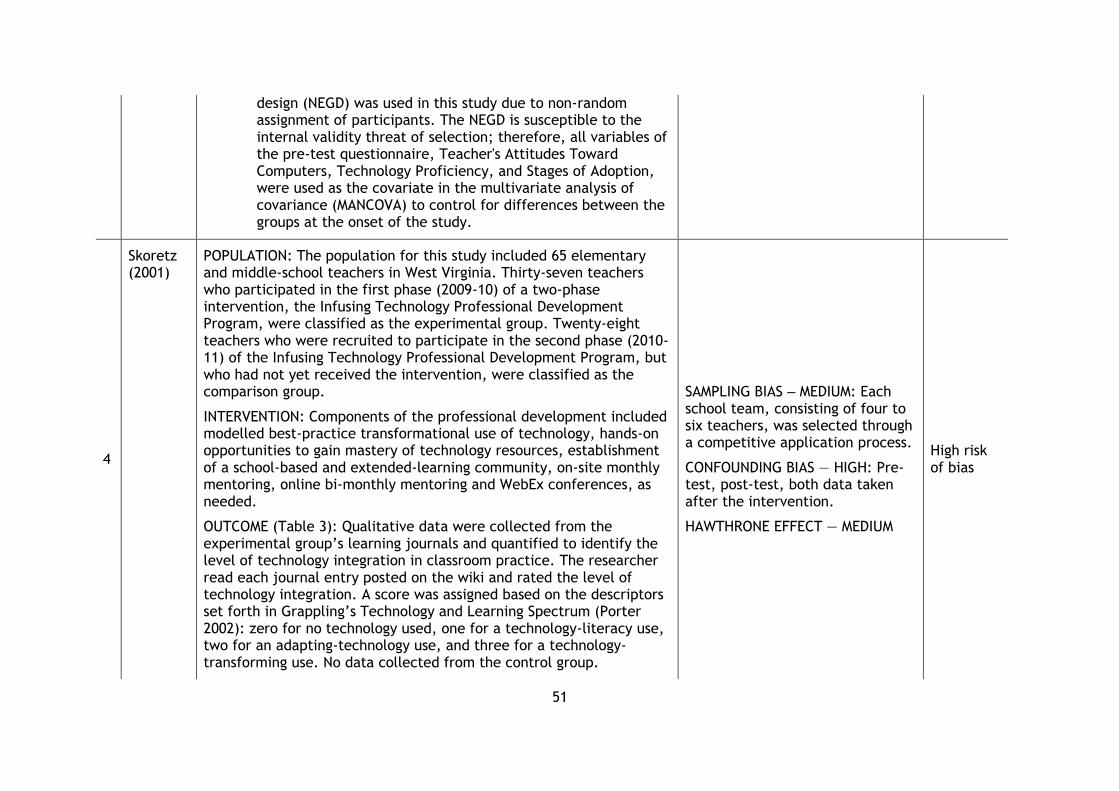
51
design (NEGD) was used in this study due to non-random assignment of participants. The NEGD is susceptible to the internal validity threat of selection; therefore, all variables of the pre-test questionnaire, Teacher's Attitudes Toward Computers, Technology Proficiency, and Stages of Adoption, were used as the covariate in the multivariate analysis of covariance (MANCOVA) to control for differences between the groups at the onset of the study.
4
Skoretz (2001)
POPULATION: The population for this study included 65 elementary and middle-school teachers in West Virginia. Thirty-seven teachers who participated in the first phase (2009-10) of a two-phase intervention, the Infusing Technology Professional Development Program, were classified as the experimental group. Twenty-eight teachers who were recruited to participate in the second phase (2010-11) of the Infusing Technology Professional Development Program, but who had not yet received the intervention, were classified as the comparison group.
INTERVENTION: Components of the professional development included modelled best-practice transformational use of technology, hands-on opportunities to gain mastery of technology resources, establishment of a school-based and extended-learning community, on-site monthly mentoring, online bi-monthly mentoring and WebEx conferences, as needed.
OUTCOME (Table 3): Qualitative data were collected from the experimental group’s learning journals and quantified to identify the level of technology integration in classroom practice. The researcher read each journal entry posted on the wiki and rated the level of technology integration. A score was assigned based on the descriptors set forth in Grappling’s Technology and Learning Spectrum (Porter 2002): zero for no technology used, one for a technology-literacy use, two for an adapting-technology use, and three for a technology-transforming use. No data collected from the control group.
SAMPLING BIAS ‒ MEDIUM: Each school team, consisting of four to six teachers, was selected through a competitive application process.
CONFOUNDING BIAS — HIGH: Pre-test, post-test, both data taken after the intervention.
HAWTHRONE EFFECT — MEDIUM
High risk of bias
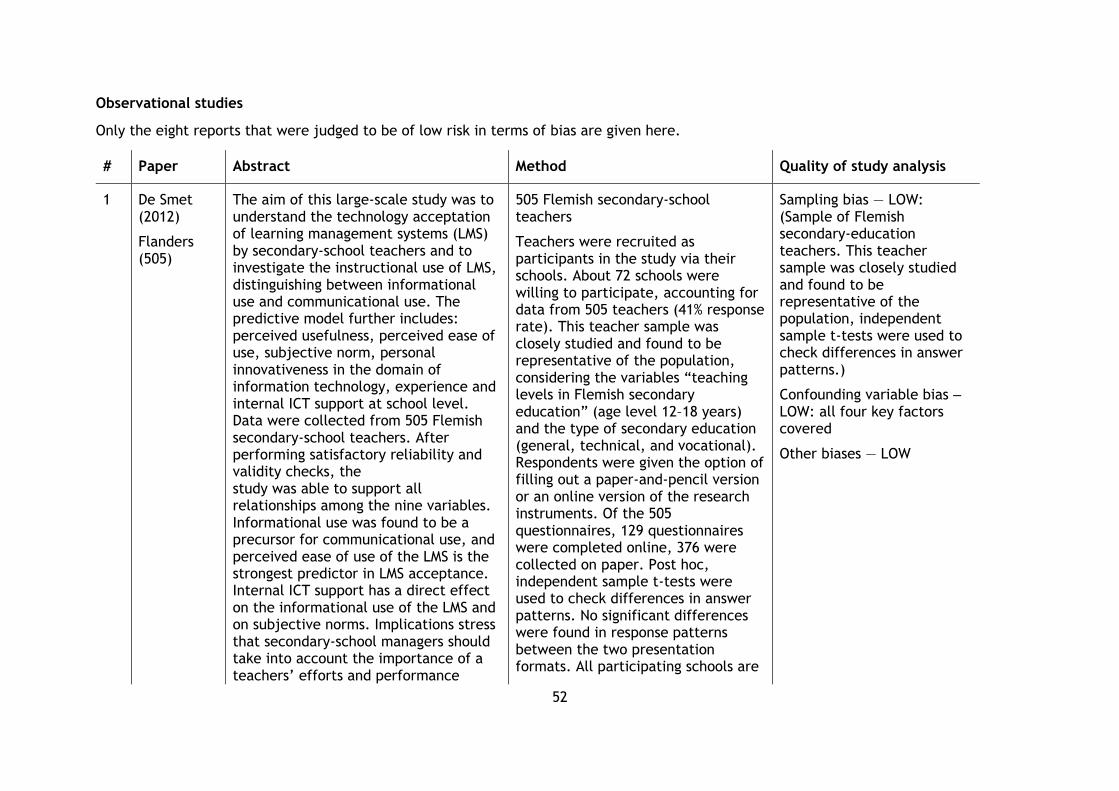
52
Observational studies
Only the eight reports that were judged to be of low risk in terms of bias are given here.
# Paper Abstract Method Quality of study analysis
1 De Smet (2012)
Flanders (505)
The aim of this large-scale study was to understand the technology acceptation of learning management systems (LMS) by secondary-school teachers and to investigate the instructional use of LMS, distinguishing between informational use and communicational use. The predictive model further includes: perceived usefulness, perceived ease of use, subjective norm, personal innovativeness in the domain of information technology, experience and internal ICT support at school level. Data were collected from 505 Flemish secondary-school teachers. After performing satisfactory reliability and validity checks, the study was able to support all relationships among the nine variables. Informational use was found to be a precursor for communicational use, and perceived ease of use of the LMS is the strongest predictor in LMS acceptance. Internal ICT support has a direct effect on the informational use of the LMS and on subjective norms. Implications stress that secondary-school managers should take into account the importance of a teachers’ efforts and performance
505 Flemish secondary-school teachers
Teachers were recruited as participants in the study via their schools. About 72 schools were willing to participate, accounting for data from 505 teachers (41% response rate). This teacher sample was closely studied and found to be representative of the population, considering the variables “teaching levels in Flemish secondary education” (age level 12–18 years) and the type of secondary education (general, technical, and vocational). Respondents were given the option of filling out a paper-and-pencil version or an online version of the research instruments. Of the 505 questionnaires, 129 questionnaires were completed online, 376 were collected on paper. Post hoc, independent sample t-tests were used to check differences in answer patterns. No significant differences were found in response patterns between the two presentation formats. All participating schools are
Sampling bias — LOW: (Sample of Flemish secondary-education teachers. This teacher sample was closely studied and found to be representative of the population, independent sample t-tests were used to check differences in answer patterns.)
Confounding variable bias ‒ LOW: all four key factors covered
Other biases — LOW
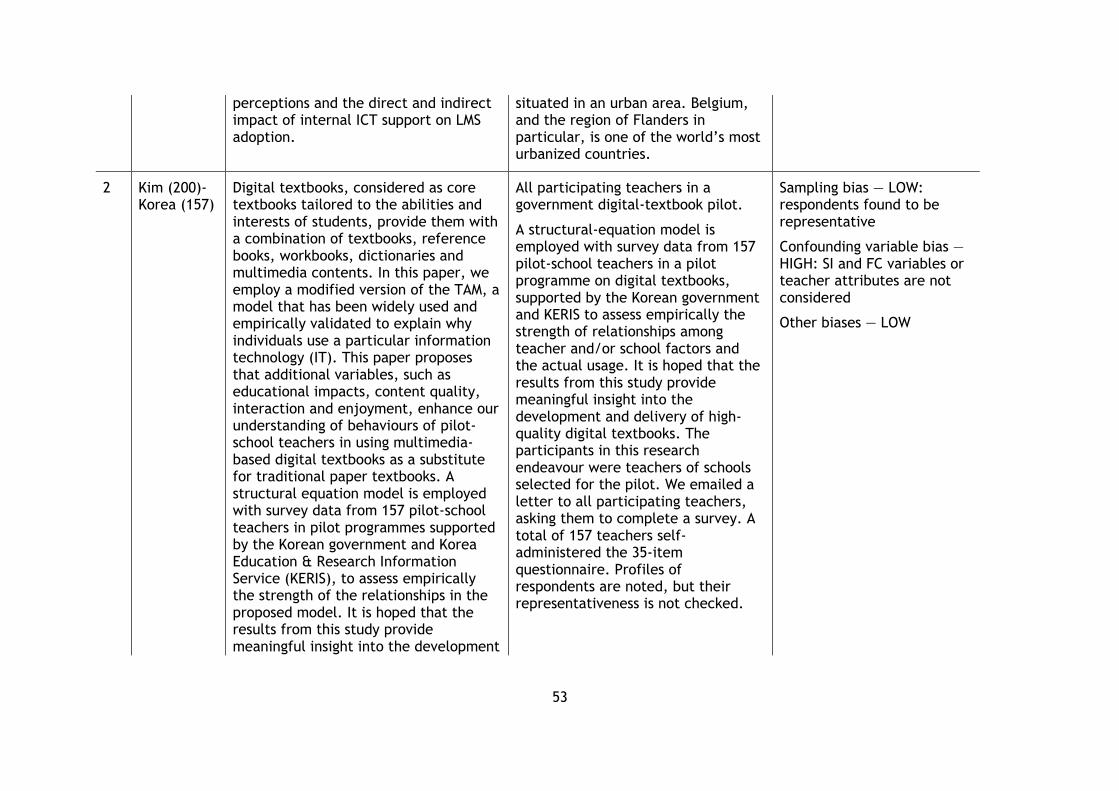
53
perceptions and the direct and indirect impact of internal ICT support on LMS adoption.
situated in an urban area. Belgium, and the region of Flanders in particular, is one of the world’s most urbanized countries.
2 Kim (200)-Korea (157)
Digital textbooks, considered as core textbooks tailored to the abilities and interests of students, provide them with a combination of textbooks, reference books, workbooks, dictionaries and multimedia contents. In this paper, we employ a modified version of the TAM, a model that has been widely used and empirically validated to explain why individuals use a particular information technology (IT). This paper proposes that additional variables, such as educational impacts, content quality, interaction and enjoyment, enhance our understanding of behaviours of pilot-school teachers in using multimedia-based digital textbooks as a substitute for traditional paper textbooks. A structural equation model is employed with survey data from 157 pilot-school teachers in pilot programmes supported by the Korean government and Korea Education & Research Information Service (KERIS), to assess empirically the strength of the relationships in the proposed model. It is hoped that the results from this study provide meaningful insight into the development
All participating teachers in a government digital-textbook pilot.
A structural-equation model is employed with survey data from 157 pilot-school teachers in a pilot programme on digital textbooks, supported by the Korean government and KERIS to assess empirically the strength of relationships among teacher and/or school factors and the actual usage. It is hoped that the results from this study provide meaningful insight into the development and delivery of high-quality digital textbooks. The participants in this research endeavour were teachers of schools selected for the pilot. We emailed a letter to all participating teachers, asking them to complete a survey. A total of 157 teachers self-administered the 35-item questionnaire. Profiles of respondents are noted, but their representativeness is not checked.
Sampling bias — LOW: respondents found to be representative
Confounding variable bias —HIGH: SI and FC variables or teacher attributes are not considered
Other biases — LOW
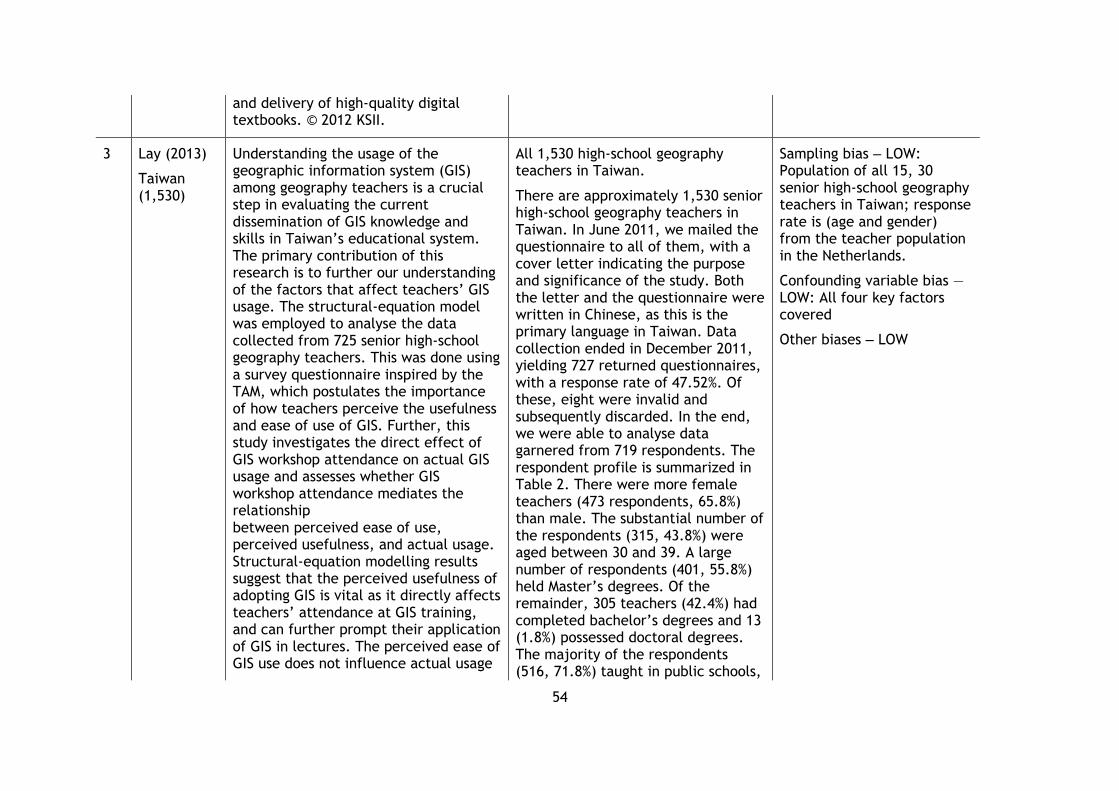
54
and delivery of high-quality digital textbooks. © 2012 KSII.
3 Lay (2013)
Taiwan (1,530)
Understanding the usage of the geographic information system (GIS) among geography teachers is a crucial step in evaluating the current dissemination of GIS knowledge and skills in Taiwan’s educational system. The primary contribution of this research is to further our understanding of the factors that affect teachers’ GIS usage. The structural-equation model was employed to analyse the data collected from 725 senior high-school geography teachers. This was done using a survey questionnaire inspired by the TAM, which postulates the importance of how teachers perceive the usefulness and ease of use of GIS. Further, this study investigates the direct effect of GIS workshop attendance on actual GIS usage and assesses whether GIS workshop attendance mediates the relationship between perceived ease of use, perceived usefulness, and actual usage. Structural-equation modelling results suggest that the perceived usefulness of adopting GIS is vital as it directly affects teachers’ attendance at GIS training, and can further prompt their application of GIS in lectures. The perceived ease of GIS use does not influence actual usage
All 1,530 high-school geography teachers in Taiwan.
There are approximately 1,530 senior high-school geography teachers in Taiwan. In June 2011, we mailed the questionnaire to all of them, with a cover letter indicating the purpose and significance of the study. Both the letter and the questionnaire were written in Chinese, as this is the primary language in Taiwan. Data collection ended in December 2011, yielding 727 returned questionnaires, with a response rate of 47.52%. Of these, eight were invalid and subsequently discarded. In the end, we were able to analyse data garnered from 719 respondents. The respondent profile is summarized in Table 2. There were more female teachers (473 respondents, 65.8%) than male. The substantial number of the respondents (315, 43.8%) were aged between 30 and 39. A large number of respondents (401, 55.8%) held Master’s degrees. Of the remainder, 305 teachers (42.4%) had completed bachelor’s degrees and 13 (1.8%) possessed doctoral degrees. The majority of the respondents (516, 71.8%) taught in public schools,
Sampling bias ‒ LOW: Population of all 15, 30 senior high-school geography teachers in Taiwan; response rate is (age and gender) from the teacher population in the Netherlands.
Confounding variable bias — LOW: All four key factors covered
Other biases ‒ LOW
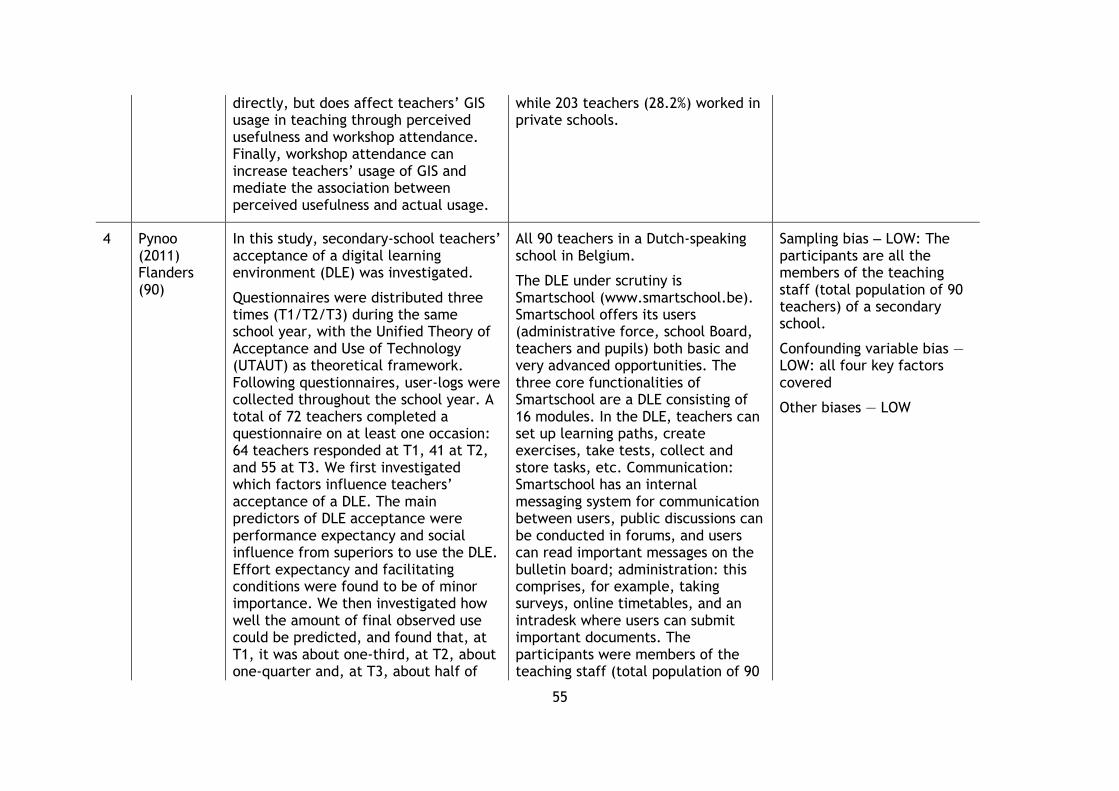
55
directly, but does affect teachers’ GIS usage in teaching through perceived usefulness and workshop attendance. Finally, workshop attendance can increase teachers’ usage of GIS and mediate the association between perceived usefulness and actual usage.
while 203 teachers (28.2%) worked in private schools.
4 Pynoo (2011) Flanders (90)
In this study, secondary-school teachers’ acceptance of a digital learning environment (DLE) was investigated.
Questionnaires were distributed three times (T1/T2/T3) during the same school year, with the Unified Theory of Acceptance and Use of Technology (UTAUT) as theoretical framework. Following questionnaires, user-logs were collected throughout the school year. A total of 72 teachers completed a questionnaire on at least one occasion: 64 teachers responded at T1, 41 at T2, and 55 at T3. We first investigated which factors influence teachers’ acceptance of a DLE. The main predictors of DLE acceptance were performance expectancy and social influence from superiors to use the DLE. Effort expectancy and facilitating conditions were found to be of minor importance. We then investigated how well the amount of final observed use could be predicted, and found that, at T1, it was about one-third, at T2, about one-quarter and, at T3, about half of
All 90 teachers in a Dutch-speaking school in Belgium.
The DLE under scrutiny is Smartschool (www.smartschool.be). Smartschool offers its users (administrative force, school Board, teachers and pupils) both basic and very advanced opportunities. The three core functionalities of Smartschool are a DLE consisting of 16 modules. In the DLE, teachers can set up learning paths, create exercises, take tests, collect and store tasks, etc. Communication: Smartschool has an internal messaging system for communication between users, public discussions can be conducted in forums, and users can read important messages on the bulletin board; administration: this comprises, for example, taking surveys, online timetables, and an intradesk where users can submit important documents. The participants were members of the teaching staff (total population of 90
Sampling bias ‒ LOW: The participants are all the members of the teaching staff (total population of 90 teachers) of a secondary school.
Confounding variable bias — LOW: all four key factors covered
Other biases — LOW
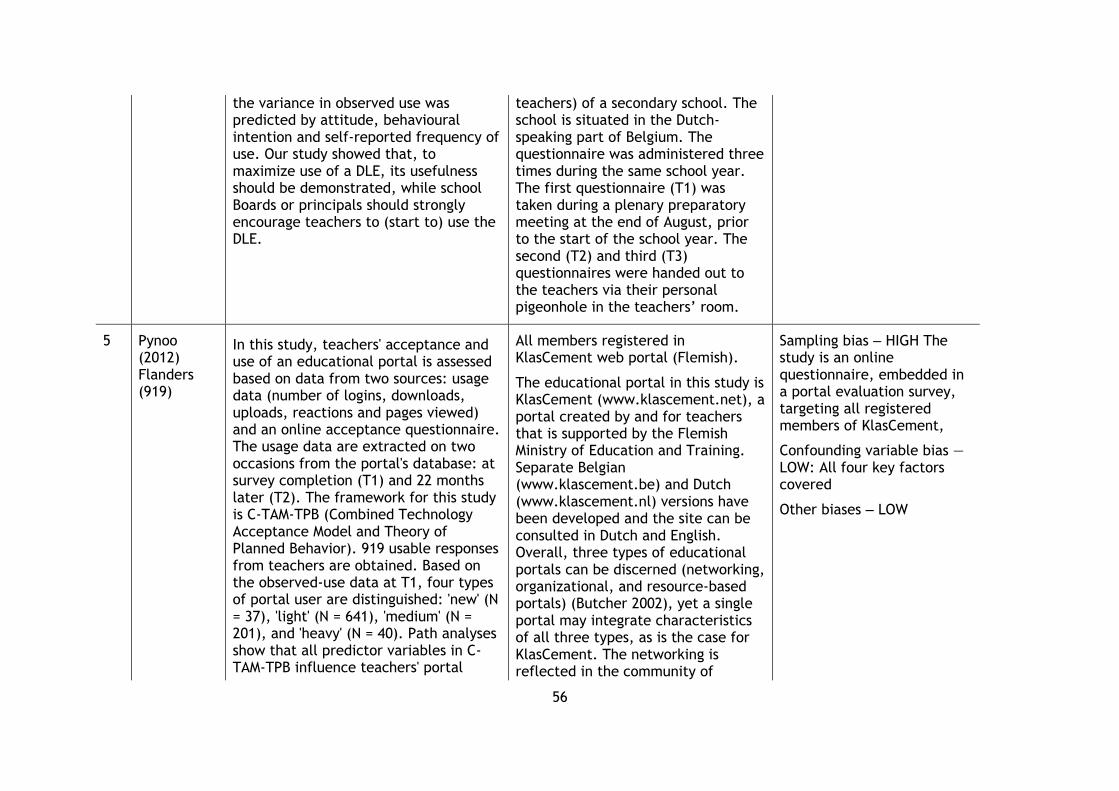
56
the variance in observed use was predicted by attitude, behavioural intention and self-reported frequency of use. Our study showed that, to maximize use of a DLE, its usefulness should be demonstrated, while school Boards or principals should strongly encourage teachers to (start to) use the DLE.
teachers) of a secondary school. The school is situated in the Dutch-speaking part of Belgium. The questionnaire was administered three times during the same school year. The first questionnaire (T1) was taken during a plenary preparatory meeting at the end of August, prior to the start of the school year. The second (T2) and third (T3) questionnaires were handed out to the teachers via their personal pigeonhole in the teachers’ room.
5 Pynoo (2012) Flanders (919)
In this study, teachers' acceptance and use of an educational portal is assessed based on data from two sources: usage data (number of logins, downloads, uploads, reactions and pages viewed) and an online acceptance questionnaire. The usage data are extracted on two occasions from the portal's database: at survey completion (T1) and 22 months later (T2). The framework for this study is C-TAM-TPB (Combined Technology Acceptance Model and Theory of Planned Behavior). 919 usable responses from teachers are obtained. Based on the observed-use data at T1, four types of portal user are distinguished: 'new' (N = 37), 'light' (N = 641), 'medium' (N = 201), and 'heavy' (N = 40). Path analyses show that all predictor variables in C-TAM-TPB influence teachers' portal
All members registered in KlasCement web portal (Flemish).
The educational portal in this study is KlasCement (www.klascement.net), a portal created by and for teachers that is supported by the Flemish Ministry of Education and Training. Separate Belgian (www.klascement.be) and Dutch (www.klascement.nl) versions have been developed and the site can be consulted in Dutch and English. Overall, three types of educational portals can be discerned (networking, organizational, and resource-based portals) (Butcher 2002), yet a single portal may integrate characteristics of all three types, as is the case for KlasCement. The networking is reflected in the community of
Sampling bias ‒ HIGH The study is an online questionnaire, embedded in a portal evaluation survey, targeting all registered members of KlasCement,
Confounding variable bias — LOW: All four key factors covered
Other biases ‒ LOW
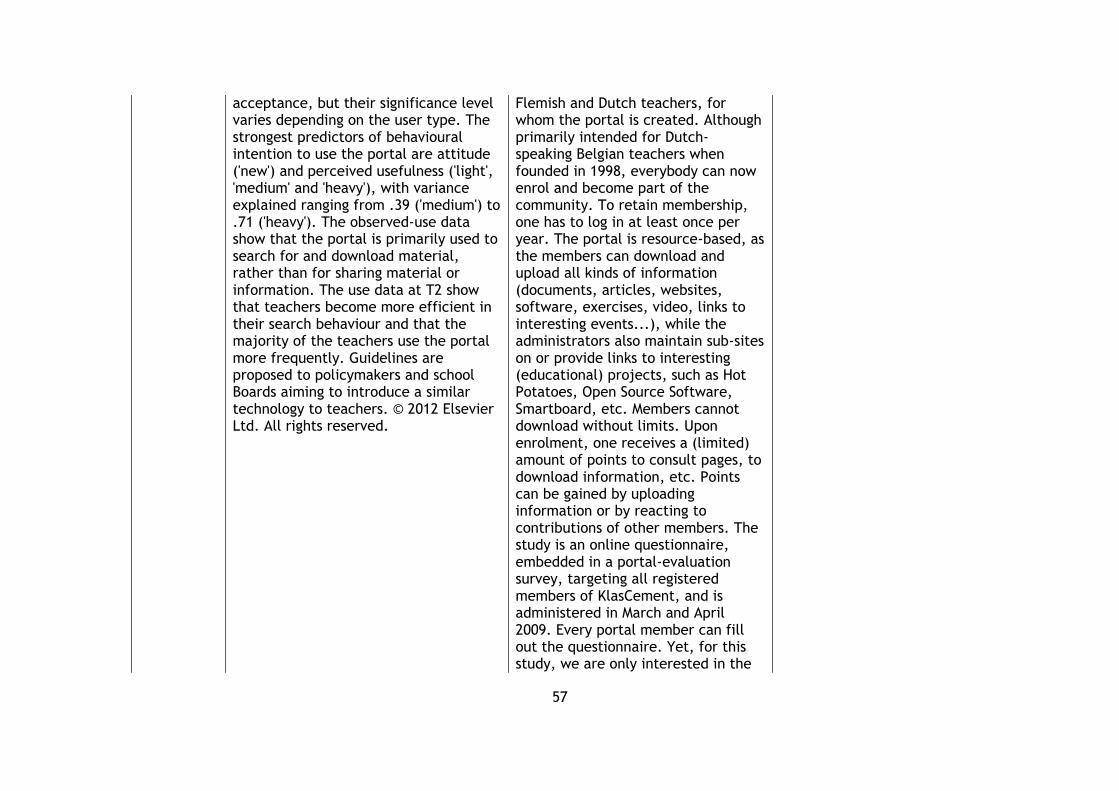
57
acceptance, but their significance level varies depending on the user type. The strongest predictors of behavioural intention to use the portal are attitude ('new') and perceived usefulness ('light', 'medium' and 'heavy'), with variance explained ranging from .39 ('medium') to .71 ('heavy'). The observed-use data show that the portal is primarily used to search for and download material, rather than for sharing material or information. The use data at T2 show that teachers become more efficient in their search behaviour and that the majority of the teachers use the portal more frequently. Guidelines are proposed to policymakers and school Boards aiming to introduce a similar technology to teachers. © 2012 Elsevier Ltd. All rights reserved.
Flemish and Dutch teachers, for whom the portal is created. Although primarily intended for Dutch-speaking Belgian teachers when founded in 1998, everybody can now enrol and become part of the community. To retain membership, one has to log in at least once per year. The portal is resource-based, as the members can download and upload all kinds of information (documents, articles, websites, software, exercises, video, links to interesting events...), while the administrators also maintain sub-sites on or provide links to interesting (educational) projects, such as Hot Potatoes, Open Source Software, Smartboard, etc. Members cannot download without limits. Upon enrolment, one receives a (limited) amount of points to consult pages, to download information, etc. Points can be gained by uploading information or by reacting to contributions of other members. The study is an online questionnaire, embedded in a portal-evaluation survey, targeting all registered members of KlasCement, and is administered in March and April 2009. Every portal member can fill out the questionnaire. Yet, for this study, we are only interested in the

58
responses from teachers. Therefore, out of a total of 1,139 responses, 220 non-teachers were removed following an inspection of their member profiles, resulting in a dataset of 919 teachers (649 female and 270 male teachers). The average respondent age is 39.73 years, with an average length of membership (at T1) of 24.70 months. By the time of the second use-data extraction (22 months later), 55 teachers had abandoned use of KlasCement.
6 Stols (2011) In this exploratory study, we sought to examine the influence of Mathematics teachers’ beliefs on their intended and actual usage of dynamic Mathematics software in their classrooms. Theory of planned behaviour (TPB), the TAM and innovation diffusion theory (IDT) were used to examine the influence of teachers’ attitudes, subjective norms and perceived behavioural control on their intention to use dynamic mathematics software in their classrooms. The study adopted the co-relational research design, with both correlation statistics and regression analysis used to analyse the data. By using stepwise regression analysis, it was possible to identify the most important belief predictors and their weights for the different constructs.
24 high-school teachers from 15 urban and rural schools in South Africa.
The study was conducted in South Africa, using two convenience samples of teachers. The first sample consisted of 12 high-school teachers from seven different schools in semi-urban areas, while the second sample consisted of 12 high-school teachers from eight different urban schools. Data were obtained from only 22 (12 male and 10 female) teachers, who represented a variety of cultures. The average teaching experience of the 22 teachers was 18 years and their average age 45.5 years. Three deputy principals, seven heads of Mathematics departments and 12 teachers attended the workshops.
Sampling bias — HIGH: The study is an online questionnaire, embedded in a portal-evaluation survey, targeting all registered members of KlasCement.
Confounding variable bias — LOW: all four key factors covered
Other biases ‒ LOW
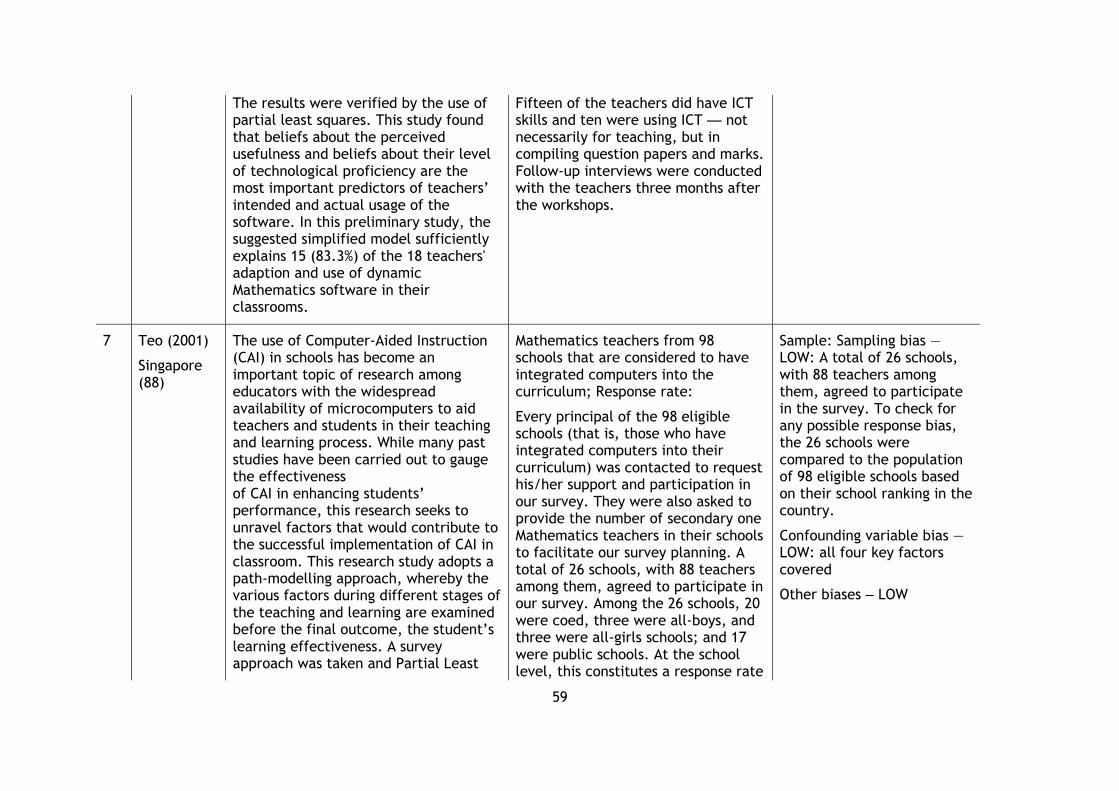
59
The results were verified by the use of partial least squares. This study found that beliefs about the perceived usefulness and beliefs about their level of technological proficiency are the most important predictors of teachers’ intended and actual usage of the software. In this preliminary study, the suggested simplified model sufficiently explains 15 (83.3%) of the 18 teachers' adaption and use of dynamic Mathematics software in their classrooms.
Fifteen of the teachers did have ICT skills and ten were using ICT — not necessarily for teaching, but in compiling question papers and marks. Follow-up interviews were conducted with the teachers three months after the workshops.
7 Teo (2001)
Singapore (88)
The use of Computer-Aided Instruction (CAI) in schools has become an important topic of research among educators with the widespread availability of microcomputers to aid teachers and students in their teaching and learning process. While many past studies have been carried out to gauge the effectiveness of CAI in enhancing students’ performance, this research seeks to unravel factors that would contribute to the successful implementation of CAI in classroom. This research study adopts a path-modelling approach, whereby the various factors during different stages of the teaching and learning are examined before the final outcome, the student’s learning effectiveness. A survey approach was taken and Partial Least
Mathematics teachers from 98 schools that are considered to have integrated computers into the curriculum; Response rate:
Every principal of the 98 eligible schools (that is, those who have integrated computers into their curriculum) was contacted to request his/her support and participation in our survey. They were also asked to provide the number of secondary one Mathematics teachers in their schools to facilitate our survey planning. A total of 26 schools, with 88 teachers among them, agreed to participate in our survey. Among the 26 schools, 20 were coed, three were all-boys, and three were all-girls schools; and 17 were public schools. At the school level, this constitutes a response rate
Sample: Sampling bias — LOW: A total of 26 schools, with 88 teachers among them, agreed to participate in the survey. To check for any possible response bias, the 26 schools were compared to the population of 98 eligible schools based on their school ranking in the country.
Confounding variable bias — LOW: all four key factors covered
Other biases ‒ LOW
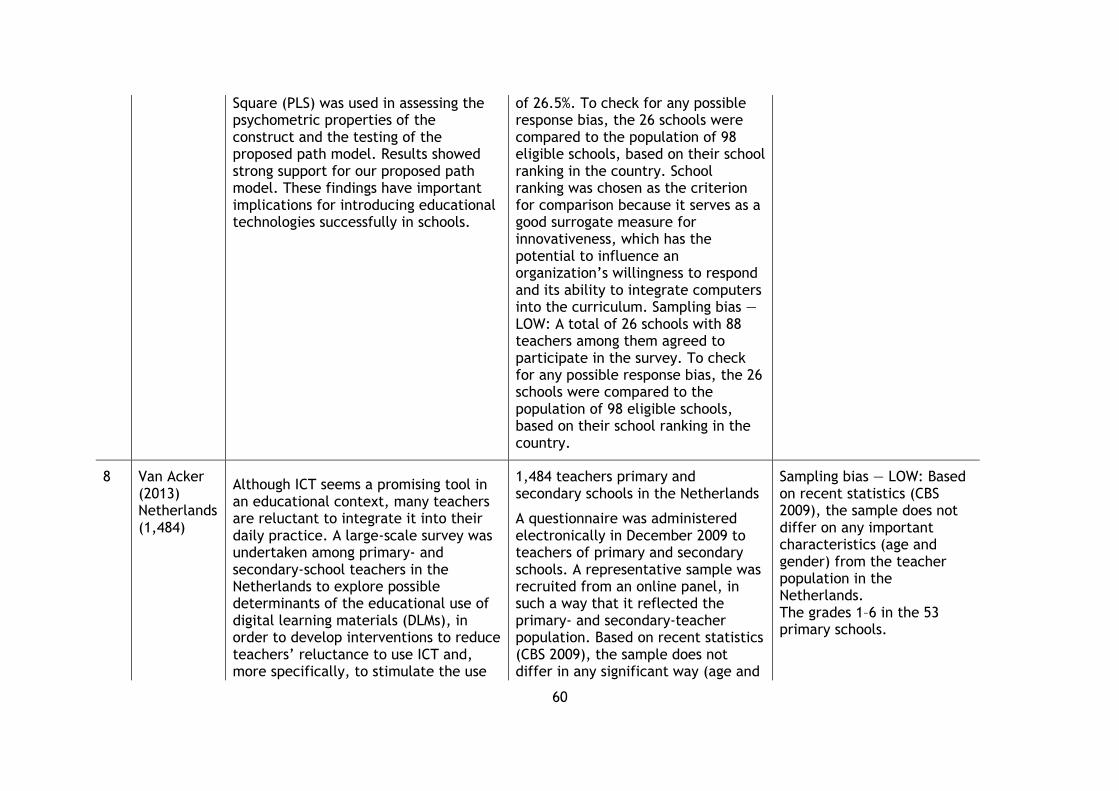
60
Square (PLS) was used in assessing the psychometric properties of the construct and the testing of the proposed path model. Results showed strong support for our proposed path model. These findings have important implications for introducing educational technologies successfully in schools.
of 26.5%. To check for any possible response bias, the 26 schools were compared to the population of 98 eligible schools, based on their school ranking in the country. School ranking was chosen as the criterion for comparison because it serves as a good surrogate measure for innovativeness, which has the potential to influence an organization’s willingness to respond and its ability to integrate computers into the curriculum. Sampling bias — LOW: A total of 26 schools with 88 teachers among them agreed to participate in the survey. To check for any possible response bias, the 26 schools were compared to the population of 98 eligible schools, based on their school ranking in the country.
8 Van Acker (2013) Netherlands (1,484)
Although ICT seems a promising tool in an educational context, many teachers are reluctant to integrate it into their daily practice. A large-scale survey was undertaken among primary- and secondary-school teachers in the Netherlands to explore possible determinants of the educational use of digital learning materials (DLMs), in order to develop interventions to reduce teachers’ reluctance to use ICT and, more specifically, to stimulate the use
1,484 teachers primary and secondary schools in the Netherlands
A questionnaire was administered electronically in December 2009 to teachers of primary and secondary schools. A representative sample was recruited from an online panel, in such a way that it reflected the primary- and secondary-teacher population. Based on recent statistics (CBS 2009), the sample does not differ in any significant way (age and
Sampling bias — LOW: Based on recent statistics (CBS 2009), the sample does not differ on any important characteristics (age and gender) from the teacher population in the Netherlands. The grades 1–6 in the 53 primary schools.
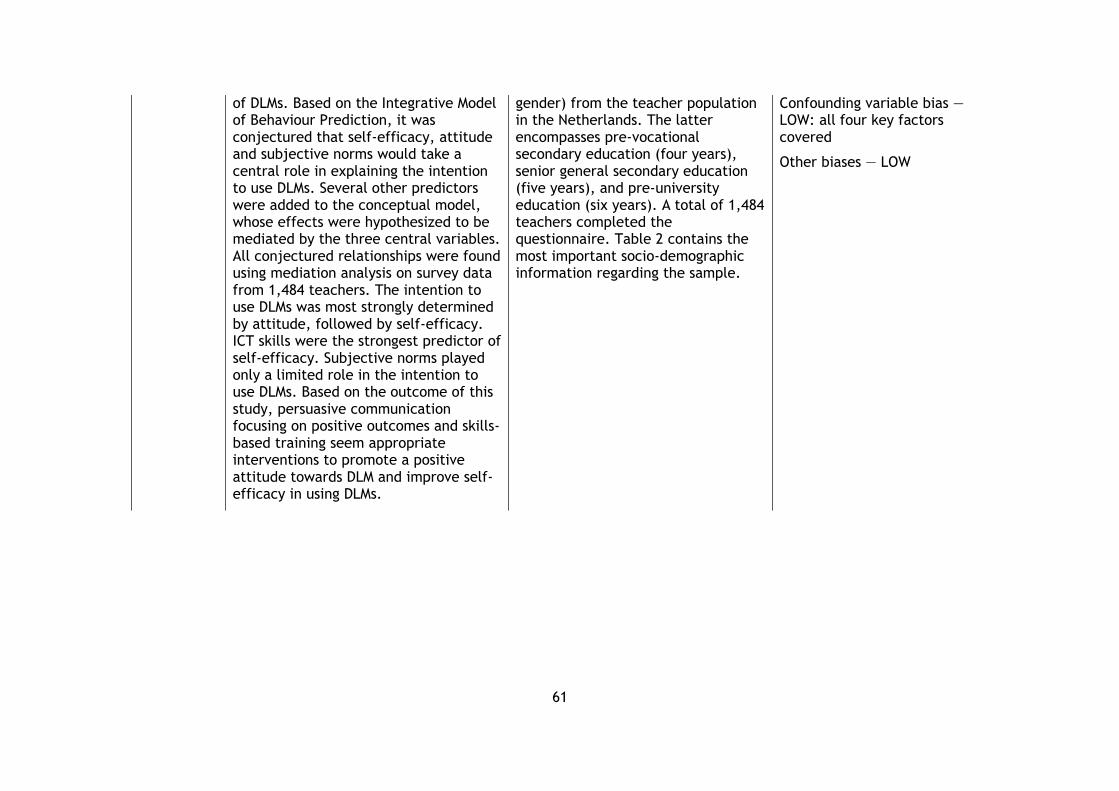
61
of DLMs. Based on the Integrative Model of Behaviour Prediction, it was conjectured that self-efficacy, attitude and subjective norms would take a central role in explaining the intention to use DLMs. Several other predictors were added to the conceptual model, whose effects were hypothesized to be mediated by the three central variables. All conjectured relationships were found using mediation analysis on survey data from 1,484 teachers. The intention to use DLMs was most strongly determined by attitude, followed by self-efficacy. ICT skills were the strongest predictor of self-efficacy. Subjective norms played only a limited role in the intention to use DLMs. Based on the outcome of this study, persuasive communication focusing on positive outcomes and skills-based training seem appropriate interventions to promote a positive attitude towards DLM and improve self-efficacy in using DLMs.
gender) from the teacher population in the Netherlands. The latter encompasses pre-vocational secondary education (four years), senior general secondary education (five years), and pre-university education (six years). A total of 1,484 teachers completed the questionnaire. Table 2 contains the most important socio-demographic information regarding the sample.
Confounding variable bias — LOW: all four key factors covered
Other biases — LOW
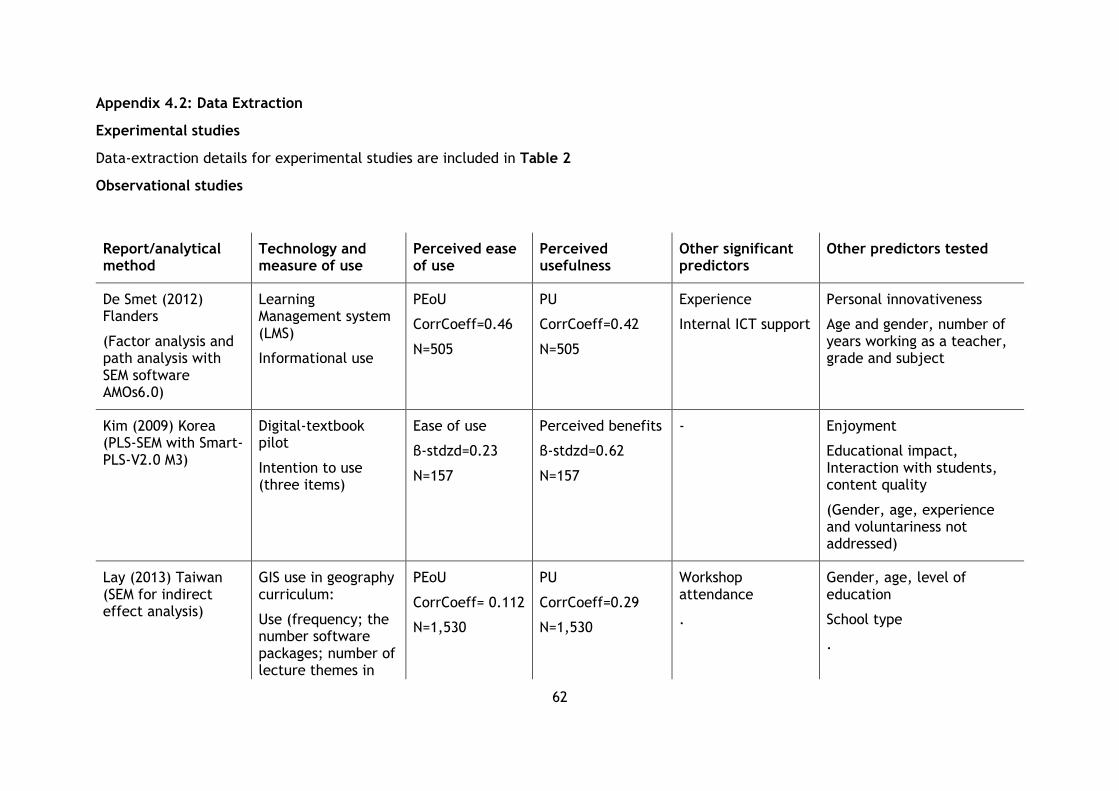
62
Appendix 4.2: Data Extraction
Experimental studies
Data-extraction details for experimental studies are included in Table 2
Observational studies
Report/analytical method
Technology and measure of use
Perceived ease of use
Perceived usefulness
Other significant predictors
Other predictors tested
De Smet (2012) Flanders
(Factor analysis and path analysis with SEM software AMOs6.0)
Learning Management system (LMS)
Informational use
PEoU
CorrCoeff=0.46
N=505
PU
CorrCoeff=0.42
N=505
Experience
Internal ICT support
Personal innovativeness
Age and gender, number of years working as a teacher, grade and subject
Kim (2009) Korea (PLS-SEM with Smart-PLS-V2.0 M3)
Digital-textbook pilot
Intention to use (three items)
Ease of use
β-stdzd=0.23
N=157
Perceived benefits
β-stdzd=0.62
N=157
-
Enjoyment
Educational impact, Interaction with students, content quality
(Gender, age, experience and voluntariness not addressed)
Lay (2013) Taiwan (SEM for indirect effect analysis)
GIS use in geography curriculum:
Use (frequency; the number software packages; number of lecture themes in
PEoU
CorrCoeff= 0.112
N=1,530
PU
CorrCoeff=0.29
N=1,530
Workshop attendance
.
Gender, age, level of education
School type
.
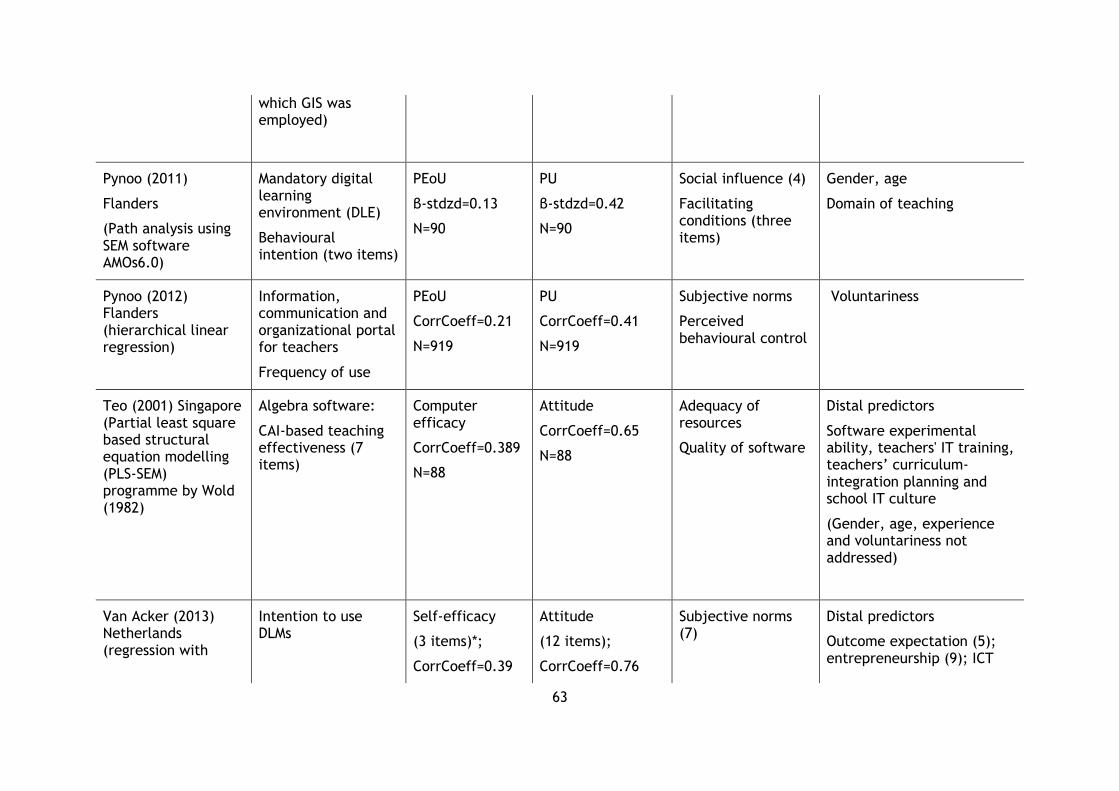
63
which GIS was employed)
Pynoo (2011)
Flanders
(Path analysis using SEM software AMOs6.0)
Mandatory digital learning environment (DLE)
Behavioural intention (two items)
PEoU
β-stdzd=0.13
N=90
PU
β-stdzd=0.42
N=90
Social influence (4)
Facilitating conditions (three items)
Gender, age
Domain of teaching
Pynoo (2012) Flanders (hierarchical linear regression)
Information, communication and organizational portal for teachers
Frequency of use
PEoU
CorrCoeff=0.21
N=919
PU
CorrCoeff=0.41
N=919
Subjective norms
Perceived behavioural control
Voluntariness
Teo (2001) Singapore (Partial least square based structural equation modelling (PLS-SEM) programme by Wold (1982)
Algebra software:
CAI-based teaching effectiveness (7 items)
Computer efficacy
CorrCoeff=0.389
N=88
Attitude
CorrCoeff=0.65
N=88
Adequacy of resources
Quality of software
Distal predictors
Software experimental ability, teachers' IT training, teachers’ curriculum-integration planning and school IT culture
(Gender, age, experience and voluntariness not addressed)
Van Acker (2013) Netherlands (regression with
Intention to use DLMs
Self-efficacy
(3 items)*;
CorrCoeff=0.39
Attitude
(12 items);
CorrCoeff=0.76
Subjective norms (7)
Distal predictors
Outcome expectation (5); entrepreneurship (9); ICT
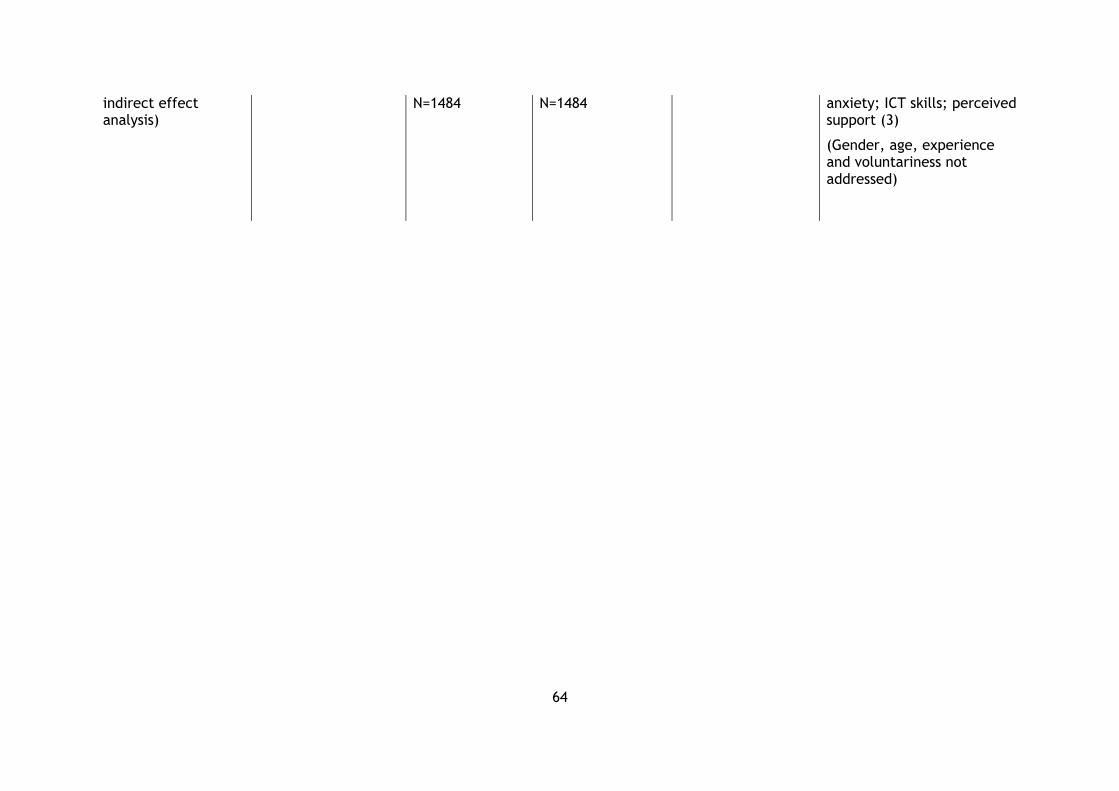
64
indirect effect analysis)
N=1484
N=1484 anxiety; ICT skills; perceived support (3)
(Gender, age, experience and voluntariness not addressed)
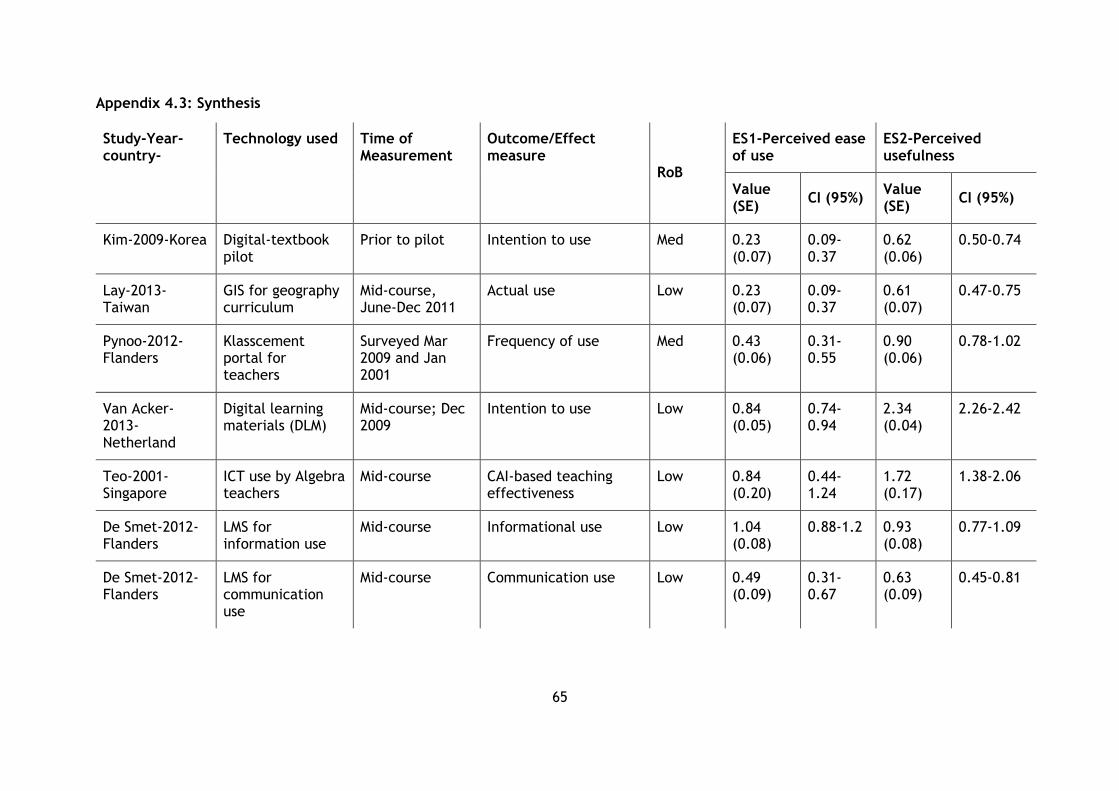
65
Appendix 4.3: Synthesis
Study-Year-country-
Technology used Time of Measurement
Outcome/Effect measure
RoB
ES1-Perceived ease of use
ES2-Perceived usefulness
Value (SE)
CI (95%) Value (SE)
CI (95%)
Kim-2009-Korea Digital-textbook pilot
Prior to pilot Intention to use Med 0.23 (0.07)
0.09-0.37
0.62 (0.06)
0.50-0.74
Lay-2013-Taiwan
GIS for geography curriculum
Mid-course, June-Dec 2011
Actual use Low 0.23 (0.07)
0.09-0.37
0.61 (0.07)
0.47-0.75
Pynoo-2012-Flanders
Klasscement portal for teachers
Surveyed Mar 2009 and Jan 2001
Frequency of use Med 0.43 (0.06)
0.31-0.55
0.90 (0.06)
0.78-1.02
Van Acker-2013-Netherland
Digital learning materials (DLM)
Mid-course; Dec 2009
Intention to use Low 0.84 (0.05)
0.74-0.94
2.34 (0.04)
2.26-2.42
Teo-2001-Singapore
ICT use by Algebra teachers
Mid-course CAI-based teaching effectiveness
Low 0.84 (0.20)
0.44-1.24
1.72 (0.17)
1.38-2.06
De Smet-2012-Flanders
LMS for information use
Mid-course Informational use Low 1.04 (0.08)
0.88-1.2 0.93 (0.08)
0.77-1.09
De Smet-2012-Flanders
LMS for communication use
Mid-course Communication use Low 0.49 (0.09)
0.31-0.67
0.63 (0.09)
0.45-0.81
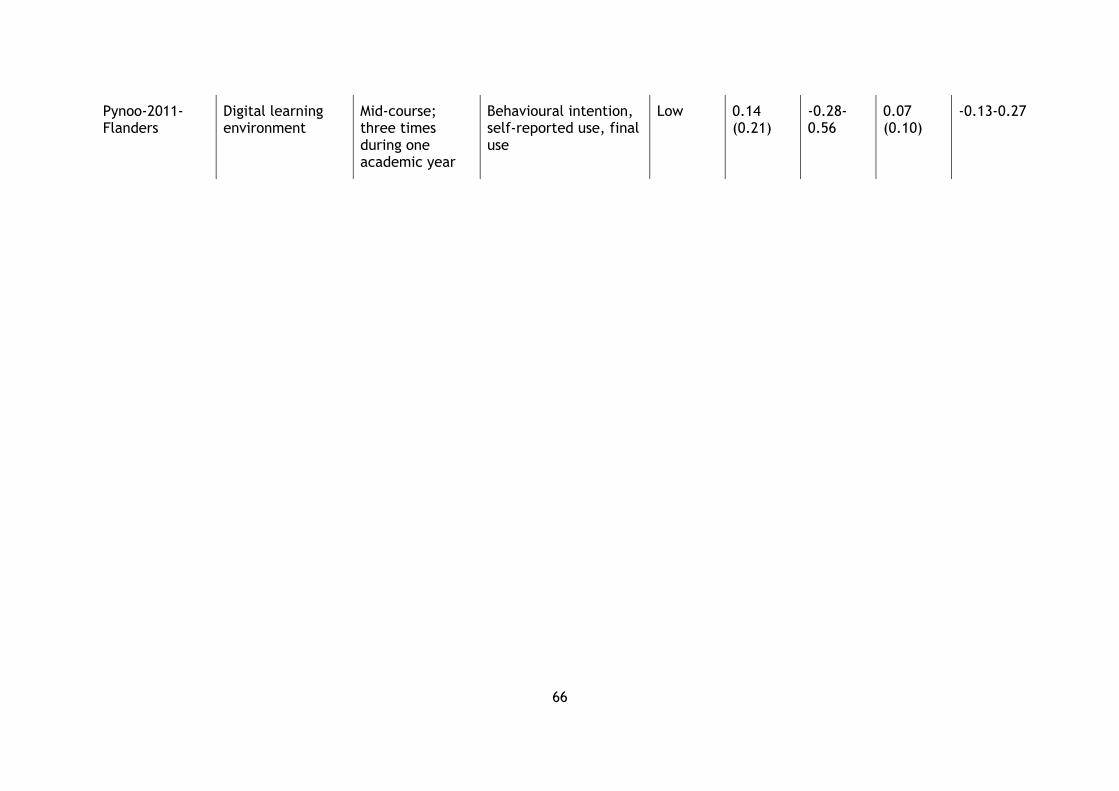
66
Pynoo-2011-Flanders
Digital learning environment
Mid-course; three times during one academic year
Behavioural intention, self-reported use, final use
Low 0.14 (0.21)
-0.28-0.56
0.07 (0.10)
-0.13-0.27
This systematic review was commissioned by LIRNEasia. The work was carried out with the aid of a grant from the International Development Research Centre, Canada, and the Department for International Development, UK. However the views expressed do not necessarily reflect these departments’ official policies.
Cover image © reynermedia https://creativecommons.org/licenses/by/2.0/
The authors of this report were supported by the Evidence for Policy and Practice Information and Co-ordinating Centre (EPPI-Centre).
The Evidence for Policy and Practice Information and Co-ordinating Centre (EPPI-Centre) is part of the Social Science Research Unit (SSRU), UCL Institute of Education, University College London.
Since 1993, we have been at the forefront of carrying out systematic reviews and developing review methods in social science and public policy. We are dedicated to making reliable research findings accessible to the people who need them, whether they are making policy, practice or personal decisions. We engage health and education policy makers, practitioners and service users in discussions about how researchers can make their work more relevant and how to use research findings.
Founded in 1990, the Social Science Research Unit (SSRU) is based at the UCL Institute of Education, University College London. Our mission is to engage in and otherwise promote rigorous, ethical and participative social research as well as to support evidence-informed public policy and practice across a range of domains including education, health and welfare, guided by a concern for human rights, social justice and the development of human potential.