Embed Size (px)
Citation preview
Strategies to Mitigate the Impact of
Poor Monsoon on Agriculture
Sponsored by
State Planning Commission, Chennai
Final Report
V. Saravanakumar
R.Balasubrmanian
S.T. Kumaran
K.Venkadesan
Department of Agricultural Economics
Center for Agriculture and Rural Development Studies
Tamil Nadu Agricultural University
Coimbatore - 641 003
December 2014
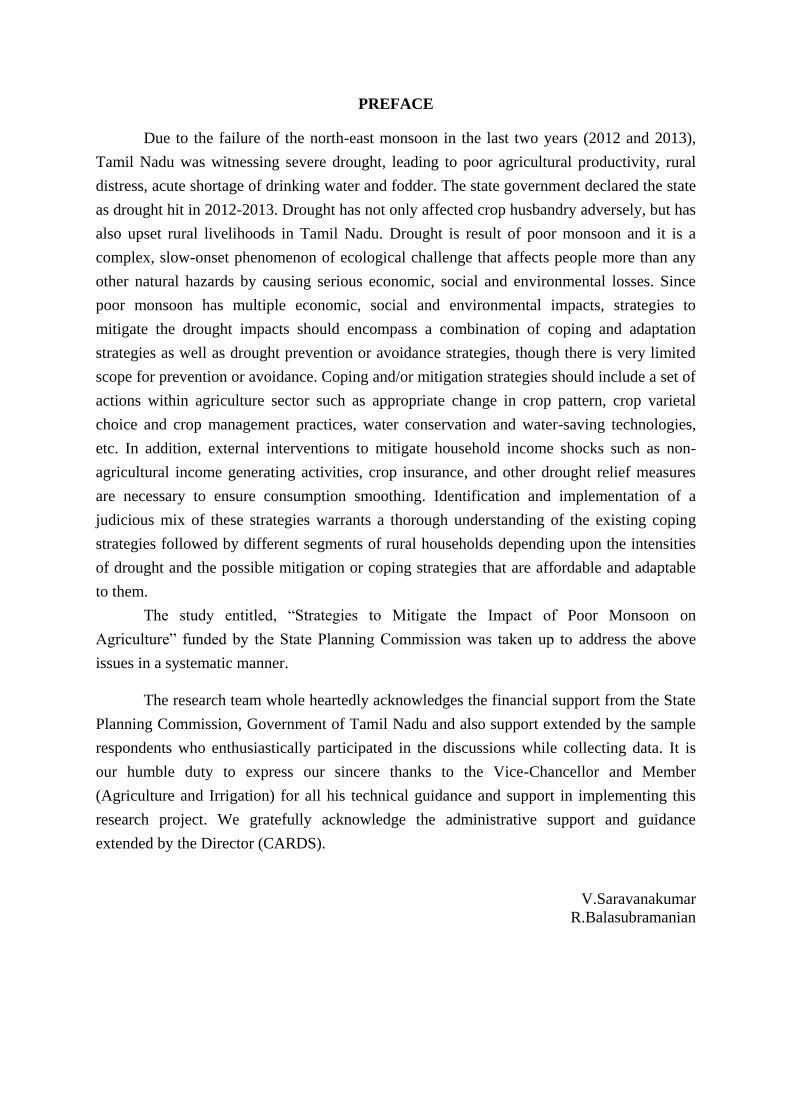
PREFACE
Due to the failure of the north-east monsoon in the last two years (2012 and 2013),
Tamil Nadu was witnessing severe drought, leading to poor agricultural productivity, rural
distress, acute shortage of drinking water and fodder. The state government declared the state
as drought hit in 2012-2013. Drought has not only affected crop husbandry adversely, but has
also upset rural livelihoods in Tamil Nadu. Drought is result of poor monsoon and it is a
complex, slow-onset phenomenon of ecological challenge that affects people more than any
other natural hazards by causing serious economic, social and environmental losses. Since
poor monsoon has multiple economic, social and environmental impacts, strategies to
mitigate the drought impacts should encompass a combination of coping and adaptation
strategies as well as drought prevention or avoidance strategies, though there is very limited
scope for prevention or avoidance. Coping and/or mitigation strategies should include a set of
actions within agriculture sector such as appropriate change in crop pattern, crop varietal
choice and crop management practices, water conservation and water-saving technologies,
etc. In addition, external interventions to mitigate household income shocks such as non-
agricultural income generating activities, crop insurance, and other drought relief measures
are necessary to ensure consumption smoothing. Identification and implementation of a
judicious mix of these strategies warrants a thorough understanding of the existing coping
strategies followed by different segments of rural households depending upon the intensities
of drought and the possible mitigation or coping strategies that are affordable and adaptable
to them.
The study entitled, “Strategies to Mitigate the Impact of Poor Monsoon on
Agriculture” funded by the State Planning Commission was taken up to address the above
issues in a systematic manner.
The research team whole heartedly acknowledges the financial support from the State
Planning Commission, Government of Tamil Nadu and also support extended by the sample
respondents who enthusiastically participated in the discussions while collecting data. It is
our humble duty to express our sincere thanks to the Vice-Chancellor and Member
(Agriculture and Irrigation) for all his technical guidance and support in implementing this
research project. We gratefully acknowledge the administrative support and guidance
extended by the Director (CARDS).
V.Saravanakumar
R.Balasubramanian
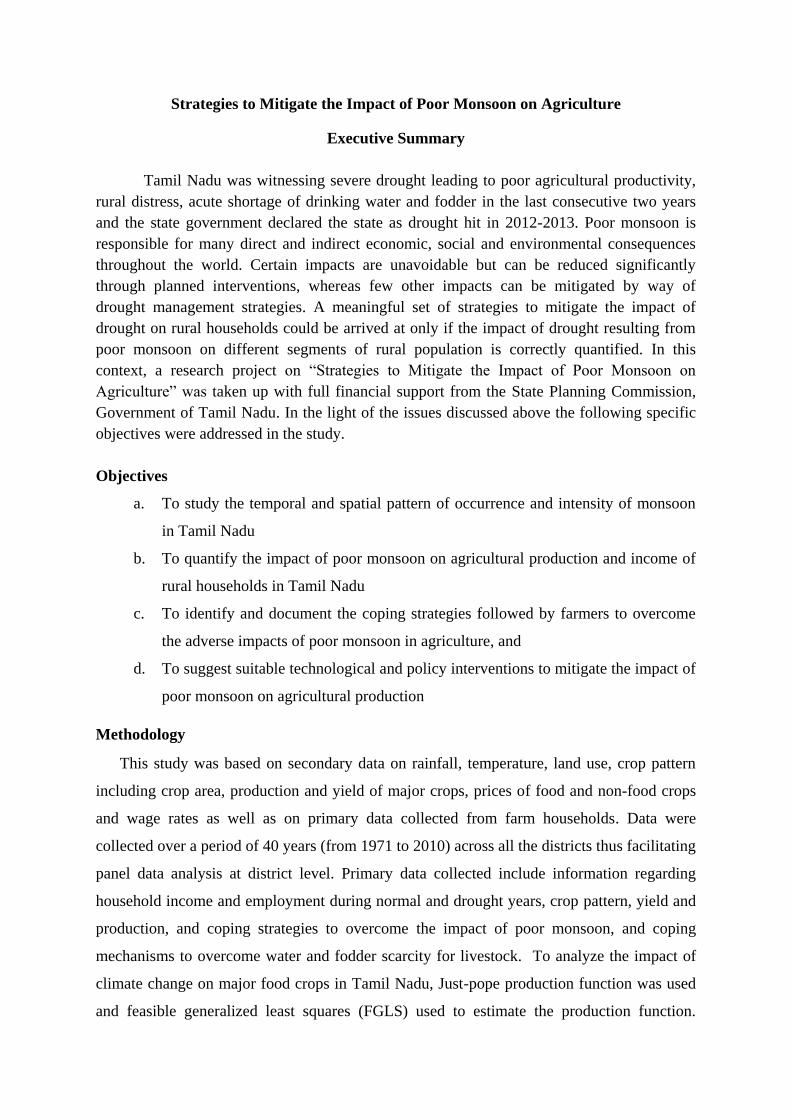
Strategies to Mitigate the Impact of Poor Monsoon on Agriculture
Executive Summary
Tamil Nadu was witnessing severe drought leading to poor agricultural productivity,
rural distress, acute shortage of drinking water and fodder in the last consecutive two years
and the state government declared the state as drought hit in 2012-2013. Poor monsoon is
responsible for many direct and indirect economic, social and environmental consequences
throughout the world. Certain impacts are unavoidable but can be reduced significantly
through planned interventions, whereas few other impacts can be mitigated by way of
drought management strategies. A meaningful set of strategies to mitigate the impact of
drought on rural households could be arrived at only if the impact of drought resulting from
poor monsoon on different segments of rural population is correctly quantified. In this
context, a research project on “Strategies to Mitigate the Impact of Poor Monsoon on
Agriculture” was taken up with full financial support from the State Planning Commission,
Government of Tamil Nadu. In the light of the issues discussed above the following specific
objectives were addressed in the study.
Objectives
a. To study the temporal and spatial pattern of occurrence and intensity of monsoon
in Tamil Nadu
b. To quantify the impact of poor monsoon on agricultural production and income of
rural households in Tamil Nadu
c. To identify and document the coping strategies followed by farmers to overcome
the adverse impacts of poor monsoon in agriculture, and
d. To suggest suitable technological and policy interventions to mitigate the impact of
poor monsoon on agricultural production
Methodology
This study was based on secondary data on rainfall, temperature, land use, crop pattern
including crop area, production and yield of major crops, prices of food and non-food crops
and wage rates as well as on primary data collected from farm households. Data were
collected over a period of 40 years (from 1971 to 2010) across all the districts thus facilitating
panel data analysis at district level. Primary data collected include information regarding
household income and employment during normal and drought years, crop pattern, yield and
production, and coping strategies to overcome the impact of poor monsoon, and coping
mechanisms to overcome water and fodder scarcity for livestock. To analyze the impact of
climate change on major food crops in Tamil Nadu, Just-pope production function was used
and feasible generalized least squares (FGLS) used to estimate the production function.
Garrett’s ranking technique was used to analyze the constraints faced by the farmers in
adoption of suitable technologies and strategies to minimize the adverse impact of poor
monsoon.
Salient findings
There were eight drought years in Tamil Nadu during the last 40 years. The drought
years were 1974-75, 1980-81, 1986-87, 1988-89, 1990-91, 1995-96, 2002-03, 2012-
13.
The coefficient of variation (CV) indicates that huge variation in winter rainfall (135
percent), followed by summer rainfall (40 percent), northeast monsoon (30 percent)
and southwest monsoon (20 percent).
Deficit in South-West monsoon rainfall was observed seven out of 40 years (1971 to
2010).
During northeast monsoon period, the frequency of “deficit” rainfall was 9 out of 40
years.
Adequate rainfall is crucial during summer for successful kuruvai crop. But the
occurrence of deficit rainfall during summer monsoon period was 17 times during the
40 years period from 1971-2010.
There was a positive relationship between the total rice production and rainfall from
1971 to 2010. However it showed inter-annual variability in rice production due to
fluctuations in rainfall.
An increase in Rainfall would increase the yield of rice up to a threshold level, and
the rainfall beyond the threshold limit (1057 mm per annum) would negatively impact
the yield of rice.
Time trend which is supposedly capture the role of technological growth had positive
impact on rice yield.
It was observed that there was a considerable loss in rice output in the drought years
(ranged from 5 and 45 percent) indicating that there is a serious concern on food
security during drought years.
The negative sign of rainfall during northeast monsoon (NEM) indicates that any
maximum level beyond the threshold level reduce the yield of rice during samba
season. From the historical data, it was observed that the frequencies of deviation of
NEM from the normal was observed 21 times from 1971 to 2010, of which, the
probability of occurrence of excess rainfall (+20percent and above from normal) was
0.52.
The southwest monsoon (SWM) rainfall has a positive and significant relationship
with yield of sorghum whereas the northeast monsoon (NEM) rainfall does not have
significant impact on sorghum yield.
An increase in SWM Rainfall increase the yield of rice up to a threshold level, and the
rainfall beyond the threshold limit would negatively impact the yield of rainfed
sorghum.
Increase in the variability of rainfall would increase the rice yield variability indicated
that rainfall is risk increasing input.
Similarly, increases in SWM and NEM rainfall variability also increase the risk of
yield in sorghum.
The household study indicated that as much as 77.5 percent of the farmers belong to
marginal and small farm category and remaining 22.5 percent were large farmers. It is
difficult to adopt mechanization or new technology in the small and marginal lands.
Of the 160 sample farmers, more than three-fourth of them reported that poor
monsoon has affected their farming in one way or other. They indicated that untimely
rainfall occurring late in the season, crop failure, reduction of crop yield, water
scarcity, pest and disease incidences, increase in heat wave, change in cropping
pattern and delay in sowing were the major impacts of poor monsoon.
Agriculture is a major source of income which contributed 37 percent to total income
followed by livestock (32 percent), farm wages (16 percent), MNREGA (7 percent)
and off-farm (5 percent).
During poor monsoon times, the income was lower by 25 percent as compared to
normal times. It was observed that the off-farm income was doubled in drought years.
Expenditures on food and non food expenditure items were observed to be lower in
poor monsoon year as compared to normal year.
There was 18 per cent decline in rice yield in poor monsoon year relative to normal
years.
The cost and return analysis indicates that the expenditure towards seeds increased by
17.51 percent in drought period as compared to normal years. This was due to higher
cost of drought resistant varieties and higher seed rate adopted by the farmers during
drought period.
Similarly, the average crop insurance cost was also higher in drought years as
compared to normal years due to more number of farmers availed this scheme.
The adaptation cost incurred towards mulching, irrigation structures and change in
new crop varieties etc, was Rs. 509 per ha during poor monsoon years.
The gross and net returns of rice were reduced by 21.88 and 30.98 per cent in drought
year as compared to normal year.
Coping mechanisms to minimize the impacts of poor monsoon were reduction in
cultivated area, switching to drought tolerant crops, increased investment on water
harvesting techniques, crop diversification and mixed farming, early/late planting,
growing annual crops to perennial crops, traditional knowledge to pest and disease
control for crops, deepening the existing well, and drip irrigation followed by farmers
in the study area.
In Nagapattinam district, farmers grown CR 1009 as an alternate to ADT (R) 48 due
to its tall growing and withstand submergence condition up to 15 days and drought
tolerant characteristics.
In the drought years, there has been a spurt in diversion of paddy lands to casuarina
cultivation due to its drought tolerance and possibilities to intercrop pulses and
vegetables with casurina in the initial years.
Clay pellet method of direct sowing of rice reduced the cost of transplanting and
withstood drought up to 10-15 days period. Only 17 percent farmers are being
adopted these techniques due to lack of awareness.
In Sivagangai district, about 30 percent farmers are used to cultivate drought tolerant
varieties such as PMK (R)-3, TKM 12 to mitigate the effect of the late season drought
and also suitable for direct seeding.
In Perambalur district, about 28 percent farmers cultivated drought tolerant paddy
variety TKM 12 to mitigate the effect of the late season drought and this variety also
suitable for direct seeding. In cotton, short duration variety of MCU 5 was adopted. In
groundnut, COGn 5 semi spreading, drought resistant variety was used.
About 31 percent of the farmers deepened the existing well in order to enhance the
water availability for irrigation.
About 52.5 percent farmers reduce the number of livestock because of lack of fodder
availability.
Adoption of drip irrigation for sugarcane cultivation and shifted to SSI, has reduced
the risks of poor monsoon.
In Perambalur district, 30percent of the respondents adopted crop insurance as one of
the major coping mechanism.
In Western zone (Coimbatore and Tiruppur districts), livestock plays an important
role with about one-third of the sample farmers possessing livestock such as cow,
goat, sheep and poultry.
About 42.7 percent of the sampled farmers engaged in other occupation such as off-
farm works, MGNREGA and other non-farm activities.
The various income management strategies to sustain the livelihood during drought
years include borrowing from friends and relatives and remittance from their children,
borrowing from money lenders, government relief measures, non-farm employment,
selling out livestock, crop insurance, jewel loan and migration.
The major constraints in adoption of strategies to mitigate the drought impacts faced
by farmers were inadequate water for irrigation, dearth of financial resources, lack of
technical know-how of adaptation strategies, lack of awareness of weather
information and forecasting, shortage of labour and higher wages, lack of timely
availability of seeds and inputs and fragmented land holdings.
The major constraints faced by farmers in adopting crop insurance products were high
premium rate, delayed settlement of insurance claims, less awareness of insurance
product, wide variation between the yields of actual farm and crop cutting experiment
and complex procedure of the scheme.
Conclusions and Policy Implications
Pink Pigmented Facultative Methylotrops (PPFMs) is aerobic, Gram-negative bacteria
developed by the Tamil Nadu Agricultural University (TNAU) which is
recommended to spray during water scarcity and critical stage of crop growth would
help to mitigate the adverse impact of poor monsoon.
Direct sowing of rice, System of Rice Intensification and Sustainable Sugarcane
Intensification are the successful strategies recommended by Tamil Nadu Agricultural
University (TNAU) due its less water requirement and helpful to reduce the
vulnerabilities of poor monsoon.
Summer ploughing, check dam, compartmental bunding and rainwater harvesting
(farm pond) are other viable options for effective management of scarce water during
the poor monsoon period.
Weather forecasting or advisory services offered by Tamil Nadu Agricultural
University (TNAU) will be helpful to avoid climate risks and reduce the crop yield
losses by intervening suitable adaptation strategies.
A wide publicity should be given by the insurance agency on specific features of crop
insurance schemes to generate awareness among the farmers. The delay of 9-12
months in the settlement of indemnity in case of yield loss to the farmers should be
minimized.
To reduce yield difference between the yield of insured farm and threshold yield, a
village / contiguous area (irrespective of its location in a specific phirka or block) in
which a crop is cultivated in more than 20 ha, may be considered for notification and
a crop cutting experiment may be conducted in that area.
A new insurance product of Index insurance insures for a specific event or risk, such
as rainfall deficits may be developed.
Government policies need to support research and development of appropriate
technologies like drought tolerant varieties, machineries and equipments to suit small
farm holdings, efficient irrigation and cultivation practices, accurate long term climate
forecasting etc, and promote crop insurance in a big way to help these resource poor
farmers to cope with changing climate.
CONTENTS
CHAPTER
NO. TITLE
PAGE
NO.
1. Introduction 1
2. Problem focus 4
3. Review on Poor monsoon and Agriculture in Tamil Nadu 5
4. Study area 8
5. Methodology 9
6. Results and Discussions 13
6.1.Examining rainfall pattern in Tamil Nadu 13
6.2. Season wise Poor monsoon events 14
6.3. Impact of rainfall on crop production 15
6.4. Regression results 16
6.4.1. Rice - Mean Yield Function 16
6.4.2. Rice - Samba season – Mean Yield Function 17
6.4.3. Sorghum - Mean Yield Function 18
6.4.4. Rice Yield Variance function 20
6.4.5. Samba Rice Yield Variance Function 21
6.4.6. Sorghum - Yield Variance Function 22
6.5. Occurrence and Effect of Drought on Crop Production 22
6.6. Survey Results 24
6.6.1. Socio-economic characteristics of sample households 24
6.6.2. Perceptions about poor monsoon / climate change 25
6.6.3. Perceived Impacts on poor monsoon on Agriculture 26
6.6.4. Adaptation strategies for poor monsoon and its adoption level 29
6.6.5. Income management strategies 36
6.6.6. Socio-economic profile of farmers used Adaptation
practices during poor monsoon
36
6.6.7. Major constraints in adoption of strategies to mitigate the
poor monsoon impacts
37
6.6.8. Major constrains in adaptation of crop insurance schemes 38
7. Technological and Policies options to mitigate the impacts of poor
monsoon
39
8. Conclusions 45
9. References 47
LIST OF TABLES
TABLE
NO. TITLE
PAGE
NO.
1. Descriptive statistics Season wise Rainfall in Tamil Nadu from 1971-
2010
13
2. Grouping Rainfall events across the districts of Tamil Nadu from 1971 to
2010
15
3. Estimated Parameters from Feasible Generalized Model with Fixed
Effects for Rice Crop during the year
17
4. Estimated Parameters from Feasible Generalized Model with Fixed
Effects for Rice Crop during Samba Season
18
5. Estimated Parameters from Feasible Generalized model with Fixed
Effects for Sorghum crop
19
6. Estimated Parameters of Rice yield variance regression during the year 21
7. Estimated Parameters of Rice yield variance regression during the Samba
Season
21
8. Estimated Parameters of Sorghum yield variance regression during the
year
22
9. Change in Crop Output during Drought Years 23
10. Socio-economic characteristics of sampled farm households 25
11. Change in family Expenditure pattern 27
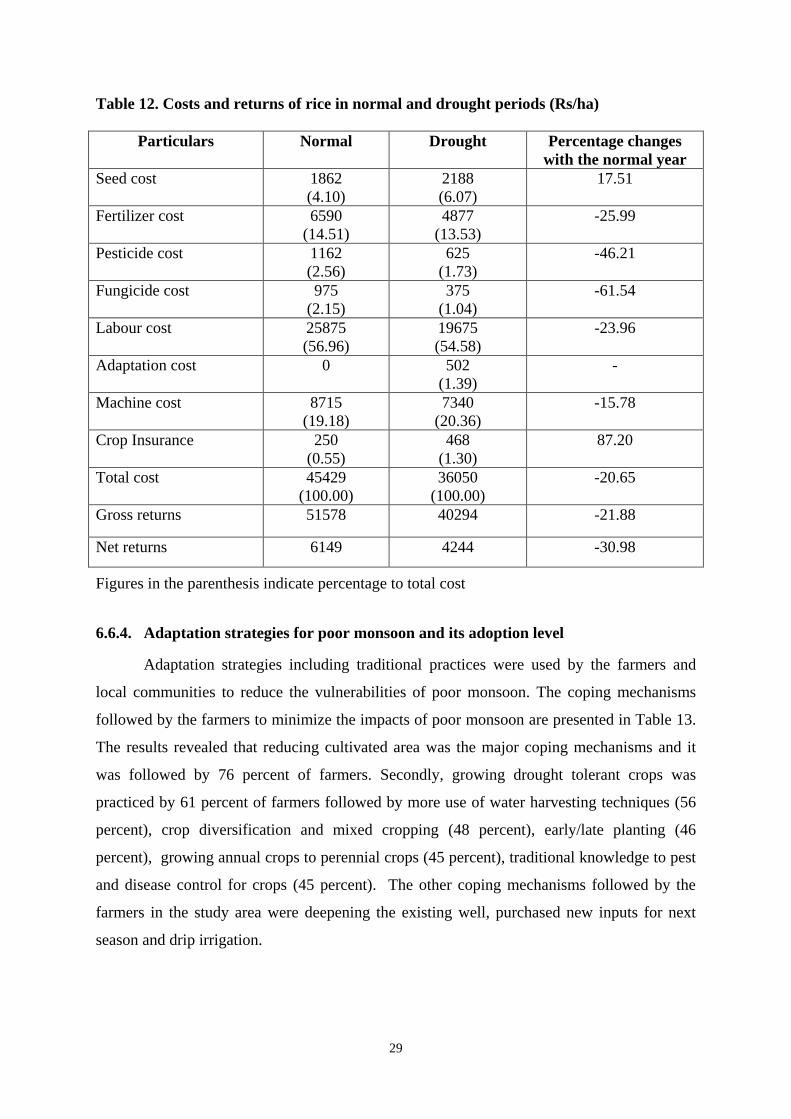
12. Costs and returns of rice in normal and drought periods (Rs/ha) 29
13. Coping/adaptation strategies to total crop failure in drought years in
Tamil Nadu
30
14. Farm Management strategies or coping mechanisms to mitigate the
impact of poor monsoon
34
15. Income management strategies in drought years 36
16. Major constraints in drought adaptation practices 38
17. Major constraints faced by farmers in crop insurance 38
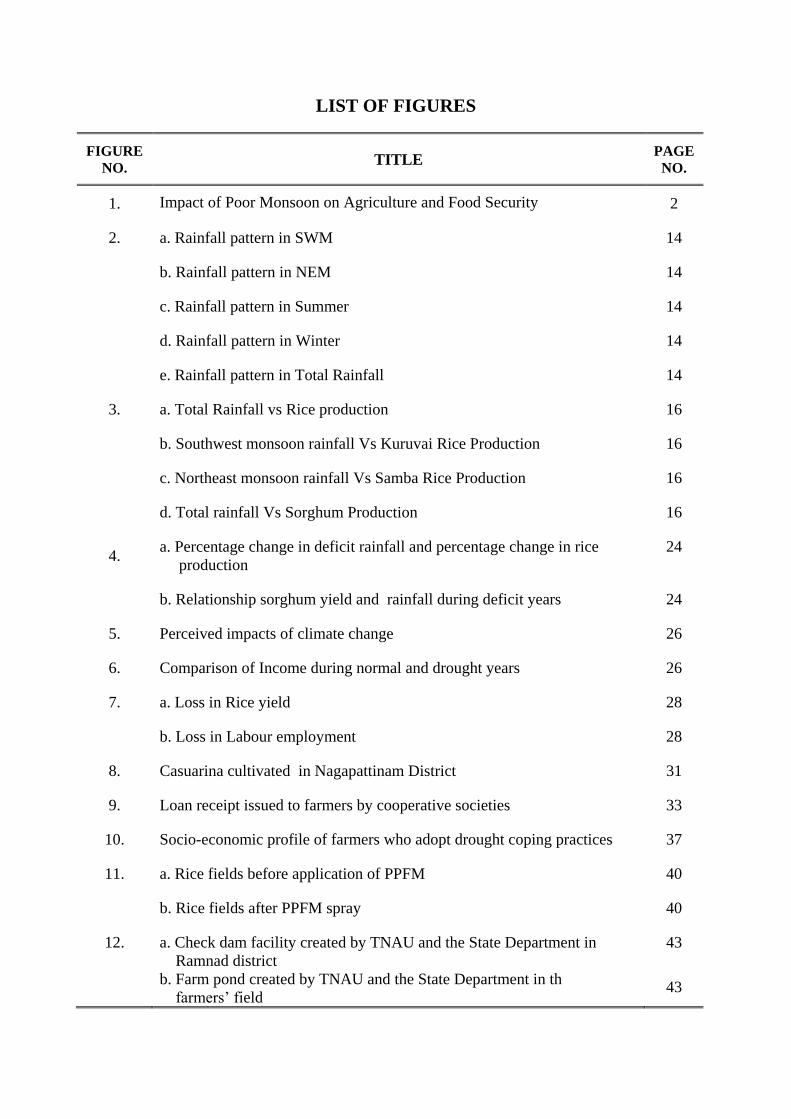
LIST OF FIGURES
FIGURE
NO. TITLE
PAGE
NO.
1. Impact of Poor Monsoon on Agriculture and Food Security 2
2. a. Rainfall pattern in SWM 14
b. Rainfall pattern in NEM 14
c. Rainfall pattern in Summer 14
d. Rainfall pattern in Winter 14
e. Rainfall pattern in Total Rainfall 14
3. a. Total Rainfall vs Rice production 16
b. Southwest monsoon rainfall Vs Kuruvai Rice Production 16
c. Northeast monsoon rainfall Vs Samba Rice Production 16
d. Total rainfall Vs Sorghum Production 16
4. a. Percentage change in deficit rainfall and percentage change in rice
production
24
b. Relationship sorghum yield and rainfall during deficit years 24
5. Perceived impacts of climate change 26
6. Comparison of Income during normal and drought years 26
7. a. Loss in Rice yield 28
b. Loss in Labour employment 28
8. Casuarina cultivated in Nagapattinam District 31
9. Loan receipt issued to farmers by cooperative societies 33
10. Socio-economic profile of farmers who adopt drought coping practices 37
11. a. Rice fields before application of PPFM 40
b. Rice fields after PPFM spray 40
12. a. Check dam facility created by TNAU and the State Department in
Ramnad district
43
b. Farm pond created by TNAU and the State Department in th
farmers’ field 43
1
Strategies to Mitigate the Impact of Poor Monsoon on Agriculture
1. Introduction
Drought is result of poor monsoon and it is a complex, slow-onset phenomenon of
ecological challenge that affects people more than any other natural hazards by causing
serious economic, social and environmental losses in both developing and developed
countries. The period of unusual dryness (i.e. drought) is a normal feature of the climate and
weather system in semi-arid and arid regions of the tropics, which covers more than one-third
of the land surface and is vulnerable to drought (Nagarajan, 2013). There is no universally
accepted definition of drought. It is generally considered to be occurring when the principal
monsoons, i.e. southwest monsoon and northeast monsoon, fail or are deficient or scanty.
Drought is not a purely physical phenomenon, but instead is interplay between natural water
availability and human demands for water supply (Agrawal, 2003).
Poor monsoon results in a serious hydrological imbalance, with consequences such as
losses of standing crop and shortage of water needed by people and livestock; „a temporary
reduction in water or moisture availability significantly below the normal or expected level
for a specified period‟, and „a creeping situation of scarcity without recharging of resources‟.
Drought is the most widespread hydro-meteorological syndrome of „prolonged period of
water scarcity affecting natural resources, environment and, thereby, the people‟.
Environmental changes, viz. climate change, land-use changes and natural resource
degradation have aggravated drought occurrences and vulnerability, thus disrupting the
normal socio-economic settings.
On an average, 28 per cent of the geographical area of India is vulnerable to drought.
Meteorologically, ± 19 per cent deviation of rainfall from the long-term mean is considered
„normal‟ in India. Deficiency in the range 20–59 per cent represents „moderate‟ drought, and
more than 60 per cent is „severe‟ drought (Samra, 2007). Aberrations in the total volume and
pattern of rainfall from the SW monsoon are primarily responsible for droughts in India.
Studies have revealed that El Niño phase of the Southern Oscillation (ENSO) too has
impacted droughts in India. The country has experienced 22 large-scale droughts; five of
them were severe. These drought prone regions suffer mostly due to the cumulative effects of
changing precipitation pattern, excessive water utilization and ecologically unsuitable
agriculture practices. It has been reported that 26 mha (795 mha of geographical area) is
subjected to different degrees of water stress and drought conditions, which includes 38.7
mha of arid areas and of 7 mha of cold deserts. About 107 mha of the country spread over
2
administrative districts in several states is affected by drought (Nagarajan, 2013). However,
most drought response strategies in India accounted on net sown area or crop yield. Emphasis
on ecosystems, particularly forests and wetlands, and urban drought is lacking. The schematic
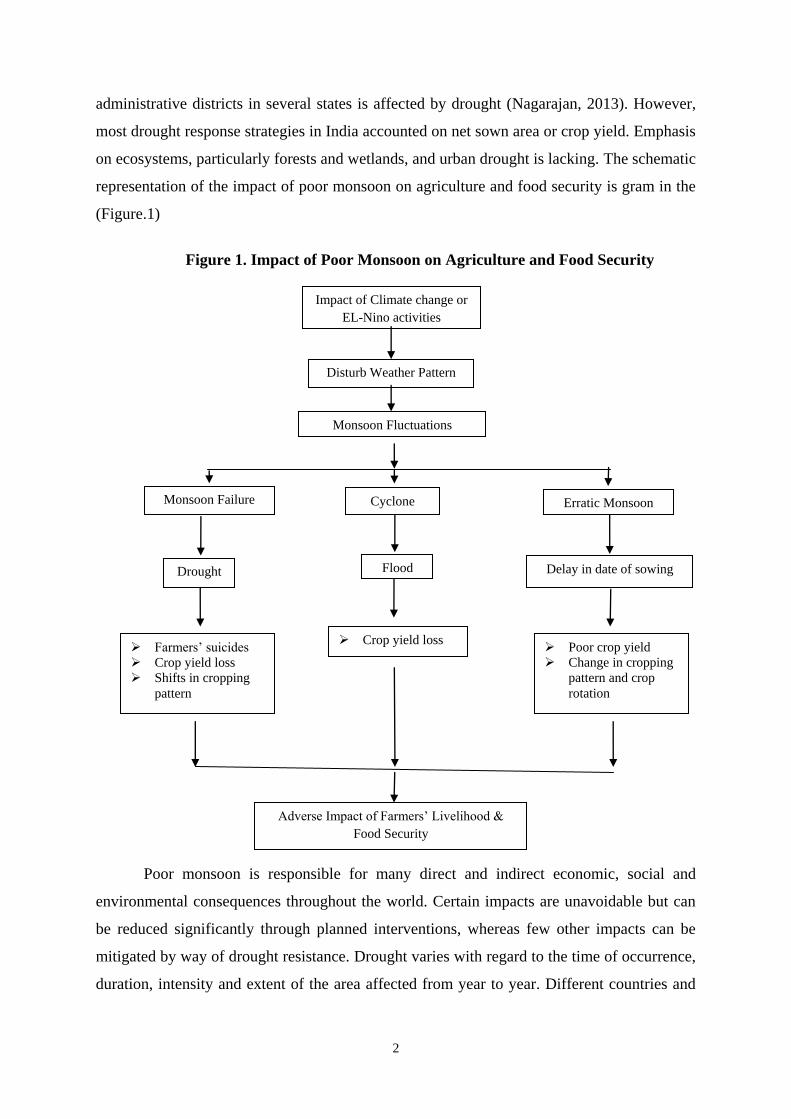
representation of the impact of poor monsoon on agriculture and food security is gram in the
(Figure.1)
Figure 1. Impact of Poor Monsoon on Agriculture and Food Security
Poor monsoon is responsible for many direct and indirect economic, social and
environmental consequences throughout the world. Certain impacts are unavoidable but can
be reduced significantly through planned interventions, whereas few other impacts can be
mitigated by way of drought resistance. Drought varies with regard to the time of occurrence,
duration, intensity and extent of the area affected from year to year. Different countries and
Monsoon Fluctuations
Monsoon Failure Erratic Monsoon
Delay in date of sowing Drought
Adverse Impact of Farmers‟ Livelihood &
Food Security
Poor crop yield
Change in cropping
pattern and crop
rotation
Farmers‟ suicides
Crop yield loss
Shifts in cropping
pattern
Cyclone
Crop yield loss
Flood
Impact of Climate change or
EL-Nino activities
Disturb Weather Pattern
3
states have developed codes, manuals, procedures, processes and policies for monitoring and
management of drought with varying understanding (Samra, 2007).
The inter-annual monsoon rainfall variability in India leads to large-scale drought, resulting
in a major effect on India food grain (Selvaraju, 2003) and on the economy of the country
(Gadgil et al., 1999). Selvaraju (2003) analyzed the relationship between Indian summer
monsoon rainfall and food grain production in India and it was reported that the food grain
production declined during the years of deficit rainfall and the correlation coefficient between
summer monsoon rainfall and food grain production was 0.71 which was statistically significant.
Certain impacts are unavoidable but can be reduced significantly through planned interventions,
whereas few other impacts can be mitigated by way of drought resistance.
4
2. Problem focus and objectives
A meaningful set of strategies to mitigate the impact of drought on rural households
could be arrived at only if the impact of drought resulting from poor monsoon on different
segments of rural population is correctly quantified. Since drought has multiple economic,
social and environmental impacts, strategies to mitigate the drought impacts should
encompass a combination of coping and adaptation strategies as well as drought prevention
or avoidance strategies, though there is very limited scope for prevention or avoidance.
Coping and/or mitigation strategies should include a set of actions within agriculture sector
such as change in crop pattern, crop varietal choice and crop management practices, water
conservation and water-saving technologies, etc, in addition to external interventions to
mitigate income shocks to affected households such as non-agricultural income generating
activities, crop insurance, and other drought relief measures. Identification and implementation
a suitable combination of these strategies warrants a thorough understanding of the existing
coping strategies followed by different segments of rural households depending upon the
intensities of drought and the possible mitigation or coping strategies available to them.
Therefore, this study aims to estimate the frequency and intensity of drought and
identify the existing coping and/or adaptation strategies that are currently in vogue so as to
suggest a suitable mix of strategies to that will minimize the impact of poor monsoon on the
most poor and vulnerable sections of rural Tamil Nadu.
Objectives
a. To study the temporal and spatial pattern of occurrence and intensity of monsoon in
Tamil Nadu
b. To quantify the impact of poor monsoon on agricultural production and income of
rural households in Tamil Nadu
c. To identify and document the coping strategies followed by farmers to overcome the
adverse impacts of poor monsoon in agriculture, and
d. To suggest suitable technological and policy interventions to mitigate the impact of
poor monsoon on agricultural production.
5
3. Review on Poor monsoon and Agriculture in Tamil Nadu
Failure of monsoon is attributed to several reasons of which EL-Nino activities caused
extreme weather events like floods and droughts. Most of the states of India are largely dependent
on rainfall for irrigation. It is not only important for the monsoon to commence, but the time of
commencement is also important. Due to shortage of rainfall, two-thirds of the seedlings may die
and late onset of monsoon delays sowing of crops leading to poor crop yield.
In Tamil Nadu, about 30 per cent of annual rainfall is recorded in the South West
monsoon and around 50 per cent is contributed by the North East monsoon through cyclonic
activity. But in the last 25 years, the state receives nearly 80 per cent of its annual rainfall
during North East monsoon (Ramasamy et al., 2004). One per cent deviation in monsoon
rainfall decreased the water release from reservoirs of Cauvery delta by 6 per cent (111.13
tmc feet) thereby the loss in food production was calculated to be 1.2 per cent during the year
2002-03. The crop loss due to deficit rainfall was estimated to be 19 per cent in 2002-03
(Menon, 2007). The retreating monsoon gives good rain in the East coast of Tamil Nadu and
South peninsula receive good rain in October, November and December. Some depression
even reaching the dimension of hurricane develops over the Bay of Bengal and the Arabian
Sea resulting in heavy wind and rainfall. Floods and cyclone cause high damaging to rice
crop. The crop loss due to cyclone (NISHA cyclone-during 19-28th November, 2008) was
estimated to be 13.3 per cent (Economic Survey, 2008). It clearly indicates that Tamil Nadu
is heavily dependent on monsoon rain, thereby prone to drought when monsoon fails and
prone to flood when cyclone. In recent years, the state experienced the events of climate
change viz. monsoon failure, erratic monsoon, cyclone flood and Tsumani.
Cauvery River Basin is one of the important river basins in Tamil Nadu in terms of
agriculture and ensuring food security. The Tamil Nadu part of Cauvery basin contributes
40 per cent of the food grain production of Tamil Nadu. The Tamil Nadu part of Cauvery
basin receives an annual average rainfall of 956 mm and employs over 4.4 million people in
the agricultural sector. Rice is the major crop irrigated mostly by water from the Cauvery
river. During kuruvai season, the beginning of the cropping activity depends upon the release
of water from the Mettur reservoir. Traditional water release date is June 12th
every year,
although only 14 times since the Mettur dam was built in 1934, the water was released on the
scheduled date and in other years based on the water availability in the reservoir release date
was delayed. The onset of southwest monsoon is one of the major determinants to release of
6
reservoir. Due to large variation in rainfall in the catchment as well as in the delta area of the
basin, the water availability on time for cultivating paddy is becoming highly uncertain. It is
reported that if the onset of Southwest monsoon is becoming late, the possibility of kuruvai
crop failure increases throughout the Cauvery delta zone of Tamil Nadu and it results seasonal
unemployment to the agricultural labours, poor crop yield, lack of fodder and food shortages
(Janakarajan, 2007). During the month of September and October, the neighbouring state
Karnataka releases substantial amounts of water and the Northeast Monsoon also sets in Tamil
Nadu, in turn, there are floods in coastal areas created by the Cauvery and sea-water
ingression thereby increasing the soil salinity. The crop losses were experienced in both
deficit and excess amount of rainfall in Tamil Nadu. To prevent this, the prediction systems
play a very important role. (Janakarajan, 2003 & 2007). In recent decades, the occurrence of
more frequent and strong El Nino together with Indian Ocean Dipole-Zonal mode events
(Nerilie et al, 2007) may have contributed to the unusual rainfall anomalies over the Cauvery
river basin. In addition, the possible effect of anthropogenic induced warming cannot be ruled
out. Hence, cultivating paddy in the kharif season is a challenging issue in the Cauvery basin.
Ranganathan (2009) also reported that though the precipitation had negative impact on paddy
production but it is decreasing the production variability significantly. The Cauvery delta
zone dummy is negatively significant with the variability of rice production and positively
significant with the sorghum production. Palanisami et al, (2008) quantifying the
vulnerability and impact of rainfall fluctuations on production of major crops in Tamil Nadu,
India and revealed that there will be a reduction in both area and yields of Paddy, Groundnut
and Sugarcane by about 3.5 to 12.5 per cent due to impact of climate change and overall
production will decrease between 9 to 22 per cent for these crops.
The drought of 1980 destroyed the groundnut crop over one lakh (100,000) hectares
in the districts of Chingleput and North Arcot. As a result of the failure of the northeast
monsoon in 1980, drought prevailed in 3–4 districts in early 1981, resulting in the destruction
of mangoes and coconuts. The 1982 drought caused huge losses in paddy and groundnut
crops as well as drinking water shortages. Even the moisture-surplus regions of the state,
like the Nilgiri hills, suffered from severe drought, resulting in the destruction of more than
6,000 hectares of tea plantation. The state also lost more than one lakh hectares of paddy,
millets, and pulses during the 1983 drought. Hydropower generation failed because of very
low water in the Mettur reservoir. The drought of 1987 put the entire state (as well as the
country) in the doldrums. In the 1987 drought, the hardest hit crops were paddy, millets, and
7
pulses. Out of 24 lakh hectares, paddy could be sown on only 20 lakh hectares, resulting in a
yield of 56 lakh tons compared to a target of 66 lakh tons. Similarly, production of millets
was only 16 lakh tons (compared to a target of 20 lakhs) and pulse production was 4.27 lakh
tons (compared to a target of 4.75 lakh).
In the year 1995, there had been acute water scarcity and severe drought for the State
of Tamil Nadu due to failure of North East monsoon. About 17 districts were fully affected
and 14 Taluks in other 5districts were declared drought affected areas. The Government
sanctioned a sum of Rs. 62.69 crores for providing drinking water supply besides Rs. 35
crores from Calamity Relief Fund (CRF) for road works in the districts Ramanathapuram,
Perambalur, Tiruvallur, Thanjavur and Nagapattinam. Scarcity of drinking water continued to
be felt in 19 districts in 1996 also. The Government sanctioned a sum of Rs.11.79 crores from
CRF to combat drinking water scarcity. In the year 1997, scarcity of drinking water
continued in 15 districts. The Government sanctioned a sum of Rs.26.44 crores from CRF to
combat drinking water scarcity. In the year 2000, a sum of Rs.3 crores was sanctioned by the
Government from CRF to meet the expenditure in connection with the drought situation
which prevailed in the districts of Ramanathapuram, Thoothukkudi, Vellore and
Tiruvannamalai for providing sinking bore wells, flushing of bore wells, providing ring wells,
construction of open wells, replacement of motor and for transportation of water.
8
4. Study area
Tamil Nadu, located in southeast peninsular India, receives the major part of its
annual rainfall during the northeast monsoon season. Coastal Tamil Nadu receives about
60per cent of its annual rainfall and interior Tamil Nadu receives about 40-50 per cent of
annual rainfall during northeast monsoon. Rainfall, ground water availability, reservoir
levels, and crop conditions determine the nature and extent of drought in Tamil Nadu. The
state has four distinct rainfall climates such as the southwest monsoon (June-September),
northeast monsoon (October-December), winter (January-February), and summer (March-
May). It has eight drought-prone districts covering 833,997 square kilometers, or about 64
percent of the total area of the state. The southern zone is under the rain shadow region,
having a prolonged dry climate.
The sample districts of Coimbatore and Tiruppur, Sivagangai, Nagapattinam and
Perambalur have been selected to study the impact of poor monsoon. Red, black and alluvial
soil types predominate in the state, and sandy soils in the southeastern part are prone to chronic
droughts. The agricultural sector in Tamil Nadu is subjected to erratic monsoon seasons. This is
a major factor for high yield risk in rainfed crops, making farmers extremely vulnerable to yield
(and income) losses. In the cropping seasons, high water deficiency was observed in all the
drought-prone districts which indicate the prevalence of drought in the said districts.
The vicissitudes of the rainfall of Tamil Nadu state has led to considerable and
widespread interest among the public, farmers as well as in government circles in recent
years, in view of the frequent failure of northeast monsoon rainfall over Tamil Nadu and the
consequent water scarcity condition. In Tamil Nadu, the crop loss due to drought was
estimated to be 19 per cent in 2002-03 (Menon, 2007). Monsoon failure causing crop failure,
drying up ecosystems and shortage of drinking water results in undue hardship to the rural
and urban communities.
9
5. Methodology
This study was based on both secondary and primary data. The secondary data on
rainfall, temperature, land use, crop pattern including crop area, production and yield of
major crops. Primary data on yield, farm employment, income sources, coping mechanisms
to drought and constraints in adoption of drought coping strategies were also collected over a
period of 40 years (from 1971 to 2010) across all the districts thus facilitating panel data
analysis at district level.
The impact of drought on farmers was estimated through its impact on agricultural
production comprising three parameters vis., crop area, yield and production. Using
multivariate (regression) analysis of factors affecting crop output with rainfall as an
explanatory variable, along with other important variables will facilitate the estimation of
area, yield and production impacts of drought on farm households.
While most farmers who sell crop outputs was affected by loss in income, net buyers
of food commodities especially poor farmers and rural agricultural labour households will be
affected in two ways – viz., reduced agricultural employment and wage income, as well as
increased prices of food commodities. Through a survey of farm households on number of
days of employment, wage rates and food expenditures during drought and normal years, the
employment and income effect of drought have been estimated. The estimation of household
level impacts on small and marginal farmers and identification and documentation of drought
coping mechanisms was done through a household survey of 300 farmers spread across
different agro-climatic zones of the state. Primary data collected include information
regarding household income and employment during normal and drought years, crop area,
yield and production, and coping strategies to overcome reduced crop income, and coping
mechanisms to overcome water and fodder scarcity for livestock during normal and the latest
drought years (2011-12 was a normal year and 2012-13 was a drought year).
10
Econometric Methods
1. Just-Pope production
In the present study, to analyze the impact of climate change on major food crops in
Tamil Nadu, Just-pope production function was used. Following Isik and Devadass (2006), it
is assumed that the relation between productivity (production per hectare) Yit of a crop at
district i during year t and the climate variables Xit viz. rainfall and temperature is given by
Just-pope stochastic production function (Just and Pope, 1979)
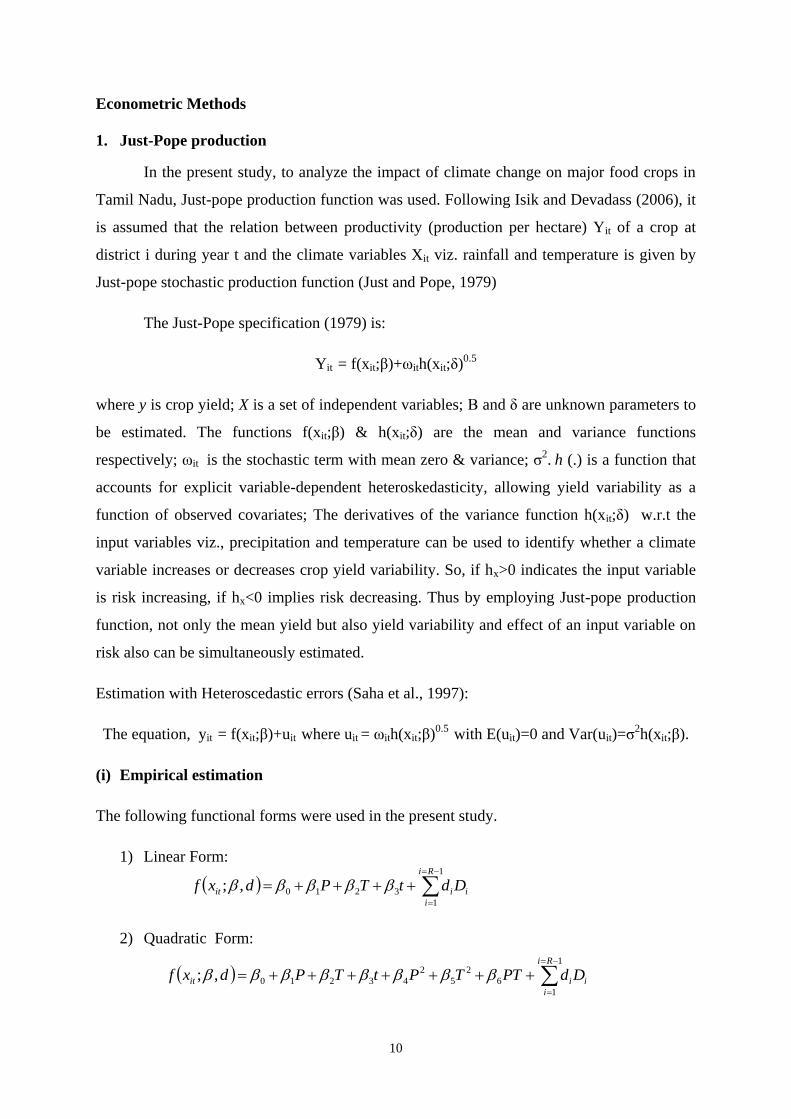
The Just-Pope specification (1979) is:
Yit = f(xit;β)+ωith(xit;δ)0.5
where y is crop yield; X is a set of independent variables; Β and δ are unknown parameters to
be estimated. The functions f(xit;β) & h(xit;δ) are the mean and variance functions
respectively; ωit is the stochastic term with mean zero & variance; σ2. h (.) is a function that
accounts for explicit variable-dependent heteroskedasticity, allowing yield variability as a
function of observed covariates; The derivatives of the variance function h(xit;δ) w.r.t the
input variables viz., precipitation and temperature can be used to identify whether a climate
variable increases or decreases crop yield variability. So, if hx>0 indicates the input variable
is risk increasing, if hx<0 implies risk decreasing. Thus by employing Just-pope production
function, not only the mean yield but also yield variability and effect of an input variable on
risk also can be simultaneously estimated.
Estimation with Heteroscedastic errors (Saha et al., 1997):
The equation, yit = f(xit;β)+uit where uit = ωith(xit;β)0.5
with E(uit)=0 and Var(uit)=σ2h(xit;β).
(i) Empirical estimation
The following functional forms were used in the present study.
1) Linear Form:
2) Quadratic Form:
1
1
3210,;Ri
i
iiit DdtTPdxf
i
Ri
i
iit DdPTTPtTPdxf
1
1
6
2
5
2
43210,;
11
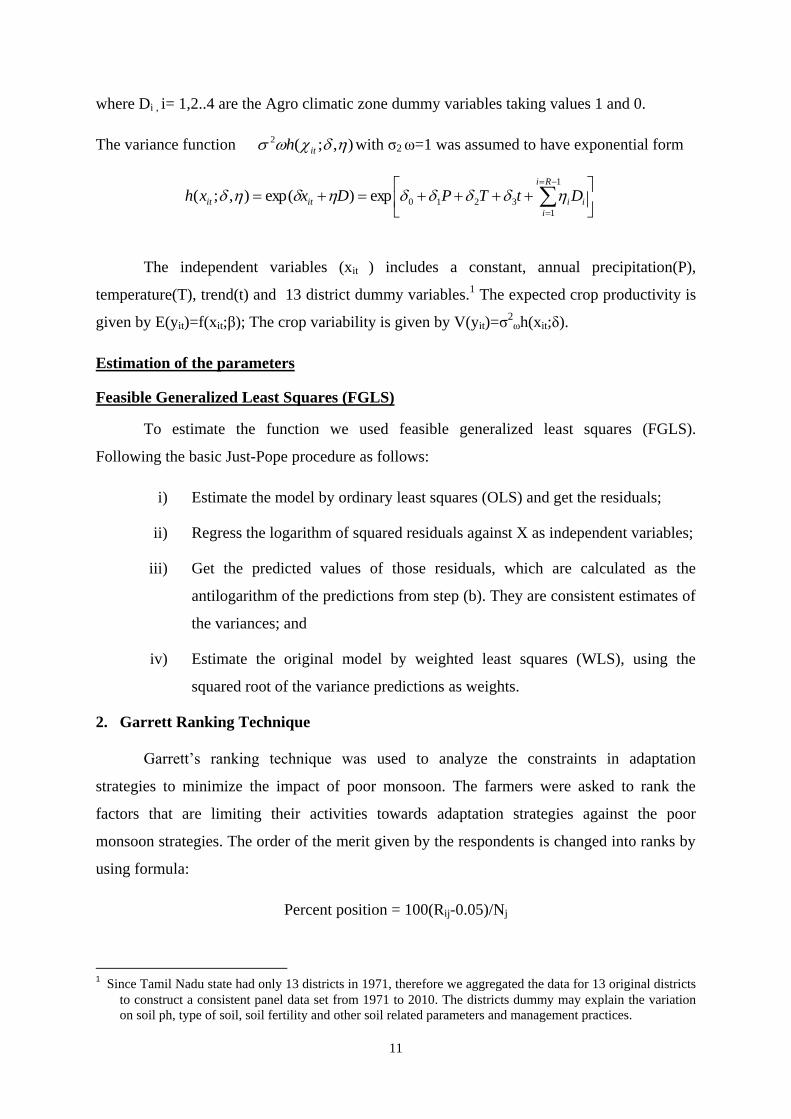
where Di , i= 1,2..4 are the Agro climatic zone dummy variables taking values 1 and 0.
The variance function with σ2 ω=1 was assumed to have exponential form
The independent variables (xit ) includes a constant, annual precipitation(P),
temperature(T), trend(t) and 13 district dummy variables.1 The expected crop productivity is
given by E(yit)=f(xit;β); The crop variability is given by V(yit)=σ2
ωh(xit;δ).
Estimation of the parameters
Feasible Generalized Least Squares (FGLS)
To estimate the function we used feasible generalized least squares (FGLS).
Following the basic Just-Pope procedure as follows:
i) Estimate the model by ordinary least squares (OLS) and get the residuals;
ii) Regress the logarithm of squared residuals against X as independent variables;
iii) Get the predicted values of those residuals, which are calculated as the
antilogarithm of the predictions from step (b). They are consistent estimates of
the variances; and
iv) Estimate the original model by weighted least squares (WLS), using the
squared root of the variance predictions as weights.
2. Garrett Ranking Technique
Garrett‟s ranking technique was used to analyze the constraints in adaptation
strategies to minimize the impact of poor monsoon. The farmers were asked to rank the
factors that are limiting their activities towards adaptation strategies against the poor
monsoon strategies. The order of the merit given by the respondents is changed into ranks by
using formula:
Percent position = 100(Rij-0.05)/Nj
1 Since Tamil Nadu state had only 13 districts in 1971, therefore we aggregated the data for 13 original districts
to construct a consistent panel data set from 1971 to 2010. The districts dummy may explain the variation
on soil ph, type of soil, soil fertility and other soil related parameters and management practices.
1
1
3210exp)exp(),;(Ri
i
iiitit DtTPDxxh
),;(2 ith

12
Where Rij = Rank given for ith
item by jth
individual
Nij= Number of items marked by jth
individual
The percent of each rank is converted into scores by referring tables given by Garrett
(1966). Then for each factor, the scores of individual respondents are added together and
divided by total number of respondents for whom scores are added. The mean scores for all
the factors are ranked by arranging in descending order, accordingly the constraints are
prioritized.
13
6. Results and Discussions
6.1. Examining rainfall pattern in Tamil Nadu
Rainfall is one of the dominant factors responsible for crop production. The weather
and rainfall can set in motion favourable or unfavourable factors which considerably
influence the harvest from the fields. The rainfall pattern across different seasons is presented
in Table 1. Northeast monsoon rainfall is the major source of rainfall which accounted
50 percent to total rainfall followed by southwest monsoon (34 percent) and summer
monsoon (13 percent) and winter monsoon (3 percent). The coefficient of variation (CV)
indicates that huge variation in winter rainfall (135 percent), followed by summer monsoon
(40 percent), northeast monsoon (30 percent) and southwest monsoon (20 percent).
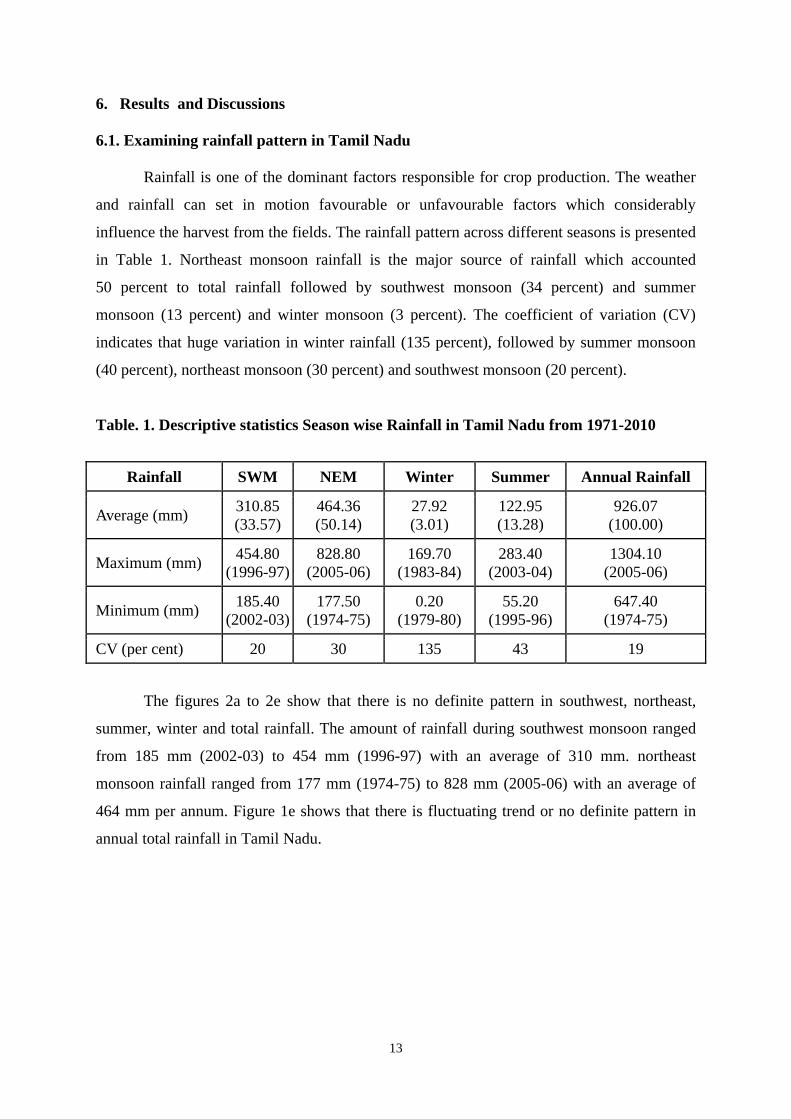
Table. 1. Descriptive statistics Season wise Rainfall in Tamil Nadu from 1971-2010
Rainfall SWM NEM Winter Summer Annual Rainfall
Average (mm) 310.85
(33.57)
464.36
(50.14)
27.92
(3.01)
122.95
(13.28)
926.07
(100.00)
Maximum (mm) 454.80
(1996-97)
828.80
(2005-06)
169.70
(1983-84)
283.40
(2003-04)
1304.10
(2005-06)
Minimum (mm) 185.40
(2002-03)
177.50
(1974-75)
0.20
(1979-80)
55.20
(1995-96)
647.40
(1974-75)
CV (per cent) 20 30 135 43 19
The figures 2a to 2e show that there is no definite pattern in southwest, northeast,
summer, winter and total rainfall. The amount of rainfall during southwest monsoon ranged
from 185 mm (2002-03) to 454 mm (1996-97) with an average of 310 mm. northeast
monsoon rainfall ranged from 177 mm (1974-75) to 828 mm (2005-06) with an average of
464 mm per annum. Figure 1e shows that there is fluctuating trend or no definite pattern in
annual total rainfall in Tamil Nadu.
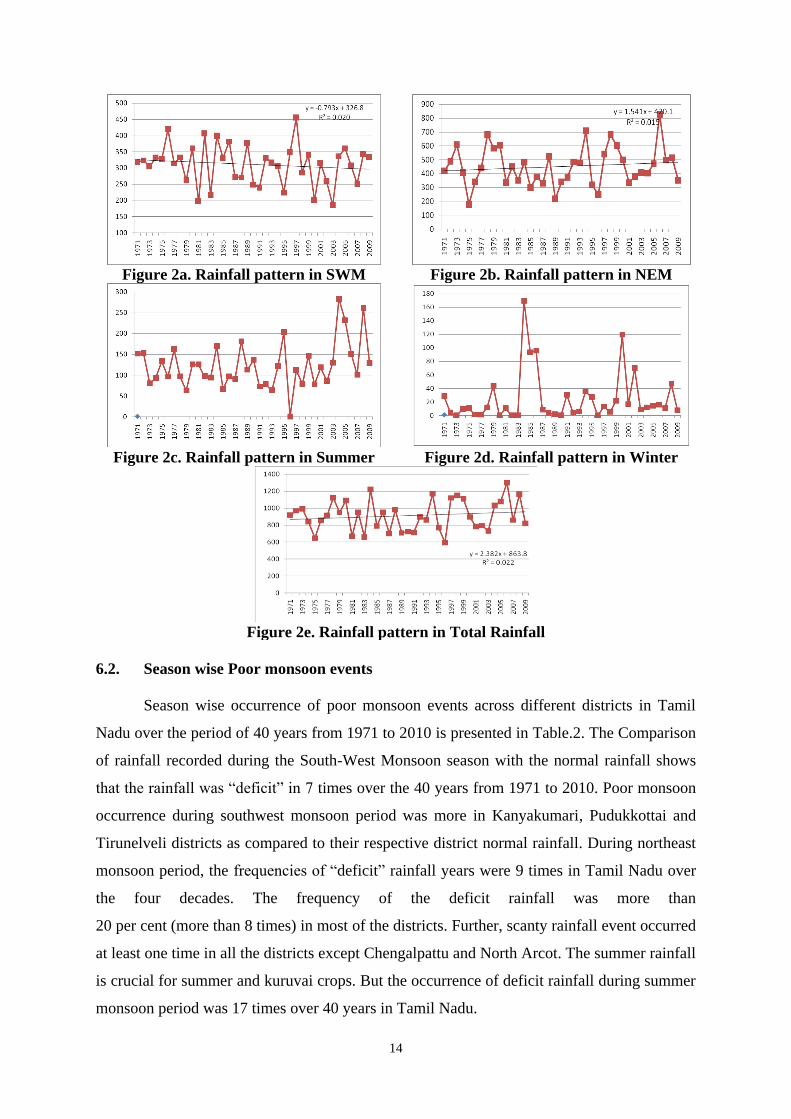
14
Figure 2a. Rainfall pattern in SWM Figure 2b. Rainfall pattern in NEM
Figure 2c. Rainfall pattern in Summer Figure 2d. Rainfall pattern in Winter
Figure 2e. Rainfall pattern in Total Rainfall
6.2. Season wise Poor monsoon events
Season wise occurrence of poor monsoon events across different districts in Tamil
Nadu over the period of 40 years from 1971 to 2010 is presented in Table.2. The Comparison
of rainfall recorded during the South-West Monsoon season with the normal rainfall shows
that the rainfall was “deficit” in 7 times over the 40 years from 1971 to 2010. Poor monsoon
occurrence during southwest monsoon period was more in Kanyakumari, Pudukkottai and
Tirunelveli districts as compared to their respective district normal rainfall. During northeast
monsoon period, the frequencies of “deficit” rainfall years were 9 times in Tamil Nadu over
the four decades. The frequency of the deficit rainfall was more than
20 per cent (more than 8 times) in most of the districts. Further, scanty rainfall event occurred
at least one time in all the districts except Chengalpattu and North Arcot. The summer rainfall
is crucial for summer and kuruvai crops. But the occurrence of deficit rainfall during summer
monsoon period was 17 times over 40 years in Tamil Nadu.
15
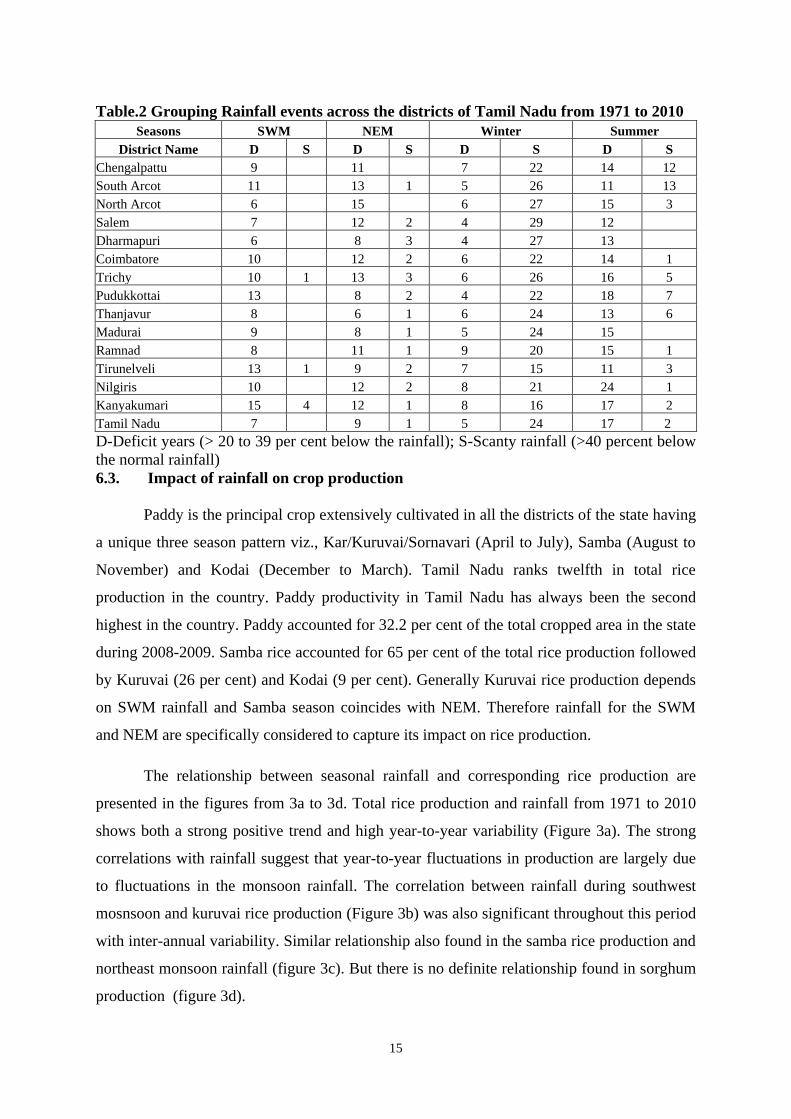
Table.2 Grouping Rainfall events across the districts of Tamil Nadu from 1971 to 2010
Seasons SWM NEM Winter Summer
District Name D S D S D S D S
Chengalpattu 9 11 7 22 14 12
South Arcot 11 13 1 5 26 11 13
North Arcot 6 15 6 27 15 3
Salem 7 12 2 4 29 12
Dharmapuri 6 8 3 4 27 13
Coimbatore 10 12 2 6 22 14 1
Trichy 10 1 13 3 6 26 16 5
Pudukkottai 13 8 2 4 22 18 7
Thanjavur 8 6 1 6 24 13 6
Madurai 9 8 1 5 24 15
Ramnad 8 11 1 9 20 15 1
Tirunelveli 13 1 9 2 7 15 11 3
Nilgiris 10 12 2 8 21 24 1
Kanyakumari 15 4 12 1 8 16 17 2
Tamil Nadu 7 9 1 5 24 17 2
D-Deficit years (> 20 to 39 per cent below the rainfall); S-Scanty rainfall (>40 percent below
the normal rainfall)
6.3. Impact of rainfall on crop production
Paddy is the principal crop extensively cultivated in all the districts of the state having
a unique three season pattern viz., Kar/Kuruvai/Sornavari (April to July), Samba (August to
November) and Kodai (December to March). Tamil Nadu ranks twelfth in total rice
production in the country. Paddy productivity in Tamil Nadu has always been the second
highest in the country. Paddy accounted for 32.2 per cent of the total cropped area in the state
during 2008-2009. Samba rice accounted for 65 per cent of the total rice production followed
by Kuruvai (26 per cent) and Kodai (9 per cent). Generally Kuruvai rice production depends
on SWM rainfall and Samba season coincides with NEM. Therefore rainfall for the SWM
and NEM are specifically considered to capture its impact on rice production.
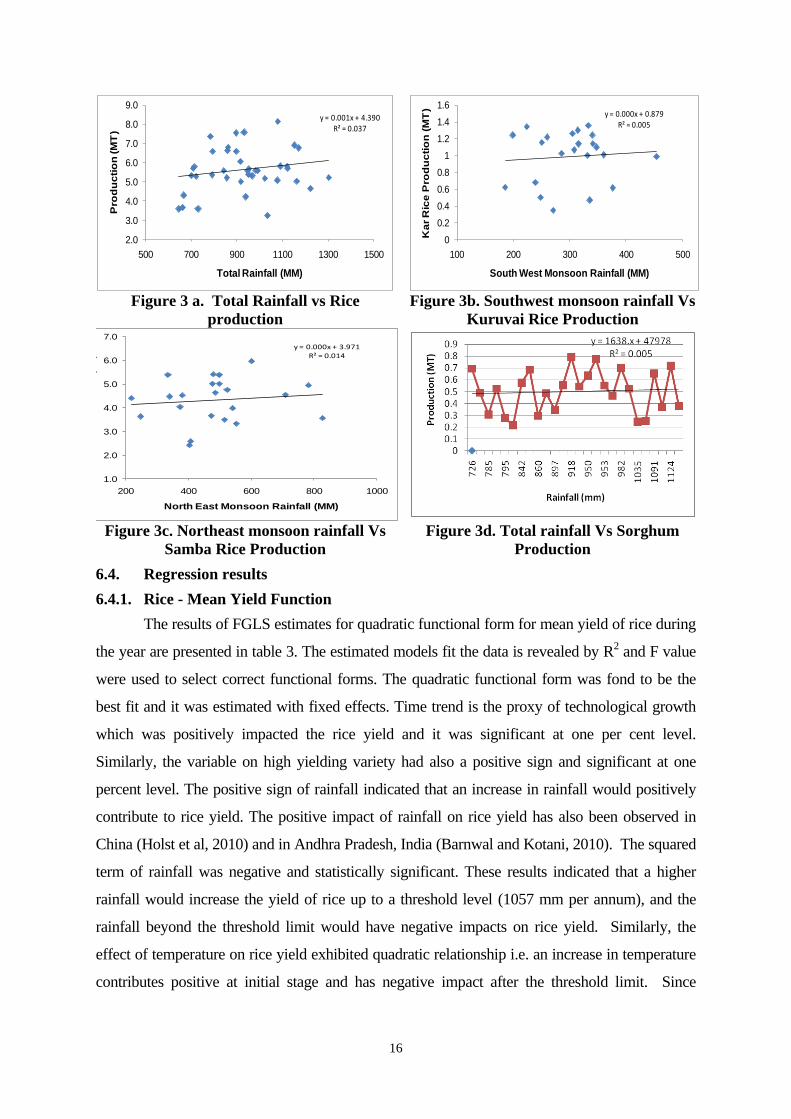
The relationship between seasonal rainfall and corresponding rice production are
presented in the figures from 3a to 3d. Total rice production and rainfall from 1971 to 2010
shows both a strong positive trend and high year-to-year variability (Figure 3a). The strong
correlations with rainfall suggest that year-to-year fluctuations in production are largely due
to fluctuations in the monsoon rainfall. The correlation between rainfall during southwest
mosnsoon and kuruvai rice production (Figure 3b) was also significant throughout this period
with inter-annual variability. Similar relationship also found in the samba rice production and
northeast monsoon rainfall (figure 3c). But there is no definite relationship found in sorghum
production (figure 3d).
16
y = 0.001x + 4.390R² = 0.037
2.0
3.0
4.0
5.0
6.0
7.0
8.0
9.0
500 700 900 1100 1300 1500
Pro
du
cti
on
(M
T)
Total Rainfall (MM)
y = 0.000x + 0.879R² = 0.005
0
0.2
0.4
0.6
0.8
1
1.2
1.4
1.6
100 200 300 400 500
Ka
r R
ice
Pro
du
cti
on
(M
T)
South West Monsoon Rainfall (MM)
Figure 3 a. Total Rainfall vs Rice
production
Figure 3b. Southwest monsoon rainfall Vs
Kuruvai Rice Production
y = 0.000x + 3.971R² = 0.014
1.0
2.0
3.0
4.0
5.0
6.0
7.0
200 400 600 800 1000
Kar
Ric
e P
rod
uct
ion
(MT
)
North East Monsoon Rainfall (MM)
Figure 3c. Northeast monsoon rainfall Vs
Samba Rice Production
Figure 3d. Total rainfall Vs Sorghum
Production
6.4. Regression results
6.4.1. Rice - Mean Yield Function
The results of FGLS estimates for quadratic functional form for mean yield of rice during
the year are presented in table 3. The estimated models fit the data is revealed by R2 and F value
were used to select correct functional forms. The quadratic functional form was fond to be the
best fit and it was estimated with fixed effects. Time trend is the proxy of technological growth
which was positively impacted the rice yield and it was significant at one per cent level.
Similarly, the variable on high yielding variety had also a positive sign and significant at one
percent level. The positive sign of rainfall indicated that an increase in rainfall would positively
contribute to rice yield. The positive impact of rainfall on rice yield has also been observed in
China (Holst et al, 2010) and in Andhra Pradesh, India (Barnwal and Kotani, 2010). The squared
term of rainfall was negative and statistically significant. These results indicated that a higher
rainfall would increase the yield of rice up to a threshold level (1057 mm per annum), and the
rainfall beyond the threshold limit would have negative impacts on rice yield. Similarly, the
effect of temperature on rice yield exhibited quadratic relationship i.e. an increase in temperature
contributes positive at initial stage and has negative impact after the threshold limit. Since
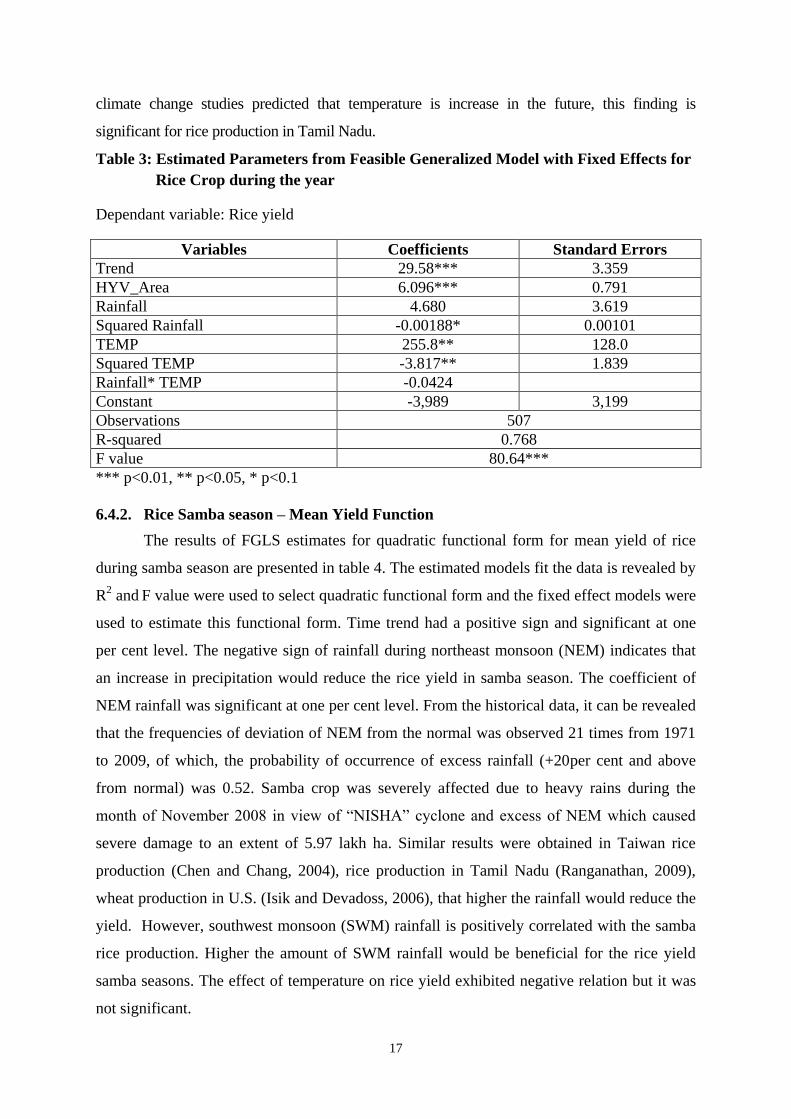
17
climate change studies predicted that temperature is increase in the future, this finding is
significant for rice production in Tamil Nadu.
Table 3: Estimated Parameters from Feasible Generalized Model with Fixed Effects for
Rice Crop during the year
Dependant variable: Rice yield
Variables Coefficients Standard Errors
Trend 29.58*** 3.359
HYV_Area 6.096*** 0.791
Rainfall 4.680 3.619
Squared Rainfall -0.00188* 0.00101
TEMP 255.8** 128.0
Squared TEMP -3.817** 1.839
Rainfall* TEMP -0.0424
Constant -3,989 3,199
Observations 507
R-squared 0.768
F value 80.64***
*** p<0.01, ** p<0.05, * p<0.1
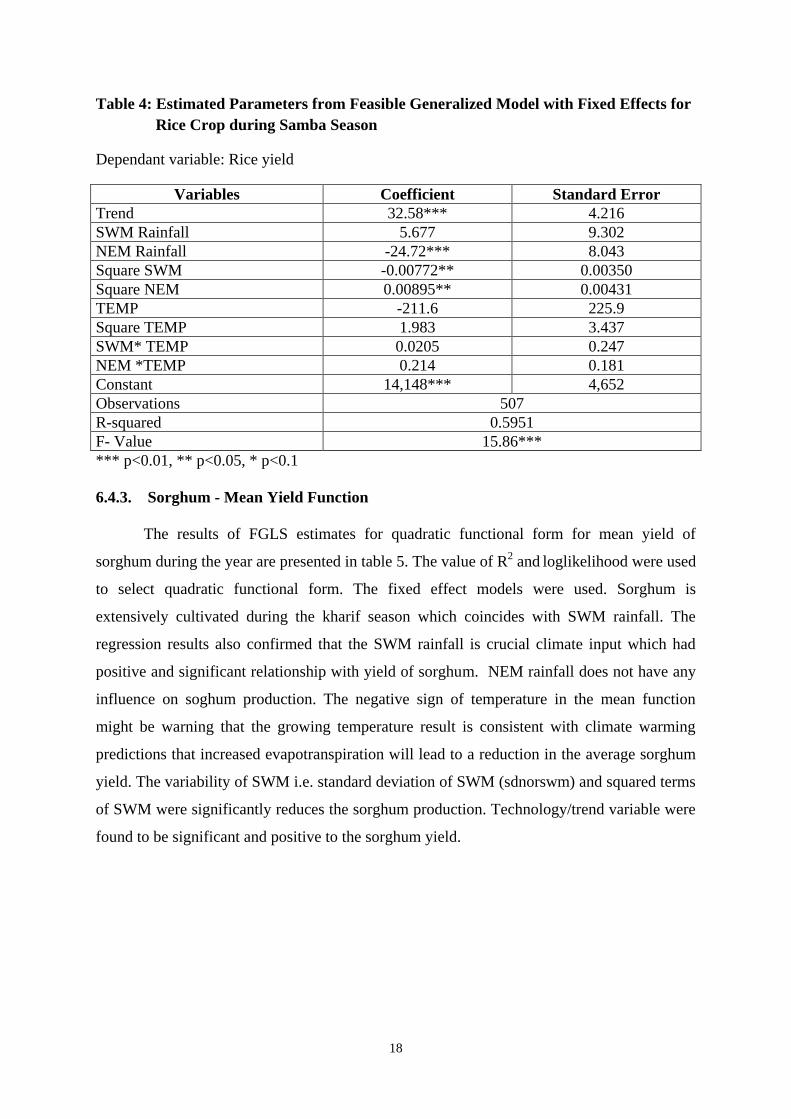
6.4.2. Rice Samba season – Mean Yield Function
The results of FGLS estimates for quadratic functional form for mean yield of rice
during samba season are presented in table 4. The estimated models fit the data is revealed by
R2 and
F value were used to select quadratic functional form and the fixed effect models were
used to estimate this functional form. Time trend had a positive sign and significant at one
per cent level. The negative sign of rainfall during northeast monsoon (NEM) indicates that
an increase in precipitation would reduce the rice yield in samba season. The coefficient of
NEM rainfall was significant at one per cent level. From the historical data, it can be revealed
that the frequencies of deviation of NEM from the normal was observed 21 times from 1971
to 2009, of which, the probability of occurrence of excess rainfall (+20per cent and above
from normal) was 0.52. Samba crop was severely affected due to heavy rains during the
month of November 2008 in view of “NISHA” cyclone and excess of NEM which caused
severe damage to an extent of 5.97 lakh ha. Similar results were obtained in Taiwan rice
production (Chen and Chang, 2004), rice production in Tamil Nadu (Ranganathan, 2009),
wheat production in U.S. (Isik and Devadoss, 2006), that higher the rainfall would reduce the
yield. However, southwest monsoon (SWM) rainfall is positively correlated with the samba
rice production. Higher the amount of SWM rainfall would be beneficial for the rice yield
samba seasons. The effect of temperature on rice yield exhibited negative relation but it was
not significant.
18
Table 4: Estimated Parameters from Feasible Generalized Model with Fixed Effects for
Rice Crop during Samba Season
Dependant variable: Rice yield
Variables Coefficient Standard Error
Trend 32.58*** 4.216
SWM Rainfall 5.677 9.302
NEM Rainfall -24.72*** 8.043
Square SWM -0.00772** 0.00350
Square NEM 0.00895** 0.00431
TEMP -211.6 225.9
Square TEMP 1.983 3.437
SWM* TEMP 0.0205 0.247
NEM *TEMP 0.214 0.181
Constant 14,148*** 4,652
Observations 507
R-squared 0.5951
F- Value 15.86***
*** p<0.01, ** p<0.05, * p<0.1
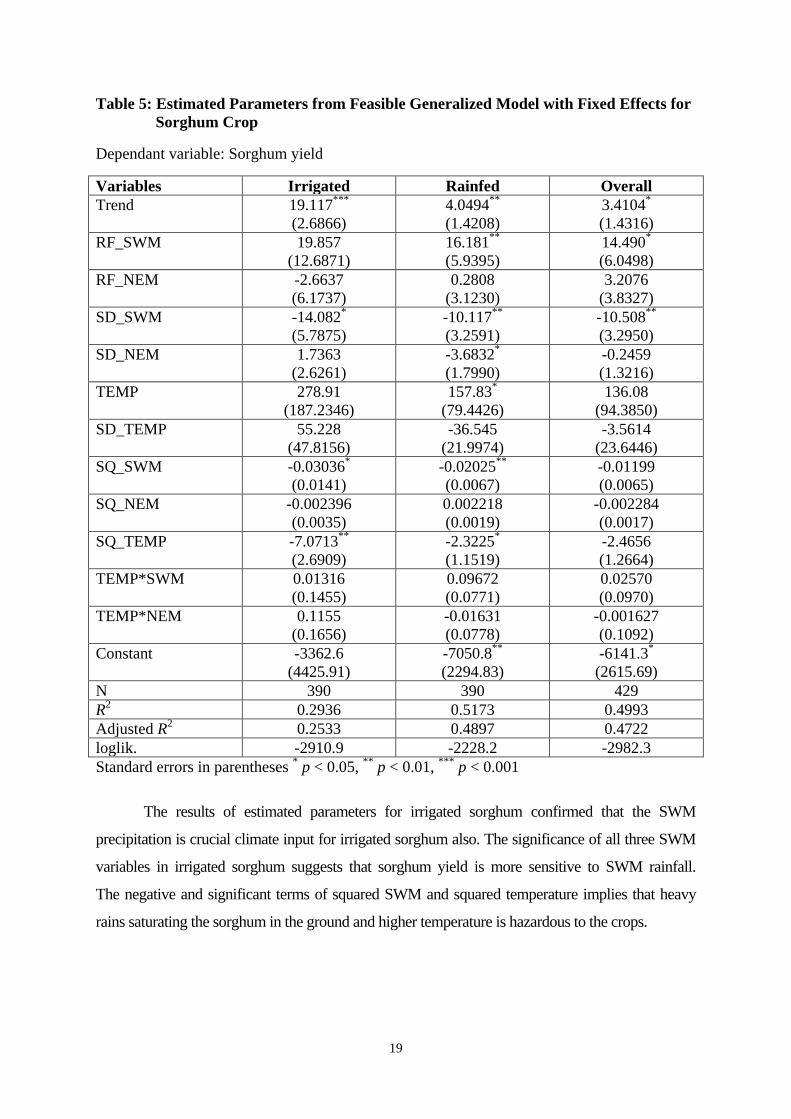
6.4.3. Sorghum - Mean Yield Function
The results of FGLS estimates for quadratic functional form for mean yield of
sorghum during the year are presented in table 5. The value of R2 and
loglikelihood were used
to select quadratic functional form. The fixed effect models were used. Sorghum is
extensively cultivated during the kharif season which coincides with SWM rainfall. The
regression results also confirmed that the SWM rainfall is crucial climate input which had
positive and significant relationship with yield of sorghum. NEM rainfall does not have any
influence on soghum production. The negative sign of temperature in the mean function
might be warning that the growing temperature result is consistent with climate warming
predictions that increased evapotranspiration will lead to a reduction in the average sorghum
yield. The variability of SWM i.e. standard deviation of SWM (sdnorswm) and squared terms
of SWM were significantly reduces the sorghum production. Technology/trend variable were
found to be significant and positive to the sorghum yield.
19
Table 5: Estimated Parameters from Feasible Generalized Model with Fixed Effects for
Sorghum Crop
Dependant variable: Sorghum yield
Variables Irrigated Rainfed Overall
Trend 19.117***
(2.6866)
4.0494**
(1.4208)
3.4104*
(1.4316)
RF_SWM 19.857
(12.6871)
16.181**
(5.9395)
14.490*
(6.0498)
RF_NEM -2.6637
(6.1737)
0.2808
(3.1230)
3.2076
(3.8327)
SD_SWM -14.082*
(5.7875)
-10.117**
(3.2591)
-10.508**
(3.2950)
SD_NEM 1.7363
(2.6261)
-3.6832*
(1.7990)
-0.2459
(1.3216)
TEMP 278.91
(187.2346)
157.83*
(79.4426)
136.08
(94.3850)
SD_TEMP 55.228
(47.8156)
-36.545
(21.9974)
-3.5614
(23.6446)
SQ_SWM -0.03036*
(0.0141)
-0.02025**
(0.0067)
-0.01199
(0.0065)
SQ_NEM -0.002396
(0.0035)
0.002218
(0.0019)
-0.002284
(0.0017)
SQ_TEMP -7.0713**
(2.6909)
-2.3225*
(1.1519)
-2.4656
(1.2664)
TEMP*SWM 0.01316
(0.1455)
0.09672
(0.0771)
0.02570
(0.0970)
TEMP*NEM 0.1155
(0.1656)
-0.01631
(0.0778)
-0.001627
(0.1092)
Constant -3362.6
(4425.91)
-7050.8**
(2294.83)
-6141.3*
(2615.69)
N 390 390 429
R2 0.2936 0.5173 0.4993
Adjusted R2 0.2533 0.4897 0.4722
loglik. -2910.9 -2228.2 -2982.3
Standard errors in parentheses * p < 0.05,
** p < 0.01,
*** p < 0.001
The results of estimated parameters for irrigated sorghum confirmed that the SWM
precipitation is crucial climate input for irrigated sorghum also. The significance of all three SWM
variables in irrigated sorghum suggests that sorghum yield is more sensitive to SWM rainfall.
The negative and significant terms of squared SWM and squared temperature implies that heavy
rains saturating the sorghum in the ground and higher temperature is hazardous to the crops.
20
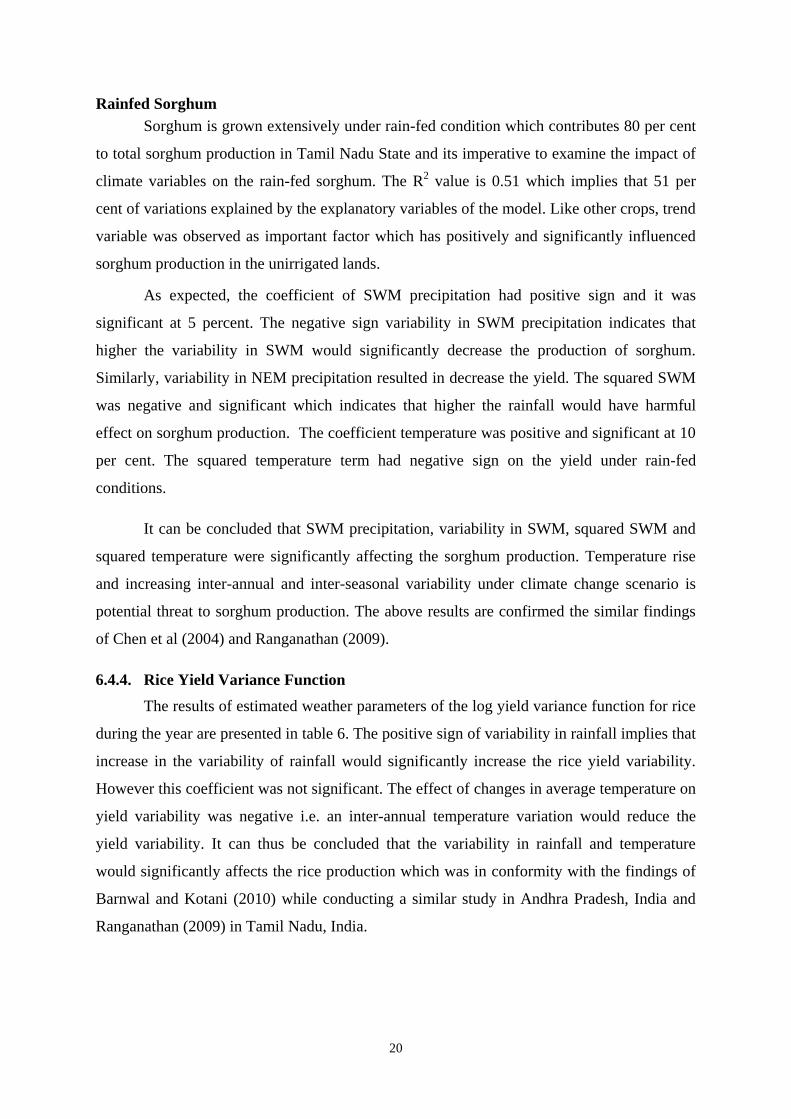
Rainfed Sorghum
Sorghum is grown extensively under rain-fed condition which contributes 80 per cent
to total sorghum production in Tamil Nadu State and its imperative to examine the impact of
climate variables on the rain-fed sorghum. The R2 value is 0.51 which implies that 51 per
cent of variations explained by the explanatory variables of the model. Like other crops, trend
variable was observed as important factor which has positively and significantly influenced
sorghum production in the unirrigated lands.
As expected, the coefficient of SWM precipitation had positive sign and it was
significant at 5 percent. The negative sign variability in SWM precipitation indicates that
higher the variability in SWM would significantly decrease the production of sorghum.
Similarly, variability in NEM precipitation resulted in decrease the yield. The squared SWM
was negative and significant which indicates that higher the rainfall would have harmful
effect on sorghum production. The coefficient temperature was positive and significant at 10
per cent. The squared temperature term had negative sign on the yield under rain-fed
conditions.
It can be concluded that SWM precipitation, variability in SWM, squared SWM and
squared temperature were significantly affecting the sorghum production. Temperature rise
and increasing inter-annual and inter-seasonal variability under climate change scenario is
potential threat to sorghum production. The above results are confirmed the similar findings
of Chen et al (2004) and Ranganathan (2009).
6.4.4. Rice Yield Variance Function
The results of estimated weather parameters of the log yield variance function for rice
during the year are presented in table 6. The positive sign of variability in rainfall implies that
increase in the variability of rainfall would significantly increase the rice yield variability.
However this coefficient was not significant. The effect of changes in average temperature on
yield variability was negative i.e. an inter-annual temperature variation would reduce the
yield variability. It can thus be concluded that the variability in rainfall and temperature
would significantly affects the rice production which was in conformity with the findings of
Barnwal and Kotani (2010) while conducting a similar study in Andhra Pradesh, India and
Ranganathan (2009) in Tamil Nadu, India.
21
Table 6: Estimated Parameters of Rice yield variance regression during the year
Dependant variable: Rice yield variance
Variables Coefficients Standard Errors
Trend -0.00664 0.0157
Phyva 0.0131*** 0.00404
Nortot 0.000817 0.00154
Temp -0.00634 0.0579
Constant 9.250*** 2.466
Observations 507
R-squared 0.187
*** p<0.01, ** p<0.05, * p<0.1
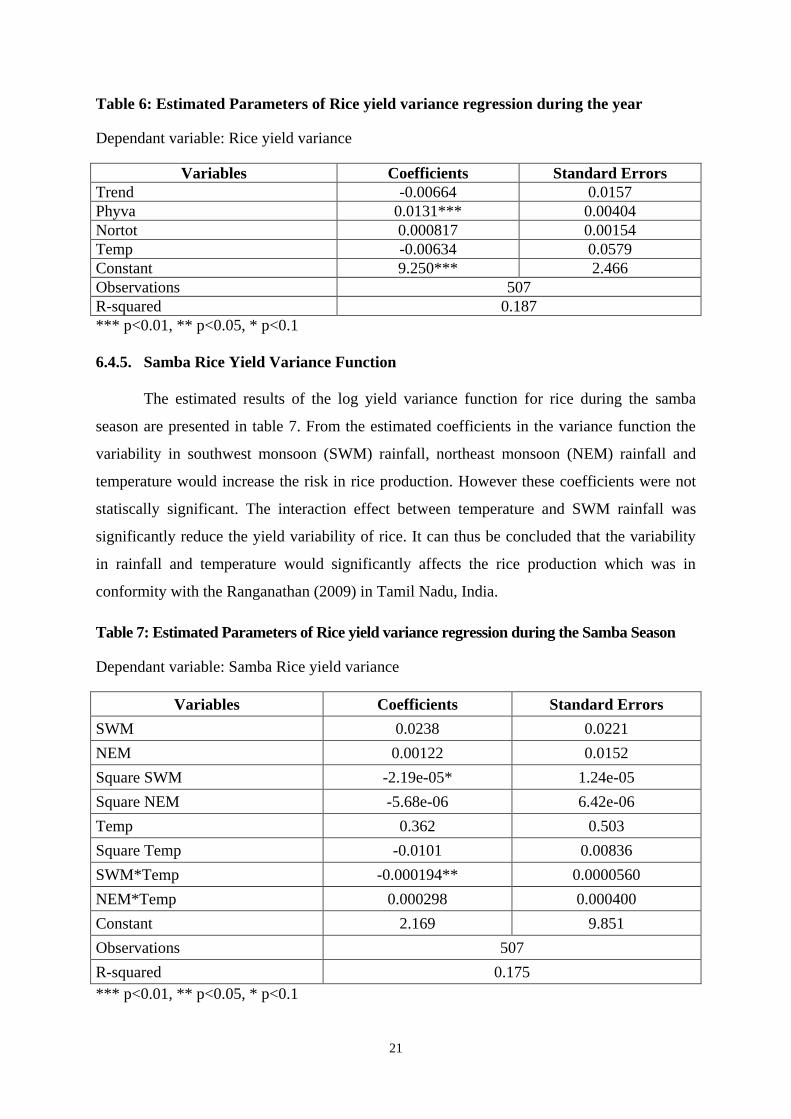
6.4.5. Samba Rice Yield Variance Function
The estimated results of the log yield variance function for rice during the samba
season are presented in table 7. From the estimated coefficients in the variance function the
variability in southwest monsoon (SWM) rainfall, northeast monsoon (NEM) rainfall and
temperature would increase the risk in rice production. However these coefficients were not
statiscally significant. The interaction effect between temperature and SWM rainfall was
significantly reduce the yield variability of rice. It can thus be concluded that the variability
in rainfall and temperature would significantly affects the rice production which was in
conformity with the Ranganathan (2009) in Tamil Nadu, India.
Table 7: Estimated Parameters of Rice yield variance regression during the Samba Season
Dependant variable: Samba Rice yield variance
Variables Coefficients Standard Errors
SWM 0.0238 0.0221
NEM 0.00122 0.0152
Square SWM -2.19e-05* 1.24e-05
Square NEM -5.68e-06 6.42e-06
Temp 0.362 0.503
Square Temp -0.0101 0.00836
SWM*Temp -0.000194** 0.0000560
NEM*Temp 0.000298 0.000400
Constant 2.169 9.851
Observations 507
R-squared 0.175
*** p<0.01, ** p<0.05, * p<0.1
22
6.4.6. Sorghum – Yield Variance Function
Log yield variance regression results are presented in the table 8. The results revealed
that the variability in SWM and NEM rainfall would increase the risk in sorghum production.
The positive coefficient value indicates that risk increasing input but it was not statically
significant. Similarly the sign of the temperature variable also indicates that risk increasing
input i.e. increase in the variability of the temperature would increase the yield variability.
Table 8: Estimated Parameters of Sorghum yield variance regression during the year
Dependant variable: Sorghum yield variance
Variables Coefficients Standard Errors
Trend 0.02509* (0.0116)
RF_SWM 0.08270 (0.0452)
RF_NEM 0.01402 (0.0298)
TEMP 0.02593 (0.8732)
Constant -14.815 (22.2899)
N 429
R2 0.0950
*** p<0.01, ** p<0.05, * p<0.1
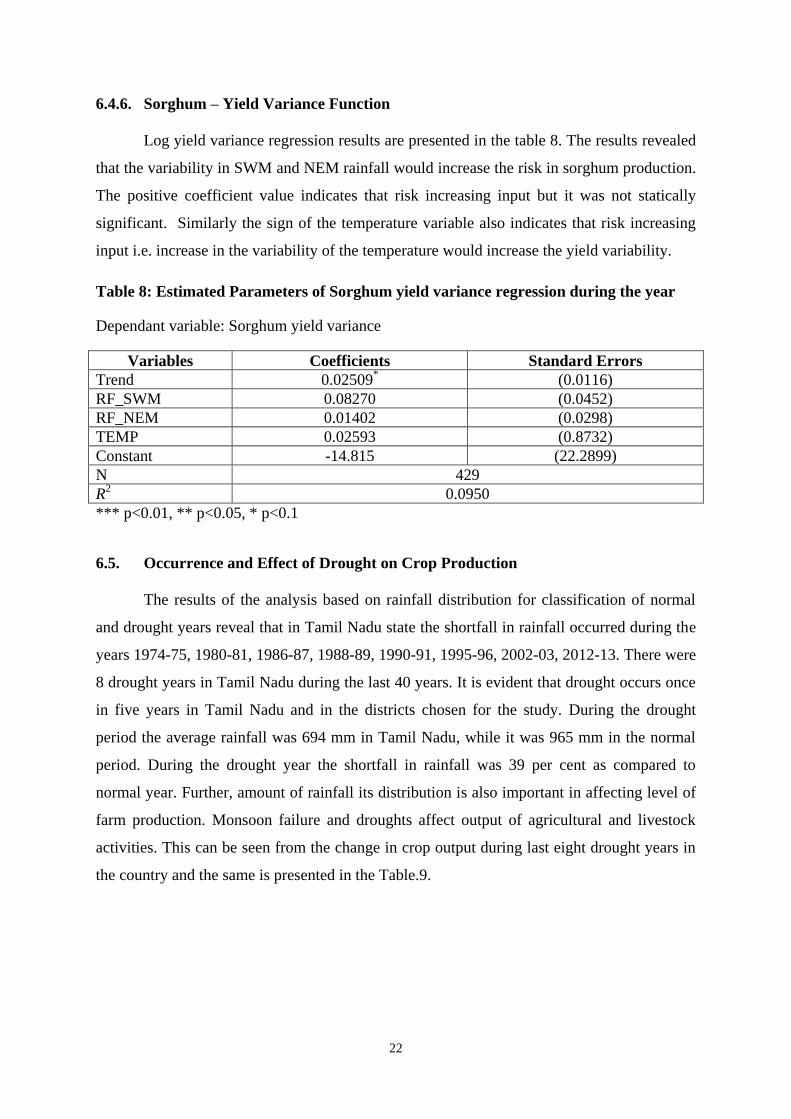
6.5. Occurrence and Effect of Drought on Crop Production
The results of the analysis based on rainfall distribution for classification of normal
and drought years reveal that in Tamil Nadu state the shortfall in rainfall occurred during the
years 1974-75, 1980-81, 1986-87, 1988-89, 1990-91, 1995-96, 2002-03, 2012-13. There were
8 drought years in Tamil Nadu during the last 40 years. It is evident that drought occurs once
in five years in Tamil Nadu and in the districts chosen for the study. During the drought
period the average rainfall was 694 mm in Tamil Nadu, while it was 965 mm in the normal
period. During the drought year the shortfall in rainfall was 39 per cent as compared to
normal year. Further, amount of rainfall its distribution is also important in affecting level of
farm production. Monsoon failure and droughts affect output of agricultural and livestock
activities. This can be seen from the change in crop output during last eight drought years in
the country and the same is presented in the Table.9.
23
Table 9: Change in Crop Output during Drought Years*
(in percent)
Drought Year Rainfall Rice Sorghum Maize Sugarcane Cotton
1974-75 -31.54 -24.03 -29.40 -43.11 -19.96 -42.25
1980-81 -29.01 4.34 -11.00 8.00 -33.70 -93.01
1986-87 -25.83 -1.0 -14.99 42.12 2.80 -42.68
1988-89 -24.99 1.60 -20.50 -22.89 -0.97 -8.05
1990-91 -22.75 -0.82 12.02 -13.59 -9.39 -6.12
1995-96 -20.06 -30.01 -32.72 1.68 -0.45 -22.81
2002-03 -24.17 -45.67 -23.31 -15.33 -18.61 -63.63
*Change in output in drought year over the previous year
During 1974-75, monsoon rains were deficient to the extent of 31 per cent of long
period average and output of rice declined by 24 per cent over the previous year. Similarly,
more than one fifth of the output of sorghum, maize, sugarcane and cotton were declined
during the same year. In 1980-81, the loss in output of sugarcane was 34 per cent and almost
total crop output was lost in cotton due to 30 percent decrease in rainfall. The last two
drought years (1995-96 and 2002-03), rice output loss was 30 and 45 percent respectively and
indicating serious threat on food security. Since cotton and sorghum are rainfed crops, the
output loss was considerably higher than other crops during drought year.
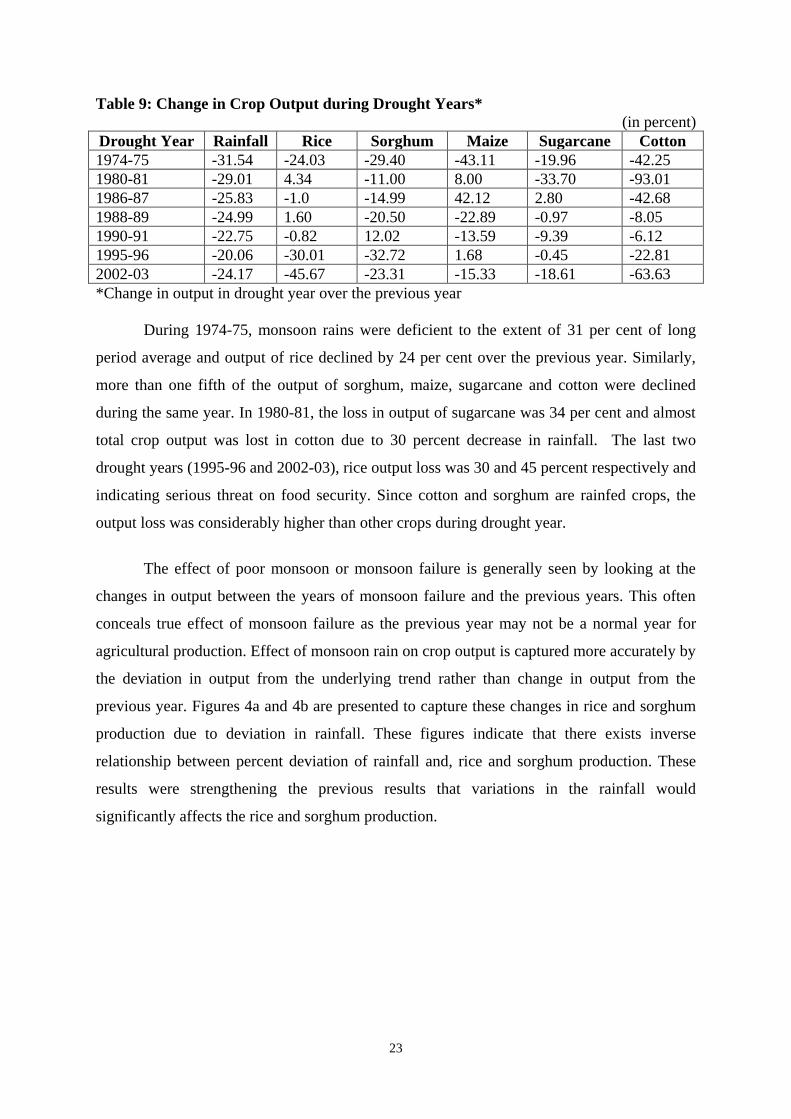
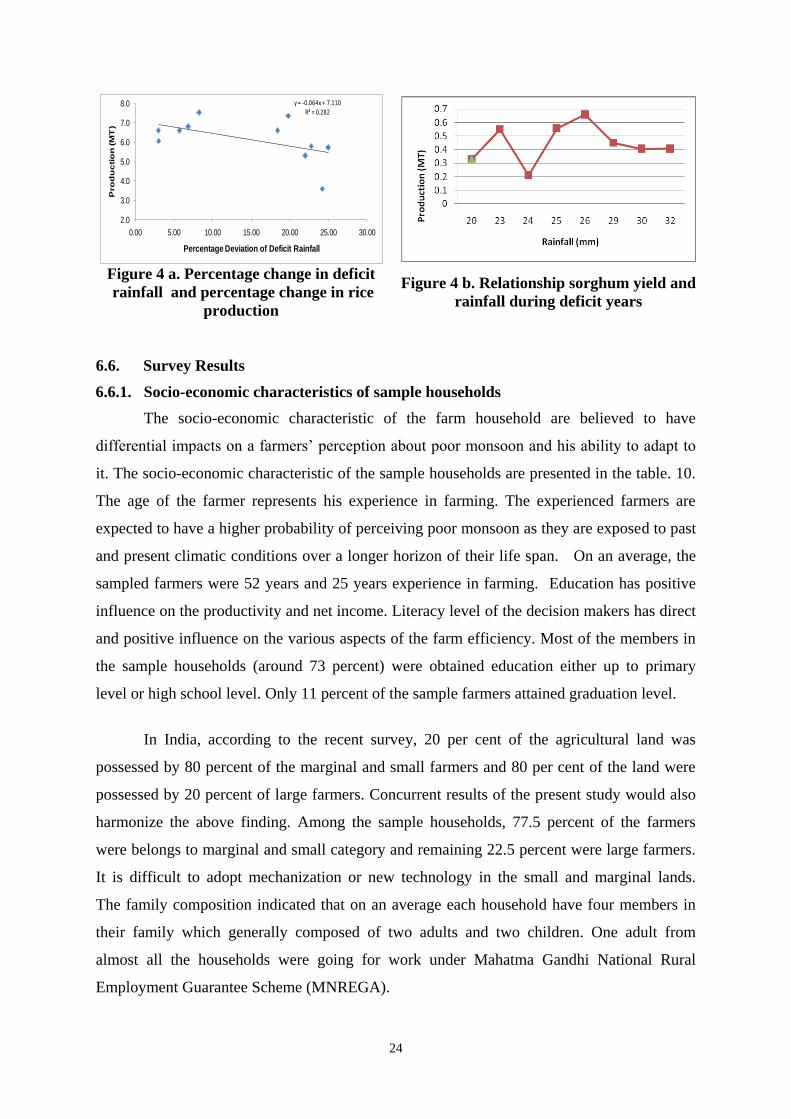
The effect of poor monsoon or monsoon failure is generally seen by looking at the
changes in output between the years of monsoon failure and the previous years. This often
conceals true effect of monsoon failure as the previous year may not be a normal year for
agricultural production. Effect of monsoon rain on crop output is captured more accurately by
the deviation in output from the underlying trend rather than change in output from the
previous year. Figures 4a and 4b are presented to capture these changes in rice and sorghum
production due to deviation in rainfall. These figures indicate that there exists inverse
relationship between percent deviation of rainfall and, rice and sorghum production. These
results were strengthening the previous results that variations in the rainfall would
significantly affects the rice and sorghum production.
24
y = -0.064x + 7.110R² = 0.282
2.0
3.0
4.0
5.0
6.0
7.0
8.0
0.00 5.00 10.00 15.00 20.00 25.00 30.00
Pro
du
cti
on
(M
T)
Percentage Deviation of Deficit Rainfall
Figure 4 a. Percentage change in deficit
rainfall and percentage change in rice
production
Figure 4 b. Relationship sorghum yield and
rainfall during deficit years
6.6. Survey Results
6.6.1. Socio-economic characteristics of sample households
The socio-economic characteristic of the farm household are believed to have
differential impacts on a farmers‟ perception about poor monsoon and his ability to adapt to
it. The socio-economic characteristic of the sample households are presented in the table. 10.
The age of the farmer represents his experience in farming. The experienced farmers are
expected to have a higher probability of perceiving poor monsoon as they are exposed to past
and present climatic conditions over a longer horizon of their life span. On an average, the
sampled farmers were 52 years and 25 years experience in farming. Education has positive
influence on the productivity and net income. Literacy level of the decision makers has direct
and positive influence on the various aspects of the farm efficiency. Most of the members in
the sample households (around 73 percent) were obtained education either up to primary
level or high school level. Only 11 percent of the sample farmers attained graduation level.
In India, according to the recent survey, 20 per cent of the agricultural land was
possessed by 80 percent of the marginal and small farmers and 80 per cent of the land were
possessed by 20 percent of large farmers. Concurrent results of the present study would also
harmonize the above finding. Among the sample households, 77.5 percent of the farmers
were belongs to marginal and small category and remaining 22.5 percent were large farmers.
It is difficult to adopt mechanization or new technology in the small and marginal lands.
The family composition indicated that on an average each household have four members in
their family which generally composed of two adults and two children. One adult from
almost all the households were going for work under Mahatma Gandhi National Rural
Employment Guarantee Scheme (MNREGA).
25
Table 10. Socio-economic characteristics of sampled farm households
S.No Particulars Nagapattinam Perambalur Sivagangai Coimbatore Overall
1. Sample Size 75 75 75 75 300
2. Average age of the
farmers (years)
54 46 53 53 52
3. Average farming
experience of the
farmers
28 16 26 28 25
4. Family size (No‟s) 4.3 4.1 4.0 3.7 4.0
5. Livestock (Yes=1,
Otherwise=0)
57 65 44 64 248
6. Irrigation sources
(Yes=1,
Otherwise=0)
31 56 59 63 209
7. Non-farm occupation
(Yes=1,
Otherwise=0)
27 31 36 38 132
8. Holding type (No.)
Marginal (<1ha) 25 43 28 28 124
Small (1-2 ha) 28 26 30 25 109
Large (>2 ha) 23 6 15 23 67
9. Education (No.)
Illiterate 11 15 13 8 47
Primary 32 34 38 32 136
High School 23 19 17 24 83
Graduation 9 8 6 11 34
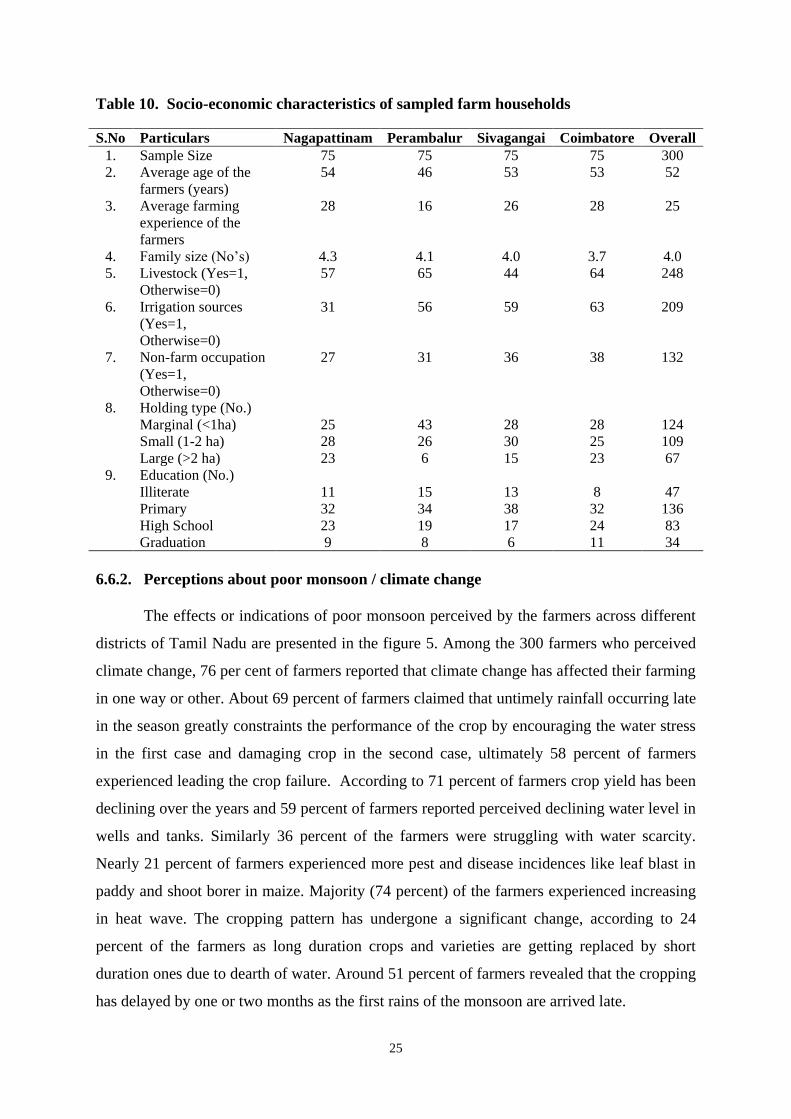
6.6.2. Perceptions about poor monsoon / climate change
The effects or indications of poor monsoon perceived by the farmers across different
districts of Tamil Nadu are presented in the figure 5. Among the 300 farmers who perceived
climate change, 76 per cent of farmers reported that climate change has affected their farming
in one way or other. About 69 percent of farmers claimed that untimely rainfall occurring late
in the season greatly constraints the performance of the crop by encouraging the water stress
in the first case and damaging crop in the second case, ultimately 58 percent of farmers
experienced leading the crop failure. According to 71 percent of farmers crop yield has been
declining over the years and 59 percent of farmers reported perceived declining water level in
wells and tanks. Similarly 36 percent of the farmers were struggling with water scarcity.
Nearly 21 percent of farmers experienced more pest and disease incidences like leaf blast in
paddy and shoot borer in maize. Majority (74 percent) of the farmers experienced increasing
in heat wave. The cropping pattern has undergone a significant change, according to 24
percent of the farmers as long duration crops and varieties are getting replaced by short
duration ones due to dearth of water. Around 51 percent of farmers revealed that the cropping
has delayed by one or two months as the first rains of the monsoon are arrived late.
26
Figure 5. Perceived impacts of climate change
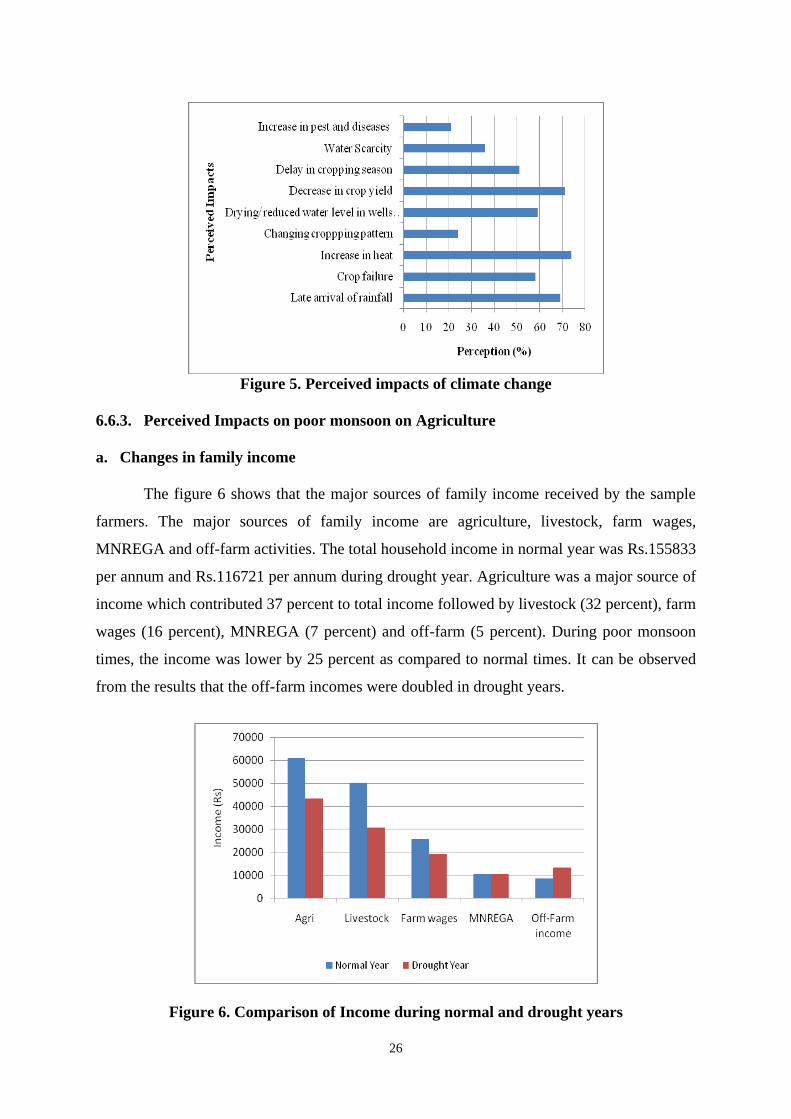
6.6.3. Perceived Impacts on poor monsoon on Agriculture
a. Changes in family income
The figure 6 shows that the major sources of family income received by the sample
farmers. The major sources of family income are agriculture, livestock, farm wages,
MNREGA and off-farm activities. The total household income in normal year was Rs.155833
per annum and Rs.116721 per annum during drought year. Agriculture was a major source of
income which contributed 37 percent to total income followed by livestock (32 percent), farm
wages (16 percent), MNREGA (7 percent) and off-farm (5 percent). During poor monsoon
times, the income was lower by 25 percent as compared to normal times. It can be observed
from the results that the off-farm incomes were doubled in drought years.
Figure 6. Comparison of Income during normal and drought years
27
b. Changes in family expenditure pattern
Table 11 shows the total annual household expenditure per month among the sample
households in normal and drought years. It was estimated at Rs. 5458 per month during
normal times and Rs. 3592 per month in drought year (2012-13). Expenditures on food, were
the higher than the non food expenditure towards transport, health and education. In drought
year, both items of expenditure were observed to be lower as compared to normal year.
Similarly the results from the table 11 indicate that the farmers‟ derived most of the food
items from various farm sources in the normal year, whereas, farm supply has been
drastically reduced in the drought year. In the drought year, farmers purchased most of the
food items from the market.
Table 11. Change in family Expenditure pattern
Particulars
Normal Year Drought Year
Quantity
(Month)
Cost/
Month
Sources (in per
cent)
Quantity
(Month)
Cost/
Month
Sources (in per
cent)
Farm Purchased Farm Purchased
Food Expenditure
Rice 25 1250 56.2 44.8 23 1334 32 68
Vegetables 13 195 10.0 90.0 7 175 27 73
Milk and
Milk Products
10 200 40.6 60.4 5 125 49 51.8
Meat 3.1 620 0 61.4 1.5 375 30.8 45.1
Egg 18.3 83 17.5 83.5 10 73.2 34.9 40.0
Fish 2.2 264 0 55.0 0 0 0 0
Oil 2.7 324 52.5 47.5 2 240 0 49.7
Coffee or Tea 24 150 31.2 45.6 10 70 27 47.9
Total Food
Expenditure
3086 2392
Non Food
Expenditure
(Rs/ Month)
2372
1200
Total 5458 3592
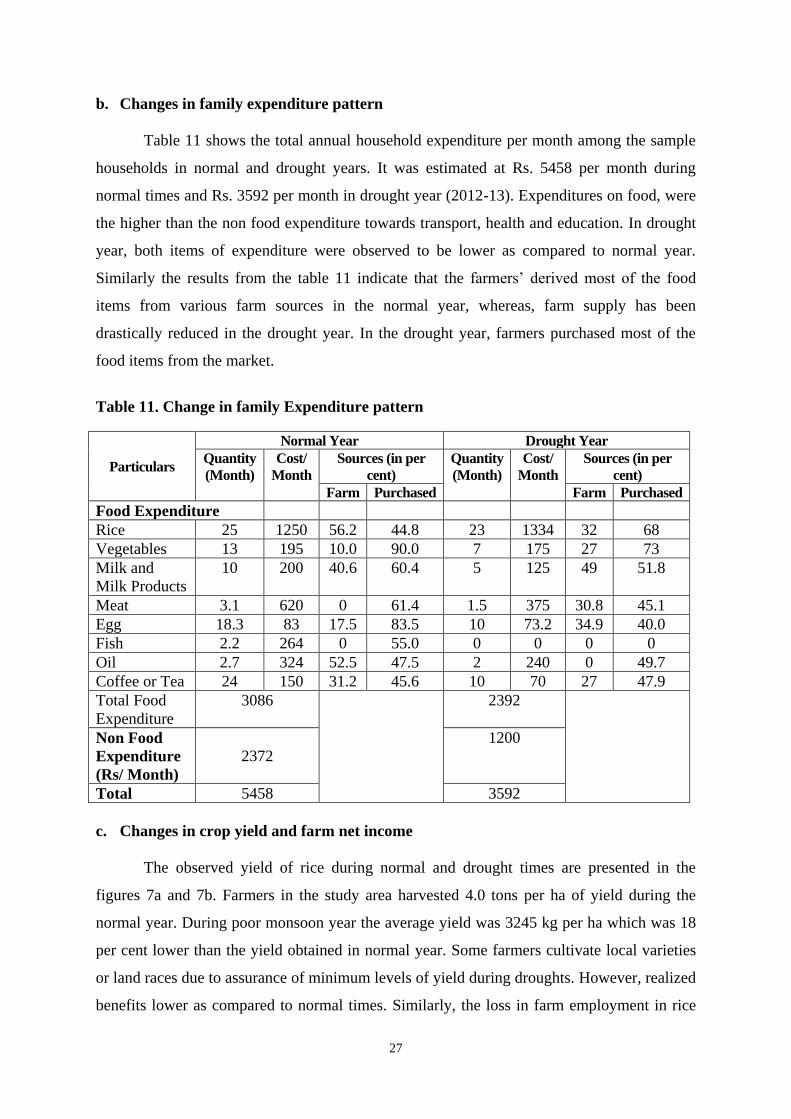
c. Changes in crop yield and farm net income
The observed yield of rice during normal and drought times are presented in the
figures 7a and 7b. Farmers in the study area harvested 4.0 tons per ha of yield during the
normal year. During poor monsoon year the average yield was 3245 kg per ha which was 18
per cent lower than the yield obtained in normal year. Some farmers cultivate local varieties
or land races due to assurance of minimum levels of yield during droughts. However, realized
benefits lower as compared to normal times. Similarly, the loss in farm employment in rice
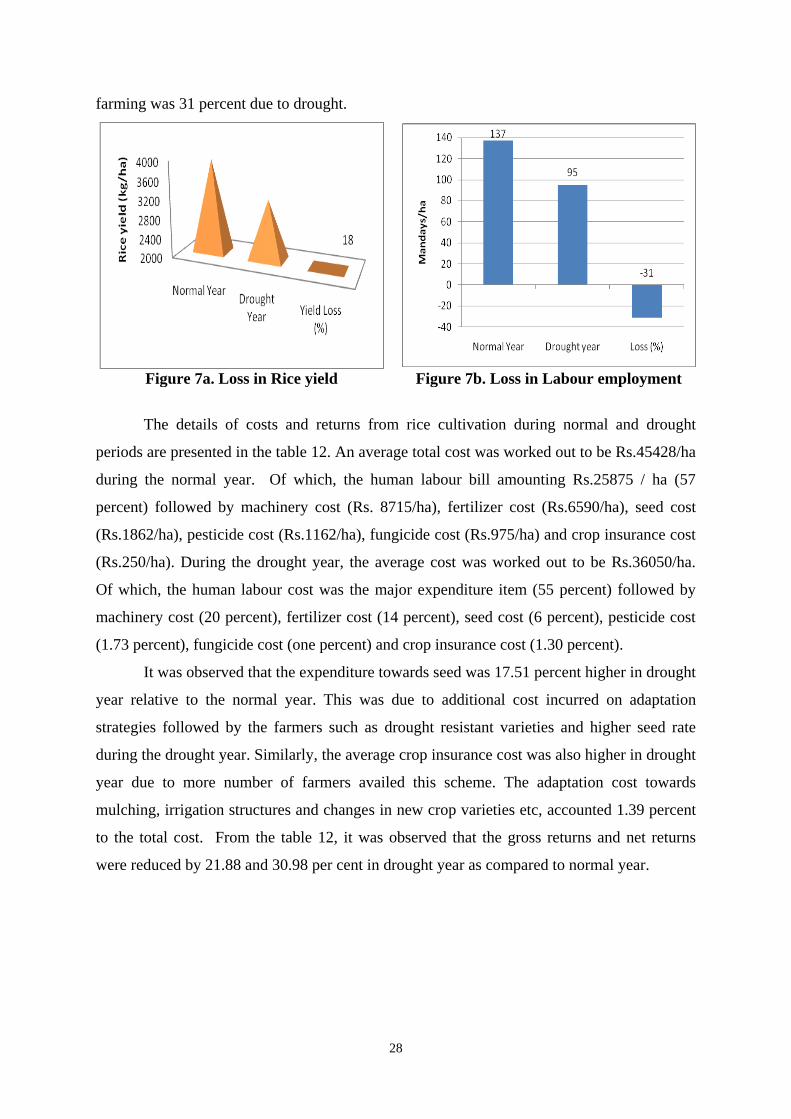
28
farming was 31 percent due to drought.
Figure 7a. Loss in Rice yield Figure 7b. Loss in Labour employment
The details of costs and returns from rice cultivation during normal and drought
periods are presented in the table 12. An average total cost was worked out to be Rs.45428/ha
during the normal year. Of which, the human labour bill amounting Rs.25875 / ha (57
percent) followed by machinery cost (Rs. 8715/ha), fertilizer cost (Rs.6590/ha), seed cost
(Rs.1862/ha), pesticide cost (Rs.1162/ha), fungicide cost (Rs.975/ha) and crop insurance cost
(Rs.250/ha). During the drought year, the average cost was worked out to be Rs.36050/ha.
Of which, the human labour cost was the major expenditure item (55 percent) followed by
machinery cost (20 percent), fertilizer cost (14 percent), seed cost (6 percent), pesticide cost
(1.73 percent), fungicide cost (one percent) and crop insurance cost (1.30 percent).
It was observed that the expenditure towards seed was 17.51 percent higher in drought
year relative to the normal year. This was due to additional cost incurred on adaptation
strategies followed by the farmers such as drought resistant varieties and higher seed rate
during the drought year. Similarly, the average crop insurance cost was also higher in drought
year due to more number of farmers availed this scheme. The adaptation cost towards
mulching, irrigation structures and changes in new crop varieties etc, accounted 1.39 percent
to the total cost. From the table 12, it was observed that the gross returns and net returns
were reduced by 21.88 and 30.98 per cent in drought year as compared to normal year.
29
Table 12. Costs and returns of rice in normal and drought periods (Rs/ha)
Particulars Normal Drought Percentage changes
with the normal year
Seed cost 1862
(4.10)
2188
(6.07)
17.51
Fertilizer cost 6590
(14.51)
4877
(13.53)
-25.99
Pesticide cost 1162
(2.56)
625
(1.73)
-46.21
Fungicide cost 975
(2.15)
375
(1.04)
-61.54
Labour cost 25875
(56.96)
19675
(54.58)
-23.96
Adaptation cost 0 502
(1.39)
-
Machine cost 8715
(19.18)
7340
(20.36)
-15.78
Crop Insurance 250
(0.55)
468
(1.30)
87.20
Total cost 45429
(100.00)
36050
(100.00)
-20.65
Gross returns 51578 40294 -21.88
Net returns 6149 4244 -30.98
Figures in the parenthesis indicate percentage to total cost
6.6.4. Adaptation strategies for poor monsoon and its adoption level
Adaptation strategies including traditional practices were used by the farmers and
local communities to reduce the vulnerabilities of poor monsoon. The coping mechanisms
followed by the farmers to minimize the impacts of poor monsoon are presented in Table 13.
The results revealed that reducing cultivated area was the major coping mechanisms and it
was followed by 76 percent of farmers. Secondly, growing drought tolerant crops was
practiced by 61 percent of farmers followed by more use of water harvesting techniques (56
percent), crop diversification and mixed cropping (48 percent), early/late planting (46
percent), growing annual crops to perennial crops (45 percent), traditional knowledge to pest
and disease control for crops (45 percent). The other coping mechanisms followed by the
farmers in the study area were deepening the existing well, purchased new inputs for next
season and drip irrigation.

30
Table 13. Coping/adaptation strategies to total crop failure in drought years in
Tamil Nadu
Strategies Percent
Purchased new inputs for next season 35
Rainwater harvesting and farm ponds 35
Crop diversification and mixed cropping 48
Growing drought tolerant crops 61
Early/Late planting 46
Reducing areas cultivated 76
Growing annual crops to perennial crops 45
More use of water harvesting techniques 56
Traditional knowledge to pest and disease control for crops 45
Deepening the existing well 34
Drip irrigation 28
Faced with unpredictable climatic variables, farmers from study area adopt different
responses to cope. Much of this response is reactive, in the sense that it is triggered by past or
current events (e.g., drought occurrences) but it is also anticipatory in the sense that it is
based on some assessment of conditions in the future (e.g., rainfall occurrences). Adaptations
may already be practiced before droughts while others are activated as drought evolves. Such
adaptive changes at household farming level have mostly undertaken due to uncertainties
faced by farmers.
a. Nagappattinam
The Nagappatinam district as there was a maximum number of agriculture land is
under canal irrigation (90 per cent irrigated area under canal irrigation). The predominate soil
types were black clay cover. In summer there was a water shortage because there were no
other sources for irrigation other than canal. Around 60 percent of the cultivated paddy and
rice-fallow-black gram or green grams as secondary crops (relay crop) after first season
paddy, or finger millet, gingelly etc are grown. The major rice varieties grown by sample
farmers were CR 1009 it has been recommended as an alternate to other variety like ADT (R)
48 since its grow tall and with stand submergence condition up to 15 days and also tolerate
drought for some extent. However, 35 percent of the sample respondents slowly switched
direct broadcasting methods because of untimely rainfall and labour shortage during peak
season. In the drought years, there has been a spurt in diversion of paddy lands to Casuarina
cultivation due to its drought tolerance and possibilities to intercrop pulses and vegetables
with Casurina in the initial years.
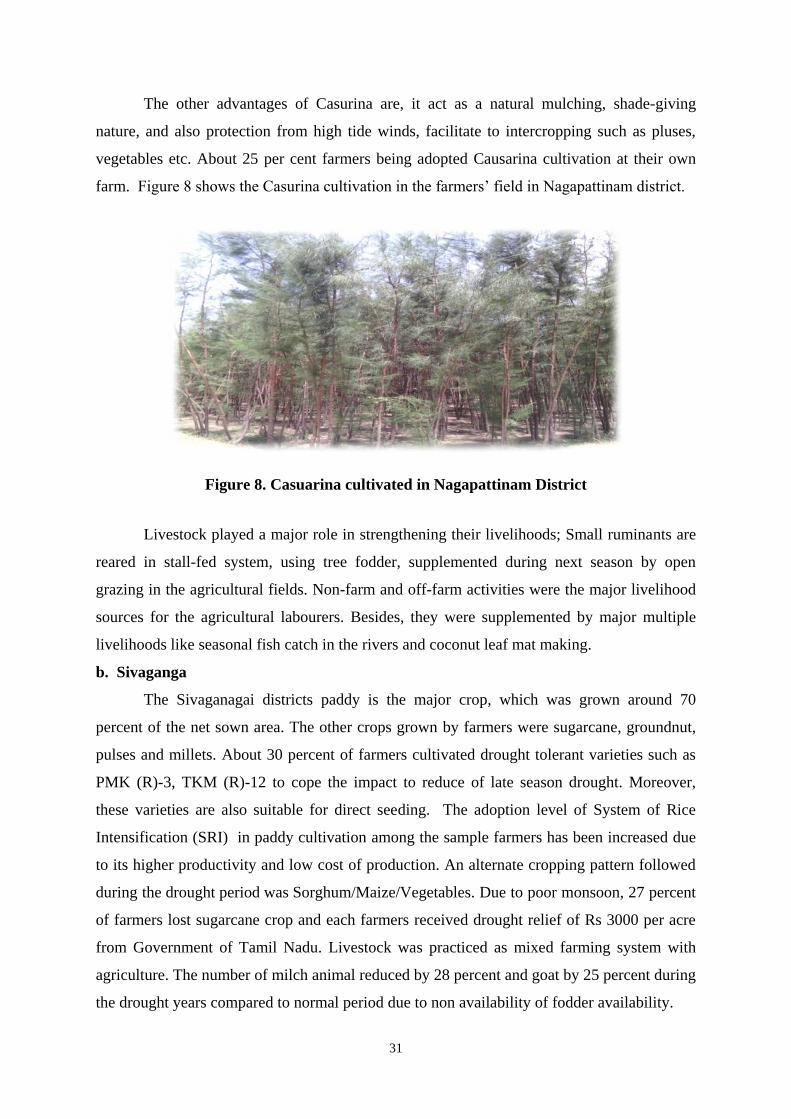
31
The other advantages of Casurina are, it act as a natural mulching, shade-giving
nature, and also protection from high tide winds, facilitate to intercropping such as pluses,
vegetables etc. About 25 per cent farmers being adopted Causarina cultivation at their own
farm. Figure 8 shows the Casurina cultivation in the farmers‟ field in Nagapattinam district.
Figure 8. Casuarina cultivated in Nagapattinam District
Livestock played a major role in strengthening their livelihoods; Small ruminants are
reared in stall-fed system, using tree fodder, supplemented during next season by open
grazing in the agricultural fields. Non-farm and off-farm activities were the major livelihood
sources for the agricultural labourers. Besides, they were supplemented by major multiple
livelihoods like seasonal fish catch in the rivers and coconut leaf mat making.
b. Sivaganga
The Sivaganagai districts paddy is the major crop, which was grown around 70
percent of the net sown area. The other crops grown by farmers were sugarcane, groundnut,
pulses and millets. About 30 percent of farmers cultivated drought tolerant varieties such as
PMK (R)-3, TKM (R)-12 to cope the impact to reduce of late season drought. Moreover,
these varieties are also suitable for direct seeding. The adoption level of System of Rice
Intensification (SRI) in paddy cultivation among the sample farmers has been increased due
to its higher productivity and low cost of production. An alternate cropping pattern followed
during the drought period was Sorghum/Maize/Vegetables. Due to poor monsoon, 27 percent
of farmers lost sugarcane crop and each farmers received drought relief of Rs 3000 per acre
from Government of Tamil Nadu. Livestock was practiced as mixed farming system with
agriculture. The number of milch animal reduced by 28 percent and goat by 25 percent during
the drought years compared to normal period due to non availability of fodder availability.
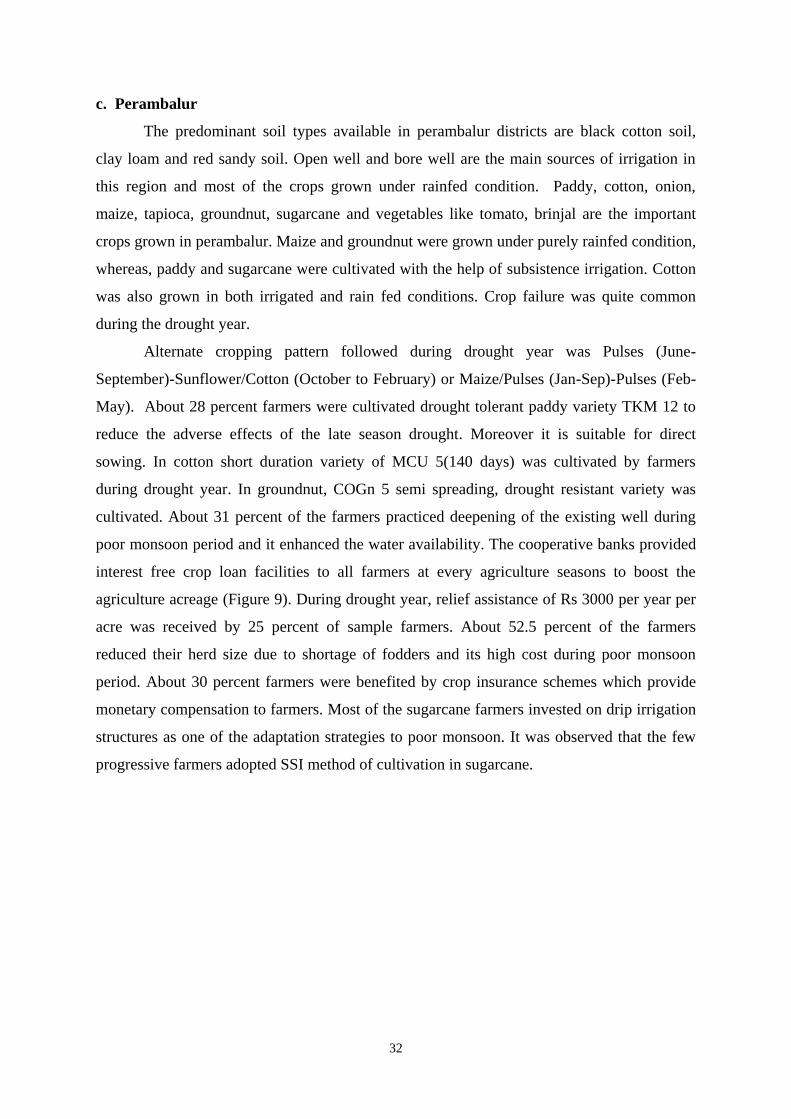
32
c. Perambalur
The predominant soil types available in perambalur districts are black cotton soil,
clay loam and red sandy soil. Open well and bore well are the main sources of irrigation in
this region and most of the crops grown under rainfed condition. Paddy, cotton, onion,
maize, tapioca, groundnut, sugarcane and vegetables like tomato, brinjal are the important
crops grown in perambalur. Maize and groundnut were grown under purely rainfed condition,
whereas, paddy and sugarcane were cultivated with the help of subsistence irrigation. Cotton
was also grown in both irrigated and rain fed conditions. Crop failure was quite common
during the drought year.
Alternate cropping pattern followed during drought year was Pulses (June-
September)-Sunflower/Cotton (October to February) or Maize/Pulses (Jan-Sep)-Pulses (Feb-
May). About 28 percent farmers were cultivated drought tolerant paddy variety TKM 12 to
reduce the adverse effects of the late season drought. Moreover it is suitable for direct
sowing. In cotton short duration variety of MCU 5(140 days) was cultivated by farmers
during drought year. In groundnut, COGn 5 semi spreading, drought resistant variety was
cultivated. About 31 percent of the farmers practiced deepening of the existing well during
poor monsoon period and it enhanced the water availability. The cooperative banks provided
interest free crop loan facilities to all farmers at every agriculture seasons to boost the
agriculture acreage (Figure 9). During drought year, relief assistance of Rs 3000 per year per
acre was received by 25 percent of sample farmers. About 52.5 percent of the farmers
reduced their herd size due to shortage of fodders and its high cost during poor monsoon
period. About 30 percent farmers were benefited by crop insurance schemes which provide
monetary compensation to farmers. Most of the sugarcane farmers invested on drip irrigation
structures as one of the adaptation strategies to poor monsoon. It was observed that the few
progressive farmers adopted SSI method of cultivation in sugarcane.
33
Figure 9. Loan receipt issued to farmers by cooperative societies
d. Coimbatore and Tiruppur
In Coimbatore and Tiruppur districts, more than 60 percent of the farmers belong to
small and marginal category and important food crops are cereals, millets, pulses and coconut
were grown by the farmers. Agribusiness activities like rice hulling and coconut oil
extraction are the major allied activities in Tiruppur districts. Depending upon the rainfall and
assured irrigation the exciting cropping pattern was Maize/Sunflower/sorghum/Horse gram.
Coconut trees are also grown in farms in and around Kangayam.
However, Livestock plays an important role in Tiruppur about 32 percent of the
farmers possessed livestock such as cow, goat, sheep and poultry. Pure crop of fodder
sorghum/ horse gram was practiced during poor monsoon period to meet the demand of
fodder availabilty. About 42.7 per cent of the sample farmers were engaged in MGNREGA
and building works and other off farm activities.
The nutshell of the farm management or coping mechanisms to mitigate the impacts
of poor monsoon are presented in the Table 14.
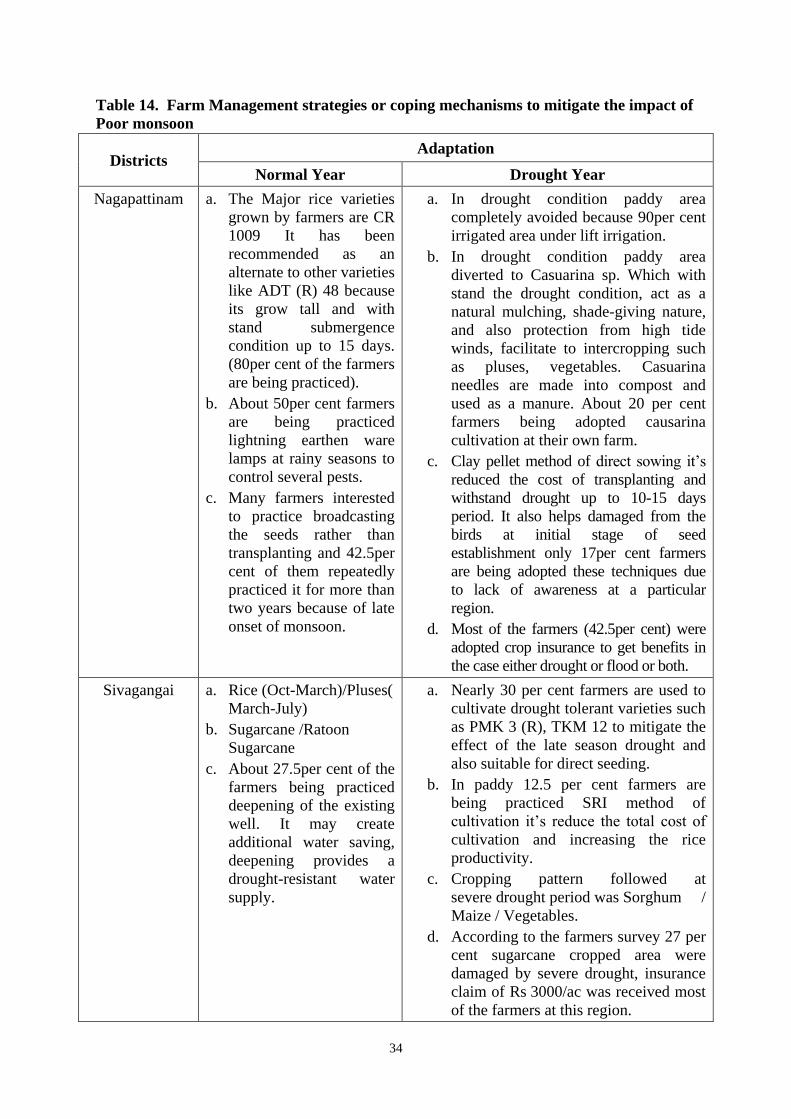
34
Table 14. Farm Management strategies or coping mechanisms to mitigate the impact of
Poor monsoon
Districts Adaptation
Normal Year Drought Year
Nagapattinam a. The Major rice varieties
grown by farmers are CR
1009 It has been
recommended as an
alternate to other varieties
like ADT (R) 48 because
its grow tall and with
stand submergence
condition up to 15 days.
(80per cent of the farmers
are being practiced).
b. About 50per cent farmers
are being practiced
lightning earthen ware
lamps at rainy seasons to
control several pests.
c. Many farmers interested
to practice broadcasting
the seeds rather than
transplanting and 42.5per
cent of them repeatedly
practiced it for more than
two years because of late
onset of monsoon.
a. In drought condition paddy area
completely avoided because 90per cent
irrigated area under lift irrigation.
b. In drought condition paddy area
diverted to Casuarina sp. Which with
stand the drought condition, act as a
natural mulching, shade-giving nature,
and also protection from high tide
winds, facilitate to intercropping such
as pluses, vegetables. Casuarina
needles are made into compost and
used as a manure. About 20 per cent
farmers being adopted causarina
cultivation at their own farm.
c. Clay pellet method of direct sowing it‟s
reduced the cost of transplanting and
withstand drought up to 10-15 days
period. It also helps damaged from the
birds at initial stage of seed
establishment only 17per cent farmers
are being adopted these techniques due
to lack of awareness at a particular
region.
d. Most of the farmers (42.5per cent) were
adopted crop insurance to get benefits in
the case either drought or flood or both.
Sivagangai a. Rice (Oct-March)/Pluses(
March-July)
b. Sugarcane /Ratoon
Sugarcane
c. About 27.5per cent of the
farmers being practiced
deepening of the existing
well. It may create
additional water saving,
deepening provides a
drought-resistant water
supply.
a. Nearly 30 per cent farmers are used to
cultivate drought tolerant varieties such
as PMK 3 (R), TKM 12 to mitigate the
effect of the late season drought and
also suitable for direct seeding.
b. In paddy 12.5 per cent farmers are
being practiced SRI method of
cultivation it‟s reduce the total cost of
cultivation and increasing the rice
productivity.
c. Cropping pattern followed at
severe drought period was Sorghum /
Maize / Vegetables.
d. According to the farmers survey 27 per
cent sugarcane cropped area were
damaged by severe drought, insurance
claim of Rs 3000/ac was received most
of the farmers at this region.
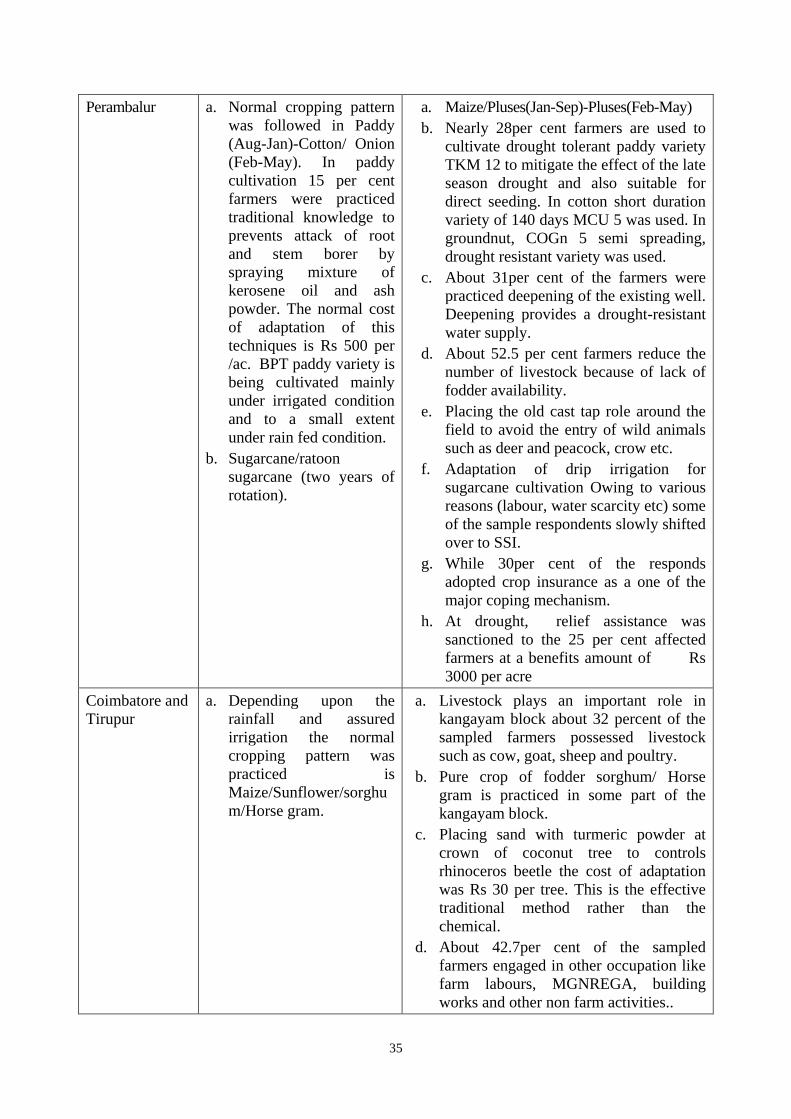
35
Perambalur a. Normal cropping pattern
was followed in Paddy
(Aug-Jan)-Cotton/ Onion
(Feb-May). In paddy
cultivation 15 per cent
farmers were practiced
traditional knowledge to
prevents attack of root
and stem borer by
spraying mixture of
kerosene oil and ash
powder. The normal cost
of adaptation of this
techniques is Rs 500 per
/ac. BPT paddy variety is
being cultivated mainly
under irrigated condition
and to a small extent
under rain fed condition.
b. Sugarcane/ratoon
sugarcane (two years of
rotation).
a. Maize/Pluses(Jan-Sep)-Pluses(Feb-May)
b. Nearly 28per cent farmers are used to
cultivate drought tolerant paddy variety
TKM 12 to mitigate the effect of the late
season drought and also suitable for
direct seeding. In cotton short duration
variety of 140 days MCU 5 was used. In
groundnut, COGn 5 semi spreading,
drought resistant variety was used.
c. About 31per cent of the farmers were
practiced deepening of the existing well.
Deepening provides a drought-resistant
water supply.
d. About 52.5 per cent farmers reduce the
number of livestock because of lack of
fodder availability.
e. Placing the old cast tap role around the
field to avoid the entry of wild animals
such as deer and peacock, crow etc.
f. Adaptation of drip irrigation for
sugarcane cultivation Owing to various
reasons (labour, water scarcity etc) some
of the sample respondents slowly shifted
over to SSI.
g. While 30per cent of the responds
adopted crop insurance as a one of the
major coping mechanism.
h. At drought, relief assistance was
sanctioned to the 25 per cent affected
farmers at a benefits amount of Rs
3000 per acre
Coimbatore and
Tirupur
a. Depending upon the
rainfall and assured
irrigation the normal
cropping pattern was
practiced is
Maize/Sunflower/sorghu
m/Horse gram.
a. Livestock plays an important role in
kangayam block about 32 percent of the
sampled farmers possessed livestock
such as cow, goat, sheep and poultry.
b. Pure crop of fodder sorghum/ Horse
gram is practiced in some part of the
kangayam block.
c. Placing sand with turmeric powder at
crown of coconut tree to controls
rhinoceros beetle the cost of adaptation
was Rs 30 per tree. This is the effective
traditional method rather than the
chemical.
d. About 42.7per cent of the sampled
farmers engaged in other occupation like
farm labours, MGNREGA, building
works and other non farm activities..
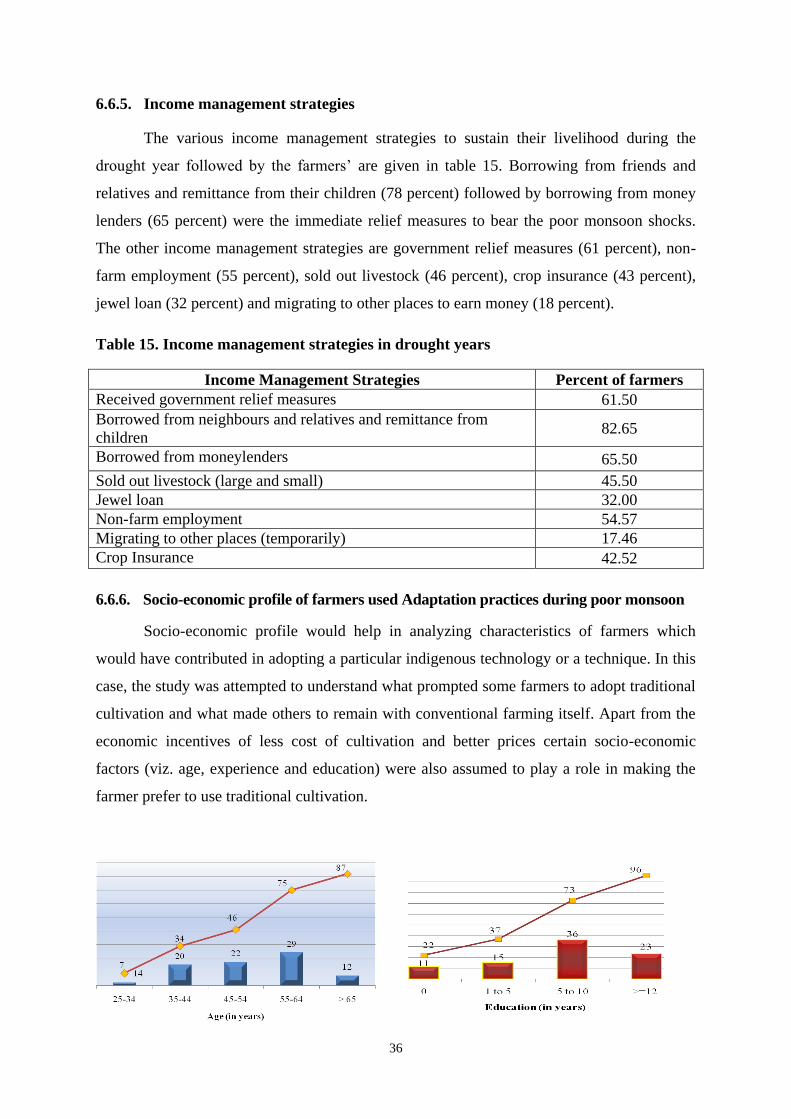
36
6.6.5. Income management strategies
The various income management strategies to sustain their livelihood during the
drought year followed by the farmers‟ are given in table 15. Borrowing from friends and
relatives and remittance from their children (78 percent) followed by borrowing from money
lenders (65 percent) were the immediate relief measures to bear the poor monsoon shocks.
The other income management strategies are government relief measures (61 percent), non-
farm employment (55 percent), sold out livestock (46 percent), crop insurance (43 percent),
jewel loan (32 percent) and migrating to other places to earn money (18 percent).
Table 15. Income management strategies in drought years
Income Management Strategies Percent of farmers
Received government relief measures 61.50
Borrowed from neighbours and relatives and remittance from
children 82.65
Borrowed from moneylenders 65.50
Sold out livestock (large and small) 45.50
Jewel loan 32.00
Non-farm employment 54.57
Migrating to other places (temporarily) 17.46
Crop Insurance 42.52
6.6.6. Socio-economic profile of farmers used Adaptation practices during poor monsoon
Socio-economic profile would help in analyzing characteristics of farmers which
would have contributed in adopting a particular indigenous technology or a technique. In this
case, the study was attempted to understand what prompted some farmers to adopt traditional
cultivation and what made others to remain with conventional farming itself. Apart from the
economic incentives of less cost of cultivation and better prices certain socio-economic
factors (viz. age, experience and education) were also assumed to play a role in making the
farmer prefer to use traditional cultivation.
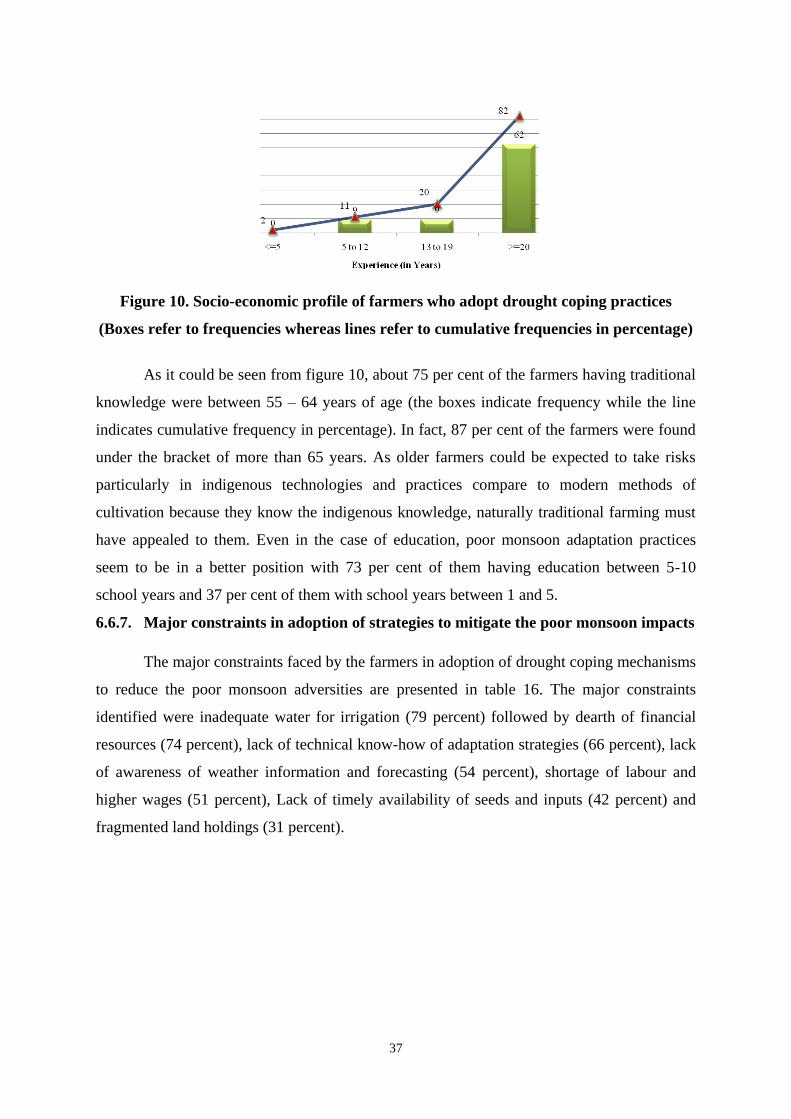
37
Figure 10. Socio-economic profile of farmers who adopt drought coping practices
(Boxes refer to frequencies whereas lines refer to cumulative frequencies in percentage)
As it could be seen from figure 10, about 75 per cent of the farmers having traditional
knowledge were between 55 – 64 years of age (the boxes indicate frequency while the line
indicates cumulative frequency in percentage). In fact, 87 per cent of the farmers were found
under the bracket of more than 65 years. As older farmers could be expected to take risks
particularly in indigenous technologies and practices compare to modern methods of
cultivation because they know the indigenous knowledge, naturally traditional farming must
have appealed to them. Even in the case of education, poor monsoon adaptation practices
seem to be in a better position with 73 per cent of them having education between 5-10
school years and 37 per cent of them with school years between 1 and 5.
6.6.7. Major constraints in adoption of strategies to mitigate the poor monsoon impacts
The major constraints faced by the farmers in adoption of drought coping mechanisms
to reduce the poor monsoon adversities are presented in table 16. The major constraints
identified were inadequate water for irrigation (79 percent) followed by dearth of financial
resources (74 percent), lack of technical know-how of adaptation strategies (66 percent), lack
of awareness of weather information and forecasting (54 percent), shortage of labour and
higher wages (51 percent), Lack of timely availability of seeds and inputs (42 percent) and
fragmented land holdings (31 percent).
38
Table 16: Major constraints in drought adaptation practices
S.No. Constraints Percent of farmers
1 Dearth of financial resources 74
2 Inadequate water for irrigation 79
3 Lack of knowledge on selecting crops
4 Lack of technical know-how of adaptation strategies 66
5 Lack of awareness of weather information and forecasting 54
6 Shortage of labour and higher wages 51
7 Fragmented land holdings 30
8 Lack of timely availability of seeds and inputs 42
6.6.8. Major constraints in adoption of crop insurance schemes
The results presented in table 17 indicated major constraints in adopting crop
insurance scheme by the sample households. The major constraints faced by farmers in
adopting crop insurance scheme were high premium rate (63.75 percent) followed by delayed
settlement of insurance claims (58.13 percent), inadequate less awareness of Insurance
product (49 percent), wide variation between the yields of actual farm and crop cutting
experiment (45 percent) and complex procedure / provisions of the scheme (37.50 percent).
Table 17: Major constraints faced by farmers in crop insurance
S.No. Constraints Percent of farmers
1 Less awareness of Insurance product 48.75
2 Complex procedure / Provisions of the scheme 37.50
3 High premium rate 63.75
4 Wide variation between the yields of actual farm and
crop cutting experiment 45.00
5 Delayed settlement of insurance claims 58.13
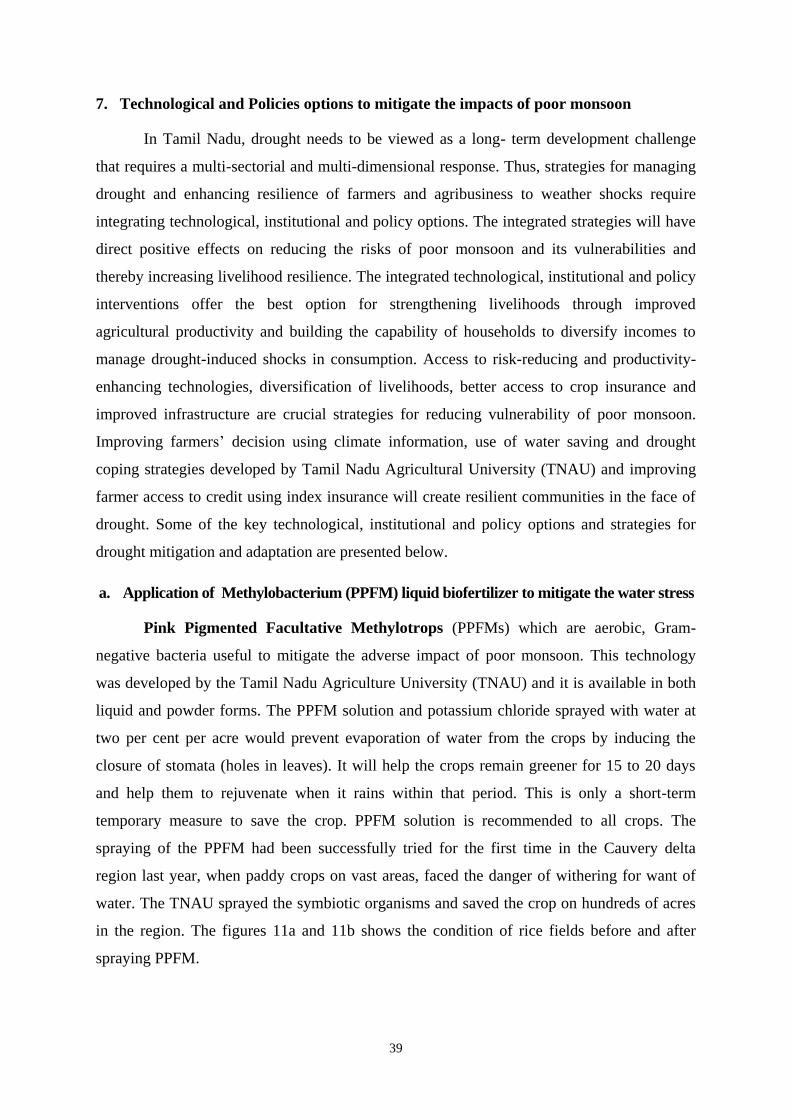
39
7. Technological and Policies options to mitigate the impacts of poor monsoon
In Tamil Nadu, drought needs to be viewed as a long- term development challenge
that requires a multi-sectorial and multi-dimensional response. Thus, strategies for managing
drought and enhancing resilience of farmers and agribusiness to weather shocks require
integrating technological, institutional and policy options. The integrated strategies will have
direct positive effects on reducing the risks of poor monsoon and its vulnerabilities and
thereby increasing livelihood resilience. The integrated technological, institutional and policy
interventions offer the best option for strengthening livelihoods through improved
agricultural productivity and building the capability of households to diversify incomes to
manage drought-induced shocks in consumption. Access to risk-reducing and productivity-
enhancing technologies, diversification of livelihoods, better access to crop insurance and
improved infrastructure are crucial strategies for reducing vulnerability of poor monsoon.
Improving farmers‟ decision using climate information, use of water saving and drought
coping strategies developed by Tamil Nadu Agricultural University (TNAU) and improving
farmer access to credit using index insurance will create resilient communities in the face of
drought. Some of the key technological, institutional and policy options and strategies for
drought mitigation and adaptation are presented below.
a. Application of Methylobacterium (PPFM) liquid biofertilizer to mitigate the water stress
Pink Pigmented Facultative Methylotrops (PPFMs) which are aerobic, Gram-
negative bacteria useful to mitigate the adverse impact of poor monsoon. This technology
was developed by the Tamil Nadu Agriculture University (TNAU) and it is available in both
liquid and powder forms. The PPFM solution and potassium chloride sprayed with water at
two per cent per acre would prevent evaporation of water from the crops by inducing the
closure of stomata (holes in leaves). It will help the crops remain greener for 15 to 20 days
and help them to rejuvenate when it rains within that period. This is only a short-term
temporary measure to save the crop. PPFM solution is recommended to all crops. The
spraying of the PPFM had been successfully tried for the first time in the Cauvery delta
region last year, when paddy crops on vast areas, faced the danger of withering for want of
water. The TNAU sprayed the symbiotic organisms and saved the crop on hundreds of acres
in the region. The figures 11a and 11b shows the condition of rice fields before and after
spraying PPFM.
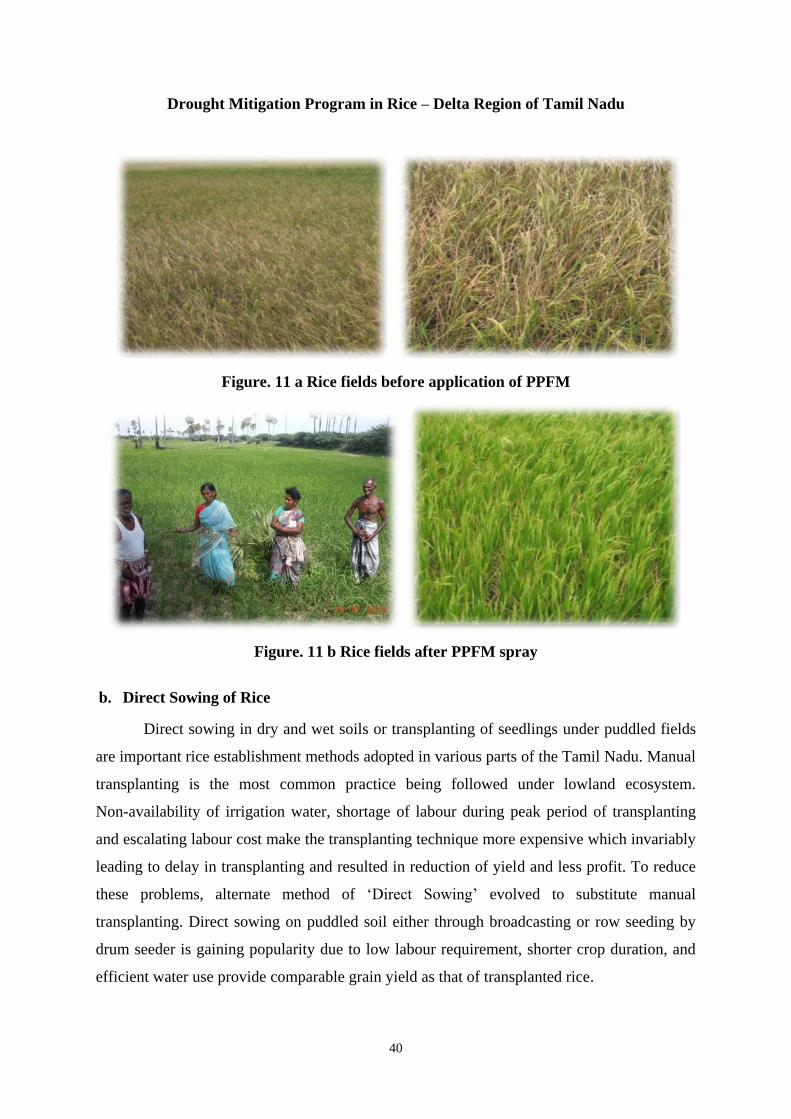
40
Drought Mitigation Program in Rice – Delta Region of Tamil Nadu
Figure. 11 a Rice fields before application of PPFM
Figure. 11 b Rice fields after PPFM spray
b. Direct Sowing of Rice
Direct sowing in dry and wet soils or transplanting of seedlings under puddled fields
are important rice establishment methods adopted in various parts of the Tamil Nadu. Manual
transplanting is the most common practice being followed under lowland ecosystem.
Non-availability of irrigation water, shortage of labour during peak period of transplanting
and escalating labour cost make the transplanting technique more expensive which invariably
leading to delay in transplanting and resulted in reduction of yield and less profit. To reduce
these problems, alternate method of „Direct Sowing‟ evolved to substitute manual
transplanting. Direct sowing on puddled soil either through broadcasting or row seeding by
drum seeder is gaining popularity due to low labour requirement, shorter crop duration, and
efficient water use provide comparable grain yield as that of transplanted rice.
41
This plan was adopted for the first time by the farmers in the Tanjavur region.
Here the strategy was to raise a crop during rains and then, as the reservoir level in Mettur
dam improved, release the water to supplement rainfall. However, this requires constant
monitoring. The response from farmers was very good. It was said that the entire paddy
(Samba variety) would have been lost but for the “direct sowing” plan. Because of this plan,
about 49 per cent of the area was brought under paddy and the production level was
maintained despite drought in the region. Thus it is apparent that the interactive approach
between the public and the administration in managing droughts in Tamil Nadu is quite
commendable.
c. System of Rice Intensification
System of Rice Intensification (SRI) is one of the successful strategies to mitigate the
adverse impact of poor monsoon. SRI is a revived method of transplanted rice cultivation by
exploiting the genetic potential of rice provides a favorable growing environment to increase
the productivity and economic returns. Besides, it enhances soil health with reduction in input
use such as seeds, water, labour, etc. Recognizing smart water management and planting
practices, farmers in Tamil Nadu have increased rice yields by 30–80 percent and reduced
water use by 30 per cent. SRI addresses not only food security but also water scarcity, which
climate change further aggravates.
Machine transplantation: Scarcity of labour comes in the way of SRI practices that need
timely attention. Machine transplanting can be introduced in all regions using wider spacing,
young seedlings and one to two seedlings. The success of machine transplanting in locations
like the Krishna and Godavari basins needs to be replicated under SRI. Further, given the
labour cost and difficulty in operating manual cono-weeders, power cono-weeders could be
considered. Making user-friendly cono-weeders available at a lower cost will persuade
farmers to use them in their fields.
Capacity-building programmes: Imparting training to farmers on the SRI components that
are important to their region is essential. This will make them more confident in carrying out
follow-up tasks.
d. Sustainable Sugarcane Initiative
The Sustainable Sugarcane Initiative involves application of specific techniques
beginning from the seed stage through the duration of cultivation up to harvest. Thus includes
use of drip irrigation, application of precise levels of nutrients and other agronomic practices
including wider spacing between sugarcane plants to enable healthier growth. The objective
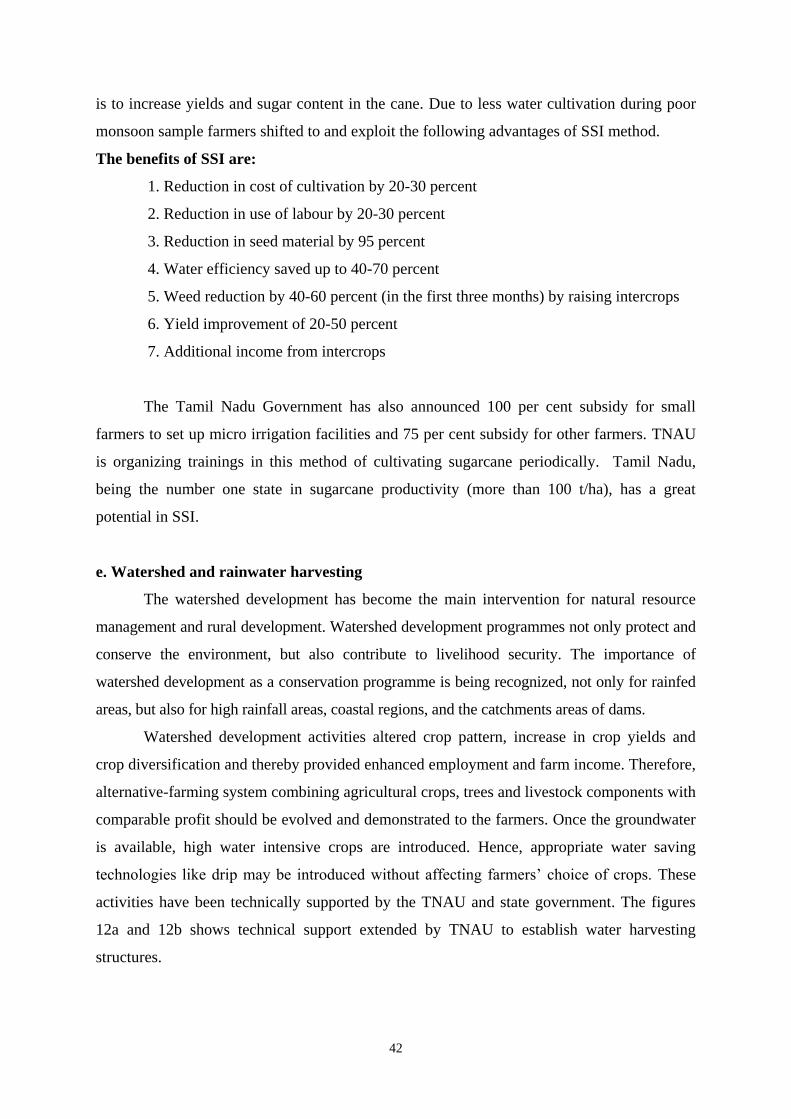
42
is to increase yields and sugar content in the cane. Due to less water cultivation during poor
monsoon sample farmers shifted to and exploit the following advantages of SSI method.
The benefits of SSI are:
1. Reduction in cost of cultivation by 20-30 percent
2. Reduction in use of labour by 20-30 percent
3. Reduction in seed material by 95 percent
4. Water efficiency saved up to 40-70 percent
5. Weed reduction by 40-60 percent (in the first three months) by raising intercrops
6. Yield improvement of 20-50 percent
7. Additional income from intercrops
The Tamil Nadu Government has also announced 100 per cent subsidy for small
farmers to set up micro irrigation facilities and 75 per cent subsidy for other farmers. TNAU
is organizing trainings in this method of cultivating sugarcane periodically. Tamil Nadu,
being the number one state in sugarcane productivity (more than 100 t/ha), has a great
potential in SSI.
e. Watershed and rainwater harvesting
The watershed development has become the main intervention for natural resource
management and rural development. Watershed development programmes not only protect and
conserve the environment, but also contribute to livelihood security. The importance of
watershed development as a conservation programme is being recognized, not only for rainfed
areas, but also for high rainfall areas, coastal regions, and the catchments areas of dams.
Watershed development activities altered crop pattern, increase in crop yields and
crop diversification and thereby provided enhanced employment and farm income. Therefore,
alternative-farming system combining agricultural crops, trees and livestock components with
comparable profit should be evolved and demonstrated to the farmers. Once the groundwater
is available, high water intensive crops are introduced. Hence, appropriate water saving
technologies like drip may be introduced without affecting farmers‟ choice of crops. These
activities have been technically supported by the TNAU and state government. The figures
12a and 12b shows technical support extended by TNAU to establish water harvesting
structures.
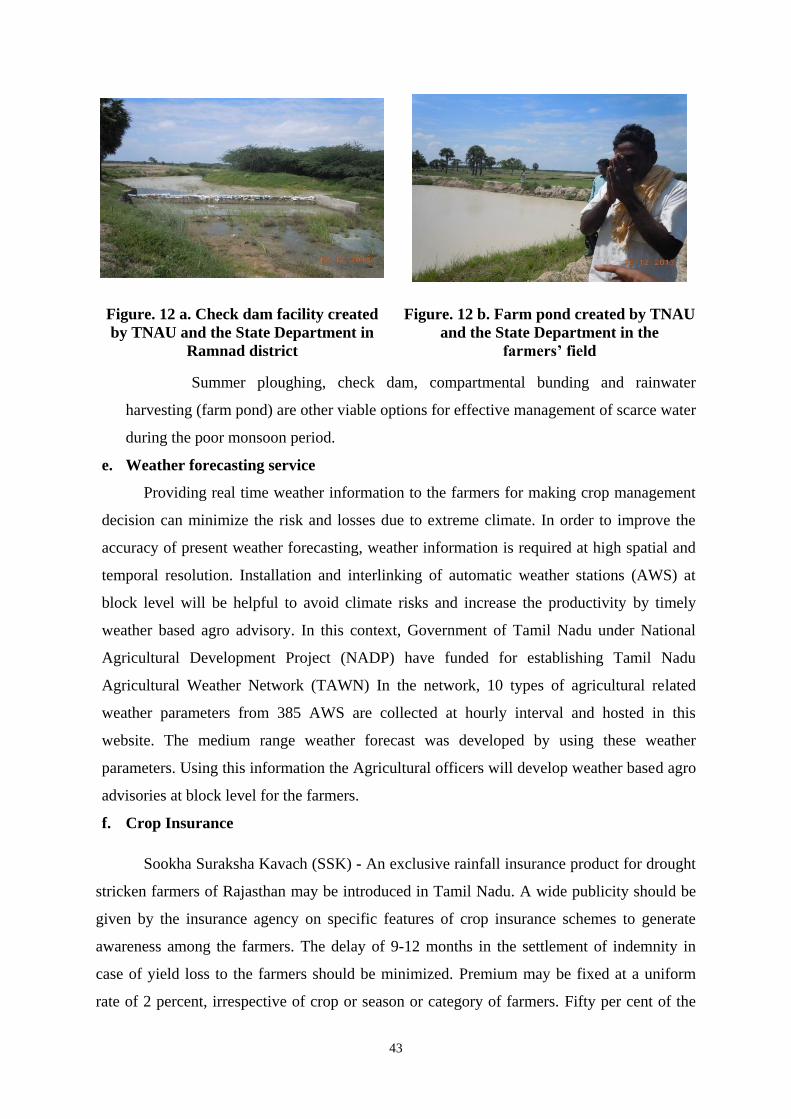
43
Figure. 12 a. Check dam facility created
by TNAU and the State Department in
Ramnad district
Figure. 12 b. Farm pond created by TNAU
and the State Department in the
farmers’ field
Summer ploughing, check dam, compartmental bunding and rainwater
harvesting (farm pond) are other viable options for effective management of scarce water
during the poor monsoon period.
e. Weather forecasting service
Providing real time weather information to the farmers for making crop management
decision can minimize the risk and losses due to extreme climate. In order to improve the
accuracy of present weather forecasting, weather information is required at high spatial and
temporal resolution. Installation and interlinking of automatic weather stations (AWS) at
block level will be helpful to avoid climate risks and increase the productivity by timely
weather based agro advisory. In this context, Government of Tamil Nadu under National
Agricultural Development Project (NADP) have funded for establishing Tamil Nadu
Agricultural Weather Network (TAWN) In the network, 10 types of agricultural related
weather parameters from 385 AWS are collected at hourly interval and hosted in this
website. The medium range weather forecast was developed by using these weather
parameters. Using this information the Agricultural officers will develop weather based agro
advisories at block level for the farmers.
f. Crop Insurance
Sookha Suraksha Kavach (SSK) - An exclusive rainfall insurance product for drought
stricken farmers of Rajasthan may be introduced in Tamil Nadu. A wide publicity should be
given by the insurance agency on specific features of crop insurance schemes to generate
awareness among the farmers. The delay of 9-12 months in the settlement of indemnity in
case of yield loss to the farmers should be minimized. Premium may be fixed at a uniform
rate of 2 percent, irrespective of crop or season or category of farmers. Fifty per cent of the
44
premium paid by the farmers may be returned to them, if they did not realize any indemnity
during the past three years.
Index insurance is a relatively new weather risk management tool. While traditional
insurance insures against crop failure, index insurance insures for a specific event or risk,
such as rainfall deficits (widely followed in African countries). The index insurance can be
more cost effective since there is no need for in-field assessment of damage because payouts
are triggered by weather data directly. Index insurance addresses two problems associated
with traditional crop insurance: moral hazard and adverse selection.
45
8. Conclusions
The reality of poor monsoon manifested in the forms of frequent droughts, uneven
distribution of rains etc., has necessitated the urgent need to device appropriate adaptation
strategies to sustain rural livelihood. Thus study which examined impacts of poor monsoon in
Tamil Nadu, found that about 76 percent of the sample farmers experienced of delayed onset
of monsoon, erratic rainfall pattern etc. The trend and coefficient of variation analyses of the
rainfall also validated these perceptions. Farmers perceived that poor monsoon has affected
their farming through frequent crop failure, declining crop yield, reducing water level in
wells and tanks and increasing heat waves and moisture stress.
The results from the econometric model revealed that the trend (i.e. technology
variable) had a positive impact on both mean yield and variance of yield of rice and sorghum.
The non-linear climate sensitivities were consistent with expectations i.e. positive impact of
rainfall and temperature up to certain threshold levels and turned to be detrimental inputs
beyond the threshold level. The various climate models projected that the temperature and
rainfall are expected to increase in future. Hence this finding is warranted to take up
necessary adaptation strategies and research investments.
Even though farmers are constrained with technical know-how of season specificity
of crops, dearth of funds, lack of sufficient water, labour shortage, unavailability of critical
inputs like seeds, however, they strive to maintain resilience in agriculture by adopting
various indigenous adaptation strategies like manipulating the sowing date, reduction in
fertilizer application, changing cropping pattern, using drought tolerant varieties and mixed
farming. Few farmers have also hedged their production risk with crop insurance. The
adoption level socio-economic characteristics of the farmers revealed that the adoption level
of drought coping strategies was high among farmers who have more farming experience.
Still, borrowing, sold out livestock and skip farming were the other major strategies followed
by the farmers in the drought year.
46
Hence, the government should ensure timely availability of inputs like seeds and
fertilizers in sufficient quantities. Investment should be made in constructing water harvesting
structures like check dams, farm ponds, rainwater harvesting structures and wells etc. in such
dry land regions to conserve the scarce moisture. Furthermore, government policies need to
support research and development of appropriate technologies like drought tolerant varieties,
water saving and high yielding technologies are developed by Tamil Nadu Agricultural
University, machineries and equipments to suit small farm holdings, efficient irrigation and
cultivation practices, climate forecasting and promote crop insurance in a big way to help
farmers to cope with adverse impacts of poor monsoon.
47
REFERENCES
Agrawal, P. K. (2003). Impact of climate change on Indian agriculture. Jounal of plant
Biology, 30: 189 -198.
Barnwal, P. and K. Kotani (2010). „Impact of variation in climate factors on crop yield: a
case of rice crop in Andhra Pradesh, India‟, Working Paper, IUJ Research Institute,
International University of Japan, Minami-Uonuma.
Chen, C.C., McCarl, B. A., Schimmelpfenning, D. E., (2004). Yield Variability as influenced
by climate: a statistical investigation, Climate change, 66:239-261.
Chi-Chung Chen and Ching-Cheng Chang., (2004). Climate Change and Crop Yield
Distribution: Some New Evidence from Panel Data Models IEAS Working Paper No. 04
- A 001
Gadgil, S., Abrol, Y. P. and Rao, Seshagiri, P.R.:(1999). On growth and fluctuation of Indian
food grain production, Current Science, 76’ (4) : 548-556.
Garret, H.E. (1966). Statistics in psychology and education. International Book Bureau,
Hyderabad, pp.328-332.
Holst.R, Yu.X., and Grun,C., (2010). Climate change, risk and grain production in China,
Paper presented in Agricultural and Applied Economics Association, Annual Meeting,
July 25-27, 2010, Denver, Colorado
Isik, M. and S. Devadoss(2006). An analysis of the impact of climate change on crop yields
and variability, Applied Economics; 38 : 835-844.
Janakarajan, S. (2003). From Confrontation to Collaboration: Multi-stakeholders Dialogue as
a means for Breaking the Cauvery Deadlock. Synthesis of the Inter-State Farmers’
Dialogue Meeting held in Chennai during 4th
and 5th
April 2003”. Mimeo.
Janakarajan, S. (2007). Challenges and prospects for Adaptation and Disaster Risk Reduction
in Coastal Tamil Nadu, in Moench, M. and A. Dixit (Eds.) Working with the winds of
Change, Chapter 9,235-70.
Just, R.E. and Pope, R.D. (1978) Stochastic specification of production functions and
economic implications, Journal of Econometrics, 7 : 67-86.
Menon, Parvathi (2007). Sharing a River Frontline India‟s National Magazine V 24(3) : Feb
10-23.
48
Nagarajan, R.(2003). Drought: Assessment, Monitoring, Management and Resource
Conservation, Capital Publishing Company, New Delhi, p. 312.
Nerilie J. Abram, Michael K. Gagan, Zhengyu Liu, Wahyoe S. Hantoro, Malcolm T.
McCulloch and Bambang W. Suwargadi . (2007). Seasonal characteristics of the Indian
Ocean Dipole during the Holocene epoch. Nature; 445 : 299-302.
Palanisami, K., Paramasivam, P., Ranganathan, C.R., Aggarwal, P.K., and Senthilnathan, S.
(2008). Quantifying Vulnerability and Impact of Climate Change on Production of Major
Crops in Tamil Nadu, India, Hydro Change 2008, Kyoto,Japan.
Ramasamy, C.,K.N.Selvaraj, and R.C. Babu. (2003). Social and Economic Implications of
Drought and Farmers‟ Coping Strategies in Rainfed Rice Ecosystem of Tamil Nadu,
India. Centre for Agricultural and Rural Development Studies, Tamil Nadu Agricultural
University, Coimbatore. CARDS Series 13.
Ranganathan,C. R.(2009). Vulnerability and resilience of social-ecological systems, Working
Paper on Social-Ecological Resilience Series No. 2009-008, Research Institute for
Humanity and Nature, Kyoto, Japan.
Saha,A., Havenner, A. and Talpaz, H. (1997). Stochastic production function estimation:
small sample properties of ML versus FGLS, Applied Economics; 29 : 459-69.
Samra, J. S.(2004). Review and analysis of drought monitoring, declaration and management
in India. Working Paper 84. International Water Management Institute, Colombo, Sri
Lanka.
Selvaraju, R.(2003).Impact of El Nino-Southern Oscillation on Indian food grain production,
Int. J. Climatology, 23 : 187-206.
----- * -----