Embed Size (px)
Citation preview
StrategyQuant User's Guide
Version 3.8.0 Last updated: 15.11.2014
StrategyQuant User's Guide
2
Support
If you'll have trouble understanding anything, you need help, or you simply have some question to ask (related to the system), remember your purchase includes also a support.
We are here for you, you can contact us using our forum:
www.StrategyQuant.com/forum
Articles section on our website provide additional source of knowledge
www.StrategyQuant.com/articles
Copyright
All rights reserved.
StrategyQuant software, bonus strategies and content of this Manual is copyrighted. You can use them only with valid license.
No part of this publication may be reproduced, stored in a retrieval system, or transmitted in any form or by any means - including electronic, mechanical, photocopy, recording, scanning or otherwise - without the prior written permission of the author.
© 2012-2014 Mark Fric, SonarBytes Ltd
StrategyQuant User's Guide
3
Risk Disclosure
Risk Disclosure Statement Trading any financial market involves risk. This Manual is neither a solicitation nor an offer to Buy/Sell any financial product. The contents of this Manual are for general informational purposes only. Although every attempt has been made to ensure accuracy, the author does not give any expressed or implied warranty as to its accuracy. The author does not accept any liability for error or omission. All examples are provided for illustrative purposes only and should not be construed as investment advice. No representation is being made that any account, or trader will, or is likely to achieve profits or loses similar to those discussed in this Manual. Past performance cannot be relied upon as being indicative of future performance.
The information provided in this Manual is not intended for distribution to, or use by any person or entity in any jurisdiction or country where such distribution or use would be contrary to law or regulation or which would subject the author to any registration requirement within such jurisdiction or country.
Hypothetical performance results have many inherent limitations, some of which are mentioned below. No representation is being made that any account will or is likely to achieve profits or losses similar to those shown. In fact, there are frequently sharp differences between hypothetical performance results and actual results subsequently achieved by any particular trading system.
One of the limitations of hypothetical performance results is that they are generally prepared with the benefit of hindsight. In addition, hypothetical trading does not involve financial risk and no hypothetical trading record can completely account for the impact of financial risk in actual trading.
For example the ability to withstand losses or to adhere to a particular trading program in spite of the trading losses is material points, which can also adversely affect trading results. There are numerous other factors related to the market in general or to the implementation of any specific trading program, which cannot be fully accounted for in the preparation of hypothetical performance results. All of which can adversely affect actual trading results.
U.S. Government Required Disclaimer - Commodity Futures Trading Commission Futures, Currency and Options trading has large potential rewards, but also large potential risk. You must be aware of the risks and be willing to accept them in order to invest in the futures and options markets. Don't trade with money you can't afford to lose. This is neither a solicitation nor an offer to Buy/Sell futures or options. No representation is being made that any account will or is likely to achieve profits or losses similar to those discussed on this web site. The past performance of any trading system or methodology is not necessarily indicative of future results.
CFTC RULE 4.41 - HYPOTHETICAL OR SIMULATED PERFORMANCE RESULTS HAVE CERTAIN LIMITATIONS. UNLIKE AN ACTUAL PERFORMANCE RECORD, SIMULATED RESULTS DO NOT REPRESENT ACTUAL TRADING. ALSO, SINCE THE TRADES HAVE NOT BEEN EXECUTED, THE RESULTS MAY HAVE UNDER-OR-OVER COMPENSATED FOR THE IMPACT, IF ANY, OF CERTAIN MARKET FACTORS, SUCH AS LACK OF LIQUIDITY. SIMULATED TRADING PROGRAMS IN GENERAL ARE ALSO SUBJECT TO THE FACT THAT THEY ARE DESIGNED WITH THE BENEFIT OF HINDSIGHT. NO REPRESENTATION IS BEING MADE THAT ANY ACCOUNT WILL OR IS LIKELY TO ACHIEVE PROFIT OR LOSSES SIMILAR TO THOSE SHOWN.

StrategyQuant User's Guide
4
Warranty Disclaimer
You agree to use this program at your own risk. StrategyQuant software might fail or not work properly. All software is subject to inadvertent programming errors and bugs embedded in the code comprising that software. Any of these errors and bugs can cause the software in which they are located to fail or not work properly. The StrategyQuant application and trading strategies generated by the program is subject to this risk. Despite testing, inadvertent errors and bugs may still cause a failure in trading strategy, resulting in a trading errors. YOU HAVE TO BE AVARE THAT AUTOMATIC TRADING STRATEGIES MIGHT FAIL FOR WHATEVER REASON AND THEY COULD RESULT IN THE LOSS OF ALL OF THE MONEY YOU HAVE DEPOSITED IN THE BROKERAGE ACCOUNT YOU USE FOR LIVE TRADING BASED ON THE ALGORITHMS YOU GENERATED BY StrategyQuant. YOU SHOULD DISCUSS WITH AN INVESTMENT PROFESSIONAL THE RISKS OF TRADING IN GENERAL AND ALGORITHMIC TRADING IN PARTICULAR. YOU USE ANY ALGORITHM IN LIVE TRADING AT YOUR OWN RISK AND IT IS YOUR OBLIGATION TO THOROUGHLY AND APPROPRIATELY TEST ANY TRADING ALGORITHM BEFORE YOU PUT IT IN PRODUCTION AND TO CONTINUALLY MONITOR THE OPERATION OF ANY TRADING ALGORITHM IN PRODUCTION TO ENSURE IT IS RUNNING PROPERLY AND IN COMPLIANCE WITH ANY APPLICABLE RULES. DISCLAIMER OF WARRANTY. THE SOFTWARE IS PROVIDED ON AN "AS IS" BASIS, WITHOUT WARRANTY OF ANY KIND, INCLUDING WITHOUT LIMITATION THE WARRANTIES OF MERCHANTABILITY, FITNESS FOR A PARTICULAR PURPOSE AND NON-INFRINGEMENT. THE ENTIRE RISK AS TO THE QUALITY AND PERFORMANCE OF THE SOFTWARE IS BORNE BY YOU. LIMITATION OF LIABILITY. UNDER NO CIRCUMSTANCES AND UNDER NO LEGAL THEORY, TORT, CONTRACT, OR
OTHERWISE, SHALL AUTHOR OR ITS SUPPLIERS OR RESELLERS BE LIABLE TO YOU OR ANY OTHER PERSON FOR
ANY INDIRECT, SPECIAL, INCIDENTAL, OR CONSEQUENTIAL OR PUNITIVE DAMAGES OF ANY CHARACTER
INCLUDING, WITHOUT LIMITATION, DAMAGES FOR LOSS OF GOODWILL, WORK STOPPAGE, COMPUTER
FAILURE OR MALFUNCTION, OR ANY AND ALL OTHER COMMERCIAL DAMAGES OR LOSSES. IN NO EVENT WILL
AUTHOR BE LIABLE FOR ANY DAMAGES IN EXCESS OF AUTHOR'S LIST PRICE FOR A LICENSE TO THE SOFTWARE,
EVEN IF AUTHOR SHALL HAVE BEEN INFORMED OF THE POSSIBILITY OF SUCH DAMAGES, OR FOR ANY CLAIM BY
ANY OTHER PARTY. THIS LIMITATION OF LIABILITY SHALL NOT APPLY TO LIABILITY FOR DEATH OR PERSONAL
INJURY TO THE EXTENT APPLICABLE LAW PROHIBITS SUCH LIMITATION. FURTHERMORE, SOME STATES DO NOT
ALLOW THE EXCLUSION OR LIMITATION OF INCIDENTAL OR CONSEQUENTIAL DAMAGES, SO THIS LIMITATION
AND EXCLUSION MAY NOT APPLY TO YOU.
StrategyQuant User's Guide
5
Software License Agreement
This legal document is an agreement between you, the end user ('User'), and Sonarbytes Ltd ('Author').
AGREEMENT - By installing StrategyQuant ('Software'), copying the Software and/or clicking on the 'I Agree' button during installation, you agree to all of the terms of this software license agreement ('Agreement'). If you do not agree with all of the terms of this agreement, click on the 'I Do Not Agree' button and/or do not install, copy or otherwise use the software.
INTELLECTUAL PROPERTY. The Software and any associated materials are protected by copyright law. The package is a proprietary product of the Author. The Author retains title to and ownership in the copyright of the software program and the associated materials. You acknowledge that the Author owns all rights, title and interest in and to the Software, including without limitation all Intellectual Property Rights. 'Intellectual Property Rights' means any and all rights existing from time to time under patent law, copyright law, trade secret law, trademark law, unfair competition law, and any and all other proprietary rights, and any and all applications, renewals, extensions and restorations thereof, now or hereafter in force and effect worldwide. You agree not to modify, adapt, translate, decompile, reverse engineer, disassemble or otherwise attempt to derive source code from the Software.
REGISTRATION. This program is neither freeware nor public domain. Use requires valid license. Contact us at http://www.geneticbuilder.com/contactus/ for bulk licenses or discounted prices.
GRANT. Author hereby grants you a non-exclusive, non-transferable license to use the Software upon payment of the License Fee until the expiry date of the license (if any). Author makes no guarantee of the frequency, value, applicability or content of future updates or modifications to the Software. The Software will only be made available to you in electronic form for download.
The requirement to pay a license fee does not apply to evaluation copies for which Author does not charge a license fee. Evaluation licenses expire 14 calendar days from the date of this agreement, unless otherwise agreed to in writing by Author. On the date of expiry of the license, User agrees to either purchase the Software at the list price in force at that time or to destroy all copies of the Software in electronic or other form, including any copies on backup tapes or other media.
User's use of the Software shall be limited to use on a single hardware chassis, on a single central processing unit, as applicable, or use on such greater number of chassis or central processing units as User may have paid the required license fee.
You may not: permit other individuals to use the Software except under the terms listed above; translate, reverse engineer, decompile, decrypt, reverse engineer, disassemble (except to the extent applicable laws specifically prohibit such restriction), or create derivative works based on the Software; copy the Software (except for back-up purposes); rent, lease, transfer, assign, sub-license or otherwise transfer rights to the Software; or remove any proprietary notices or labels on the Software.
DISCLAIMER OF WARRANTY. THE SOFTWARE IS PROVIDED ON AN "AS IS" BASIS, WITHOUT WARRANTY OF ANY KIND, INCLUDING WITHOUT LIMITATION THE WARRANTIES OF MERCHANTABILITY, FITNESS FOR A PARTICULAR PURPOSE AND NON-INFRINGEMENT. THE ENTIRE RISK AS TO THE QUALITY AND PERFORMANCE OF THE SOFTWARE IS BORNE BY YOU.
LIMITATION OF LIABILITY. UNDER NO CIRCUMSTANCES AND UNDER NO LEGAL THEORY, TORT, CONTRACT, OR OTHERWISE, SHALL AUTHOR OR ITS SUPPLIERS OR RESELLERS BE LIABLE TO YOU OR ANY OTHER PERSON FOR ANY INDIRECT, SPECIAL, INCIDENTAL, OR CONSEQUENTIAL OR PUNITIVE DAMAGES OF ANY CHARACTER INCLUDING, WITHOUT LIMITATION, DAMAGES FOR LOSS OF GOODWILL, WORK STOPPAGE, COMPUTER FAILURE OR MALFUNCTION, OR ANY AND ALL OTHER COMMERCIAL DAMAGES OR LOSSES. IN NO EVENT WILL AUTHOR BE LIABLE FOR ANY DAMAGES IN EXCESS OF AUTHOR'S LIST PRICE FOR A LICENSE TO THE SOFTWARE, EVEN IF AUTHOR SHALL HAVE BEEN INFORMED OF THE POSSIBILITY OF SUCH DAMAGES, OR FOR ANY CLAIM BY

StrategyQuant User's Guide
6
ANY OTHER PARTY. THIS LIMITATION OF LIABILITY SHALL NOT APPLY TO LIABILITY FOR DEATH OR PERSONAL INJURY TO THE EXTENT APPLICABLE LAW PROHIBITS SUCH LIMITATION. FURTHERMORE, SOME STATES DO NOT ALLOW THE EXCLUSION OR LIMITATION OF INCIDENTAL OR CONSEQUENTIAL DAMAGES, SO THIS LIMITATION AND EXCLUSION MAY NOT APPLY TO YOU.
TERMINATION. This license will terminate automatically if you fail to comply with the limitations described above. On termination, you must destroy all copies of the Software in electronic or other form, including any copies on backup tapes or other media. Upon termination of this License for any reason, you shall have no right to refund of the whole or part of any License Fee paid.

StrategyQuant User's Guide
7
Table of Contents 1 Introduction ..................................................................................................................................... 9
1.1 What is StrategyQuant? .......................................................................................................... 9
1.2 System Requirements............................................................................................................ 11
1.3 Installation ............................................................................................................................. 12
1.3.1 Post-Installation steps ................................................................................................... 12
1.4 Backtesting engines – Tradestation, NinjaTrader, MetaTrader4 .......................................... 13
2 How does it work? ......................................................................................................................... 15 2.1 Random generation of trading strategies ............................................................................. 15
2.2 Genetic Evolution .................................................................................................................. 16
2.3 Example strategy code .......................................................................................................... 17
2.4 3 data parts approach ........................................................................................................... 18
2.5 Range / Renko bars support .................................................................................................. 23
2.6 Supported building blocks ..................................................................................................... 25
2.7 Custom Indicators.................................................................................................................. 26
3 Quick start with the program ........................................................................................................ 28 3.1 Main concepts ....................................................................................................................... 28
3.1.1 Layout ............................................................................................................................ 28
3.1.2 Databanks ...................................................................................................................... 29
3.1.3 Working with files .......................................................................................................... 30
3.2 Flow of work .......................................................................................................................... 31
4 Program modes ............................................................................................................................. 34 4.1 Data Manager ........................................................................................................................ 34
4.1.1 History Data ................................................................................................................... 34
4.1.2 Custom indicators .......................................................................................................... 35
4.2 Build strategies ...................................................................................................................... 36
4.3 Retest strategies .................................................................................................................... 37
4.4 Improve strategies ................................................................................................................. 37
4.5 Optimizer ............................................................................................................................... 37
5 Program Layout ............................................................................................................................. 38 5.1 Progress ................................................................................................................................. 39
5.2 Settings .................................................................................................................................. 40
5.2.1 Data ............................................................................................................................... 40
5.2.2 Building blocks ............................................................................................................... 43
5.2.3 Strategy options ............................................................................................................ 44
5.2.4 Genetic options ............................................................................................................. 47
5.2.5 Money management ..................................................................................................... 49
5.2.6 Robustness tests ............................................................................................................ 50
5.2.7 Ranking options ............................................................................................................. 52
5.2.8 Parts to improve ............................................................................................................ 54
5.2.9 Parameters .................................................................................................................... 55
5.2.10 Success criteria .............................................................................................................. 56
5.2.11 Global options ............................................................................................................... 57
5.3 Results ................................................................................................................................... 59
5.3.1 Databanks ...................................................................................................................... 59
5.3.2 Overview ........................................................................................................................ 60
5.3.3 List of trades .................................................................................................................. 60
StrategyQuant User's Guide
8
5.3.4 Equity chart ................................................................................................................... 60
5.3.5 Trade analysis ................................................................................................................ 60
5.3.6 Robustness analysis ....................................................................................................... 60
5.3.7 Strategy settings ............................................................................................................ 61
5.3.8 Source code ................................................................................................................... 62
6 Advanced functionality .................................................................................................................. 63 6.1 Robustness tests and analysis ............................................................................................... 63
6.2 Optimization .......................................................................................................................... 69
6.2.1 Simple optimization ....................................................................................................... 69
6.2.2 Walk-Forward Optimization .......................................................................................... 75
6.2.3 Walk-Forward Matrix .................................................................................................... 76
6.3 Portfolios ............................................................................................................................... 77
6.4 Strategy Editor ....................................................................................................................... 78
7 How to… ........................................................................................................................................ 80 7.1 Import history data from MetaTrader .................................................................................. 80
7.2 Import history data from NinjaTrader ................................................................................... 83
7.3 How to find Point value,Pip/Tick step in NinjaTrader ........................................................... 87
7.4 Import history data from Tradestation ................................................................................. 88
7.5 How to find Point value, Pip/Tick step in Tradestation ......................................................... 91
7.6 Import history data for Range / Renko charts from MetaTrader .......................................... 91
7.7 Import new custom indicator from MT4 – automatic way ................................................... 93
Step 3.1: Automatic import ........................................................................................................... 98
Step 3.2: Manual import ............................................................................................................... 99
7.8 Import new custom indicator from NinjaTrader ................................................................. 105
7.9 Import new custom indicator from Tradestation................................................................ 111
7.10 Export strategy from StrategyQuant and test or trade it in MetaTrader............................ 120
7.11 Export strategy from StrategyQuant and test or trade it in NinjaTrader ............................ 124
7.12 Export strategy from StrategyQuant and test or trade it in Tradestation .......................... 129
7.13 Translate program to another language ............................................................................. 135
8 Appendix ...................................................................................................................................... 136 8.1 Ranking criteria .................................................................................................................... 136
8.2 Entry and exit types ............................................................................................................. 140
9 Final Words .................................................................................................................................. 142
StrategyQuant User's Guide
9
1 Introduction
1.1 What is StrategyQuant?
StrategyQuant is a program that automatically generates new unique trading strategies for forex, stocks or ETFs.
Using StrategyQuant, you can find profitable trading strategies for virtually any market, any timeframe and any chart type. No programming or trading knowledge is required.
The resulting strategies can be saved as a MetaTrader 4 Expert Advisor with complete source code.
With StrategyQuant you can:
Generate an unlimited number of unique trading strategies for virtually any market or timeframe
Save your strategies as a MetaTrader Expert Advisor or Ninja Trader strategy with full source code
Eliminate the manual labor previously required when developing a trading strategy
Find new trading strategies that are not only unique, but also non-obvious
Reduce the time required to build a strategy from weeks and months to minutes!
Improve your existing strategies
Optimize your strategies and find the best parameters
Test your strategies for robustness and analyze their performance
Is StrategyQuant Right for You?
If you trade using automatic trading system (called also robots or Expert Advisors) or you plan to
develop your own trading strategies then StrategyQuant can save you money and hundreds of
hours of your time.
Some traders prefer to purchase an existing trading robot; there is a multitude of offers especially for Forex. While this can be an effective way, by purchasing someone's forex robot you are usually purchasing a black box - you don't know how it works, what are the exact rules and you are at mercy of its creator with potential adaptations to changed market conditions.
StrategyQuant allows you to create your own trading strategies, exportable to a plain Expert Advisor source code, so you have full control over your strategy.
What If You Are a Manual Trader?
You can still use for StrategyQuant to generate the trading ideas. You'll be surprised to find many
profitable strategies based on relatively simple rules that you wouldn't think of.
Every strategy that is created by StrategyQuant can be exported to readable pseudo code with full
description of the trading rules and can be traded also manually.
StrategyQuant User's Guide
10
What to Expect
Please keep in mind that StrategyQuant is a powerful tool, but it is not a magic box that will start
making you money with a click on a button. It has to be used in the right way to get the results.
Generating new strategies in StrategyQuant is only about 50% of the work.
The rest of the work has to go into evaluating the generated strategies to filter out the ones that are
curve fitted or not robust enough.
It is up to you to evaluate your new strategies properly and know their strengths, weaknesses and
limitations before you put them to live trading.
It can easily happen that from all the profitable strategies generated by StrategyQuant only 1 out of
10 passes the evaluation and we can consider using it for live trading.
But - the number of strategies we can generate is almost endless, so even 5-10% from infinity is a
pretty big number :-)
There are few steps to evaluate the strategies quality and measure how good they will be in real live
trading. Please read the Evaluating Generated Strategies section for more information.
StrategyQuant User's Guide
11
1.2 System Requirements
StrategyQuant is not an EA, it is a normal program (EXE file) for Microsoft Windows and it will run on
all standard computers with Internet connection.
Minimum system requirements:
1.2 GHz processor
512 MB RAM
500 MB hard disk space
Windows XP, Vista, Windows 7 or Windows 8 operating system
Computing power
Strategy generation and backtesting requires a lot of processing power, so the faster computer you
have, the more strategies will be generated and tested.
The most important component that affects the speed of testing is processor (CPU). StrategyQuant is
able to use all processor cores,
so the best results will be achieved by using multi-core processor, such as i5 or i7.
StrategyQuant User's Guide
12
1.3 Installation StrategyQuant comes with standard setup wizard, you just download and run the installation EXE file and then follow the steps in the installation wizard.
1.3.1 Post-Installation steps
there are few things you should do after installation depending on trading platform you use.
MetaTrader4 Some of the technical indicators used in StrategyQuant are not standard MT4 indicators and you need to add them to MT4. All these additional indicators are a part of the installation package, you can find them in {StrategyQuant}/custom_indicators/mt4 folder. Simply copy all the *.mq4 files from this folder to your MetaTrader installation to path: {Your MetaTrader installation directory}/experts/indicators If you use more than one MetaTrader installations, you have to repeat this step for every installed MetaTrader. --------------------------------------------------------------------------------------------------------------------
Important Note! If you updated to MT4 Build 600+ then the folders MetaTrader folders have
changed. Indicators folder is NO LONGER in MetaTrader installation directory, you can instead get its
location by opening MetaTrader, File -> Open Data Folder.
You should save the indicators to this folder:
C:\Users\[username]\AppData\Roaming\MetaQuotes\Terminal\[unique_string_id]\MQL4\Indicators
--------------------------------------------------------------------------------------------------------------------
NinjaTrader In order to make SQ strategies work with NinjaTrader, you have to import some NinjaTrader scripts into your NinjaTrader. Open your NinjaTrader, go to File -> Utilities -> Import Ninja Script... then find the file: {StrategyQuant}/custom_indicators/SQ_NinjaTrader.zip and import it.
Important !!!
Please DON'T install StrategyQuant to standard C:\Program Files directory !
It might not work correctly because Windows security settings don't allow the program to write to
its data files.
Instead install it to any normal drive or directory on the disk, like C:\StrategyQuant
or C:\Trading\StrategyQuant
StrategyQuant User's Guide
13
This will import all the additional indicators and base classes StrategyQuant uses, so your new strategies will run in NinjaTrader.
Tradestation In order to make SQ strategies work with Tradestation, you have to import some custom EasyLanguage functions into your Tradestation. Open your Tradestation, go to File -> Import/Export EasyLanguage and choose Import EasyLangauge File (ELD, ELS or ELA) then find the file: {StrategyQuant}/custom_indicators/SQ_Tradestation.eld and import it. This will import all the additional functions StrategyQuant uses, so your new strategies will run in Tradestation.
1.4 Backtesting engines – Tradestation, NinjaTrader, MetaTrader4
StrategyQuant can export trading strategies to multiple trading platforms:
MetaTrader4 - forex, CFDs
NinjaTrader - futures, stocks, forex
Tradestation - futures, stocks, forex
There are some differences between these platforms in how each platform handles trades, opens
and closes positions, manages the open trades, etc. which can cause that strategy will have very
different results in one engine than in other. Always develop strategies only in the engine you’ll be
trading it later!
StrategyQuant allows you to switch the backtesting engine between
MetaTrader4/NinjaTrader/Tradestation so that internal testing engine knows how to treat the trades
in a way that matches the selected platform.
Each trading platform and backtesting engine also allows you to configure some settings that are
specific for a given platform.
Why one strategy can have different results in different backtesting engine
As mentioned earlier, there are differences in how each platform handles trades and how its
backtesting and trading engine works internally.
For this reason, strategy might have different results when you test it with another backtesting
engine.
StrategyQuant User's Guide
14
Another reason is Data handling differences between MetaTrader and NinjaTrader.
Note
Please make sure you test your strategy by trading it on paper account before putting it to real
money.
Data handling differences between MetaTrader and NinjaTrader/Tradestation
Difference in data There is difference how candles (bars) are computed and drawn in each platform, for example:
in MetaTrader4, 15 minute candle with time 13:15 means candle that started at 13:15:00, and it consists of data from 13:15:00 to 13:29:59
in NinjaTrader and Tradestation, 15 minute candle with time 13:15 means candle that ended at 13:15, so it consists of data from 13:00:01 to 13:15:00
Moreover, unlike forex, futures and stocks don't trade 24/7. They trade on exchanges with given trading hours, so trading sessions come into play when you work for example with futures data.
Because of this, it is now necessary to choose the type of data when you are importing it to StrategyQuant and it is recommended to use only the data for given platform during strategy generation.
Also, for this reason there is a difference how each data is handled by StrategyQuant to match each platform. As a result, StrategyQuant can automatically compute higher timeframes from minute data for forex, but it cannot do it for NinjaTrader/Tradestation data (because trading sessions would have to be considered).
To simplify work with trading sessions, you have to import directly the target timeframe to StrategyQuant.
StrategyQuant User's Guide
15
2 How does it work?
StrategyQuant is a program, it doesn't have the brain or experience of a trader, and it doesn’t know
how to create a profitable strategy.
What it does is that it randomly combines available building blocks (indicators, prices, etc.) to create
new trading rules. The resulting strategy is then tested on a history data to see if it is profitable.
Random generation is the foundation of StrategyQuant. Strategies generated this way can be further
improved (evolved) using Genetic evolution.
2.1 Random generation of trading strategies
A trading strategy in the initial population is constructed using a combination of price patterns,
technical indicators, order types, and other parts to form the entry and exit rules.
StrategyQuant can use all standard technical indicators and oscillators (like CCI, RSI, Stochastic, etc.),
time values (like time of day, day of week) and price patterns. These building blocks are then
combined using logical and equality operators (and, or, >, <, etc.) to form an entry or exit rule.
In addition, it supports different entry and exit order types (market order, limit order, fixed profit
target, exit after X bars, etc.).
With all the possible combinations of rules and orders, StrategyQuant is capable of generating
literally trillions of different possible trading strategies.
The building process itself is completely random - builder randomly picks different building blocks
from the available pool and combines them to create entry rule, order type and exit rule.
There are some validity constraints that ensure that, for example price is not compared to time
value, etc.
The result is a completely new random trading strategy. Of course, not every randomly created
StrategyQuant User's Guide
16
strategy is profitable, but StrategyQuant can produce and test thousands of new strategies per hour,
and there are many profitable ones in this amount.
2.2 Genetic Evolution
Genetic Evolution takes the process of finding suitable trading strategies even further.
In this mode StrategyQuant first creates a number of random strategies, which are used as the initial
population in the evolution.
This initial generation of strategies is then "evolved" over successive generations using genetic
programming technology.
This process imitates the evolution - the algorithm chooses the fittest strategies (using selected
performance criteria) in every generation, and the group of fittest candidates is then used to produce
new generation of trading strategies.
As in evolution, this should result in better and better candidates, in our case in strategies that are
more profitable, more stable, or generally better in the selected performance criteria.
StrategyQuant User's Guide
17
2.3 Example strategy code
Below if an example pseudo code of a strategy generated by StrategyQuant. You can see that
strategy consists of entry orders, exit orders and trade management commands – such as trailing
stop movements, etc.
Every strategy generated by the program can be viewed in this pseudo code or exported in the form
of MetaTrader Expert Advisor (EA), NinjaTrader NinjaScript C# strategy or EasyLanguage for
Tradestation/Multicharts.
====================================================================
== Entry conditions
====================================================================
LongEntryCondition = (Stoch(40, 1, 3) < 50)
ShortEntryCondition = (Stoch(40, 1, 3) > 50)
====================================================================
== Entry orders
====================================================================
-- Long entry
if LongEntryCondition is true {
if No position is open then Buy at Ichimoku(6, 18, 38, Kijun-sen) + (0.4 * ATR(86)) Limit;
Stop/Limit order expires after 34 bars.
Stop Loss = 190 pips;
Profit Target = (0.74 * ATR(87)) pips;
// Move SL to BE (on close)
Move Stop Loss to Entry price when in profit at least (77 * ATR(12)) pips;
// Profit trailing (on close)
Profit Trailing by 222 pips;
// Stop trailing (on close)
Move Stop to (Close(1) + (0.5) * BBWidthRatio(20, 2.0))) on bar close;
}
-- Short entry
if ShortEntryCondition is true {
if No position is open then Sell at Ichimoku(6, 18, 38, Kijun-sen) + (-0.4 * ATR(86)) Limit;
Stop/Limit order expires after 34 bars.
Stop Loss = 190 pips;
Profit Target = (0.74 * ATR(87)) pips;
}
====================================================================
StrategyQuant User's Guide
18
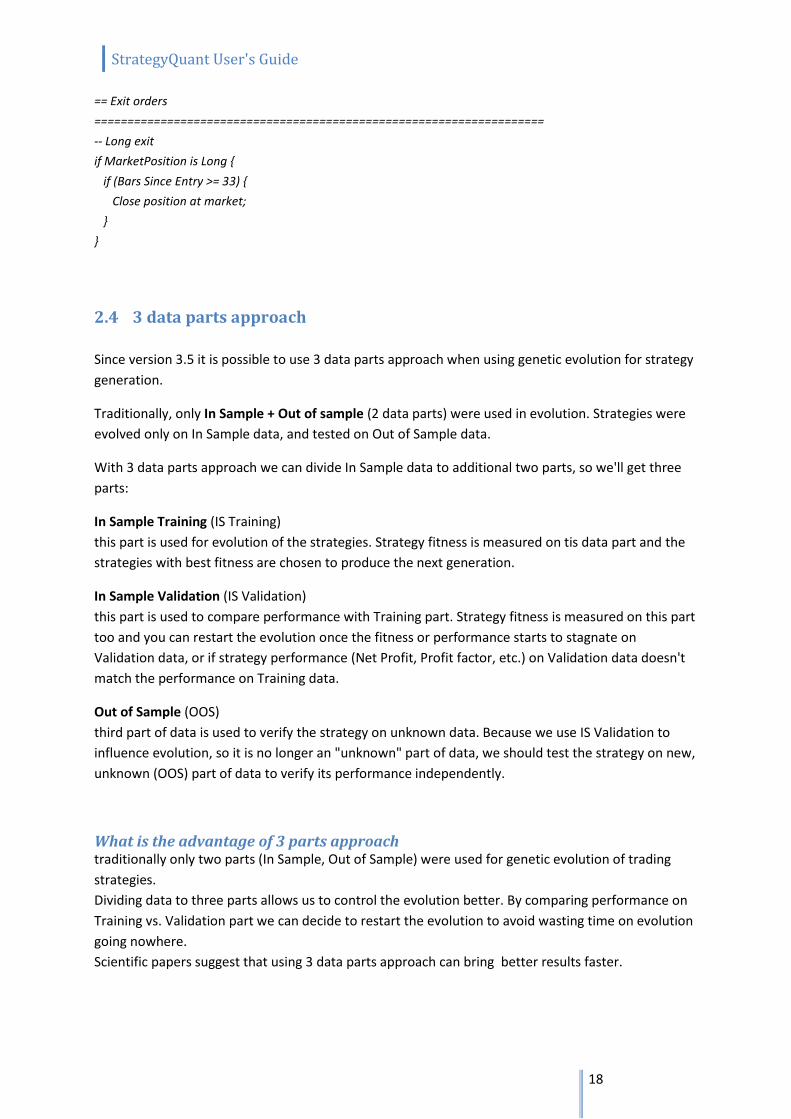
== Exit orders
====================================================================
-- Long exit
if MarketPosition is Long {
if (Bars Since Entry >= 33) {
Close position at market;
}
}
2.4 3 data parts approach
Since version 3.5 it is possible to use 3 data parts approach when using genetic evolution for strategy
generation.
Traditionally, only In Sample + Out of sample (2 data parts) were used in evolution. Strategies were
evolved only on In Sample data, and tested on Out of Sample data.
With 3 data parts approach we can divide In Sample data to additional two parts, so we'll get three
parts:
In Sample Training (IS Training)
this part is used for evolution of the strategies. Strategy fitness is measured on tis data part and the
strategies with best fitness are chosen to produce the next generation.
In Sample Validation (IS Validation)
this part is used to compare performance with Training part. Strategy fitness is measured on this part
too and you can restart the evolution once the fitness or performance starts to stagnate on
Validation data, or if strategy performance (Net Profit, Profit factor, etc.) on Validation data doesn't
match the performance on Training data.
Out of Sample (OOS)
third part of data is used to verify the strategy on unknown data. Because we use IS Validation to
influence evolution, so it is no longer an "unknown" part of data, we should test the strategy on new,
unknown (OOS) part of data to verify its performance independently.
What is the advantage of 3 parts approach traditionally only two parts (In Sample, Out of Sample) were used for genetic evolution of trading
strategies.
Dividing data to three parts allows us to control the evolution better. By comparing performance on
Training vs. Validation part we can decide to restart the evolution to avoid wasting time on evolution
going nowhere.
Scientific papers suggest that using 3 data parts approach can bring better results faster.

StrategyQuant User's Guide
19
StrategyQuant User's Guide
20
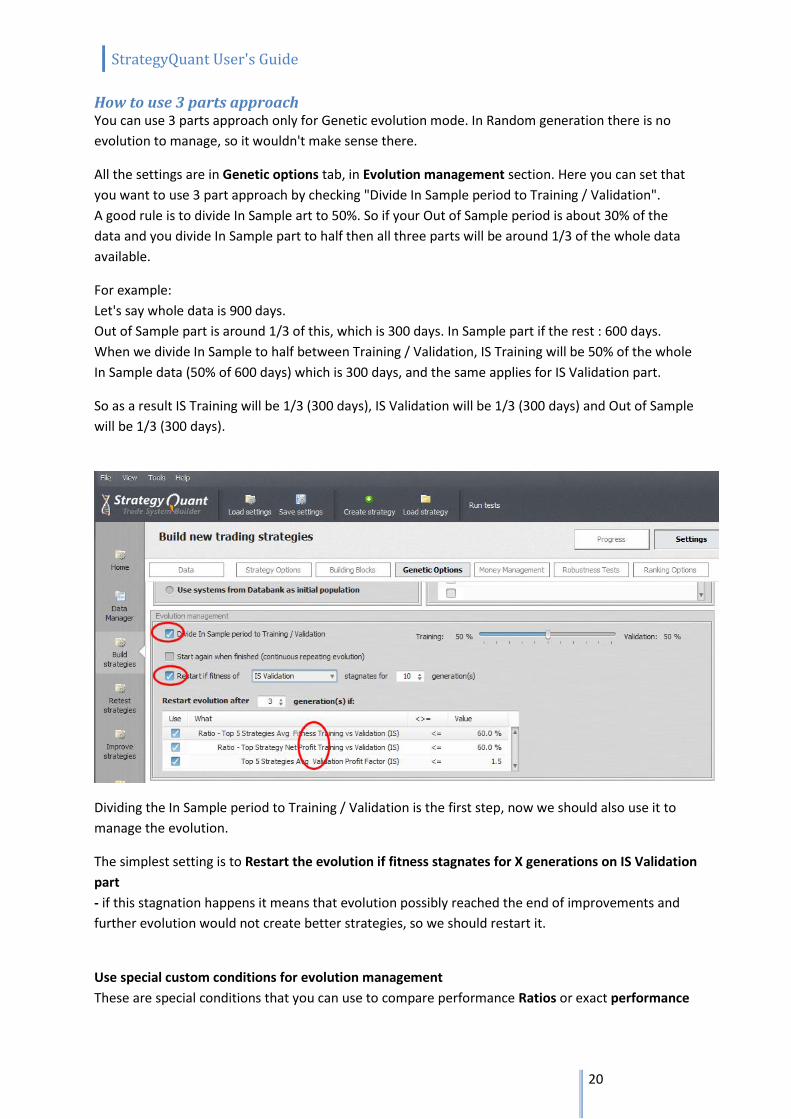
How to use 3 parts approach You can use 3 parts approach only for Genetic evolution mode. In Random generation there is no
evolution to manage, so it wouldn't make sense there.
All the settings are in Genetic options tab, in Evolution management section. Here you can set that
you want to use 3 part approach by checking "Divide In Sample period to Training / Validation".
A good rule is to divide In Sample art to 50%. So if your Out of Sample period is about 30% of the
data and you divide In Sample part to half then all three parts will be around 1/3 of the whole data
available.
For example:
Let's say whole data is 900 days.
Out of Sample part is around 1/3 of this, which is 300 days. In Sample part if the rest : 600 days.
When we divide In Sample to half between Training / Validation, IS Training will be 50% of the whole
In Sample data (50% of 600 days) which is 300 days, and the same applies for IS Validation part.
So as a result IS Training will be 1/3 (300 days), IS Validation will be 1/3 (300 days) and Out of Sample
will be 1/3 (300 days).
Dividing the In Sample period to Training / Validation is the first step, now we should also use it to
manage the evolution.
The simplest setting is to Restart the evolution if fitness stagnates for X generations on IS Validation
part
- if this stagnation happens it means that evolution possibly reached the end of improvements and
further evolution would not create better strategies, so we should restart it.
Use special custom conditions for evolution management
These are special conditions that you can use to compare performance Ratios or exact performance
StrategyQuant User's Guide
21
of top strategy / top 5 strategies between Training and Validation part. Keep in mind that you are
comparing top strategy or average of top 5 strategies found so far in evolution.
Ratios
All ratios are in percent, so for example:
Ratio - Top StrategyNet Profit Training vs Validation is the percentage ratio of Net Profit of the best
strategy on Training data vs Validation data.
For example if top strategy made $5000 on Training part and $3000 on Validation part then this ratio
will be 60%, because strategy made only 60% of Net Profit in validation part versus Training part.
If ratio between Training / Validation is too small, it is also a good sign that the evolution reached
dead end and we should restart it.
Exact performance
in addition to ratios you can choose to restart the evolution also by checking the performance results
of the top strategy / top 5 strategies on validation data. For example:
Top 5 Strategies Avg Validation Profit Factor returns top 5 strategies average Profit Factor on
validation part (not a ratio between training / validation). For example, we can restart the evolution
if top 5 strategies average Profit Factor on validation data is smaller than 1.5.
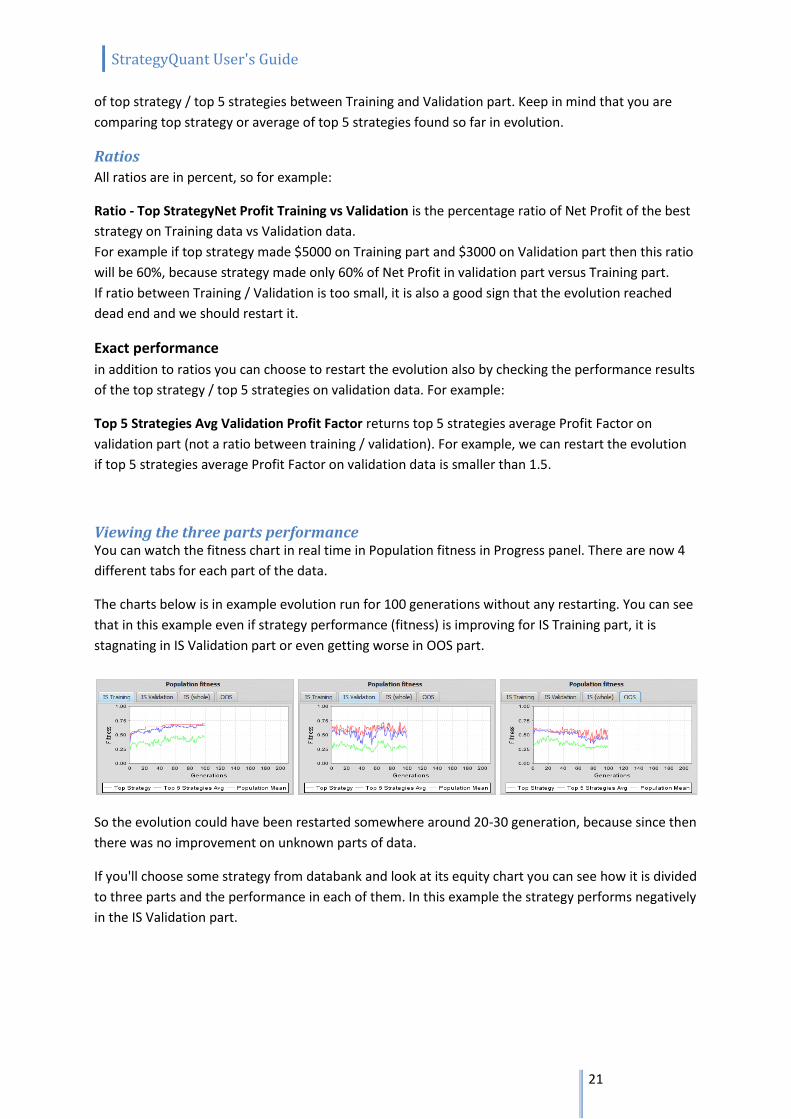
Viewing the three parts performance You can watch the fitness chart in real time in Population fitness in Progress panel. There are now 4
different tabs for each part of the data.
The charts below is in example evolution run for 100 generations without any restarting. You can see
that in this example even if strategy performance (fitness) is improving for IS Training part, it is
stagnating in IS Validation part or even getting worse in OOS part.
So the evolution could have been restarted somewhere around 20-30 generation, because since then
there was no improvement on unknown parts of data.
If you'll choose some strategy from databank and look at its equity chart you can see how it is divided
to three parts and the performance in each of them. In this example the strategy performs negatively
in the IS Validation part.

StrategyQuant User's Guide
22
Better strategy should look more like the example below, where all three parts have roughly the
same performance (visible by red line). This strategy is still not perfect (too big drawdowns), it is just
an example.
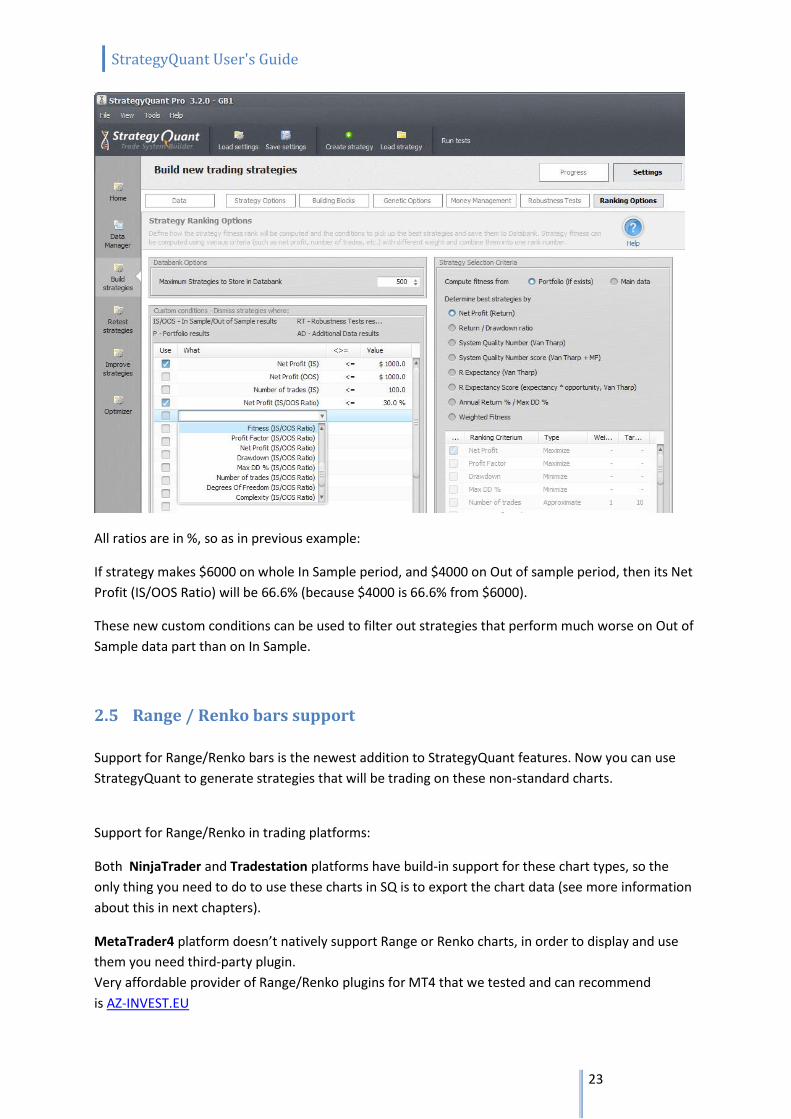
New custom conditions for databank The settings in Genetic options tab described above are used to manage the evolution. In addition to
this, there is a new group of Ratio-based custom conditions in Ranking -> Custom conditions, which
we can use to control which strategies will get to the databank and which will be dismissed.
These new custom conditions are technically not related to 3 parts approach, but they are inspired
by this idea and allow to measure performance ratio of given characteristics between In Sample and
Out of Sample results.
StrategyQuant User's Guide
23
All ratios are in %, so as in previous example:
If strategy makes $6000 on whole In Sample period, and $4000 on Out of sample period, then its Net
Profit (IS/OOS Ratio) will be 66.6% (because $4000 is 66.6% from $6000).
These new custom conditions can be used to filter out strategies that perform much worse on Out of
Sample data part than on In Sample.
2.5 Range / Renko bars support
Support for Range/Renko bars is the newest addition to StrategyQuant features. Now you can use
StrategyQuant to generate strategies that will be trading on these non-standard charts.
Support for Range/Renko in trading platforms:
Both NinjaTrader and Tradestation platforms have build-in support for these chart types, so the
only thing you need to do to use these charts in SQ is to export the chart data (see more information
about this in next chapters).
MetaTrader4 platform doesn’t natively support Range or Renko charts, in order to display and use
them you need third-party plugin.
Very affordable provider of Range/Renko plugins for MT4 that we tested and can recommend
is AZ-INVEST.EU
StrategyQuant User's Guide
24
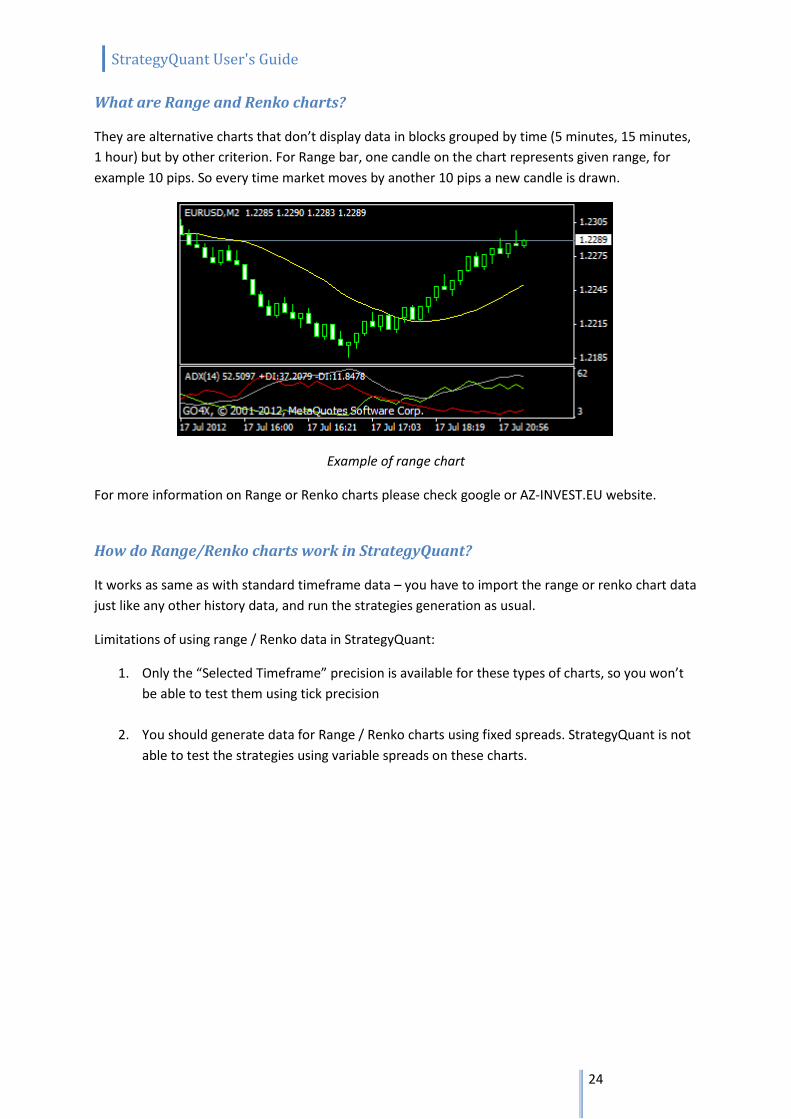
What are Range and Renko charts?
They are alternative charts that don’t display data in blocks grouped by time (5 minutes, 15 minutes,
1 hour) but by other criterion. For Range bar, one candle on the chart represents given range, for
example 10 pips. So every time market moves by another 10 pips a new candle is drawn.
Example of range chart
For more information on Range or Renko charts please check google or AZ-INVEST.EU website.
How do Range/Renko charts work in StrategyQuant?
It works as same as with standard timeframe data – you have to import the range or renko chart data
just like any other history data, and run the strategies generation as usual.
Limitations of using range / Renko data in StrategyQuant:
1. Only the “Selected Timeframe” precision is available for these types of charts, so you won’t
be able to test them using tick precision
2. You should generate data for Range / Renko charts using fixed spreads. StrategyQuant is not
able to test the strategies using variable spreads on these charts.
StrategyQuant User's Guide
25
2.6 Supported building blocks
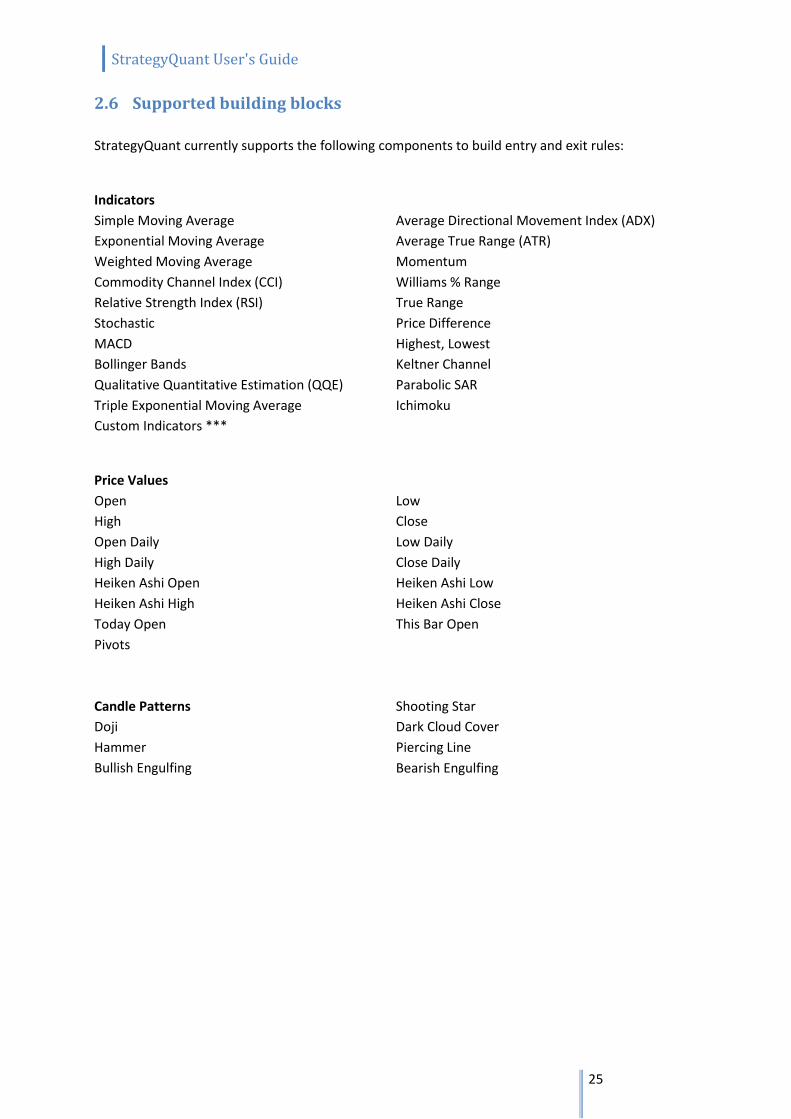
StrategyQuant currently supports the following components to build entry and exit rules:
Indicators
Simple Moving Average
Exponential Moving Average
Weighted Moving Average
Commodity Channel Index (CCI)
Relative Strength Index (RSI)
Stochastic
MACD
Bollinger Bands
Qualitative Quantitative Estimation (QQE)
Triple Exponential Moving Average
Custom Indicators ***
Average Directional Movement Index (ADX)
Average True Range (ATR)
Momentum
Williams % Range
True Range
Price Difference
Highest, Lowest
Keltner Channel
Parabolic SAR
Ichimoku
Price Values
Open
High
Open Daily
High Daily
Heiken Ashi Open
Heiken Ashi High
Today Open
Pivots
Candle Patterns
Doji
Hammer
Bullish Engulfing
Low
Close
Low Daily
Close Daily
Heiken Ashi Low
Heiken Ashi Close
This Bar Open
Shooting Star
Dark Cloud Cover
Piercing Line
Bearish Engulfing
StrategyQuant User's Guide
26
Operators
Greater
Lower
Crosses Above
Crosses Below
And
Or
Closes Below
Addition (+)
Subtraction (-)
Multiplication (*)
Equals
Not Equals
Closes Above
Time Values
Hour
Minute
Day of Week
Order Types
Enter at Market
Enter/Reverse at Market
Enter at Stop
Enter at Limit
Exit Types
Stop Loss
Exit After X Bars
Exit Rule (Price + Operators + Indicators, ...)
Profit Target
Move Stop Loss to Break-even
Stop Trailing
Profit Trailing
We will be continually adding new technical indicators and other features to the Builder.
If you have your favorite indicator you'd like to see in StrategyQuant, just let us know.
An explanation: What is the difference between Closes Above and Crosses Above?
Closes above operator works only for Close price vs an indicator and is true if price opens below
given indicator and closes above it.
Crosses above operator works for any indicator versus Indicator and it checks that Indicator1 was
below Indicator2 on previous candle, and now crossed above Indicator2 on current candle.
2.7 Custom Indicators
Since version 2.0 the program offers almost infinite flexibility of building blocks with custom
indicators. In contrast with build-in indicators, StrategyQuant doesn't know how to compute custom
indicators; they are defined by their data. This will enable you to use virtually any of your favorite
indicators in StrategyQuant.
There are no real limits – you can use multi-timeframe or multi-symbol indicators, generally every
indicator that works in MetaTrader can be used in StrategyQuant.
StrategyQuant User's Guide
27
The way it works is that you have to export the values of the indicator computed on a specific symbol
and timeframe to a file, and then import this file as a custom indicator to the Builder.
This way you'll create new custom indicator (with values computed in another program, such as
MT4) for this specific symbol and timeframe also in SQ.
Remember, every custom indicator is defined for a specific combination of symbol and timeframe
(on which it was computed).
To use the same indicator on another symbol or timeframe, you have to recomputed its data in MT4,
export it and create a new custom indicator for this symbol/timeframe combination.
You can find more information about custom indicators in these topics:
Manage Custom indicators
How to ... Import new custom indicator
StrategyQuant User's Guide
28
3 Quick start with the program
3.1 Main concepts
3.1.1 Layout
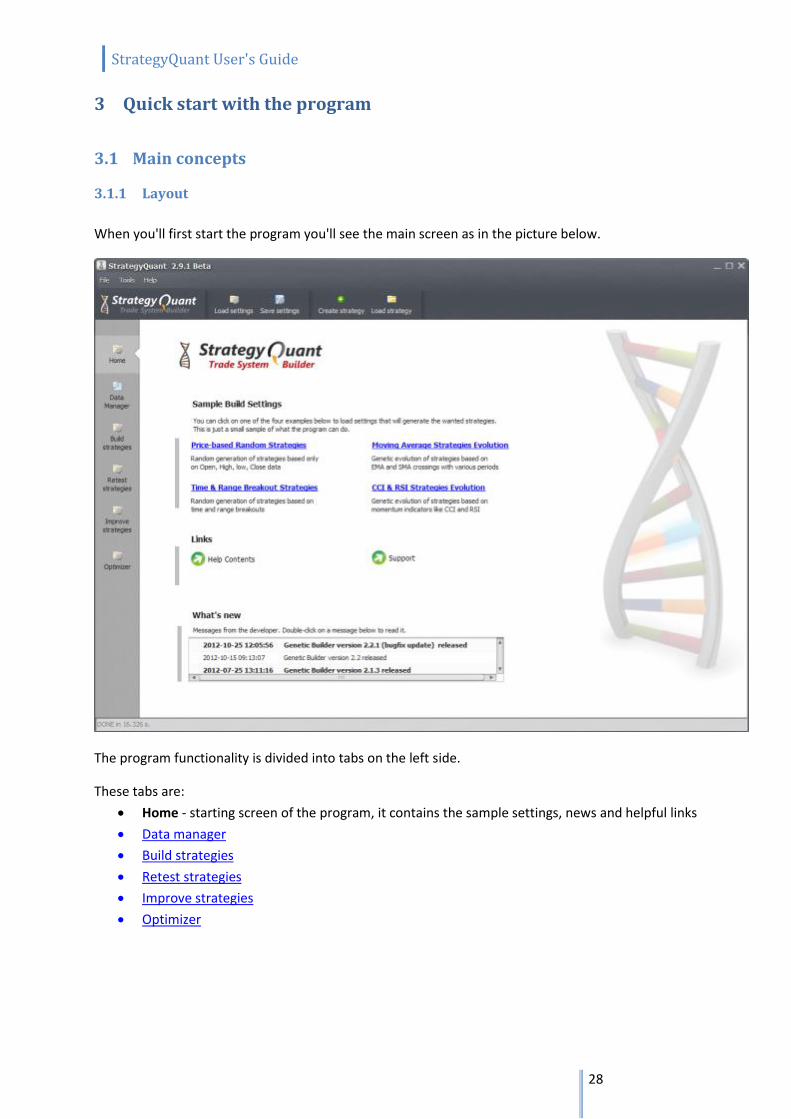
When you'll first start the program you'll see the main screen as in the picture below.
The program functionality is divided into tabs on the left side.
These tabs are:
Home - starting screen of the program, it contains the sample settings, news and helpful links
Data manager
Build strategies
Retest strategies
Improve strategies
Optimizer
StrategyQuant User's Guide
29
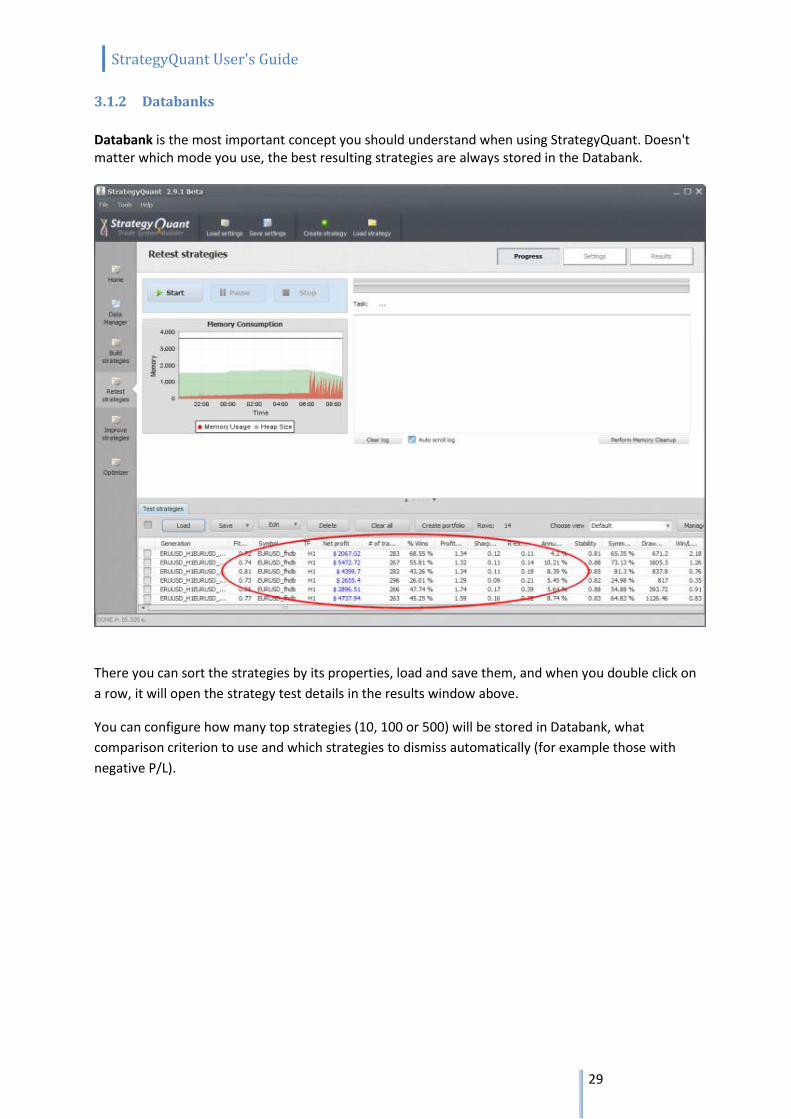
3.1.2 Databanks
Databank is the most important concept you should understand when using StrategyQuant. Doesn't matter which mode you use, the best resulting strategies are always stored in the Databank.
There you can sort the strategies by its properties, load and save them, and when you double click on
a row, it will open the strategy test details in the results window above.
You can configure how many top strategies (10, 100 or 500) will be stored in Databank, what
comparison criterion to use and which strategies to dismiss automatically (for example those with
negative P/L).

StrategyQuant User's Guide
30
3.1.3 Working with files
Strategies in StrategyQuant are saved in their own proprietary file format (with .str extension) that
can be opened only by StrategyQuant.
If you find potentially good strategies you should always save them so that you can work with them
later.
Running strategies in MetaTrader
MetaTrader cannot read the strategy .str files. If you want to test or run your new strategies in
MetaTrader you have to export the strategy to MQL source code.
Please check the section How To ... Export strategy from StrategyQuant and test it in MetaTrader.
Please note that exported (*.MQ4) files are not readable by StrategyQuant, so make sure you always
save your strategy also as a normal strategy file (*.str).
StrategyQuant User's Guide
31
3.2 Flow of work
Please check the Articles section on our website for the most up-to-date tips on how to use the
program:
http://www.strategyquant.com/articles/
The general flow of work when generating new strategies can be described as follows:
1. Configure data for backtest You can use the history data that come with the program or optionally import your own data in MetaTrader format. Then set up the time range and timeframe you want to use. If you'll use genetic evolution mode you should divide the data to In Sample and Out of Sample periods. You can also use additional data or Robustness tests to automatically test the strategy robustness. 2. Configure settings
Go through all the settings and configure strategy type, indicators and order types to be used for
trading rules. Optionally use time constraints to limit trading to a certain time range.
3. Configure Ranking options
Ranking options allow you to select Strategy Selection Criteria - which is how the best strategies are
determined.
You should also set up Custom Conditions to filter only strategies that pass certain criteria.
It makes sense to dismiss all the strategies that have too little profit or trades, or too small Profit
Factor, Return/DD ratio or System Quality Number.
4. Run Build
Start the building process. Depending on your settings you can let it run several minutes, several
hours or even several days. The more time it will run the more potential strategies it will test.
The best of them will be stored into the databank.
5. Evaluate generated strategies
Go through the generated strategies and evaluate them. You can either evaluate them visually by
checking their equity chart, or by sorting them by their parameters in the Databank.
Choose the best ones to pass to the next step and save them to StrategyQuant project file (.sqn) so
that you can work with them later.
Evaluation can consist also of Retesting the strategies on additional symbols and/or timeframes, or
with different spread and slippage and comparing the results.
You should also run Robustness Tests.

StrategyQuant User's Guide
32
The goal of strategy evaluation is to find strategies that are robust - that means they work in
different conditions
and don't break up when there is a small change in parameters or in price data or they miss few
trades.
StrategyQuant User's Guide
33
Optional additional steps are:
6. Improve the strategy
You can try to improve the strategy in Improver. You can try to apply different combinations of exit
rules or additional conditions to entry rules in search for better performance.
After the improvement you should again run the new strategy variation through robustness tests to
make sure it didn't lose its robustness.
6. Optimize the strategy
You can run simple optimization to find better combination of input parameters of your strategy. You
can also run Walk-Forward optimization to find out if the strategy would benefit from periodical
reoptimization.
As the last step, you can run Walk-Forward Matrix analysis to determine the best reoptimization
period.
There are articles on our website that describe more detailed flow of work:
http://www.strategyquant.com/articles/getting%20started%20with%20StrategyQuant
http://www.strategyquant.com/articles/strategy%20building%20process

StrategyQuant User's Guide
34
4 Program modes
The program is divided into four independent (+ data manager) sections:
4.1 Data Manager a place where you can manage history data and custom indicators used in the program.
4.1.1 History Data
This screen is where you can manage (create, import, modify) the history data that are used for
backtesting.
StrategyQuant already comes with 4+ years history data for the major pairs provided by
ForexHistoryDatabase.com, but if you have your own history data in Metatrader you can easily
import your data
Check the section Import history data from MetaTrader for more description.
StrategyQuant User's Guide
35
4.1.2 Custom indicators
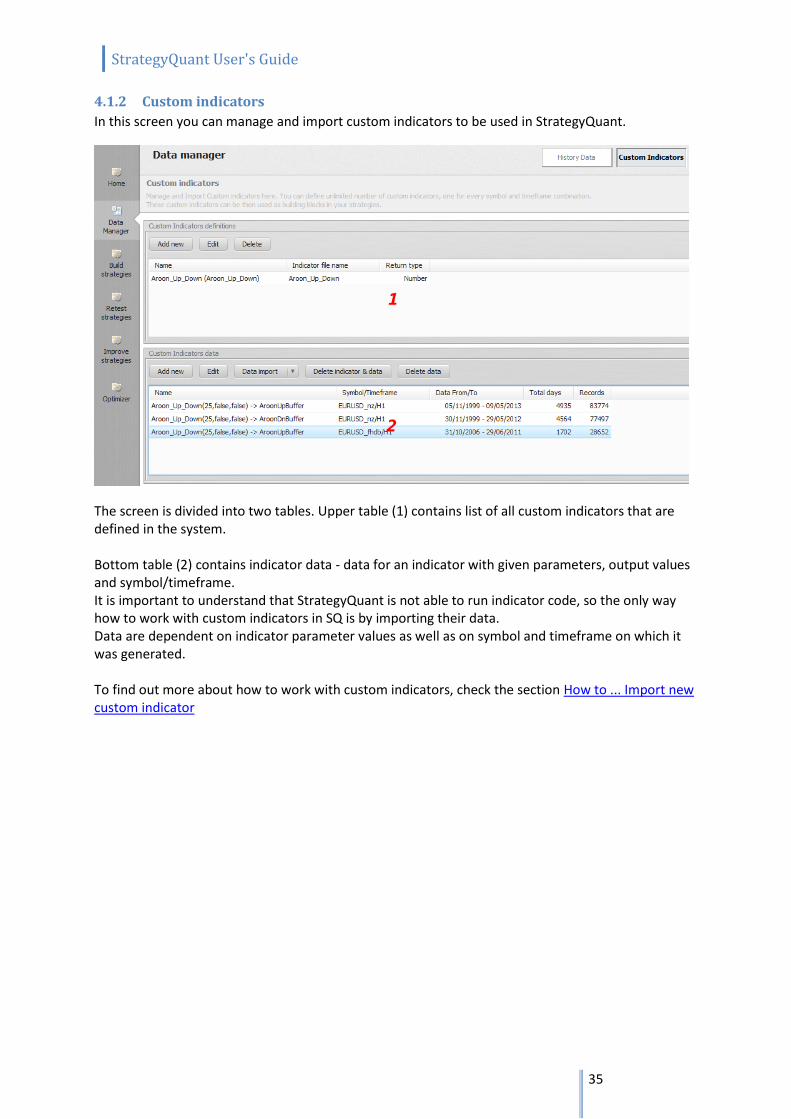
In this screen you can manage and import custom indicators to be used in StrategyQuant.
The screen is divided into two tables. Upper table (1) contains list of all custom indicators that are defined in the system. Bottom table (2) contains indicator data - data for an indicator with given parameters, output values and symbol/timeframe. It is important to understand that StrategyQuant is not able to run indicator code, so the only way how to work with custom indicators in SQ is by importing their data. Data are dependent on indicator parameter values as well as on symbol and timeframe on which it was generated. To find out more about how to work with custom indicators, check the section How to ... Import new custom indicator
StrategyQuant User's Guide
36
4.2 Build strategies the heart of the program. Here you can generate new trading strategies using different configuration options and building blocks. The resulting strategies should be saved to StrategyQuant file (.str) so you can work with them later. Available build modes: Genetic Evolution StrategyQuant first generates initial population of random candidates (using the Random Generation
mode) and then uses genetic evolution process
to evolve the population and produce better and better candidates with each generation.
The process ends when predefined number of generations is reached or when there's no further
improvement.
Pros:
in theory it should lead to strategies better than the initial random generation
this means that the already good strategies in the first generation can be further improved
search for profitable strategy in the trillions of possible combinations can be more effective
with the power of evolution
Cons:
evolution can be slower
sometimes the evolution can lead to the dead end, so the generation should be watched
the group of generated strategies is limited by population size
Random Generation In this mode StrategyQuant continually generates and tests new random strategies, one after
another, until it is stopped.
The top candidates (based on predefined criteria) are stored into Databank so you can review them
later.
Pros:
faster and simpler than genetic evolution
it will run until it is stopped, so if you let it run for a few days it can generate and evaluate
millions of strategies
Cons:
once the strategies are generated they are not further improved
StrategyQuant User's Guide
37
4.3 Retest strategies this section is used for retesting already existing strategies. You can retest the strategy on another historical data or timeframe; run Robustness tests on the strategy, try different options (for example trading only during certain hours per day).
4.4 Improve strategies this section can be used to improve existing strategy created in the Build step. "Improving" strategy means replacing some of its part (entry rule, order type, exit rule) or adding new condition to make strategy "better". Improver works in a way that it randomly generates the selected part of the strategy, while keeping the other strategy parts intact. This way you can look for better exit rule or for additional entry rule condition that will improve strategy performance.
4.5 Optimizer optimizer can be used to optimize strategy parameters to optimal values, as well as for Walk-Forward optimization and Walk-Forward Matrix analysis.
StrategyQuant User's Guide
38
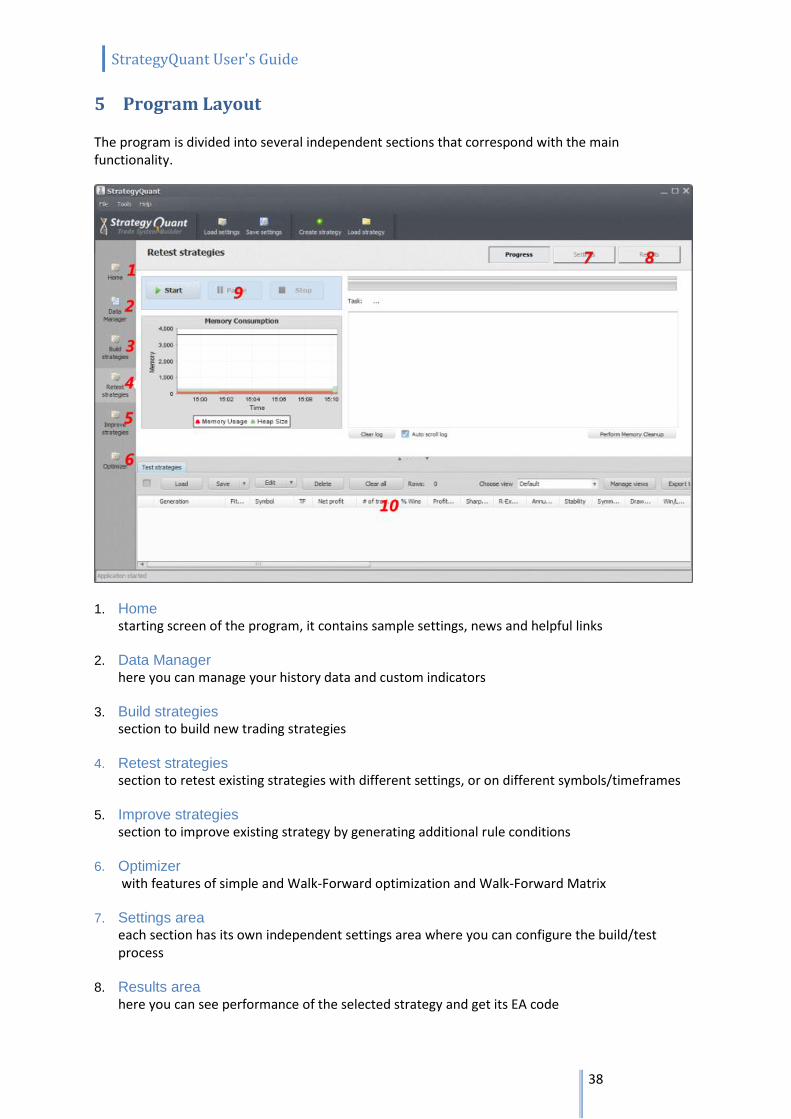
5 Program Layout
The program is divided into several independent sections that correspond with the main functionality.
1. Home
starting screen of the program, it contains sample settings, news and helpful links 2. Data Manager
here you can manage your history data and custom indicators 3. Build strategies
section to build new trading strategies 4. Retest strategies
section to retest existing strategies with different settings, or on different symbols/timeframes
5. Improve strategies section to improve existing strategy by generating additional rule conditions
6. Optimizer
with features of simple and Walk-Forward optimization and Walk-Forward Matrix
7. Settings area each section has its own independent settings area where you can configure the build/test process
8. Results area here you can see performance of the selected strategy and get its EA code

StrategyQuant User's Guide
39
9. buttons for starting, pausing and stopping the process
10. databanks - lists where generated strategies are stored
storage area for strategies, it contains all the built / tested strategies
5.1 Progress Progress screen is the place where you can start, pause or stop the building/testing process, it also shows you the log and memory consumption.
Before starting the build or test you should have the data and settings configured. The results
(generated top strategies) will be continually stored in the databank on the bottom.
StrategyQuant User's Guide
40
5.2 Settings
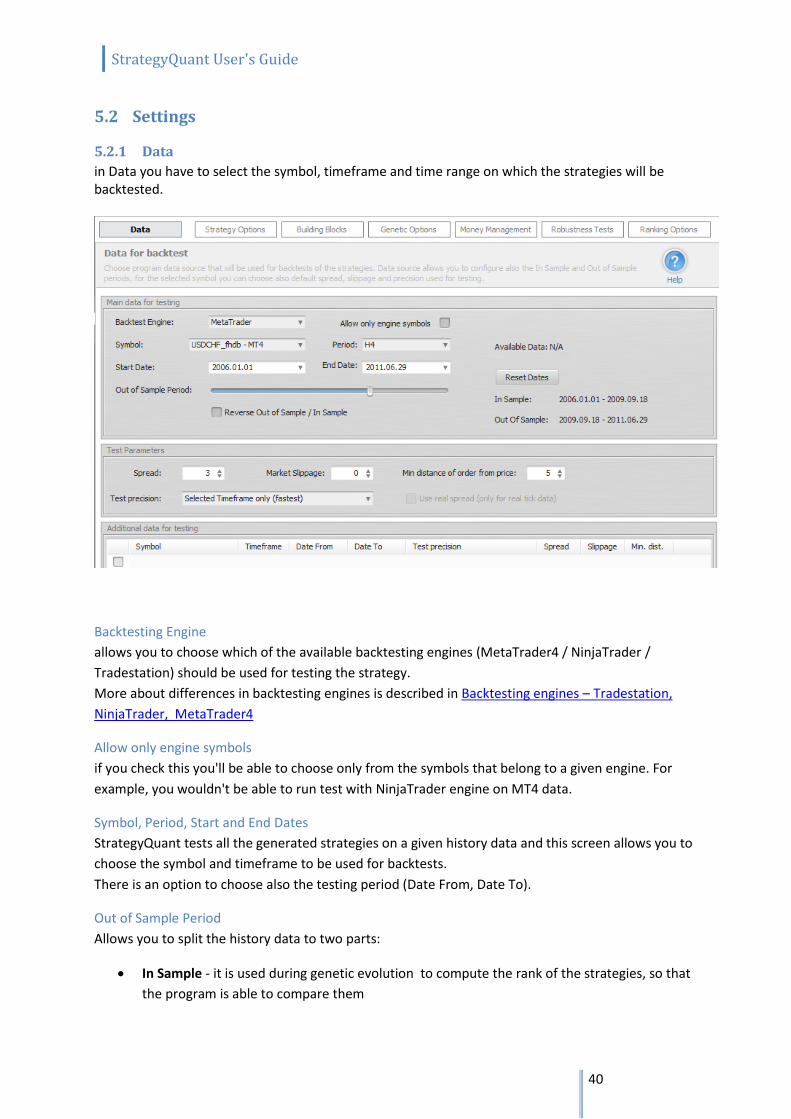
5.2.1 Data
in Data you have to select the symbol, timeframe and time range on which the strategies will be backtested.
Backtesting Engine
allows you to choose which of the available backtesting engines (MetaTrader4 / NinjaTrader /
Tradestation) should be used for testing the strategy.
More about differences in backtesting engines is described in Backtesting engines – Tradestation,
NinjaTrader, MetaTrader4
Allow only engine symbols
if you check this you'll be able to choose only from the symbols that belong to a given engine. For
example, you wouldn't be able to run test with NinjaTrader engine on MT4 data.
Symbol, Period, Start and End Dates
StrategyQuant tests all the generated strategies on a given history data and this screen allows you to
choose the symbol and timeframe to be used for backtests.
There is an option to choose also the testing period (Date From, Date To).
Out of Sample Period
Allows you to split the history data to two parts:
In Sample - it is used during genetic evolution to compute the rank of the strategies, so that
the program is able to compare them
StrategyQuant User's Guide
41
Out of Sample - this part of the data is used to verify if strategy really works as expected also
on data that it was not evolved
Test parameters
Testing precision testing precision means how the price is data simulated during the backtest. It is usually sufficient to use Selected Timeframe mode for Market orders, or Tick simulation mode for Stop/Limit orders. You can also use faster mode for generation, and then slower mode for strategies retest. Trade On Bar Open
In this mode, the system will check for signals and places trades only at the open of a bar. This is valid not only for opening the trade, but also for closing the trade on stop loss or profit target. If the trade reaches its stop loss or profit target, it is NOT closed immediately at this level, but only at the open of the next bar! If you'll use this mode you have to generate a special version of EA that will also trade only on bar open to achieve the same results. Selected Timeframe only together with Trade On Bar Open it is the fastest testing mode. It uses only the main timeframe to simulate the prices. This results in a very fast backtesting with very good accuracy. However, for Stop or Limit orders the testing accuracy might not be sufficient and you should try more precise mode. 1 Minute data slower testing mode, it uses minute data (if available) to simulate price changes during the testing. Tick simulation slow testing mode, it uses tick simulation within minute data to obtain more precise results. This is the most precise testing that can be achieved without real tick data. This testing mode is accurate enough for any type of orders. Real Tick this mode uses real tick data (if available) for exact price simulation. It is much slower than the other modes and it should be used for final verification of new strategies.
Note! NinjaTrader and Tradestation backtester can work only with Selected Timeframe precision
StrategyQuant User's Guide
42
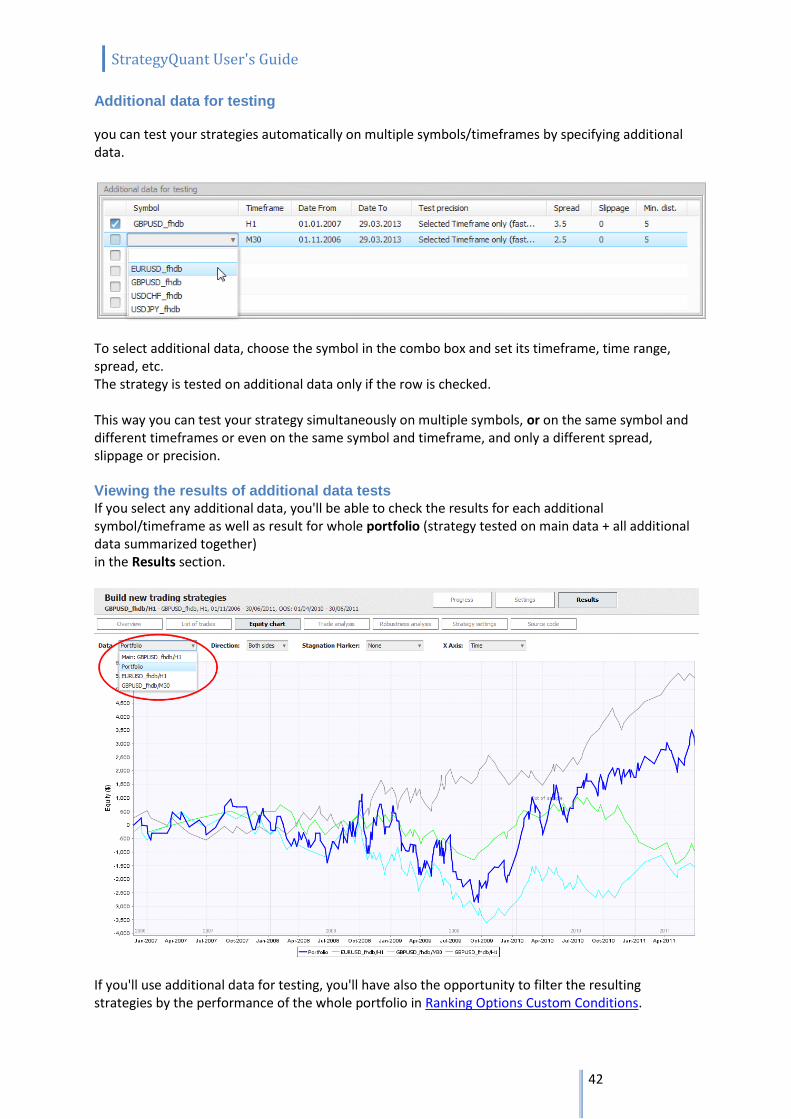
Additional data for testing
you can test your strategies automatically on multiple symbols/timeframes by specifying additional data.
To select additional data, choose the symbol in the combo box and set its timeframe, time range, spread, etc. The strategy is tested on additional data only if the row is checked. This way you can test your strategy simultaneously on multiple symbols, or on the same symbol and different timeframes or even on the same symbol and timeframe, and only a different spread, slippage or precision. Viewing the results of additional data tests
If you select any additional data, you'll be able to check the results for each additional symbol/timeframe as well as result for whole portfolio (strategy tested on main data + all additional data summarized together) in the Results section.
If you'll use additional data for testing, you'll have also the opportunity to filter the resulting strategies by the performance of the whole portfolio in Ranking Options Custom Conditions.
StrategyQuant User's Guide
43
5.2.2 Building blocks
Building blocks are the core components that are combined together to create rules for every trading
strategy.
Entry Rules Building Blocks
Entry building blocks can be divided into four main parts:
price data - Open, High, Low, Close
technical indicators -RSI, CCI, Momentum, etc.
operators that are used for comparison and to combine the rules - <, >, and, or, etc.
time constants - Hour, Minute of day, Day of week
simple predefined rules - CCI > 0, Stochastic < 50 etc.
You can choose each component that you want to use in the strategy, so you can select your favorite
indicators,
or choose for example only price data + operators if you want to generate strategies based only on
price.
Good practice
According to our experience, you can sometimes get better results if you don't check all the available
components, but narrow your choice to a smaller group of indicators or price values.
You can find description of all Entry and Exit nodes here.

StrategyQuant User's Guide
44
5.2.3 Strategy options
These settings allow you to specify the properties of the generated strategies as well as testing
conditions.
Market Sides You can choose to generate strategies that trade only to one direction (Long or Short) or to both
directions (which is standard).
You can also select that you want the entry or exit rules to be symmetrical. If they are symmetrical,
then the rules for both directions are the same, only reversed.
An example of symmetrical rules:
Go Long if CCI > 0
Go Short if CCI < 0
As an alternative, you can choose to use non-symmetrical rules, in this case the rules for Long and
Short sides will be generated independently.
An example of non-symmetrical rules:
Go Long if CCI > 0
Go Short if RSI < 0 and Momentum < 100
This settings can be used for both entry and exit rules, for example you can have symmetrical entry
rules, but non-symmetrical exit rules,
so the strategy will effectively use (for example) different stop loss and profit target for Long and
Short orders.
Trading Logic Trading logic defines the behavior of the strategy and constraints of the backtester. Because there
are two different backtesting engines (MetaTrader/NinjaTrader) there are also some parameters that
are exclusive for only one of them.
Fill Type (NinjaTrader only) Default or Liberal. It defines fill type used in backtesting. For difference between these fill types please refer to NinjaTrader help. Strict Stop Prices (NinjaTrader only) there are normally constraints for placing stop/limit orders. For example you can enter long stop order only above the actual price, and short stop only below actual price. if you set StrictStopPrices=true, it will use this standard behavior, refusing orders with price levels outside these constraints. If you set it to false, it will check if the stop order price is correct and if for example you want to enter to long stop below actual price it will instead enter at Market. So setting StrictStopPrices to false will allow your orders to enter at market if the price already went above the allowed level.

StrategyQuant User's Guide
45
Pending Orders Valid One Bar (NinjaTrader only)
if set to true, your pending orders will be valid for one bar only. They would have to be resubmitted
on every bar to be valid.
If you set it to false, pending orders are valid until they expire or until they are cancelled.
In MetaTrader pending orders are always valid until they expire.
Replace Pending Orders (MetaTrader, NinjaTrader only)
this is an important setting that has big influence on Stop and Limit orders. If set to true, the stop
orders are replaced with updated version every time there is new signal and order is still pending.
In the older versions of StrategyQuant this setting was implicitly set to false and it was hidden.
It seems that setting it to true leads to better and more successful breakout strategies, and it is
generally recommended.
Pending orders are replaced automatically for Tradestation.
Maximum Trades Per Day
you can limit maximum trades the strategy takes per day
Maximum Total Trades you can limit maximum total trades to a given number. It is usually good to use this limit and set it to some big number (1000-5000, depending on how many trades you expect during a tested period). Exit at end of day/end of range if selected, the strategy will close all position at the end of the day or end of the trading range (if defined). This way you'll have no position open overnight. Limit Signals to Time Range, Time Range From, Time Range To this limits the hours the strategy is checking for entry signal to a given time range. If used in combination with Exit At End Of Range then all open positions are closed at the end of the range. If you don't check the Exit At End Of Range then the strategy will not open new trades outside the trading range, but the already opened positions will be not closed.
Exit At End Of Range, Exit At End Of Day, Exit On Friday
three settings that manage whether trades should be closed at the end of range, day or week.
Stop Loss & Profit Target Options These settings allows you to specify whether Stop Loss and Profit Target should be mandatory in the
strategy, and what is the minimum and maximum of the SL/PT values in pips.
You can also define the desired Risk Reward ratio.
Having defined SL/PT in the strategy is the simplest and many times the most effective approach.
If you unselect the mandatory SL/PT then the randomly generated strategy can (but doesn't have to)
StrategyQuant User's Guide
46
have fixed SL/PT. It is advisable to use different exit rule if you uncheck this setting,
for example exit after X bars, otherwise the strategy will have no way to exit the trade.
Lookback periods Here you can set up the periods and coefficients used by the GB when generating the trading rules.
Maximum Period for Indicators
sets the maximum period that will be used for indicators. Usually we don't use periods bigger than
100-300 in the trading system (depending on the type of trading strategy), so it is advisable to set the
desired maximum period value.
Maximum Period for Price Patterns
this is the maximum lookback period for price patterns (Open, High, Low, Close prices). It doesn't
really make sense to set it to more than 10-20, because the older price usually has no relation with
the current market movement.
Minimum and Maximum ATR Multiple
these are coefficients that are used in adaptive Stop Loss or Profit Target, if it is based on Average
True Range value.
For example, setting Minimum to 0.5 and Maximum to 5 tells SQ that it can use minimum 0.5 * ATR
as the SL or PT value and maximum 5 * ATR as the SL or PT value.
StrategyQuant User's Guide
47
5.2.4 Genetic options
settings that affect genetic evolution.
An important thing is that there is not one ideal configuration. You can experiment with genetic
evolution settings to obtain results that you want.
Genetic Options
Population size
is the number of different strategies in one population. It should be at least 50, the ideal value will be
between 100 - 1000 or perhaps even more.
Max # of Generations
is the count of how many generations the evolution should be performed.
Mutation Probability
is the probability that a strategy will be mutated, it should be around 5-15%.
Crossover Probability
is the probability that the strategy is selected for crossover operation. Every generation there is a
crossover of strategies performed during which the two parent strategies "mate" and produce two
children. Recommended value if 95%.
Initial Population Generation
for initial population you can choose two options:
Generate random population
Initial population will be generated randomly using the predefined settings and building blocks.
Decimation coefficient
decimation means that the system generates more strategies than needed for initial population, and
then chooses only the best. For decimation coefficient is 1 it means there is no decimation.
For decimation coefficient = 2 system generates 2 x population size strategies and then chooses the
best half for the initial population.
For decimation coefficient = 3 system generates 3 x population size strategies and then chooses the
best third for the initial population.
Max tree depth
allows you to specify maximum depth of strategy conditions tree. If you don't check 'Force...' it will
be enforced only for the initial generation, subsequent generations might get trees with bigger
depths that are the result of strategy cloning and mutation.
If you check Force for all generations, then the maximum tree depth will be enforced for all
generated strategies.
StrategyQuant User's Guide
48
Use systems from databank as initial population
existing strategies can be used as initial population. These strategies have to be loaded to the Initial
population databank.
Initial Population Conditions
when generating initial population you can specify additional settings to filter bad strategies you
don't want to use. For example you can configure it to dismiss (throw away) strategies where Net
Profit is below zero or where number of trades is below certain level.
Evolution Management
this was updated in version 3.5, now it allows you to split In Sample period to two parts for 3 parts
approach and to control the evolution in more ways.
Please read 3 data parts approach for more information about the new functionality and examples.
Start again when finished
if checked, it will restart the evolution when it finished (reached maximum number of generations).
Restart when fitness stagnates for X generations
if checked, it will restart if fitness stagnates for given number of generation. Fitness is the strategy
score. If it stagnates for 5-10 generations it is usually a sign that evolution reached its potential or
went into a dead end, so it might be a good idea to just restart it.
StrategyQuant User's Guide
49
5.2.5 Money management
Money management (or position sizing) specifies how many lots or shares are traded on each trade. StrategyQuant contains three different money management options that can be used in the program and also later n real trading in MetaTrader.
Fixed size strategy will trade with fixed number of lots. This is recommended setting when you generate new strategy, because it gives you clear overview of strategy real performance.
Fixed amount strategy will risk a fixed amount of money for every trade. This is basic money management without compounding. It can be used to test real performance of strategies where Stop Loss is based on volatility (ATR), or if you want to compare the performance of strategies with different Stop Loss.
Risk fixed % of account advanced money management that is recommended for real trading. The strategy will risk a given % of equity on every trade. This is simple, but very effective money management that will allow the strategy to increase number of lots as your account grows. It is generally recommended to risk maximum 2-5% of account equity per one trade.
StrategyQuant User's Guide
50
5.2.6 Robustness tests
Robustness tests are additional tests that can be applied to your strategy. The idea behind robustness testing is to verify how well the strategy will behave when there are small changes in inputs, history data or other components of the strategy. Robust strategy should have good performance even when the input parameters are slightly changed, or when some orders are skipped. StrategyQuant allows you to use Robustness tests in a form of Monte Carlo analysis. This means that the program will run a specified number of strategy tests with given random changes. As a result you'll receive a number of output results and output equities, one for each test. You can then check these results to see how the strategy behaves when the inputs are changed, which helps you decide if you can trade such strategy.
Monte Carlo Simulation Settings
Testing the strategy with randomized input or history data provides only one alternative that can be compared to the original result. In order to get more complete picture the robustness test can be repeated, until we receive bigger set of different results. You can specify number of tests in the Number of simulations variable. The more simulations will be run, the better statistical significance of the results, but it comes at a price. Each test takes its time, so the more tests you run, the longer it will take to completely backtest the strategy. The best value of tests is between 10 and 100. Confidence level for reporting is simply a confidence level that is marked with a dark background in the Robustness analysis table (see below). Usual confidence level to use is 95%.
Types of Robustness Tests
Below is an explanation of different types of tests you can use. If more than one option is checked, the tests are combined.
Randomize Trades Order this is the simplest test, in the Exact variation it only randomly shuffles order of the trades. This doesn't change the resulting Net Profit, but it is very useful in examining different variations of Drawdown that can be a result of different order of trades. In more advanced Resampling variation of this test the trades are not just shuffled. Instead the program randomly picks total number of trades from the pool of all trades in history. The difference is that in this method the list of trades might not be the same. It can pick one trade multiple times and some other trade might not be picked at all. This will give yet another view of the system. This method will usually change both Net Profit and Drawdown and it is quite extreme test.
StrategyQuant User's Guide
51
Randomly Skip Trades it will randomly skip trades with given probability. In real trading you can often miss a trade because of platform or Internet failure, or simply because you paused trading for some time. This test will give you an idea how the equity curve might look like if some trades are randomly skipped.
Randomize Strategy Parameters every strategy uses parameters, such as period of an indicator or constant that is used in comparison. This test checks the sensitivity of the strategy to a small change of parameter value. Probability of change is a probability that any parameter changes its value. Max parameter change is the maximum percentage to which the parameter changes its value. For example if you set Max parameter change to 10%, then a parameter with value 60 can be randomly changed to a range 54 - 66 (+- 10% of its original value of 60).
Randomize Starting Bar this will test the strategy behavior when the testing starts on a different starting bar. It is obvious that a good strategy cannot be sensitive to which bar you start the test.
Randomize History Data one very common case of curve fitting is when strategy is too dependent on history data. This option checks the behavior of the strategy to a change in history data. The Probability of change sets for every bar how probable it is that open, high, low or close price will be changed. The Max price change is a percentage value of the change in relation to ATR (Average True Range). So if for example close price is randomly chosen to be changed, ATR value is 10 pips, and Max price change is 20%, then the price can change by +- 2 pips
Randomize Spread, Slippage, Min distance from price these simulations will run the test with spread, slippage or minimum distance of stop order from price randomly chosen from the given range. For information about how to use Robustness tests and how to interpret the results, check the Robustness tests and analysis section.
StrategyQuant User's Guide
52
5.2.7 Ranking options
When the strategies are generated, every new strategy is backtested on a history data and the
results of the backtest are then used to compute the Fitness (rank) of the strategy.
Fitness is number from 0 to 1 and it should reflect the "quality" of the strategy according to the given
criteria.
In this screen you can configure:
how this Fitness value is computed (Strategy Selection criteria)
how many top strategies are stored in the databank
which strategies are stored to databank and which are thrown away (Custom conditions)
Databank Options The best strategies found are continually stored into the Databank.
It is not possible to store every strategy (remember that StrategyQuant can create thousands of new
strategies every hour) so we have to specify
how many strategies should be stored in the databank, how they should be sorted to find out the
best ones and which strategies should be thrown away.
Maximum Strategies to Store in Databank
simply the maximum number of strategies remembered in the program
Dismiss strategies that have 100% duplicate orders
if checked, strategies that have exactly the same orders as some strategy in databank will be
dismissed. It is recommended to check this,
if there is a strategy with duplicate orders, it will be likely the same strategy with redundant rules.
Custom Conditions
You can define rules to throw away strategies with bad properties. For example it usually makes sense to throw away strategies that result in loss or these that have too little number of trades. Custom conditions allow you to specify your own custom rules that will be evaluated for every strategy. If the strategy matches any of the rules, it will be dismissed. This is useful to quickly dismissing strategies that result in loss or with too little number of trades.
There are separate values for In Sample and Out of Sample performance, and for Robustness Tests (if used) or Portfolio (if you used additional data).
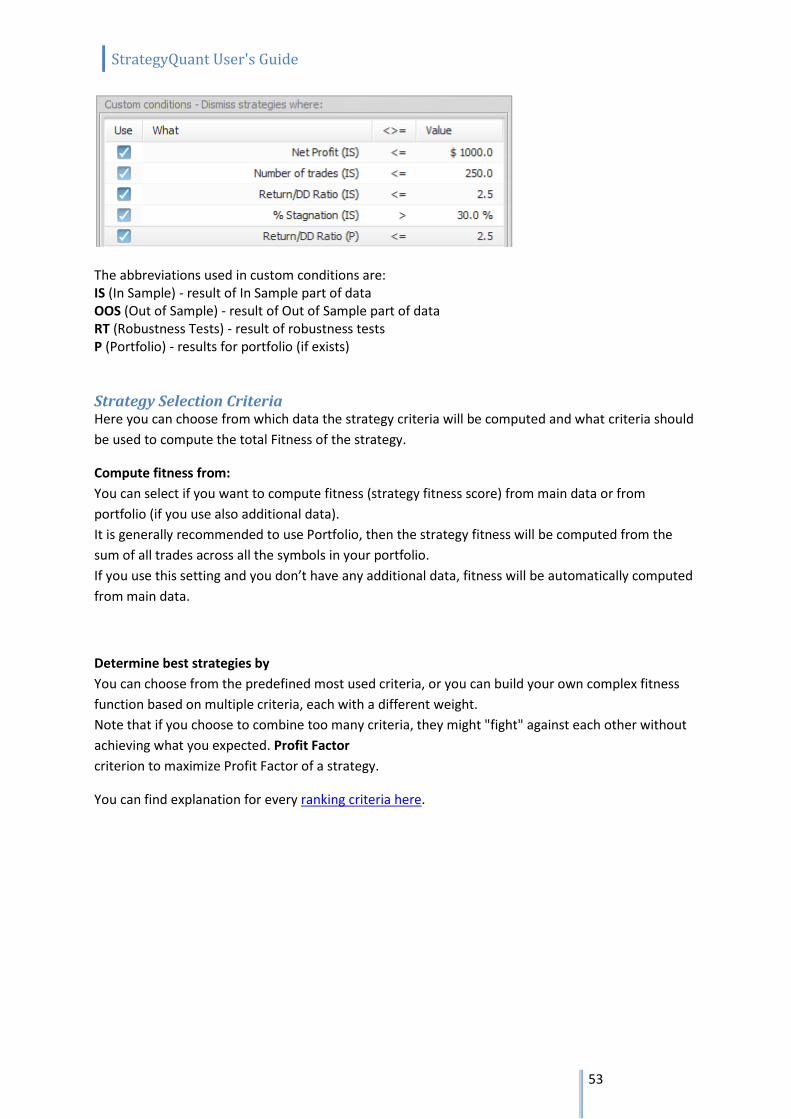
StrategyQuant User's Guide
53
The abbreviations used in custom conditions are: IS (In Sample) - result of In Sample part of data OOS (Out of Sample) - result of Out of Sample part of data RT (Robustness Tests) - result of robustness tests P (Portfolio) - results for portfolio (if exists)
Strategy Selection Criteria Here you can choose from which data the strategy criteria will be computed and what criteria should
be used to compute the total Fitness of the strategy.
Compute fitness from:
You can select if you want to compute fitness (strategy fitness score) from main data or from
portfolio (if you use also additional data).
It is generally recommended to use Portfolio, then the strategy fitness will be computed from the
sum of all trades across all the symbols in your portfolio.
If you use this setting and you don’t have any additional data, fitness will be automatically computed
from main data.
Determine best strategies by
You can choose from the predefined most used criteria, or you can build your own complex fitness
function based on multiple criteria, each with a different weight.
Note that if you choose to combine too many criteria, they might "fight" against each other without
achieving what you expected. Profit Factor
criterion to maximize Profit Factor of a strategy.
You can find explanation for every ranking criteria here.
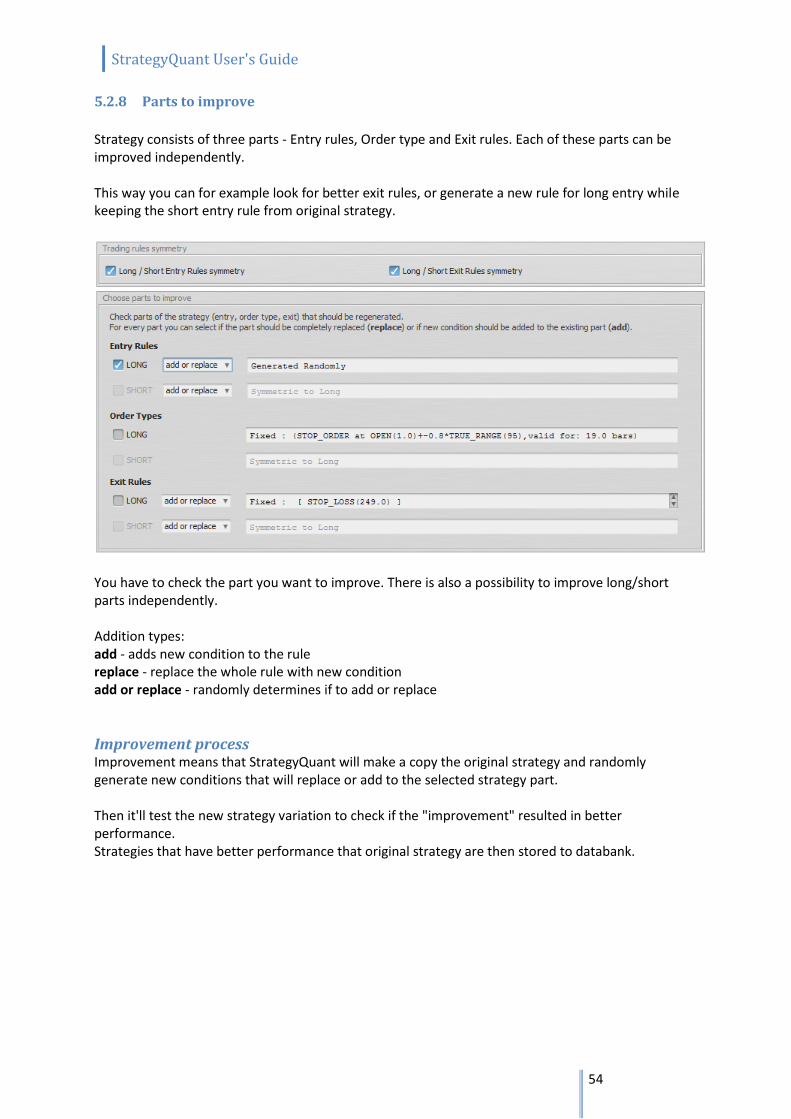
StrategyQuant User's Guide
54
5.2.8 Parts to improve
Strategy consists of three parts - Entry rules, Order type and Exit rules. Each of these parts can be improved independently. This way you can for example look for better exit rules, or generate a new rule for long entry while keeping the short entry rule from original strategy.
You have to check the part you want to improve. There is also a possibility to improve long/short parts independently. Addition types: add - adds new condition to the rule replace - replace the whole rule with new condition add or replace - randomly determines if to add or replace
Improvement process Improvement means that StrategyQuant will make a copy the original strategy and randomly generate new conditions that will replace or add to the selected strategy part. Then it'll test the new strategy variation to check if the "improvement" resulted in better performance. Strategies that have better performance that original strategy are then stored to databank.
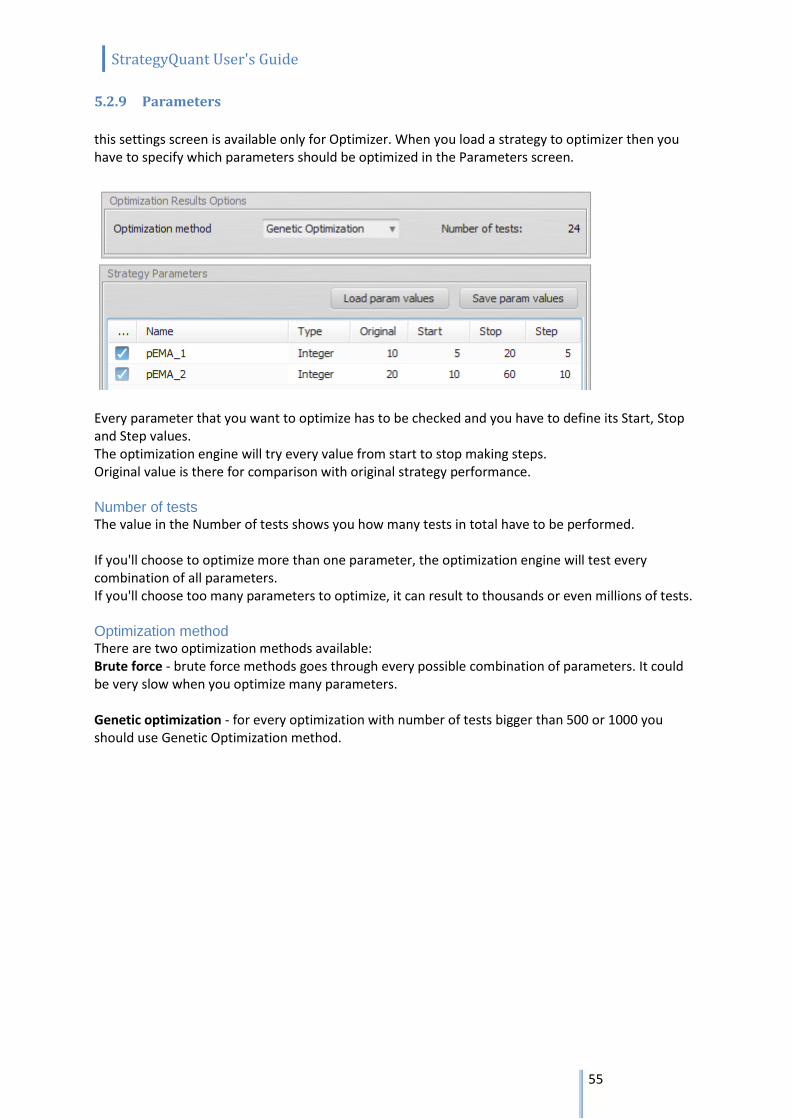
StrategyQuant User's Guide
55
5.2.9 Parameters
this settings screen is available only for Optimizer. When you load a strategy to optimizer then you have to specify which parameters should be optimized in the Parameters screen.
Every parameter that you want to optimize has to be checked and you have to define its Start, Stop and Step values. The optimization engine will try every value from start to stop making steps. Original value is there for comparison with original strategy performance. Number of tests The value in the Number of tests shows you how many tests in total have to be performed. If you'll choose to optimize more than one parameter, the optimization engine will test every combination of all parameters. If you'll choose too many parameters to optimize, it can result to thousands or even millions of tests. Optimization method There are two optimization methods available: Brute force - brute force methods goes through every possible combination of parameters. It could be very slow when you optimize many parameters. Genetic optimization - for every optimization with number of tests bigger than 500 or 1000 you should use Genetic Optimization method.
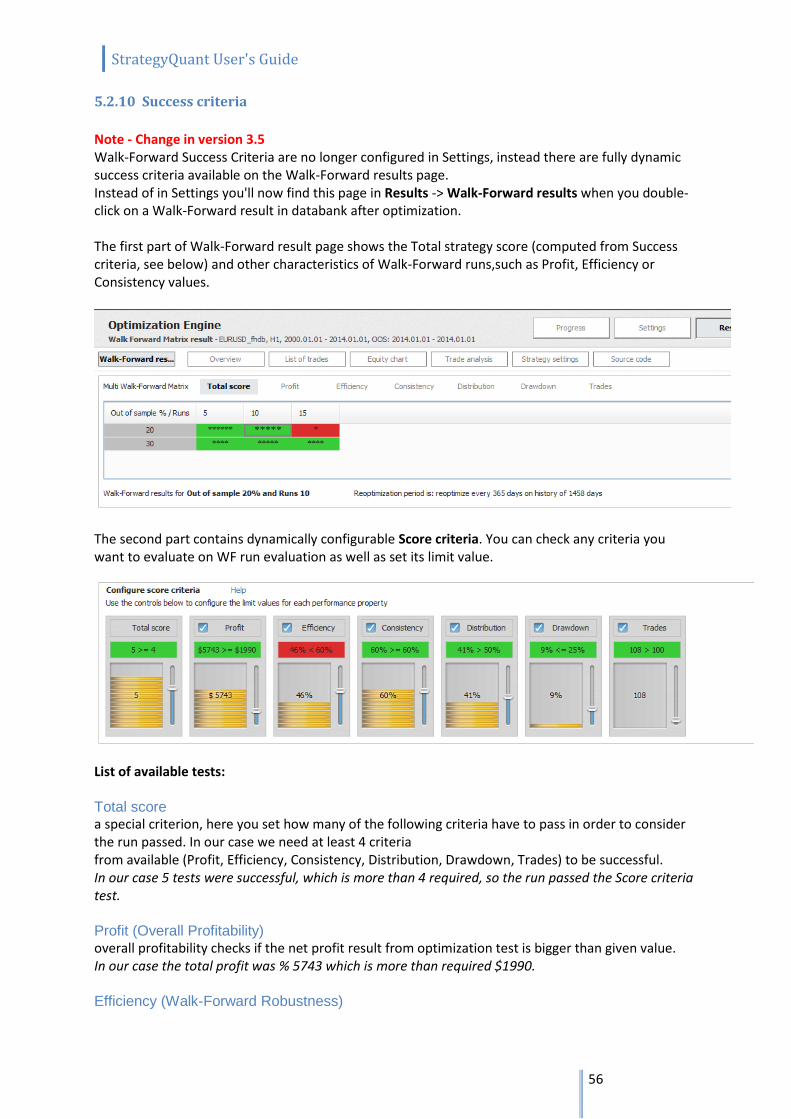
StrategyQuant User's Guide
56
5.2.10 Success criteria
Note - Change in version 3.5 Walk-Forward Success Criteria are no longer configured in Settings, instead there are fully dynamic success criteria available on the Walk-Forward results page. Instead of in Settings you'll now find this page in Results -> Walk-Forward results when you double-click on a Walk-Forward result in databank after optimization. The first part of Walk-Forward result page shows the Total strategy score (computed from Success criteria, see below) and other characteristics of Walk-Forward runs,such as Profit, Efficiency or Consistency values.
The second part contains dynamically configurable Score criteria. You can check any criteria you want to evaluate on WF run evaluation as well as set its limit value.
List of available tests: Total score a special criterion, here you set how many of the following criteria have to pass in order to consider the run passed. In our case we need at least 4 criteria from available (Profit, Efficiency, Consistency, Distribution, Drawdown, Trades) to be successful. In our case 5 tests were successful, which is more than 4 required, so the run passed the Score criteria test. Profit (Overall Profitability) overall profitability checks if the net profit result from optimization test is bigger than given value. In our case the total profit was % 5743 which is more than required $1990. Efficiency (Walk-Forward Robustness)
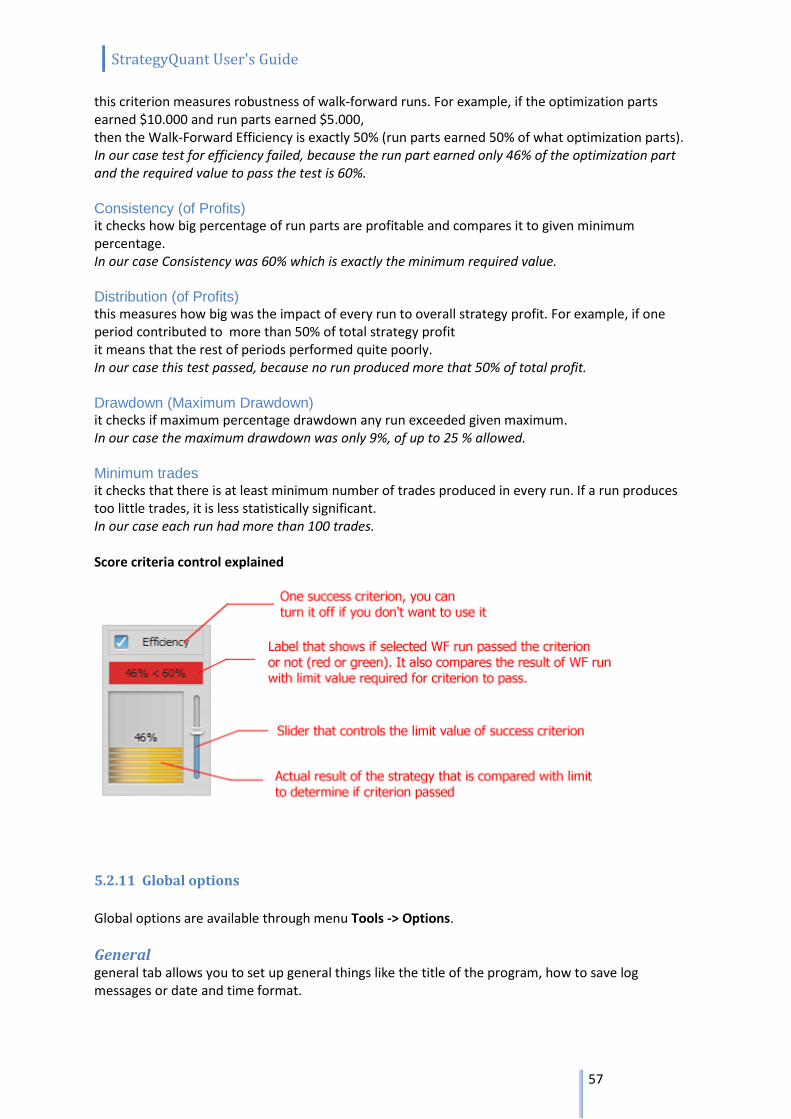
StrategyQuant User's Guide
57
this criterion measures robustness of walk-forward runs. For example, if the optimization parts earned $10.000 and run parts earned $5.000, then the Walk-Forward Efficiency is exactly 50% (run parts earned 50% of what optimization parts). In our case test for efficiency failed, because the run part earned only 46% of the optimization part and the required value to pass the test is 60%. Consistency (of Profits) it checks how big percentage of run parts are profitable and compares it to given minimum percentage. In our case Consistency was 60% which is exactly the minimum required value. Distribution (of Profits) this measures how big was the impact of every run to overall strategy profit. For example, if one period contributed to more than 50% of total strategy profit it means that the rest of periods performed quite poorly. In our case this test passed, because no run produced more that 50% of total profit. Drawdown (Maximum Drawdown) it checks if maximum percentage drawdown any run exceeded given maximum. In our case the maximum drawdown was only 9%, of up to 25 % allowed. Minimum trades it checks that there is at least minimum number of trades produced in every run. If a run produces too little trades, it is less statistically significant. In our case each run had more than 100 trades. Score criteria control explained
5.2.11 Global options
Global options are available through menu Tools -> Options.
General general tab allows you to set up general things like the title of the program, how to save log messages or date and time format.
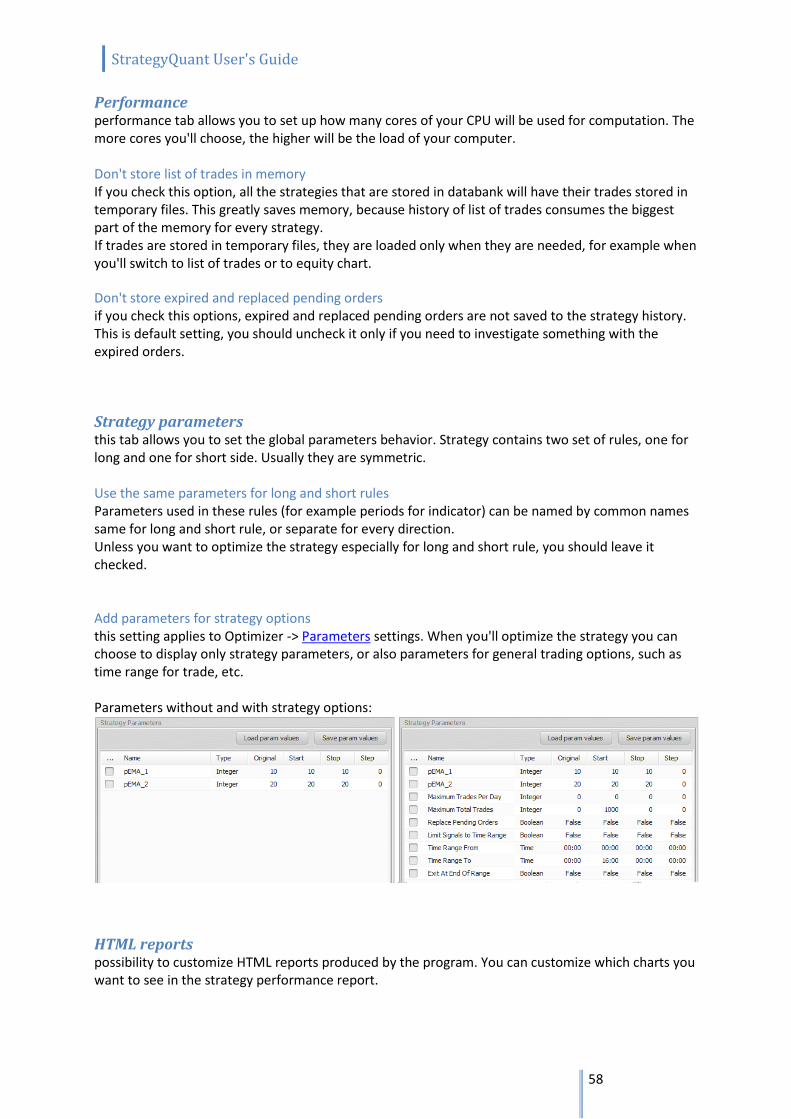
StrategyQuant User's Guide
58
Performance performance tab allows you to set up how many cores of your CPU will be used for computation. The more cores you'll choose, the higher will be the load of your computer. Don't store list of trades in memory If you check this option, all the strategies that are stored in databank will have their trades stored in temporary files. This greatly saves memory, because history of list of trades consumes the biggest part of the memory for every strategy. If trades are stored in temporary files, they are loaded only when they are needed, for example when you'll switch to list of trades or to equity chart. Don't store expired and replaced pending orders if you check this options, expired and replaced pending orders are not saved to the strategy history. This is default setting, you should uncheck it only if you need to investigate something with the expired orders.
Strategy parameters this tab allows you to set the global parameters behavior. Strategy contains two set of rules, one for long and one for short side. Usually they are symmetric. Use the same parameters for long and short rules Parameters used in these rules (for example periods for indicator) can be named by common names same for long and short rule, or separate for every direction. Unless you want to optimize the strategy especially for long and short rule, you should leave it checked. Add parameters for strategy options this setting applies to Optimizer -> Parameters settings. When you'll optimize the strategy you can choose to display only strategy parameters, or also parameters for general trading options, such as time range for trade, etc. Parameters without and with strategy options:
HTML reports possibility to customize HTML reports produced by the program. You can customize which charts you want to see in the strategy performance report.

StrategyQuant User's Guide
59
5.3 Results
5.3.1 Databanks
Databank is a storage place where the generated/tested strategies are stored with their results.
Each mode (Build/Test/Improve/Optimize) has its own independent databank table.
For memory reasons Databank cannot keep unlimited number of strategies, instead it stores the
selected number of top strategies, for example top 100 or top 1000 strategies.
The configuration how many strategies to store in the Databank and how to sort them can be set in
the Settings -> Ranking Options
Databank functions Every strategy result in the Databank can be viewed in the Results screen by using double-click.
Load this button is available only in Retest databank, it loads Strategy projects (.str files) so they can be
retested.
Save (as Strategy/Portfolio/HTML report/Source code) this way you can save your strategy, you should always save good strategies to a Strategy Project (.str) so that you can work with them later. Edit (Parameters/Trading rules)
here you can manually edit the selected strategy - either the values of its parameters or the trading
rules.
Delete/Clear all this will delete selected or all strategies from the list Create portfolio it will combine selected strategies to a portfolio - a special report that combines trading results of multiple strategies. You can then check/analyze the results of whole portfolio of strategies. Views Each row in the table represents one strategy plus, the results of the strategy backtest - number of
trades, total profit/loss, Fitness score, etc. are visible in the table columns.
Results are divided into In Sample and Out of Sample parts.
StrategyQuant User's Guide
60
All the columns in the databank are customizable, you can choose which columns you want to see
using views.
Export to CSV you can also export the whole table content to a CSV file
5.3.2 Overview
Overview screen displays various statistics computed from the backtest data.
5.3.3 List of trades
Contains complete list of trades generated by the backtest. If you backtested your strategy on multiple symbols/timeframes, you can switch between the results or check the list of trades for whole portfolio.
5.3.4 Equity chart
Displays equity chart of the strategy. Stagnation marker shows the maximum stagnation period - this is the longest period that it took strategy to make new high on the equity. In case of portfolio, it displays charts for every symbol/timeframe tested, plus equity of complete portfolio.
5.3.5 Trade analysis
This screen displays yearly performance of the strategy plus configurable small charts with trades per hour, day of week, day of month, etc.
5.3.6 Robustness analysis
This screen is empty if you didn't configure any Robustness Tests. Otherwise it contains equity chart for every robustness test simulation and table of important confidence levels computed using Monte Carlo analysis of simulations. For information about how to use Robustness tests and how to interpret the results, check the Robustness tests and analysis section.
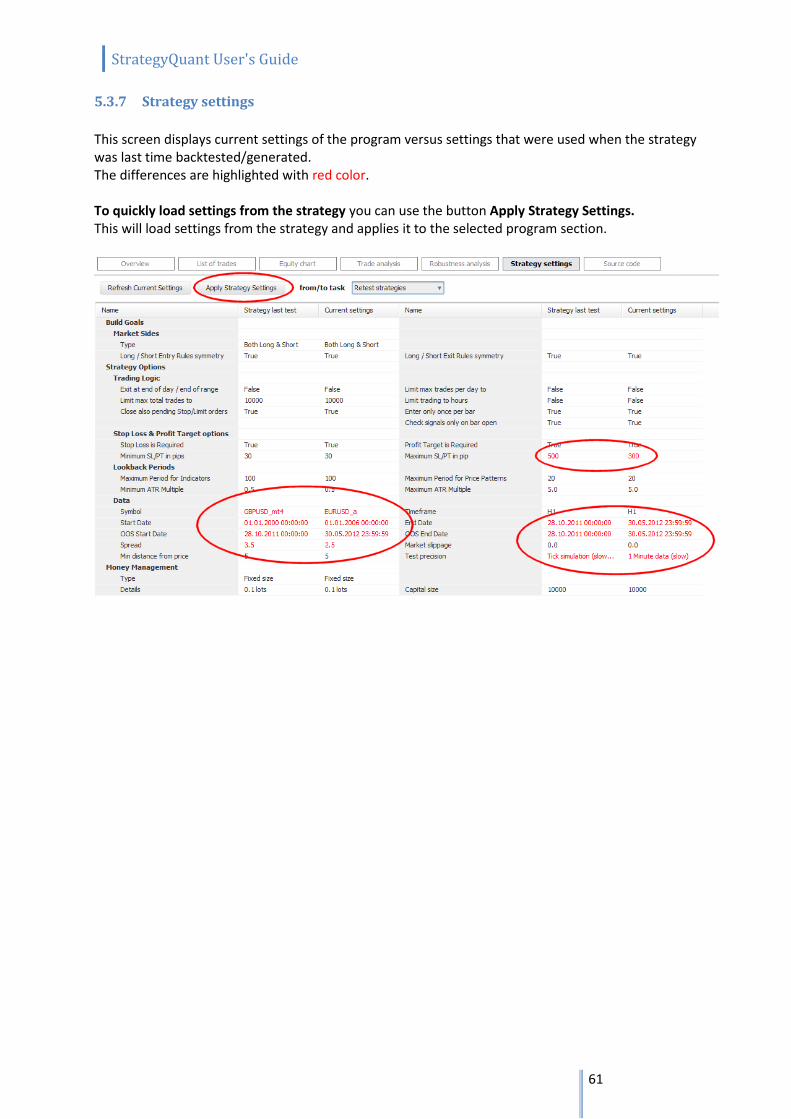
StrategyQuant User's Guide
61
5.3.7 Strategy settings
This screen displays current settings of the program versus settings that were used when the strategy was last time backtested/generated. The differences are highlighted with red color. To quickly load settings from the strategy you can use the button Apply Strategy Settings. This will load settings from the strategy and applies it to the selected program section.
StrategyQuant User's Guide
62
5.3.8 Source code
Source code tab is where you'll get the result of the program. For every selected strategy it generates selected source code. Source Code Type There are three types of source code that can be generated: Pseudo Code human readable pseudo code of the strategy. You can see the strategy logic and you can use it for manual trading. MetaTrader4 Expert Advisor the EA code for MetaTrader. You can save the EA code to MetaTrader/experts directory and you'll be able to run your new EA in MetaTrader. MT4 Special EA - Trade on Bar Open special version of MetaTrader4 EA - it checks for signals and places trades only at the open of a bar. This is valid not only for opening the trade, but also for closing the trade on stop loss or profit target. If the trade reaches its stop loss or profit target, it is NOT closed immediately at this level, but at the open of the next bar! EA generated this way will be 100% compatible with the strategy tested in SQ using the Trade on Bar Open test precision. NinjaTrader code Strategy code for NinjaTrader. You can copy & paste the code into new NinjaTrader strategy. Check more about this in section Exporting the strategy from StrategyQuant to NinjaTrader
EasyLanguage code for Tardestation/MultiCharts Strategy code for NinjaTrader. You can copy & paste the code into new NinjaTrader strategy. Check more about this in section Exporting the strategy from StrategyQuant to Tradestation
Put values to parameters by checking this checkbox you can generate code where all the number constants like indicator periods, comparison constants etc. will be parameterized - a parameter will be added for every constant. This will allow you to optimize your EA in MetaTrader, or test it with different parameter values.
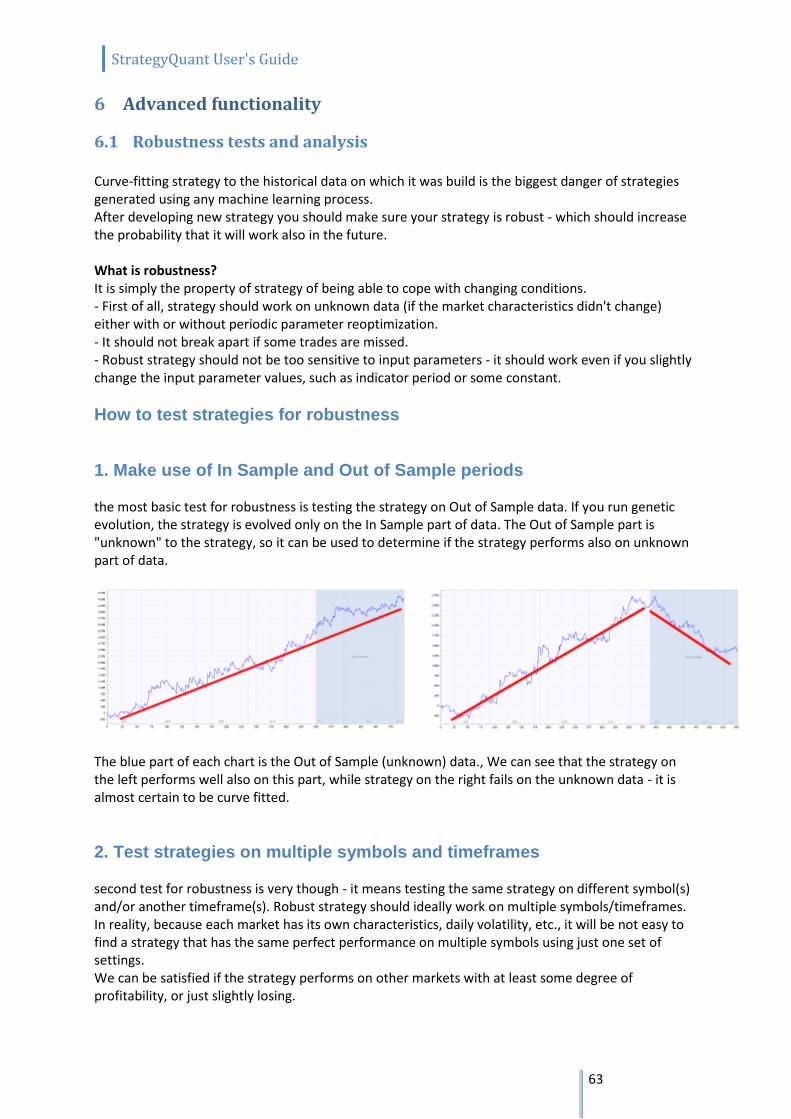
StrategyQuant User's Guide
63
6 Advanced functionality
6.1 Robustness tests and analysis Curve-fitting strategy to the historical data on which it was build is the biggest danger of strategies generated using any machine learning process. After developing new strategy you should make sure your strategy is robust - which should increase the probability that it will work also in the future. What is robustness? It is simply the property of strategy of being able to cope with changing conditions. - First of all, strategy should work on unknown data (if the market characteristics didn't change) either with or without periodic parameter reoptimization. - It should not break apart if some trades are missed. - Robust strategy should not be too sensitive to input parameters - it should work even if you slightly change the input parameter values, such as indicator period or some constant.
How to test strategies for robustness
1. Make use of In Sample and Out of Sample periods the most basic test for robustness is testing the strategy on Out of Sample data. If you run genetic evolution, the strategy is evolved only on the In Sample part of data. The Out of Sample part is "unknown" to the strategy, so it can be used to determine if the strategy performs also on unknown part of data.
The blue part of each chart is the Out of Sample (unknown) data., We can see that the strategy on the left performs well also on this part, while strategy on the right fails on the unknown data - it is almost certain to be curve fitted.
2. Test strategies on multiple symbols and timeframes second test for robustness is very though - it means testing the same strategy on different symbol(s) and/or another timeframe(s). Robust strategy should ideally work on multiple symbols/timeframes. In reality, because each market has its own characteristics, daily volatility, etc., it will be not easy to find a strategy that has the same perfect performance on multiple symbols using just one set of settings. We can be satisfied if the strategy performs on other markets with at least some degree of profitability, or just slightly losing.
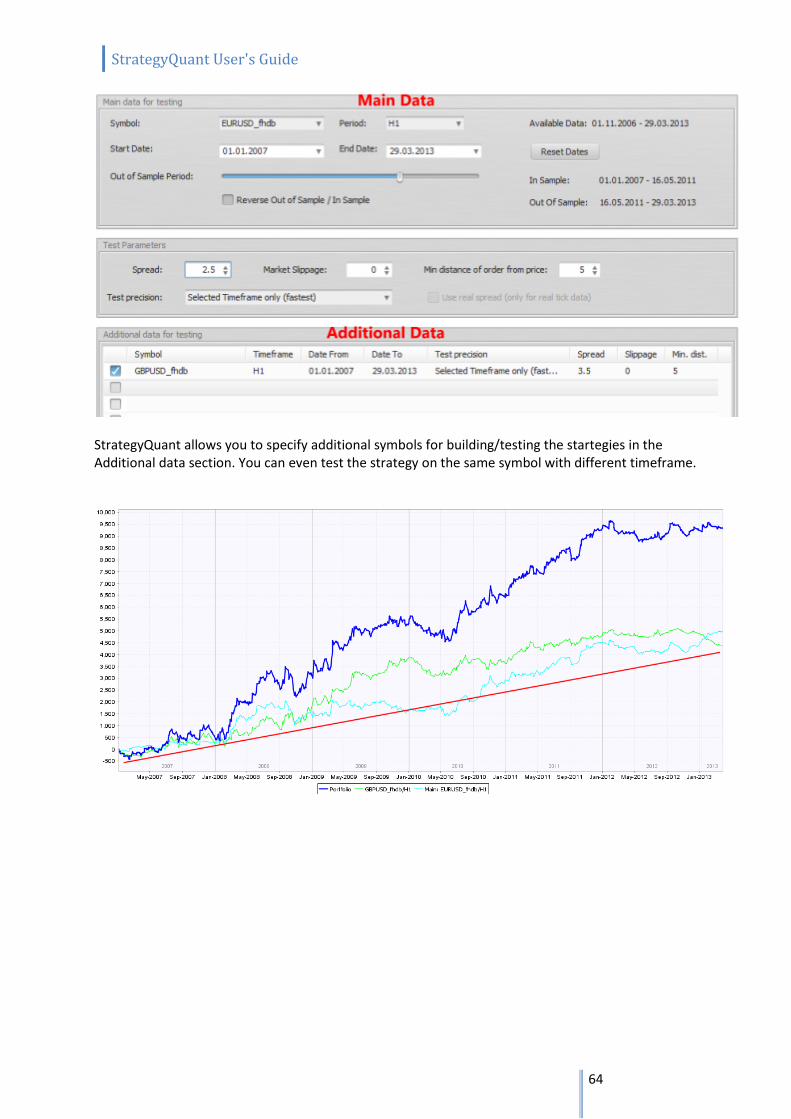
StrategyQuant User's Guide
64
StrategyQuant allows you to specify additional symbols for building/testing the startegies in the Additional data section. You can even test the strategy on the same symbol with different timeframe.
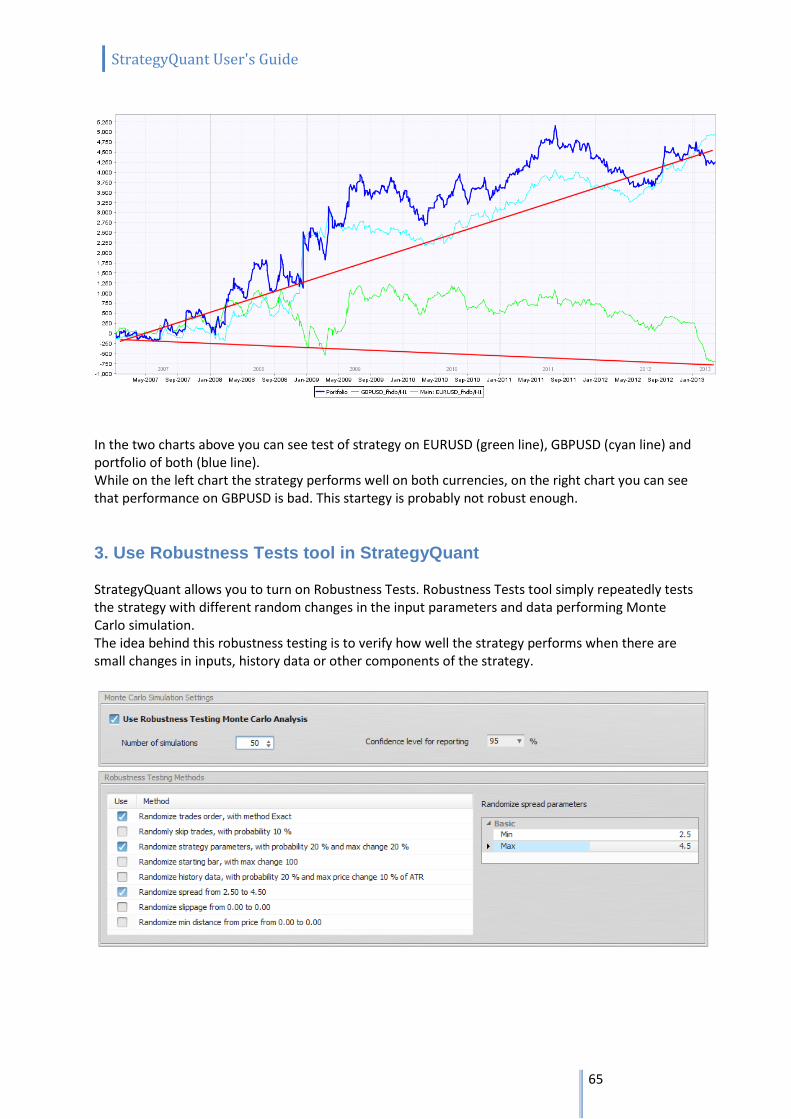
StrategyQuant User's Guide
65
In the two charts above you can see test of strategy on EURUSD (green line), GBPUSD (cyan line) and portfolio of both (blue line). While on the left chart the strategy performs well on both currencies, on the right chart you can see that performance on GBPUSD is bad. This startegy is probably not robust enough.
3. Use Robustness Tests tool in StrategyQuant StrategyQuant allows you to turn on Robustness Tests. Robustness Tests tool simply repeatedly tests the strategy with different random changes in the input parameters and data performing Monte Carlo simulation. The idea behind this robustness testing is to verify how well the strategy performs when there are small changes in inputs, history data or other components of the strategy.
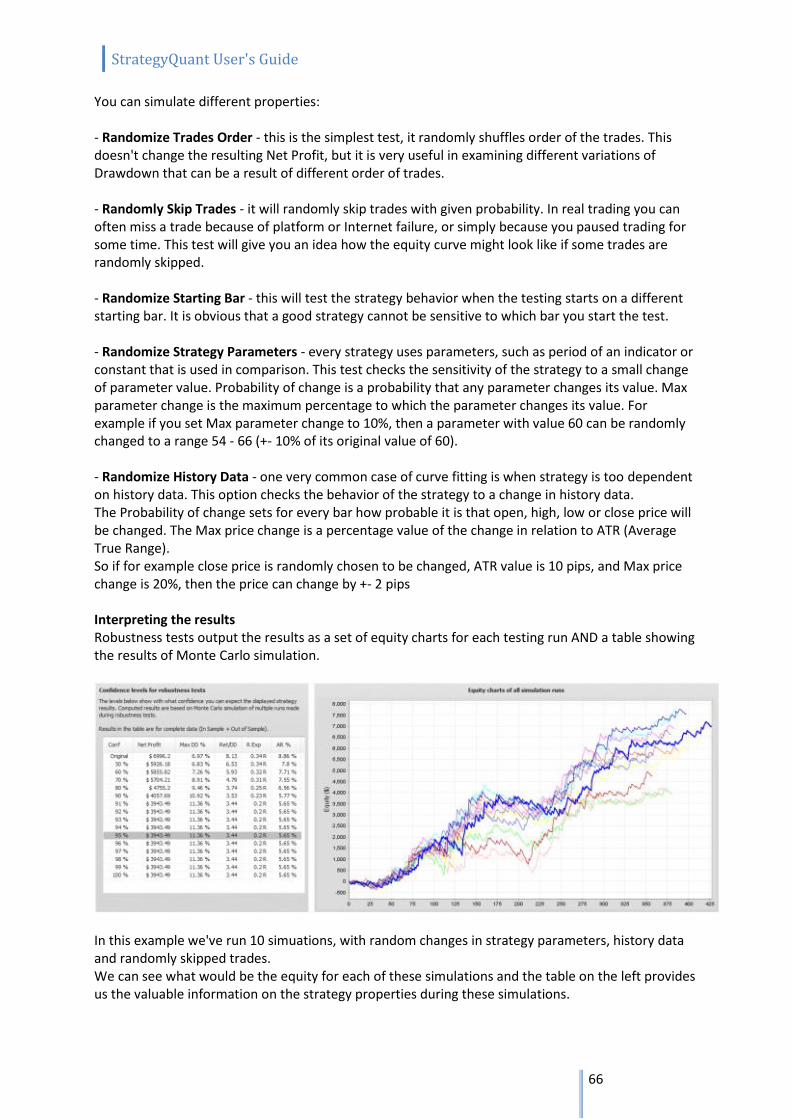
StrategyQuant User's Guide
66
You can simulate different properties: - Randomize Trades Order - this is the simplest test, it randomly shuffles order of the trades. This doesn't change the resulting Net Profit, but it is very useful in examining different variations of Drawdown that can be a result of different order of trades. - Randomly Skip Trades - it will randomly skip trades with given probability. In real trading you can often miss a trade because of platform or Internet failure, or simply because you paused trading for some time. This test will give you an idea how the equity curve might look like if some trades are randomly skipped. - Randomize Starting Bar - this will test the strategy behavior when the testing starts on a different starting bar. It is obvious that a good strategy cannot be sensitive to which bar you start the test. - Randomize Strategy Parameters - every strategy uses parameters, such as period of an indicator or constant that is used in comparison. This test checks the sensitivity of the strategy to a small change of parameter value. Probability of change is a probability that any parameter changes its value. Max parameter change is the maximum percentage to which the parameter changes its value. For example if you set Max parameter change to 10%, then a parameter with value 60 can be randomly changed to a range 54 - 66 (+- 10% of its original value of 60). - Randomize History Data - one very common case of curve fitting is when strategy is too dependent on history data. This option checks the behavior of the strategy to a change in history data. The Probability of change sets for every bar how probable it is that open, high, low or close price will be changed. The Max price change is a percentage value of the change in relation to ATR (Average True Range). So if for example close price is randomly chosen to be changed, ATR value is 10 pips, and Max price change is 20%, then the price can change by +- 2 pips Interpreting the results Robustness tests output the results as a set of equity charts for each testing run AND a table showing the results of Monte Carlo simulation.
In this example we've run 10 simuations, with random changes in strategy parameters, history data and randomly skipped trades. We can see what would be the equity for each of these simulations and the table on the left provides us the valuable information on the strategy properties during these simulations.
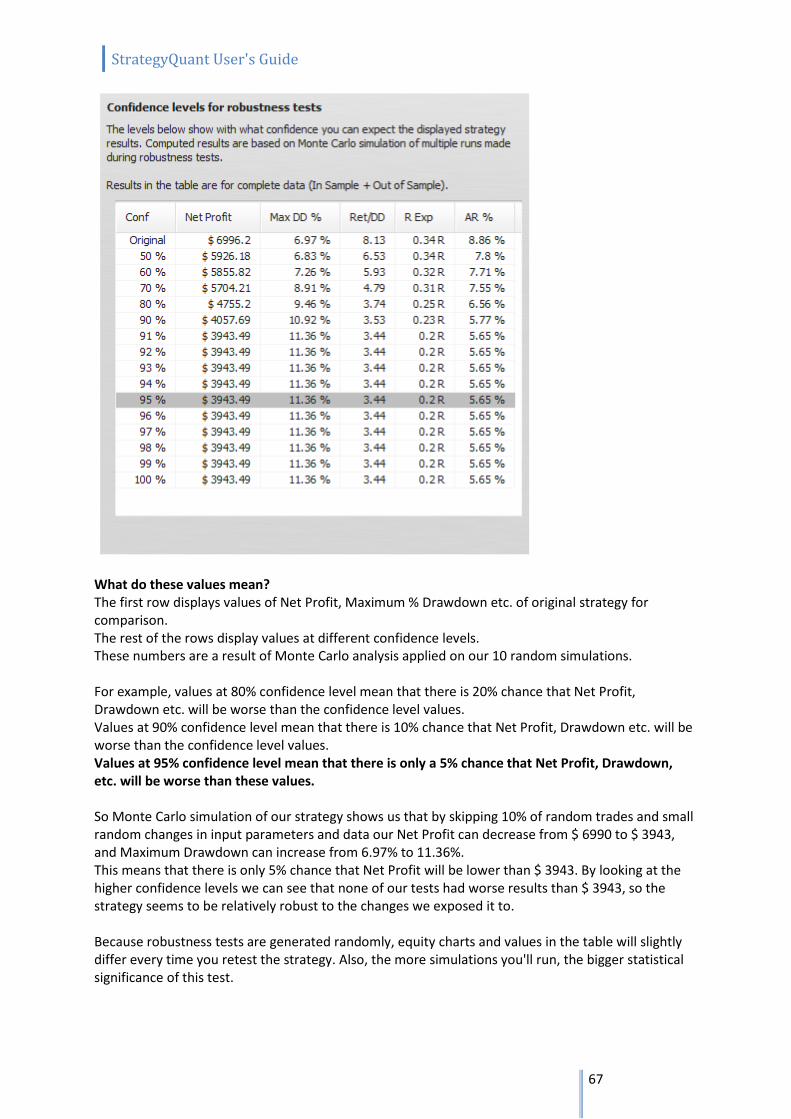
StrategyQuant User's Guide
67
What do these values mean? The first row displays values of Net Profit, Maximum % Drawdown etc. of original strategy for comparison. The rest of the rows display values at different confidence levels. These numbers are a result of Monte Carlo analysis applied on our 10 random simulations. For example, values at 80% confidence level mean that there is 20% chance that Net Profit, Drawdown etc. will be worse than the confidence level values. Values at 90% confidence level mean that there is 10% chance that Net Profit, Drawdown etc. will be worse than the confidence level values. Values at 95% confidence level mean that there is only a 5% chance that Net Profit, Drawdown, etc. will be worse than these values. So Monte Carlo simulation of our strategy shows us that by skipping 10% of random trades and small random changes in input parameters and data our Net Profit can decrease from $ 6990 to $ 3943, and Maximum Drawdown can increase from 6.97% to 11.36%. This means that there is only 5% chance that Net Profit will be lower than $ 3943. By looking at the higher confidence levels we can see that none of our tests had worse results than $ 3943, so the strategy seems to be relatively robust to the changes we exposed it to. Because robustness tests are generated randomly, equity charts and values in the table will slightly differ every time you retest the strategy. Also, the more simulations you'll run, the bigger statistical significance of this test.
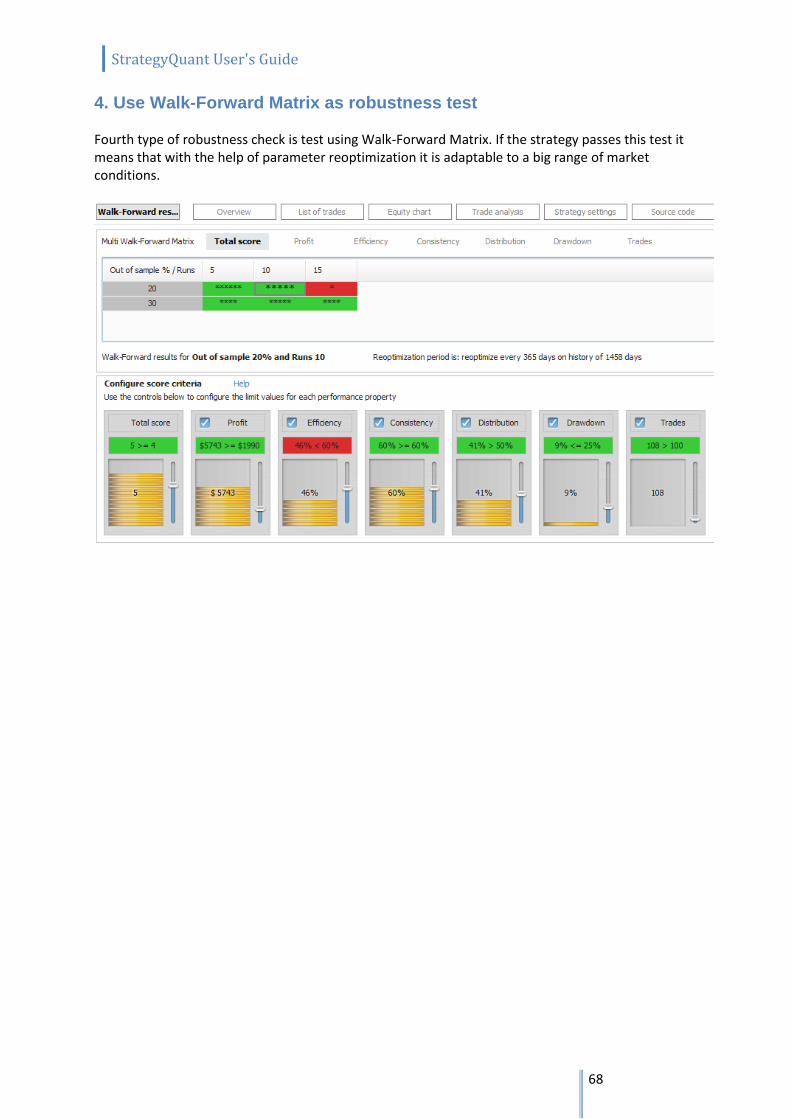
StrategyQuant User's Guide
68
4. Use Walk-Forward Matrix as robustness test Fourth type of robustness check is test using Walk-Forward Matrix. If the strategy passes this test it means that with the help of parameter reoptimization it is adaptable to a big range of market conditions.

StrategyQuant User's Guide
69
6.2 Optimization
6.2.1 Simple optimization
The idea behind an optimization is simple. First you have to have a trading system, this may be a simple moving average crossover for example. In almost every system there are some parameters (indicator periods, comparative constants, etc.) that decide how given system behave. The optimization means to test the system with different parameter values to find the optimal values of these parameters (giving highest profit or best Return/DD ratio).
Optimization example
Step 1: Loading a strategy for optimization First of all, you have to switch to Optimizer window and load the strategy you want to optimize.
For this example we'll use simple EMA_Cross strategy that goes long when faster EMA crosses above slower EMA, and go short when faster EMA crosses below slower EMA. After you loaded the strategy, it is added also as Original strategy to the Optimization results databank. You can double click on the Original strategy and then go to Results -> Source code to see its rules.
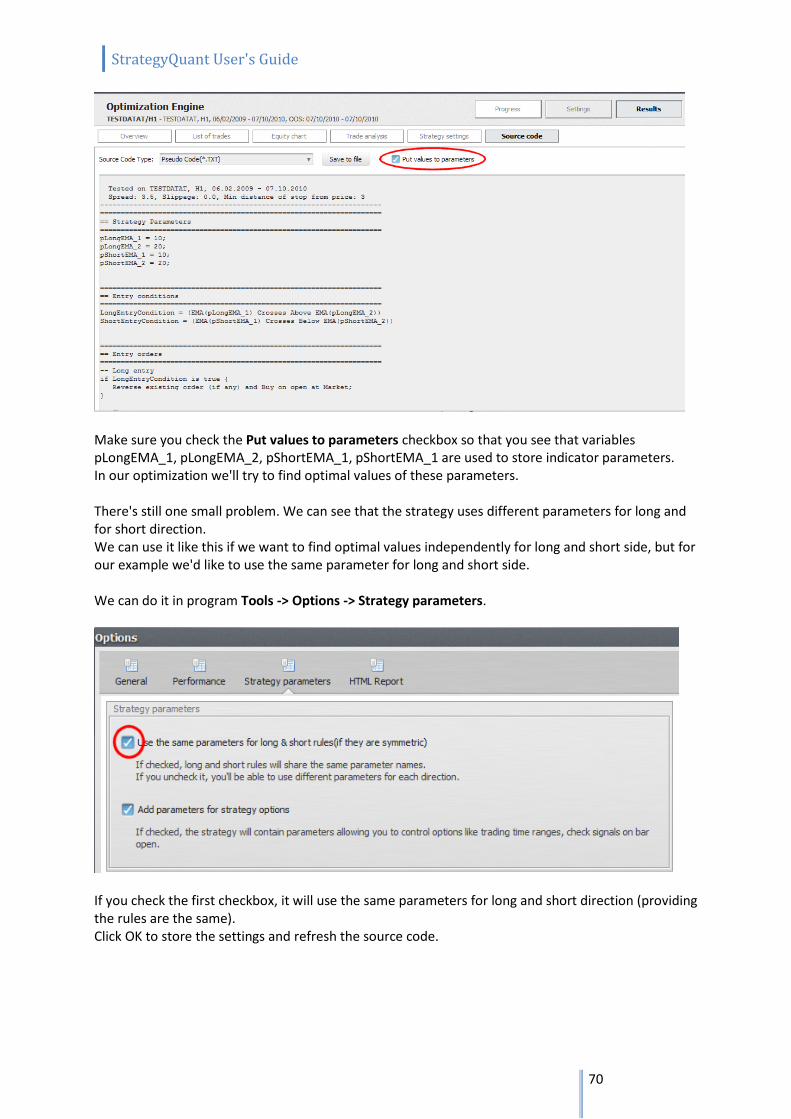
StrategyQuant User's Guide
70
Make sure you check the Put values to parameters checkbox so that you see that variables pLongEMA_1, pLongEMA_2, pShortEMA_1, pShortEMA_1 are used to store indicator parameters. In our optimization we'll try to find optimal values of these parameters. There's still one small problem. We can see that the strategy uses different parameters for long and for short direction. We can use it like this if we want to find optimal values independently for long and short side, but for our example we'd like to use the same parameter for long and short side. We can do it in program Tools -> Options -> Strategy parameters.
If you check the first checkbox, it will use the same parameters for long and short direction (providing the rules are the same). Click OK to store the settings and refresh the source code.
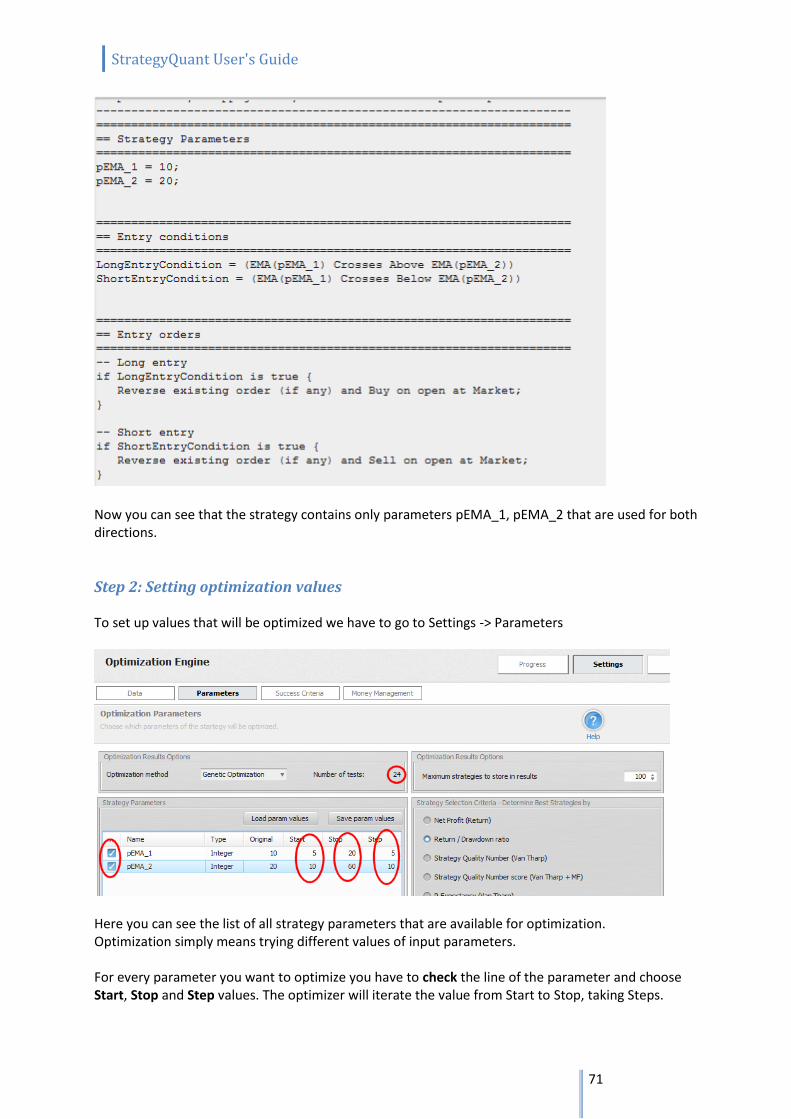
StrategyQuant User's Guide
71
Now you can see that the strategy contains only parameters pEMA_1, pEMA_2 that are used for both directions.
Step 2: Setting optimization values To set up values that will be optimized we have to go to Settings -> Parameters
Here you can see the list of all strategy parameters that are available for optimization. Optimization simply means trying different values of input parameters. For every parameter you want to optimize you have to check the line of the parameter and choose Start, Stop and Step values. The optimizer will iterate the value from Start to Stop, taking Steps.
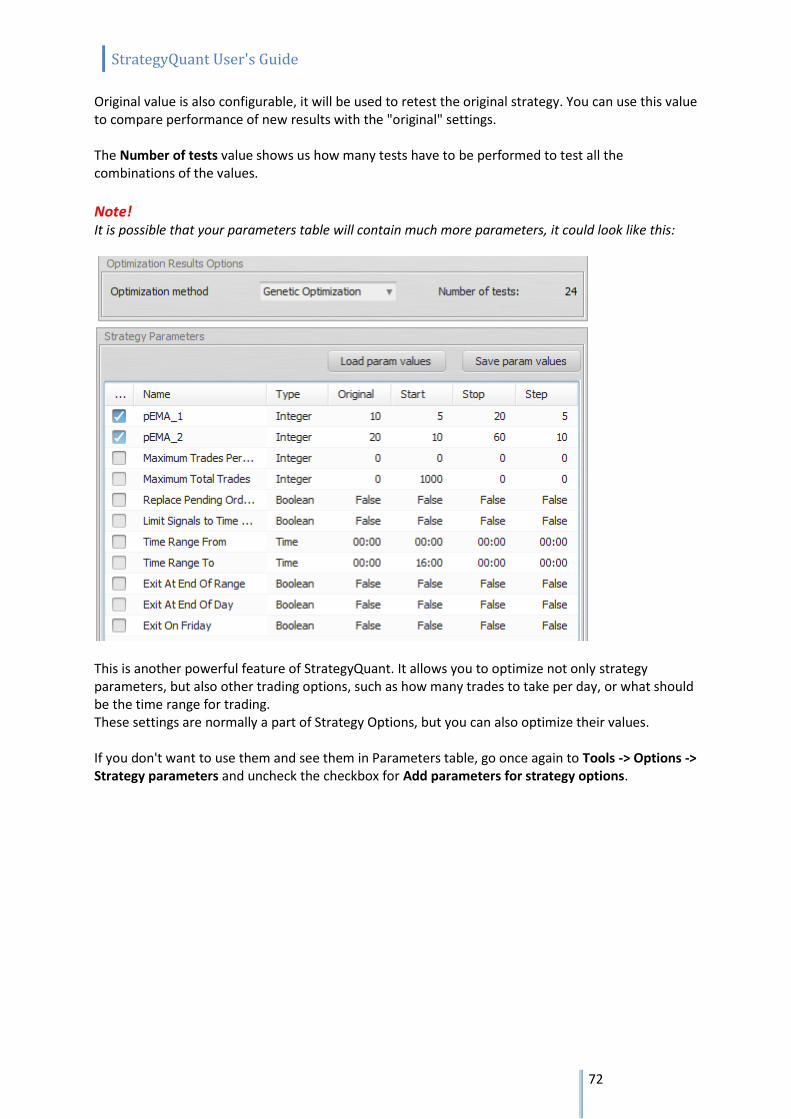
StrategyQuant User's Guide
72
Original value is also configurable, it will be used to retest the original strategy. You can use this value to compare performance of new results with the "original" settings. The Number of tests value shows us how many tests have to be performed to test all the combinations of the values.
Note! It is possible that your parameters table will contain much more parameters, it could look like this:
This is another powerful feature of StrategyQuant. It allows you to optimize not only strategy parameters, but also other trading options, such as how many trades to take per day, or what should be the time range for trading. These settings are normally a part of Strategy Options, but you can also optimize their values. If you don't want to use them and see them in Parameters table, go once again to Tools -> Options -> Strategy parameters and uncheck the checkbox for Add parameters for strategy options.
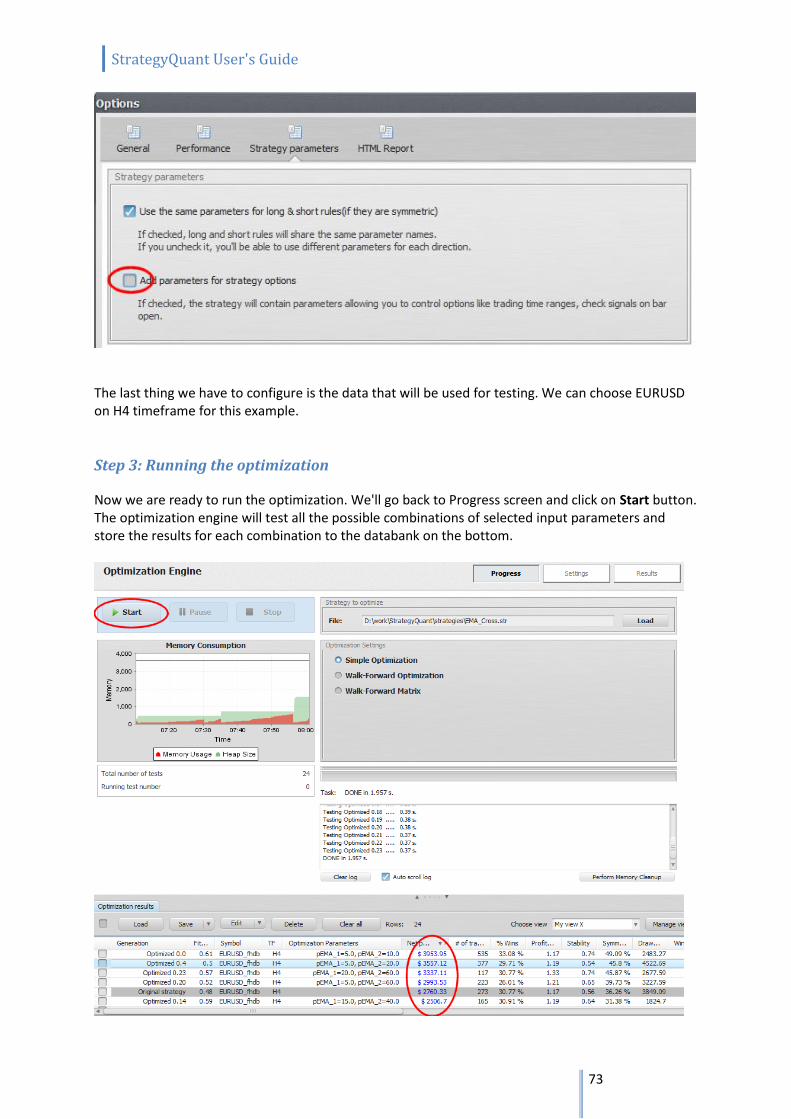
StrategyQuant User's Guide
73
The last thing we have to configure is the data that will be used for testing. We can choose EURUSD on H4 timeframe for this example.
Step 3: Running the optimization Now we are ready to run the optimization. We'll go back to Progress screen and click on Start button. The optimization engine will test all the possible combinations of selected input parameters and store the results for each combination to the databank on the bottom.

StrategyQuant User's Guide
74
We can sort the databank by Net Profit and we can see that the best input values in terms of maximum profit are pEMA_1= 5 and pEMA_2 = 10. We can also see the results of original strategy (gray background) that used pEMA_1= 10 and pEMA_2 = 20 Interpreting the results
Now we've got input parameters that were optimized for our given symbol and timeframe. What we've really done is we found out what worked best in the past. We have to be very careful because the parameters might be ideal for the history data, but there is no guarantee that what worked best on history data will work also in the future. It is called curve fitting - usually the more parameters the strategy has, the bigger is the danger of curve fitting. There are two approaches to curve fitting:
make sure the strategy is robust and not optimizing its values at all
make sure the strategy benefits from periodic reoptimization So the question is - will periodical reoptimization improve the results of my strategy? If yes, how often should I do it? StrategyQuant can give you answers to these questions using another of its advanced functionality - Walk-Forward Optimization and Walk-Forward Matrix.
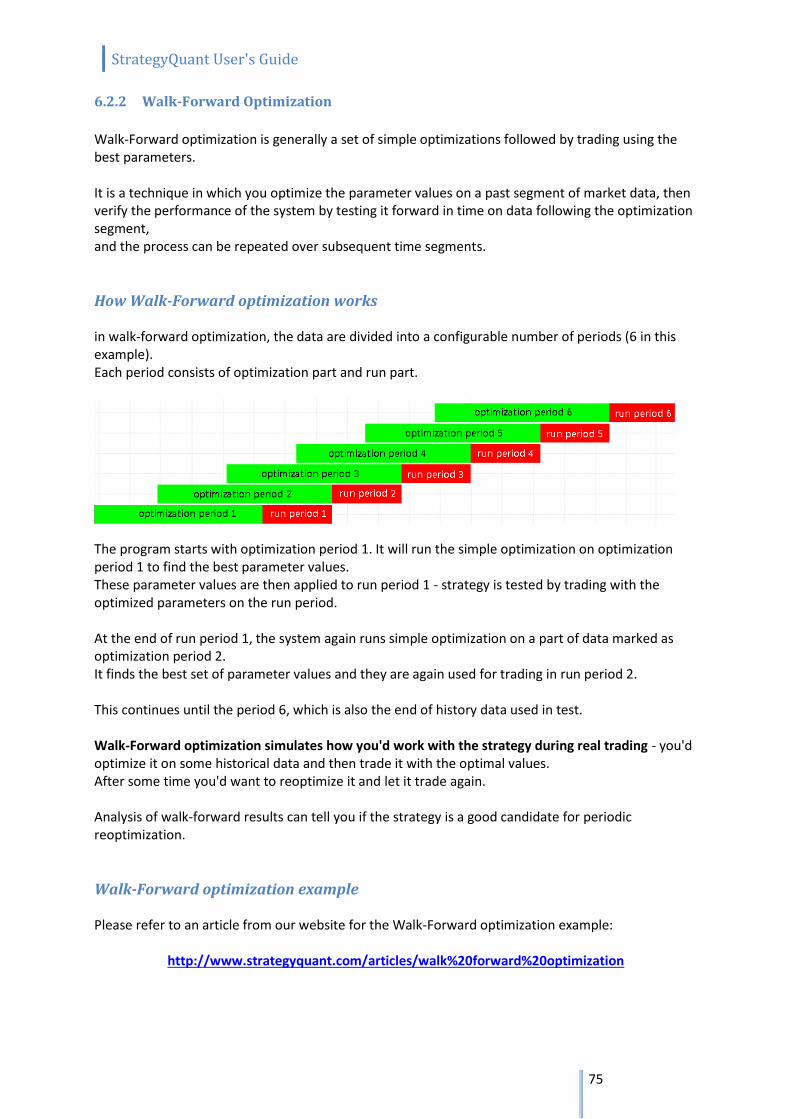
StrategyQuant User's Guide
75
6.2.2 Walk-Forward Optimization
Walk-Forward optimization is generally a set of simple optimizations followed by trading using the best parameters. It is a technique in which you optimize the parameter values on a past segment of market data, then verify the performance of the system by testing it forward in time on data following the optimization segment, and the process can be repeated over subsequent time segments.
How Walk-Forward optimization works in walk-forward optimization, the data are divided into a configurable number of periods (6 in this example). Each period consists of optimization part and run part.
The program starts with optimization period 1. It will run the simple optimization on optimization period 1 to find the best parameter values. These parameter values are then applied to run period 1 - strategy is tested by trading with the optimized parameters on the run period. At the end of run period 1, the system again runs simple optimization on a part of data marked as optimization period 2. It finds the best set of parameter values and they are again used for trading in run period 2. This continues until the period 6, which is also the end of history data used in test. Walk-Forward optimization simulates how you'd work with the strategy during real trading - you'd optimize it on some historical data and then trade it with the optimal values. After some time you'd want to reoptimize it and let it trade again. Analysis of walk-forward results can tell you if the strategy is a good candidate for periodic reoptimization.
Walk-Forward optimization example Please refer to an article from our website for the Walk-Forward optimization example:
http://www.strategyquant.com/articles/walk%20forward%20optimization
StrategyQuant User's Guide
76
6.2.3 Walk-Forward Matrix
Walk-Forward Matrix is a powerful feature that can help you with two things: 1. Find the optimal period for strategy reoptimization it will help you identify the best optimization frequency 2. Test the strategy for robustness if the strategy passes Walk-Forward Matrix test it means that with the help of parameter reoptimization it is adaptable to a big range of market conditions. Standard Walk-Forward optimization tests the strategy results if it is periodically reoptimized, let's say every 300 days. But how do we know how often it is the best to reoptimize the strategy? We can only guess, unless we'll use Walk-Forward Matrix that will test various combinations of reoptimization periods.
Walk-Forward Matrix example Please refer to an article from our website for the Walk-Forward optimization example:
http://www.strategyquant.com/articles/walk%20forward%20matrix
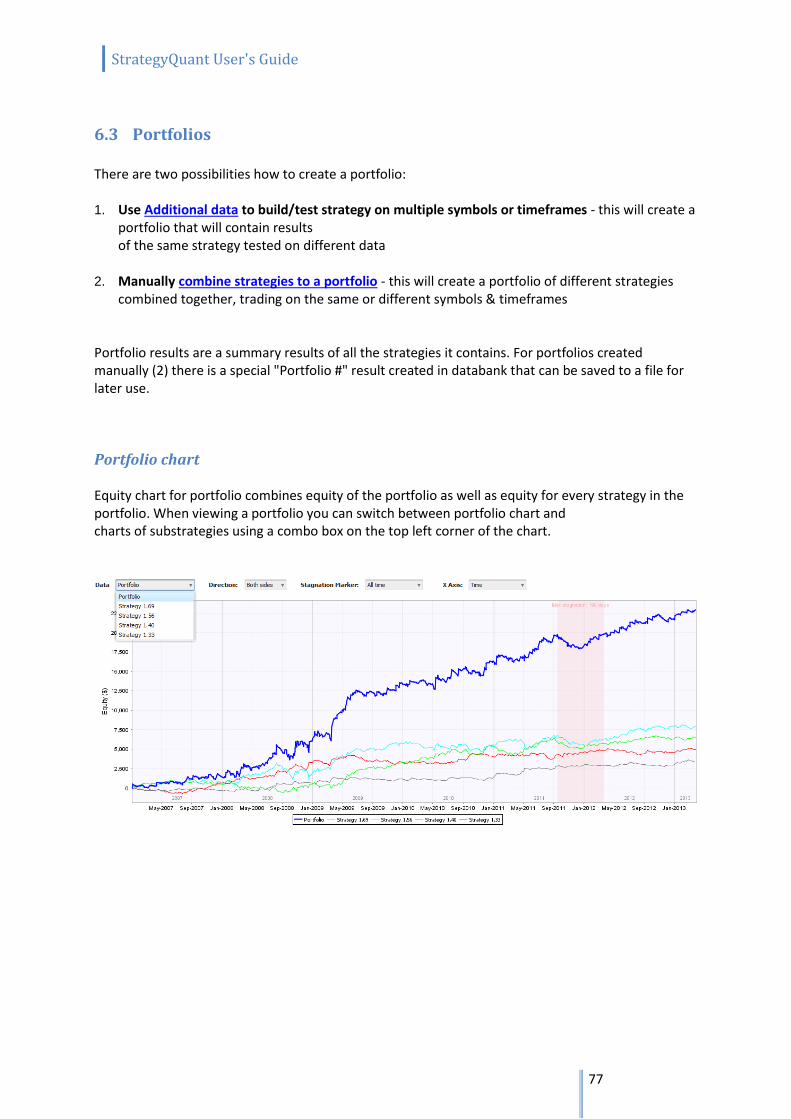
StrategyQuant User's Guide
77
6.3 Portfolios There are two possibilities how to create a portfolio: 1. Use Additional data to build/test strategy on multiple symbols or timeframes - this will create a
portfolio that will contain results of the same strategy tested on different data
2. Manually combine strategies to a portfolio - this will create a portfolio of different strategies
combined together, trading on the same or different symbols & timeframes Portfolio results are a summary results of all the strategies it contains. For portfolios created manually (2) there is a special "Portfolio #" result created in databank that can be saved to a file for later use.
Portfolio chart Equity chart for portfolio combines equity of the portfolio as well as equity for every strategy in the portfolio. When viewing a portfolio you can switch between portfolio chart and charts of substrategies using a combo box on the top left corner of the chart.
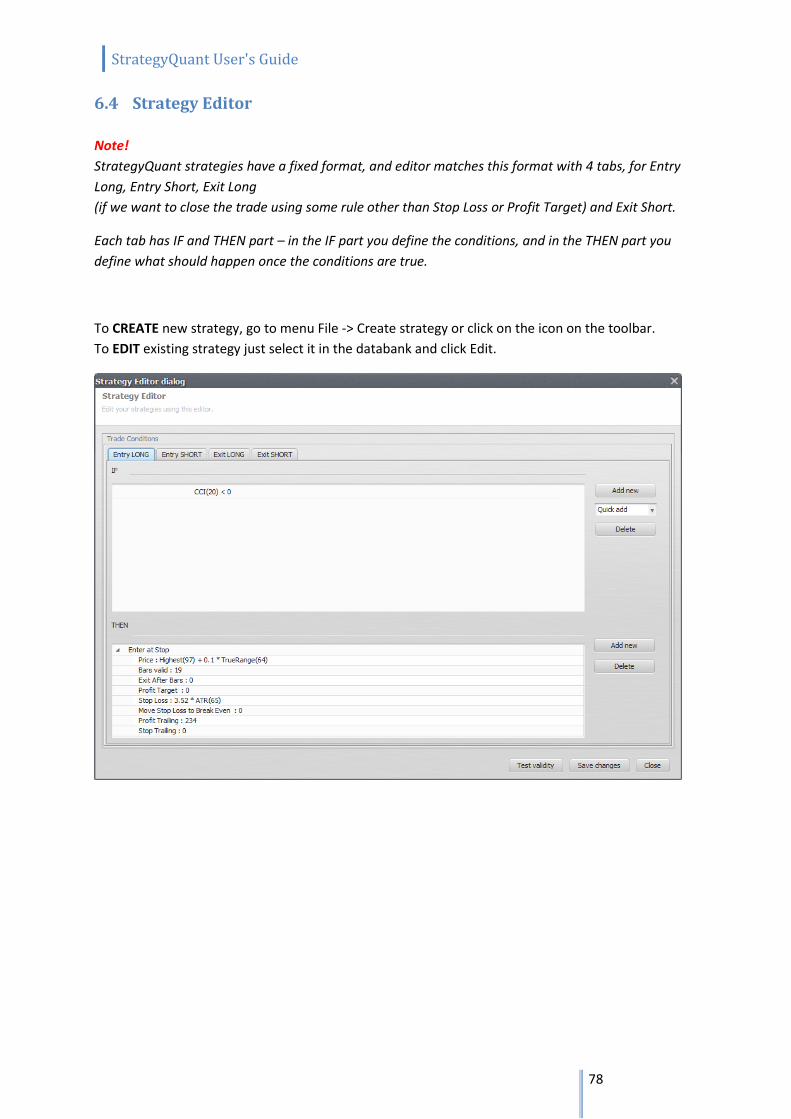
StrategyQuant User's Guide
78
6.4 Strategy Editor
Note!
StrategyQuant strategies have a fixed format, and editor matches this format with 4 tabs, for Entry
Long, Entry Short, Exit Long
(if we want to close the trade using some rule other than Stop Loss or Profit Target) and Exit Short.
Each tab has IF and THEN part – in the IF part you define the conditions, and in the THEN part you
define what should happen once the conditions are true.
To CREATE new strategy, go to menu File -> Create strategy or click on the icon on the toolbar.
To EDIT existing strategy just select it in the databank and click Edit.
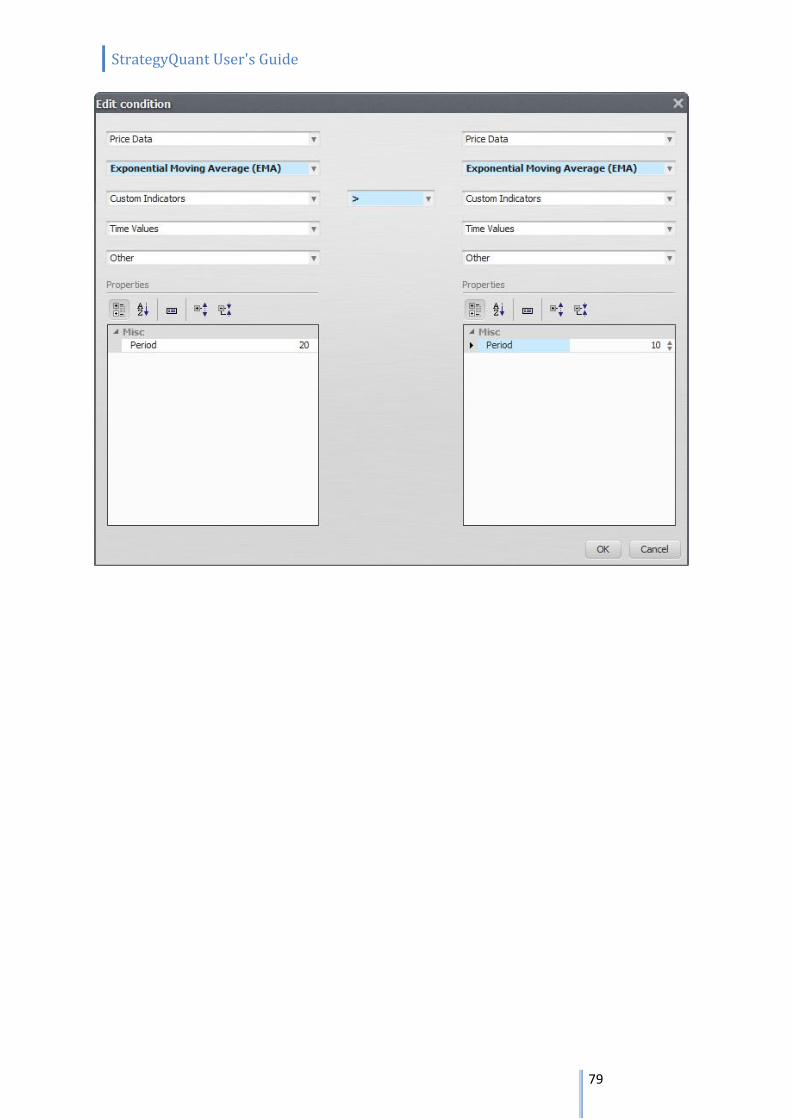
StrategyQuant User's Guide
79
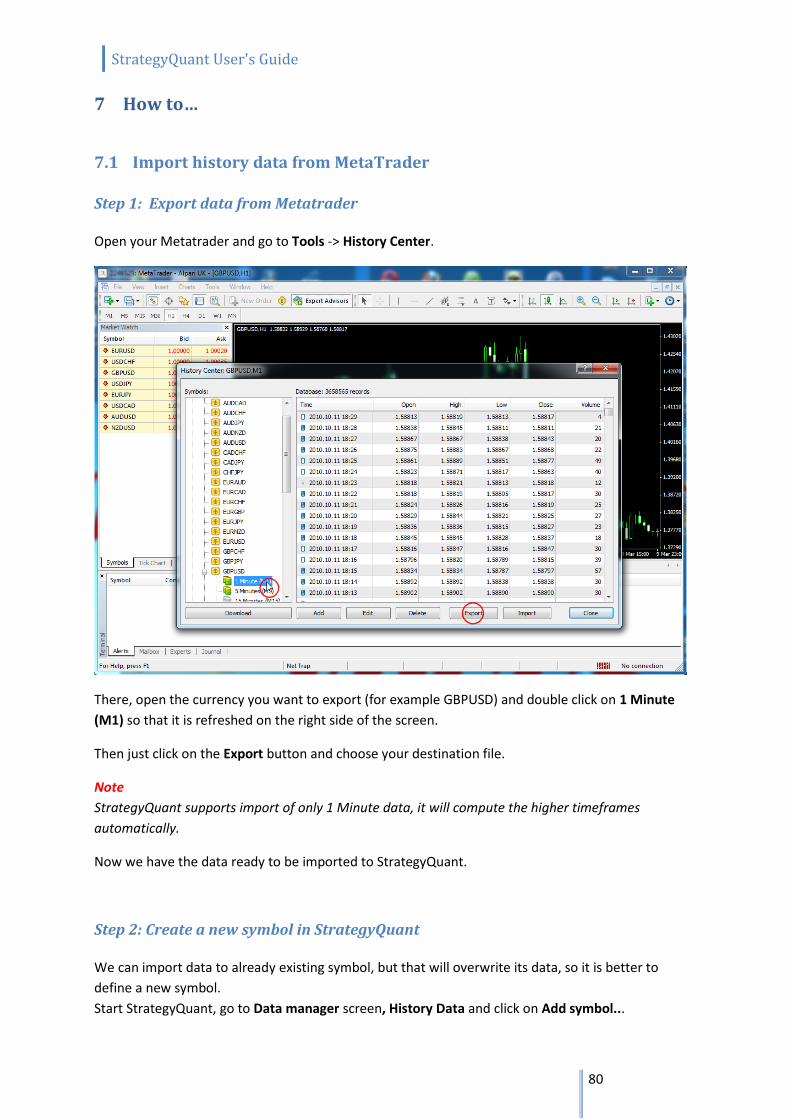
StrategyQuant User's Guide
80
7 How to…
7.1 Import history data from MetaTrader
Step 1: Export data from Metatrader Open your Metatrader and go to Tools -> History Center.
There, open the currency you want to export (for example GBPUSD) and double click on 1 Minute
(M1) so that it is refreshed on the right side of the screen.
Then just click on the Export button and choose your destination file.
Note
StrategyQuant supports import of only 1 Minute data, it will compute the higher timeframes
automatically.
Now we have the data ready to be imported to StrategyQuant.
Step 2: Create a new symbol in StrategyQuant We can import data to already existing symbol, but that will overwrite its data, so it is better to
define a new symbol.
Start StrategyQuant, go to Data manager screen, History Data and click on Add symbol...
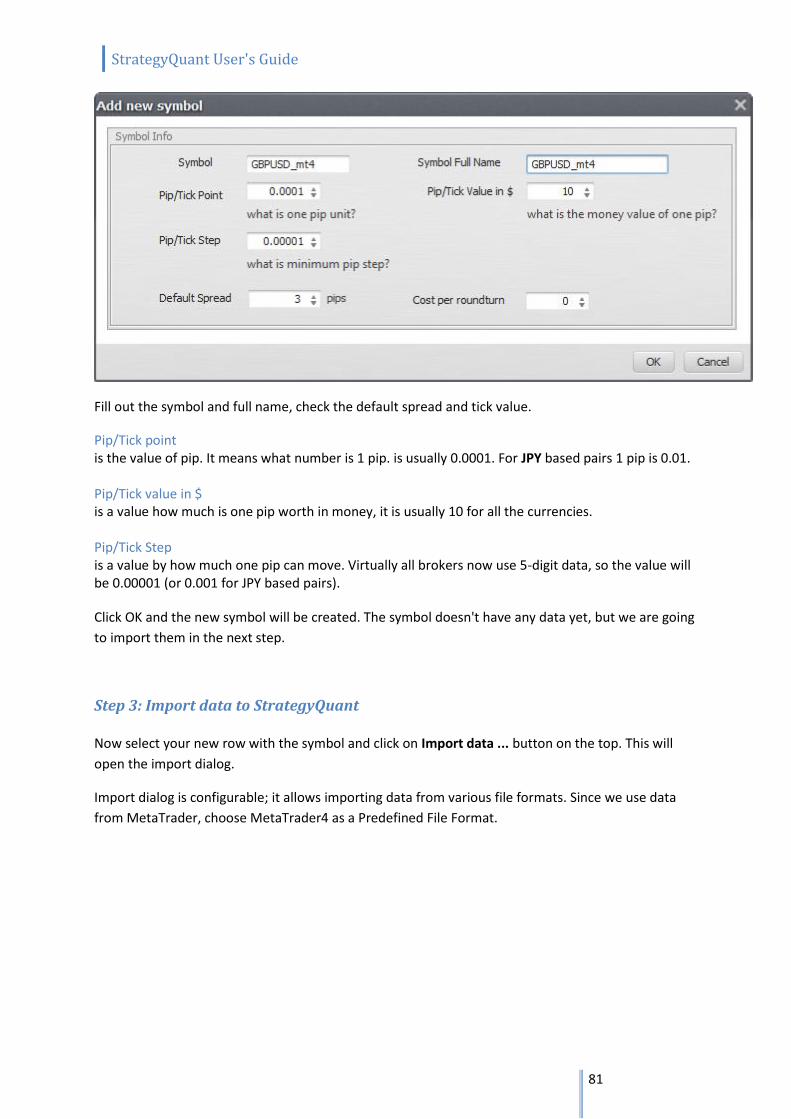
StrategyQuant User's Guide
81
Fill out the symbol and full name, check the default spread and tick value.
Pip/Tick point is the value of pip. It means what number is 1 pip. is usually 0.0001. For JPY based pairs 1 pip is 0.01. Pip/Tick value in $ is a value how much is one pip worth in money, it is usually 10 for all the currencies. Pip/Tick Step is a value by how much one pip can move. Virtually all brokers now use 5-digit data, so the value will be 0.00001 (or 0.001 for JPY based pairs).
Click OK and the new symbol will be created. The symbol doesn't have any data yet, but we are going
to import them in the next step.
Step 3: Import data to StrategyQuant Now select your new row with the symbol and click on Import data ... button on the top. This will
open the import dialog.
Import dialog is configurable; it allows importing data from various file formats. Since we use data
from MetaTrader, choose MetaTrader4 as a Predefined File Format.
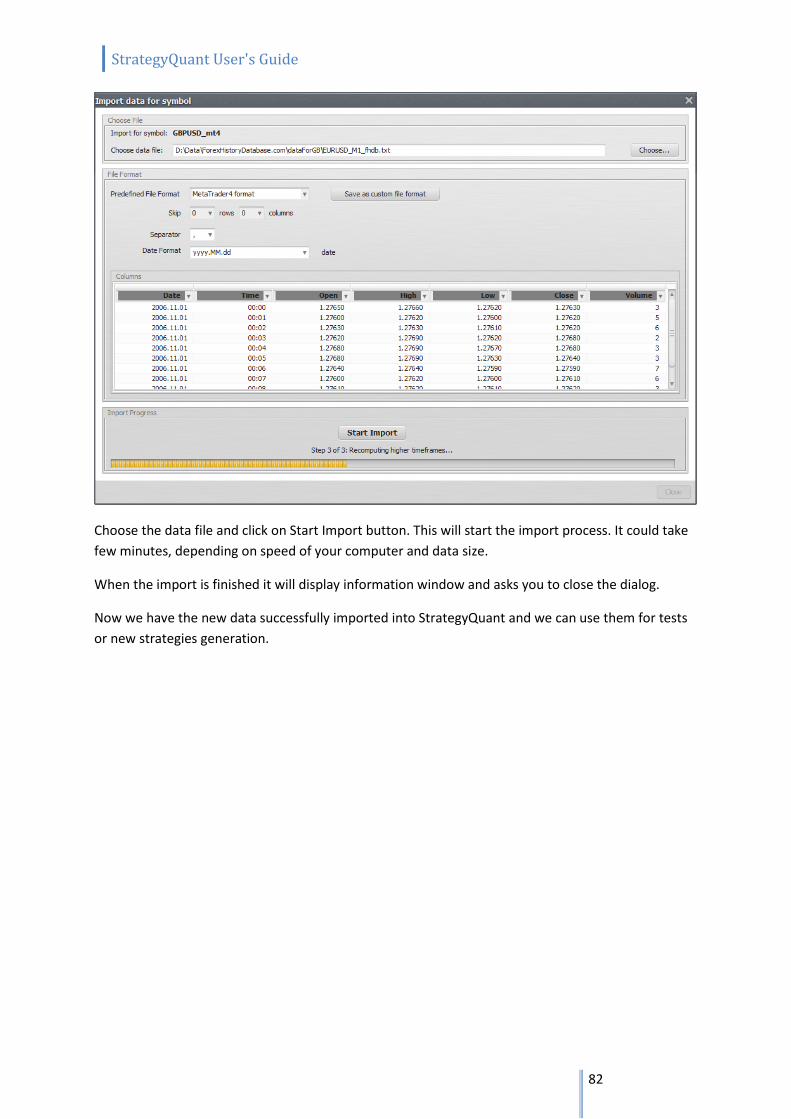
StrategyQuant User's Guide
82
Choose the data file and click on Start Import button. This will start the import process. It could take
few minutes, depending on speed of your computer and data size.
When the import is finished it will display information window and asks you to close the dialog.
Now we have the new data successfully imported into StrategyQuant and we can use them for tests
or new strategies generation.
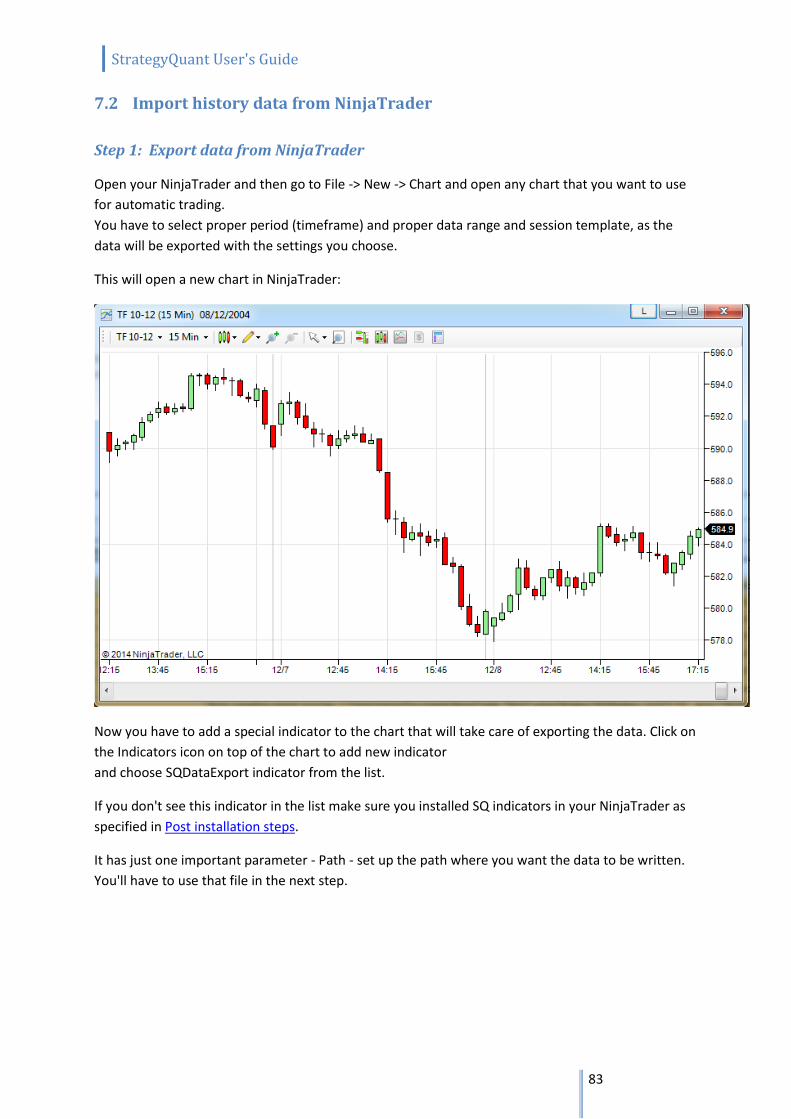
StrategyQuant User's Guide
83
7.2 Import history data from NinjaTrader
Step 1: Export data from NinjaTrader
Open your NinjaTrader and then go to File -> New -> Chart and open any chart that you want to use
for automatic trading.
You have to select proper period (timeframe) and proper data range and session template, as the
data will be exported with the settings you choose.
This will open a new chart in NinjaTrader:
Now you have to add a special indicator to the chart that will take care of exporting the data. Click on
the Indicators icon on top of the chart to add new indicator
and choose SQDataExport indicator from the list.
If you don't see this indicator in the list make sure you installed SQ indicators in your NinjaTrader as
specified in Post installation steps.
It has just one important parameter - Path - set up the path where you want the data to be written.
You'll have to use that file in the next step.
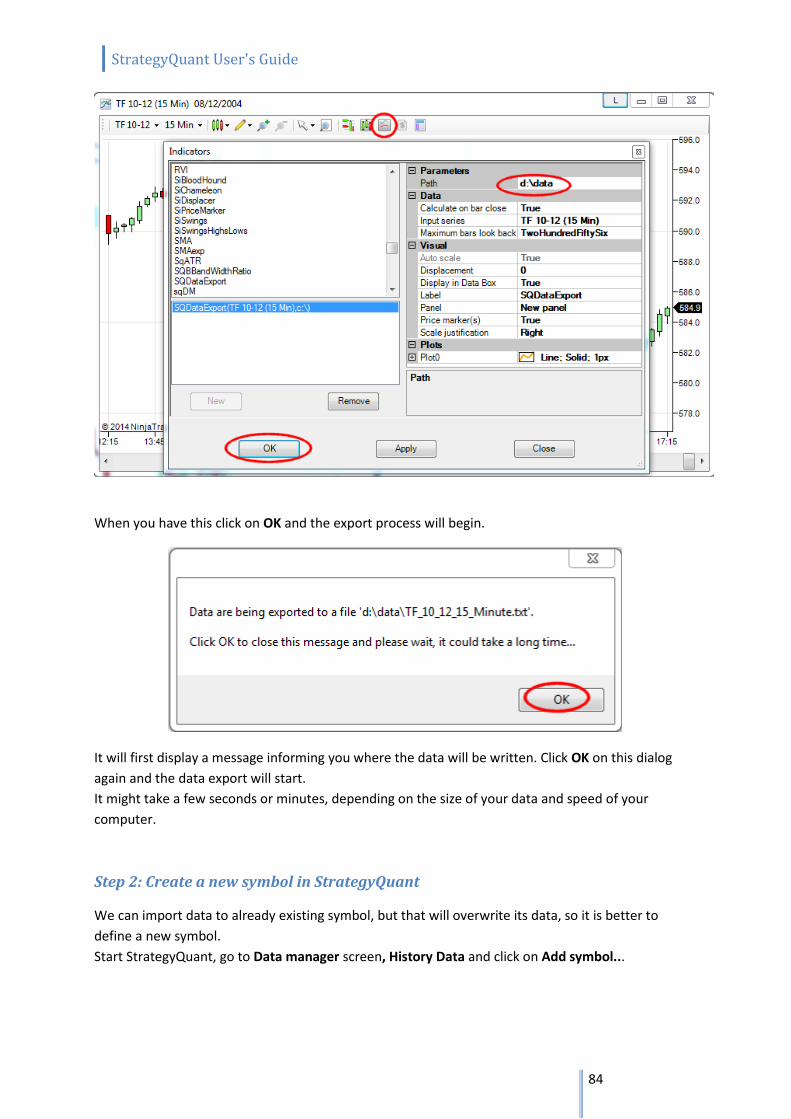
StrategyQuant User's Guide
84
When you have this click on OK and the export process will begin.
It will first display a message informing you where the data will be written. Click OK on this dialog
again and the data export will start.
It might take a few seconds or minutes, depending on the size of your data and speed of your
computer.
Step 2: Create a new symbol in StrategyQuant
We can import data to already existing symbol, but that will overwrite its data, so it is better to
define a new symbol.
Start StrategyQuant, go to Data manager screen, History Data and click on Add symbol...
StrategyQuant User's Guide
85
Fill out the symbol and full name, check the default spread value.
Note
If you are not sure how to fill these values check How to find Point value, Pip/Tick step in NinjaTrader?
Point value in $
is a value how much is one point worth in money, it depends on symbol. For TF (Russel 2000) it is
100.
Pip/Tick Step
is a value by how much one pip can move. This is the smallest decimal place that tick can have. For TF
(Russel 2000) it is 0.1. For stocks it will be usually 0.01.
Pip/Tick Size
this makes sense only for forex/MetaTrader data. For futures and stocks it should be the same value
as Pip/Tick Step.
Data type
for NinjaTrader data choose Timestamp represents end of bar time
Click OK and the new symbol will be created. The symbol doesn't have any data yet, but we are going
to import them in the next step.
Step 3: Import data to StrategyQuant
Now select your new row with the symbol and click on Import data ... button on the top. This will
open the import dialog.
StrategyQuant User's Guide
86
Import dialog is configurable; it allows to import data from various file formats. Since we use data
from MetaTrader, choose MetaTrader4 as a Predefined File Format.
Choose the data file and click on Start Import button. This will start the import process. It could take
few minutes, depending on speed of your computer and data size.
When the import is finished it will display information window and asks you to close the dialog.
Now we have the new data successfully imported into StrategyQuant and we can use them for tests
or new strategies generation.
StrategyQuant User's Guide
87
7.3 How to find Point value,Pip/Tick step in NinjaTrader
Fortunately, it is easy to find these settings in NinjaTrader.
Open NinjaTrader, go to Tools -> Instrument Manager. There search for your symbol.
When you found it double click on it on the table and it will open the instrument detail.
The Tick size here should be used as Pip/Tick Step and Pip/Tick Size in StrategyQuant.
Point value should be used as Point value in $ in StrategyQuant.
StrategyQuant User's Guide
88
7.4 Import history data from Tradestation
Step 1: Export data from Tradestation
Exporting data from Tradestation is very simple. Open your Tradestation platform and go to the chart
whose data you want to export.
Then go to View -> Data window to open data window. There click on the Save icon.
Choose file name for your data and Tradestation will save it to the file.
Step 2: Create a new symbol in StrategyQuant
We can import data to already existing symbol, but that will overwrite its data, so it is better to
define a new symbol.
Start StrategyQuant, go to Data manager screen, History Data and click on Add symbol...

StrategyQuant User's Guide
89
Fill out the symbol and full name, check the default spread value.
Note
If you are not sure how to fill these values check How to find Point value, Pip/Tick step in
Tradestation?
Point value in $
is a value how much is one point worth in money, it depends on symbol. For TF (Russel 2000) it is
100.
Pip/Tick Step
is a value by how much one pip can move. This is the smallest decimal place that tick can have. For TF
(Russel 2000) it is 0.1. For stocks it will be usually 0.01. For ES (S & P e-mini) it is 0.25.
Pip/Tick Size
this makes sense only for forex/MetaTrader data. For futures and stocks it should be the same value
as Pip/Tick Step. For ES (S & P e-mini) it is 0.25.
Data type
for NinjaTrader data choose Timestamp represents end of bar time
Click OK and the new symbol will be created. The symbol doesn't have any data yet, but we are going
to import them in the next step.
Step 3: Import data to StrategyQuant
Now select your new row with the symbol and click on Import data ... button on the top. This will
open the import dialog.

StrategyQuant User's Guide
90
Import dialog is configurable; it allows to import data from various file formats. Since we use data
from MetaTrader, choose MetaTrader4 as a Predefined File Format.
Choose the data file and click on Start Import button. This will start the import process. It could take
few minutes, depending on speed of your computer and data size.
When the import is finished it will display information window and asks you to close the dialog.
Now we have the new data successfully imported into StrategyQuant and we can use them for tests
or new strategies generation.
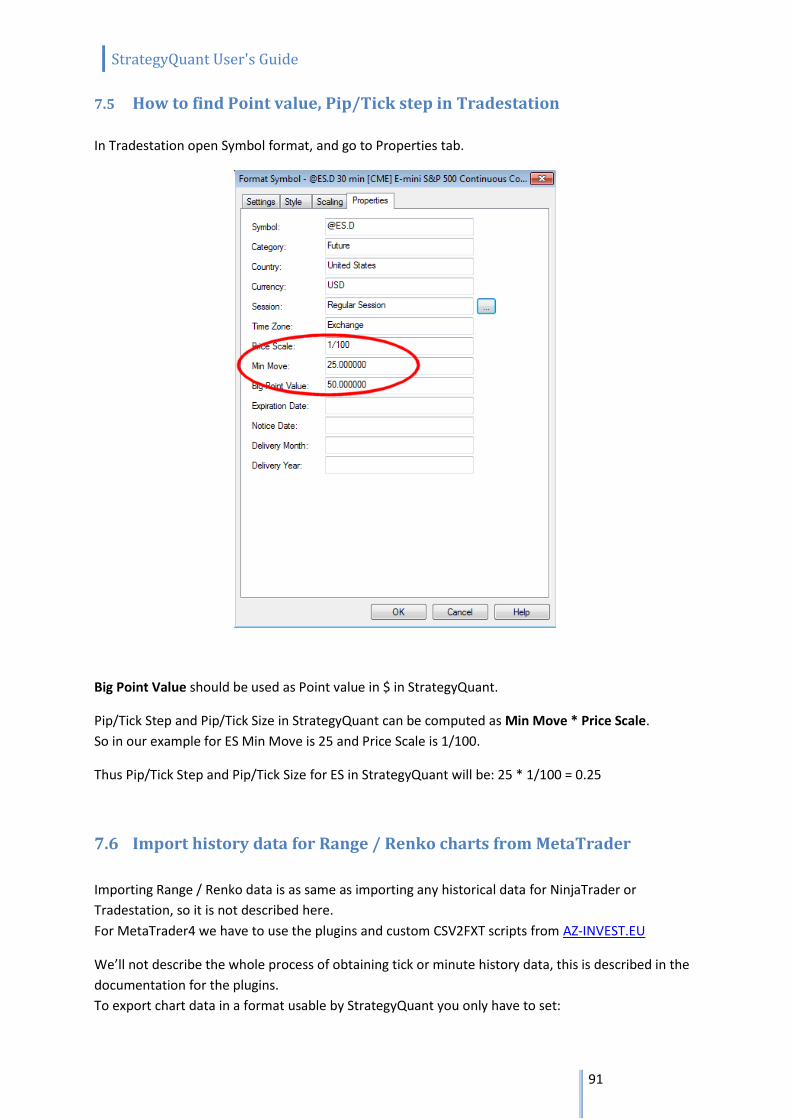
StrategyQuant User's Guide
91
7.5 How to find Point value, Pip/Tick step in Tradestation
In Tradestation open Symbol format, and go to Properties tab.
Big Point Value should be used as Point value in $ in StrategyQuant.
Pip/Tick Step and Pip/Tick Size in StrategyQuant can be computed as Min Move * Price Scale.
So in our example for ES Min Move is 25 and Price Scale is 1/100.
Thus Pip/Tick Step and Pip/Tick Size for ES in StrategyQuant will be: 25 * 1/100 = 0.25
7.6 Import history data for Range / Renko charts from MetaTrader
Importing Range / Renko data is as same as importing any historical data for NinjaTrader or
Tradestation, so it is not described here.
For MetaTrader4 we have to use the plugins and custom CSV2FXT scripts from AZ-INVEST.EU
We’ll not describe the whole process of obtaining tick or minute history data, this is described in the
documentation for the plugins.
To export chart data in a format usable by StrategyQuant you only have to set:
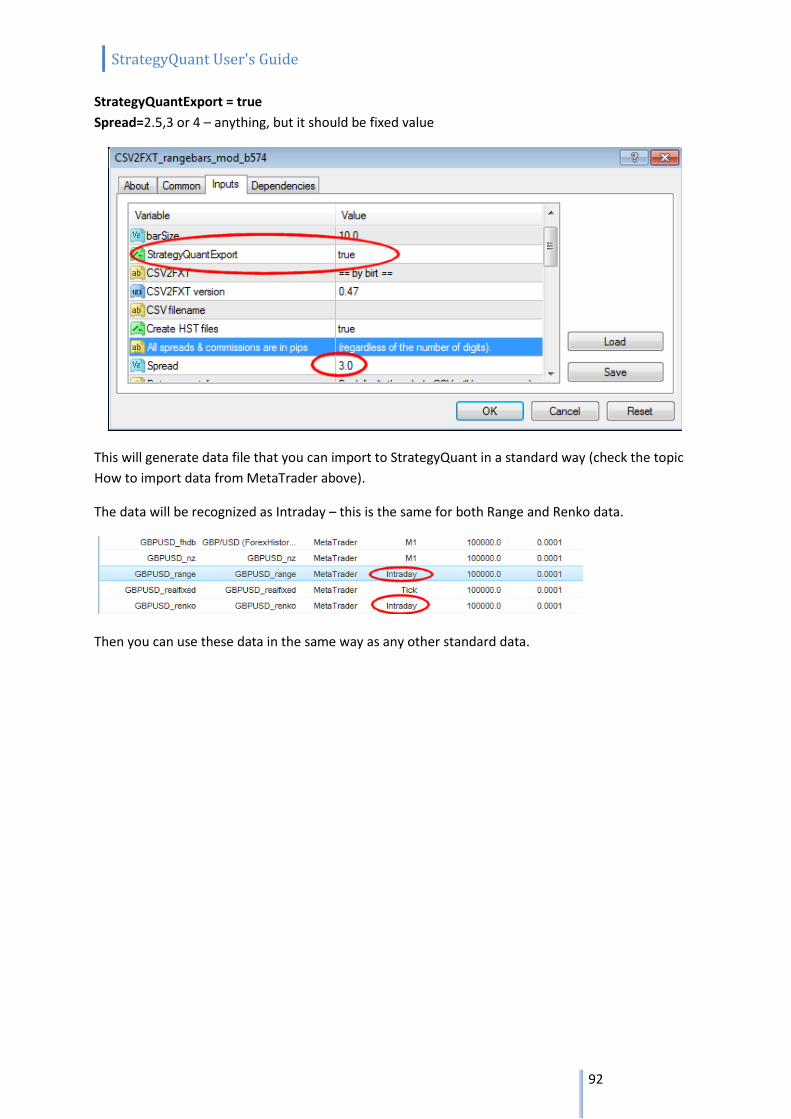
StrategyQuant User's Guide
92
StrategyQuantExport = true
Spread=2.5,3 or 4 – anything, but it should be fixed value
This will generate data file that you can import to StrategyQuant in a standard way (check the topic
How to import data from MetaTrader above).
The data will be recognized as Intraday – this is the same for both Range and Renko data.
Then you can use these data in the same way as any other standard data.
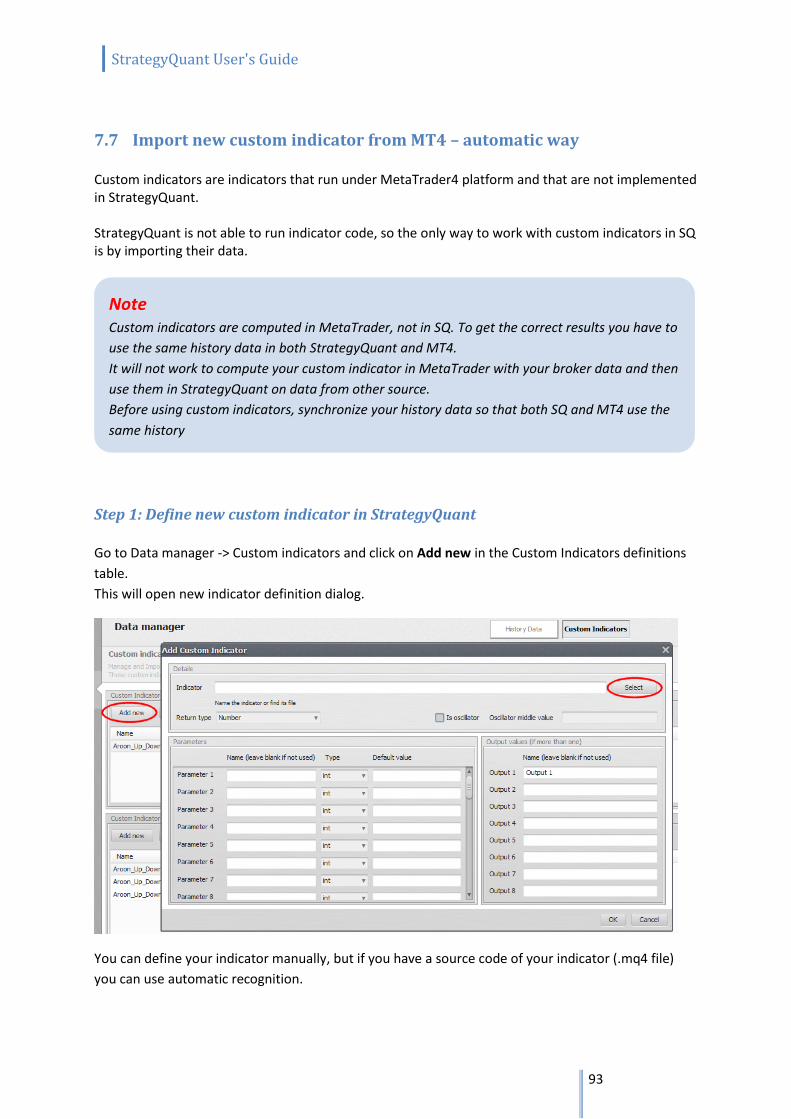
StrategyQuant User's Guide
93
7.7 Import new custom indicator from MT4 – automatic way Custom indicators are indicators that run under MetaTrader4 platform and that are not implemented in StrategyQuant. StrategyQuant is not able to run indicator code, so the only way to work with custom indicators in SQ is by importing their data.
Step 1: Define new custom indicator in StrategyQuant
Go to Data manager -> Custom indicators and click on Add new in the Custom Indicators definitions
table.
This will open new indicator definition dialog.
You can define your indicator manually, but if you have a source code of your indicator (.mq4 file)
you can use automatic recognition.
Note Custom indicators are computed in MetaTrader, not in SQ. To get the correct results you have to
use the same history data in both StrategyQuant and MT4.
It will not work to compute your custom indicator in MetaTrader with your broker data and then
use them in StrategyQuant on data from other source.
Before using custom indicators, synchronize your history data so that both SQ and MT4 use the
same history
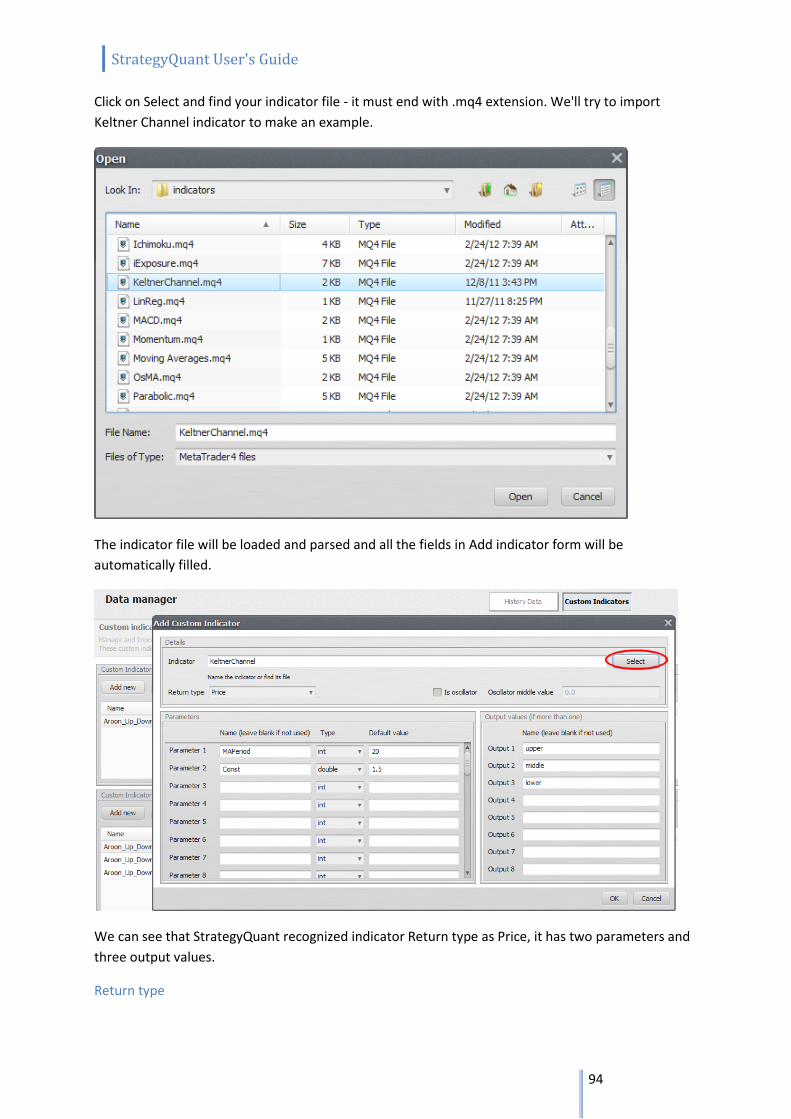
StrategyQuant User's Guide
94
Click on Select and find your indicator file - it must end with .mq4 extension. We'll try to import
Keltner Channel indicator to make an example.
The indicator file will be loaded and parsed and all the fields in Add indicator form will be
automatically filled.
We can see that StrategyQuant recognized indicator Return type as Price, it has two parameters and
three output values.
Return type
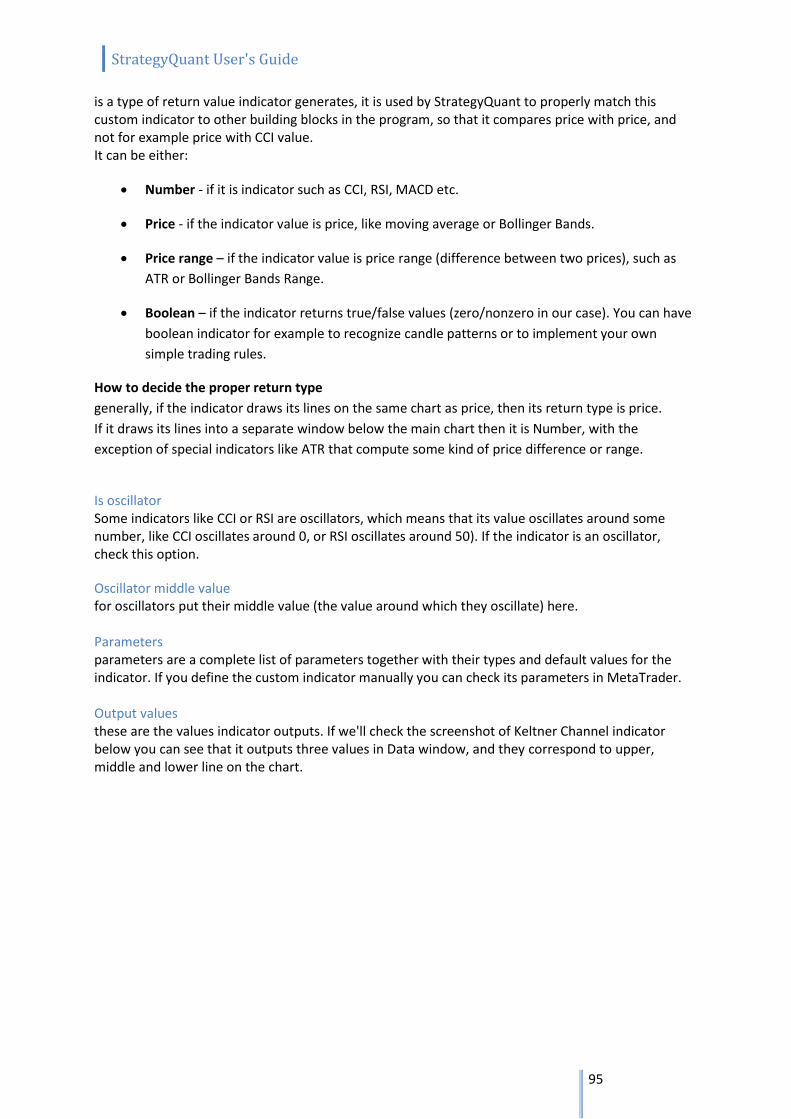
StrategyQuant User's Guide
95
is a type of return value indicator generates, it is used by StrategyQuant to properly match this custom indicator to other building blocks in the program, so that it compares price with price, and not for example price with CCI value. It can be either:
Number - if it is indicator such as CCI, RSI, MACD etc.
Price - if the indicator value is price, like moving average or Bollinger Bands.
Price range – if the indicator value is price range (difference between two prices), such as
ATR or Bollinger Bands Range.
Boolean – if the indicator returns true/false values (zero/nonzero in our case). You can have
boolean indicator for example to recognize candle patterns or to implement your own
simple trading rules.
How to decide the proper return type
generally, if the indicator draws its lines on the same chart as price, then its return type is price.
If it draws its lines into a separate window below the main chart then it is Number, with the
exception of special indicators like ATR that compute some kind of price difference or range.
Is oscillator Some indicators like CCI or RSI are oscillators, which means that its value oscillates around some number, like CCI oscillates around 0, or RSI oscillates around 50). If the indicator is an oscillator, check this option.
Oscillator middle value for oscillators put their middle value (the value around which they oscillate) here. Parameters parameters are a complete list of parameters together with their types and default values for the indicator. If you define the custom indicator manually you can check its parameters in MetaTrader. Output values these are the values indicator outputs. If we'll check the screenshot of Keltner Channel indicator below you can see that it outputs three values in Data window, and they correspond to upper, middle and lower line on the chart.
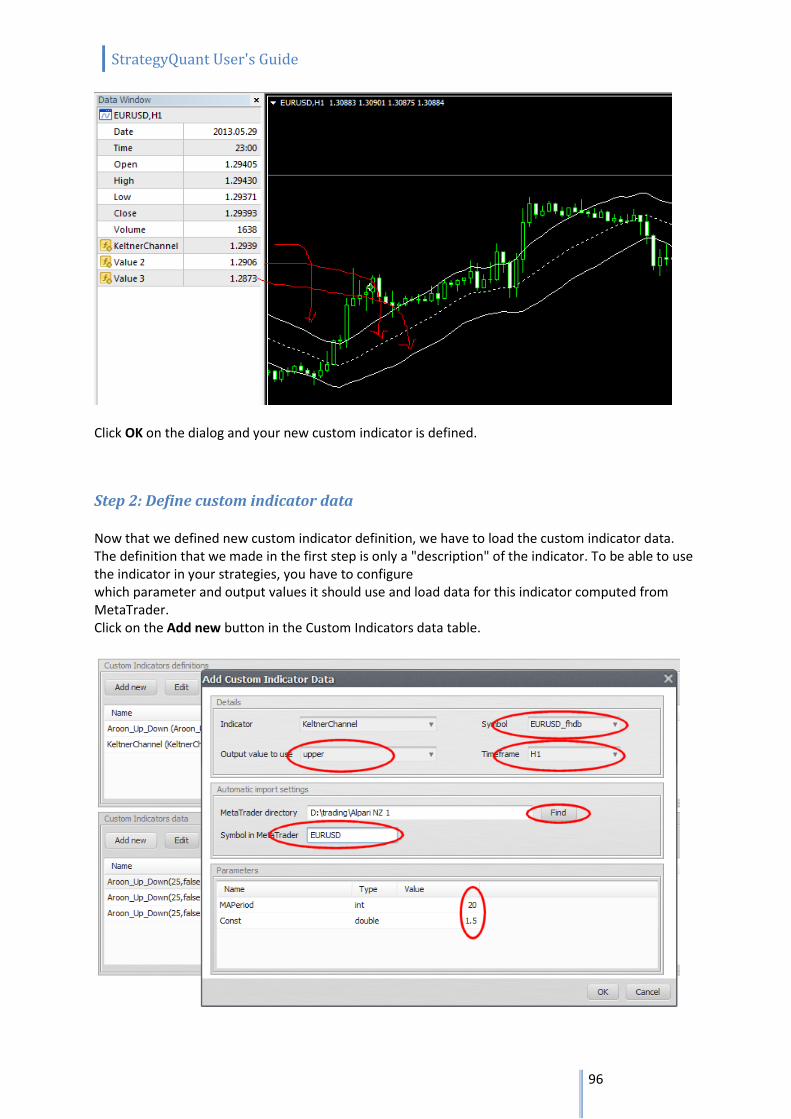
StrategyQuant User's Guide
96
Click OK on the dialog and your new custom indicator is defined.
Step 2: Define custom indicator data Now that we defined new custom indicator definition, we have to load the custom indicator data. The definition that we made in the first step is only a "description" of the indicator. To be able to use the indicator in your strategies, you have to configure which parameter and output values it should use and load data for this indicator computed from MetaTrader. Click on the Add new button in the Custom Indicators data table.
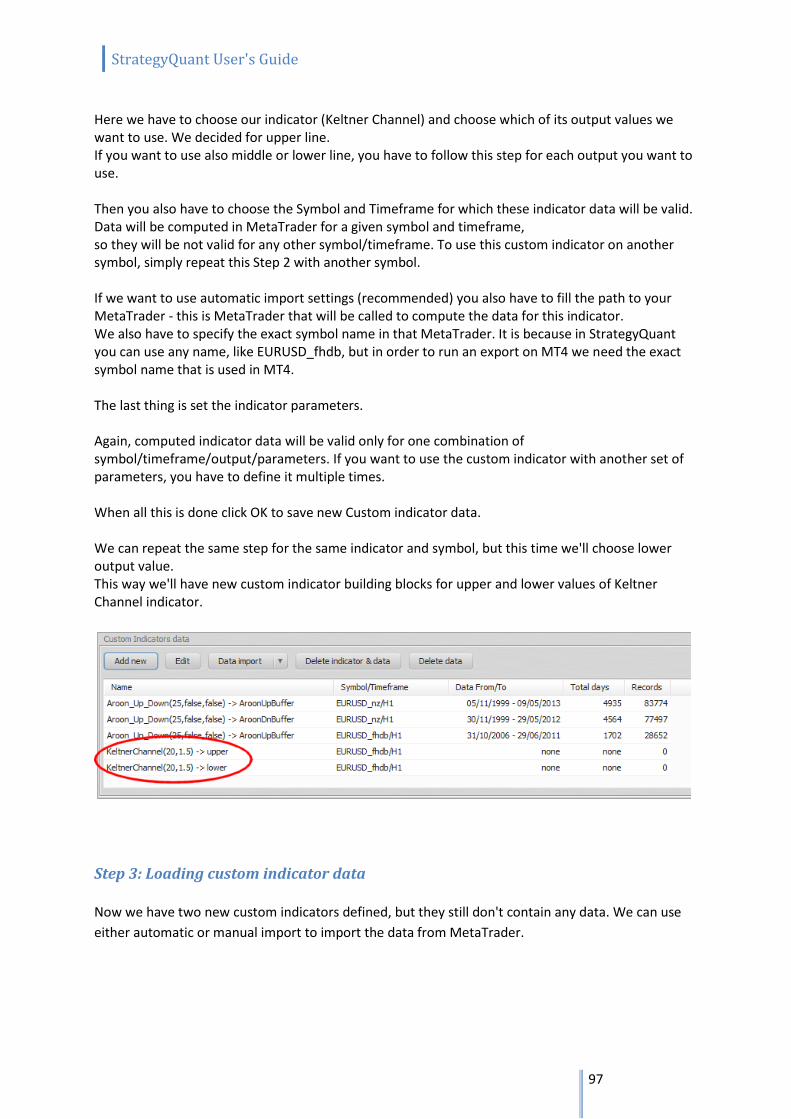
StrategyQuant User's Guide
97
Here we have to choose our indicator (Keltner Channel) and choose which of its output values we want to use. We decided for upper line. If you want to use also middle or lower line, you have to follow this step for each output you want to use. Then you also have to choose the Symbol and Timeframe for which these indicator data will be valid. Data will be computed in MetaTrader for a given symbol and timeframe, so they will be not valid for any other symbol/timeframe. To use this custom indicator on another symbol, simply repeat this Step 2 with another symbol. If we want to use automatic import settings (recommended) you also have to fill the path to your MetaTrader - this is MetaTrader that will be called to compute the data for this indicator. We also have to specify the exact symbol name in that MetaTrader. It is because in StrategyQuant you can use any name, like EURUSD_fhdb, but in order to run an export on MT4 we need the exact symbol name that is used in MT4. The last thing is set the indicator parameters. Again, computed indicator data will be valid only for one combination of symbol/timeframe/output/parameters. If you want to use the custom indicator with another set of parameters, you have to define it multiple times. When all this is done click OK to save new Custom indicator data. We can repeat the same step for the same indicator and symbol, but this time we'll choose lower output value. This way we'll have new custom indicator building blocks for upper and lower values of Keltner Channel indicator.
Step 3: Loading custom indicator data
Now we have two new custom indicators defined, but they still don't contain any data. We can use
either automatic or manual import to import the data from MetaTrader.
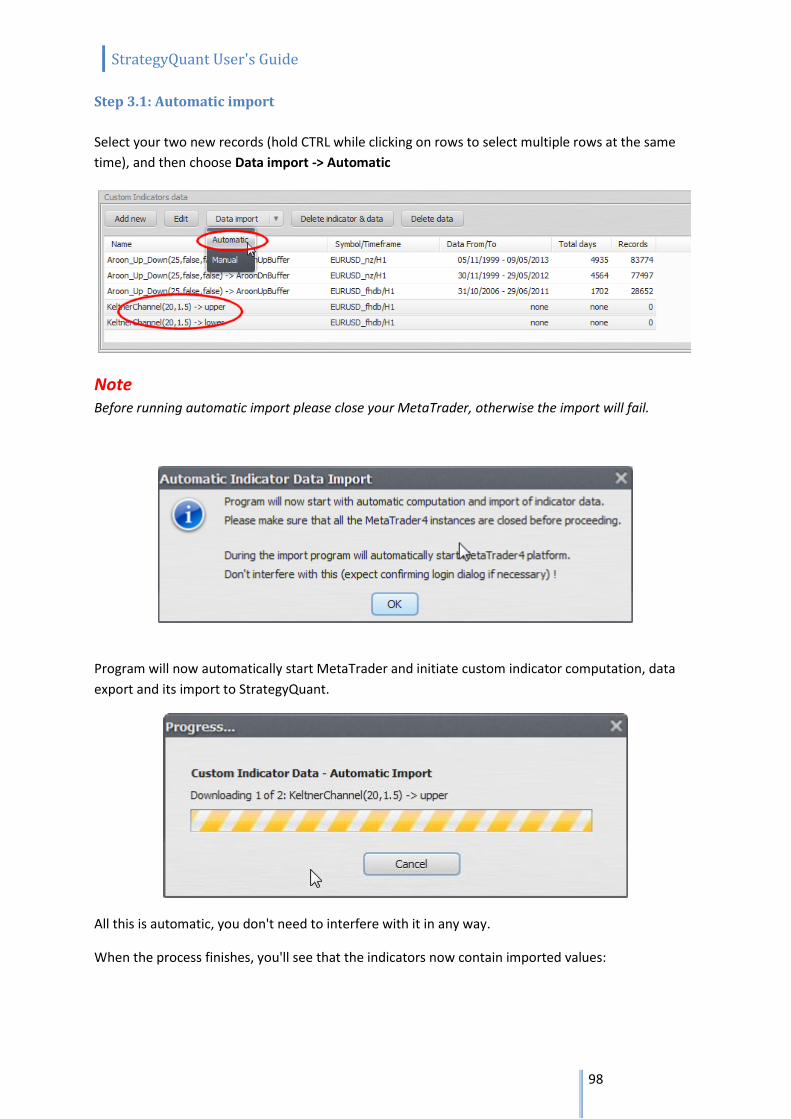
StrategyQuant User's Guide
98
Step 3.1: Automatic import
Select your two new records (hold CTRL while clicking on rows to select multiple rows at the same
time), and then choose Data import -> Automatic
Note Before running automatic import please close your MetaTrader, otherwise the import will fail.
Program will now automatically start MetaTrader and initiate custom indicator computation, data
export and its import to StrategyQuant.
All this is automatic, you don't need to interfere with it in any way.
When the process finishes, you'll see that the indicators now contain imported values:
StrategyQuant User's Guide
99
Step 3.2: Manual import
You can use manual import in case automatic import fails or you want to have bigger control over exported data.
If you don’t plan to use manual import you can skip directly to Step 4.
Step 3.2.1 - Getting the indicator values from MetaTrader
Custom indicators work in a way that StrategyQuant uses their values computed in another program,
for example in MetaTrader. This means we have to compute the indicator in MetaTrader and then
import its value(s) to SQ.
This is little bit complicated, but on the other hand it allows us to use virtually any indicator available
for MetaTrader, even if we don’t know how exactly it is computed.
For computation of indicator values we’ll use a simple EA called
GenBuilder_IndicatorExportEA
This simple EA ships with StrategyQuant, you can find it in
{StrategyQuant installation directory}/custom_indicators/mq4/ directory.
In order to use it in your MetaTrader you have to copy it to:
{MetaTrader installation directory}/experts
If you use MetaTrader Build 600+ then the folder structure changed. You have to locate the correct
Experts folder in MetaTrader File ->Open Data Folder. This will open MT4 data folder, and you have
to copy this EA to MQL4/Experts.
Then restart your MetaTrader and the new EA will be available.
We’ll need to open the EA and modify its code a little. Open the MetaQuotes Language Editor from
Tools Menu.
StrategyQuant User's Guide
100
This will open the editor that will allow us to modify the EA.
Now find the IndicatorExportEA in Experts and double-click on it, this will open the EA in the editor
screen.
The only thing we have to change in the code is a command that gets the value of the indicator and
that writes the value to the file. The code looks like this:
value1 = … get indicator value 1 bar ago…
FileWrite(handle, TimeToStr(Time[1], TIME_DATE),TimeToStr(Time[1], TIME_MINUTES), Close[1], value1);
The code is simple, all it does is it gets the value of the desired indicator and then saves the value to
the file. So, to export your own indicator just change the code that gets the indicator value.
Example 1 – exporting value of standard MT4 indicator, such as Bears Power
value1 = iBearsPower(NULL, 0, 13, PRICE_CLOSE, 1);
FileWrite(handle, TimeToStr(Time[1], TIME_DATE),TimeToStr(Time[1], TIME_MINUTES), Close[1], value1);
Example 2 – exporting custom indicator from MT4
To get the value of custom indicator in MT4 we have to use the call
iCustom(symbol, timeframe, name, …parameters…, mode, shift)
StrategyQuant User's Guide
101
where
symbol and timeframe can be left to NULL, 0 to get the actual symbol and timeframe
name is the exact name of the custom indicator
parameters are indicator parameters separated by comma
mode is a line index – it can be from 0..7 and it is usually used if indicator returns more than
one value
shift must be always 1
So for example for Keltner Channel we’ll have the code:
value1 = iCustom(NULL,0, "KeltnerChannel", 20, 1.5, 2, 1);
FileWrite(handle, TimeToStr(Time[1], TIME_DATE),TimeToStr(Time[1], TIME_MINUTES), Close[1], value1);
where 20 and 1.5 are the parameters of Keltner Channel indicator and 2 is the line index – we want
third value of the indicator (index is zero based) that corresponds to the bottom of Keltner Channel.
Example 3 – exporting multiple indicator values at once - Ichimoku Tenkan Sen and Kijun Sen
it is possible to import multiple indicator values at once, to do this simply use variables
value1…value6. And don’t forget to add all these values also to the FileWrite function.
value1 = iIchimoku(NULL, 0, 9, 26, 52, MODE_TENKANSEN, 1);
value2 = iIchimoku(NULL, 0, 9, 26, 52, MODE_KIJUNSEN, 1);
FileWrite(handle, TimeToStr(Time[1], TIME_DATE),TimeToStr(Time[1], TIME_MINUTES), Close[1], value1, value2);
First two lines compute different values of Ichimoku indicator and the third line saves them to the
data file.
After we finished altering the code we can click on the Compile button on the top and indicator
should successfully compile.
StrategyQuant User's Guide
102
Step 3.2.2 - Exporting the indicator values from MetaTrader
Now we have the export indicator ready and we can use it. In MetaTrader open Strategy Tester
(View -> Strategy Tester) and in the list of Expert Advisors find our
GenBuilder_IndicatorDataExportEA.
Now you have to set also the symbol you want this indicator to be computed on and timeframe.
Check also Use date and set date From and To.
After this click on Start button and the export will begin. The export could take several minutes, so
wait until it finishes successfully.
The EA will go through all the data history, computes indicator value for every bar and write
generated ticks to a file. This file can be located in
{MetaTrader installation directory}/tester/files
Or for MT4 Build 600+ in {MetaTrader Data Folder}/MQL4/tester/files
Step 3.2.3 – Importing indicator values to StrategyQuant
Select new record and then choose Data import -> Manual. This will open new Import dialog:
Note
Indicator will have different values for every symbol and every timeframe so you should
export it for every symbol and timeframe combination that you want to use in Genetic Builder.
To do this, just repeat this Step 2 and choose different symbol or timeframe.
Don’t forget to rename the exported values file before every export, because otherwise the
new values will be added to the end of the file which will make it unusable.
Simply go to the /tester/files directory and rename the export file CustInd_XXX.csv to
something else (for example MyIndicator_GBPUSD_M15.csv) before running the export again.
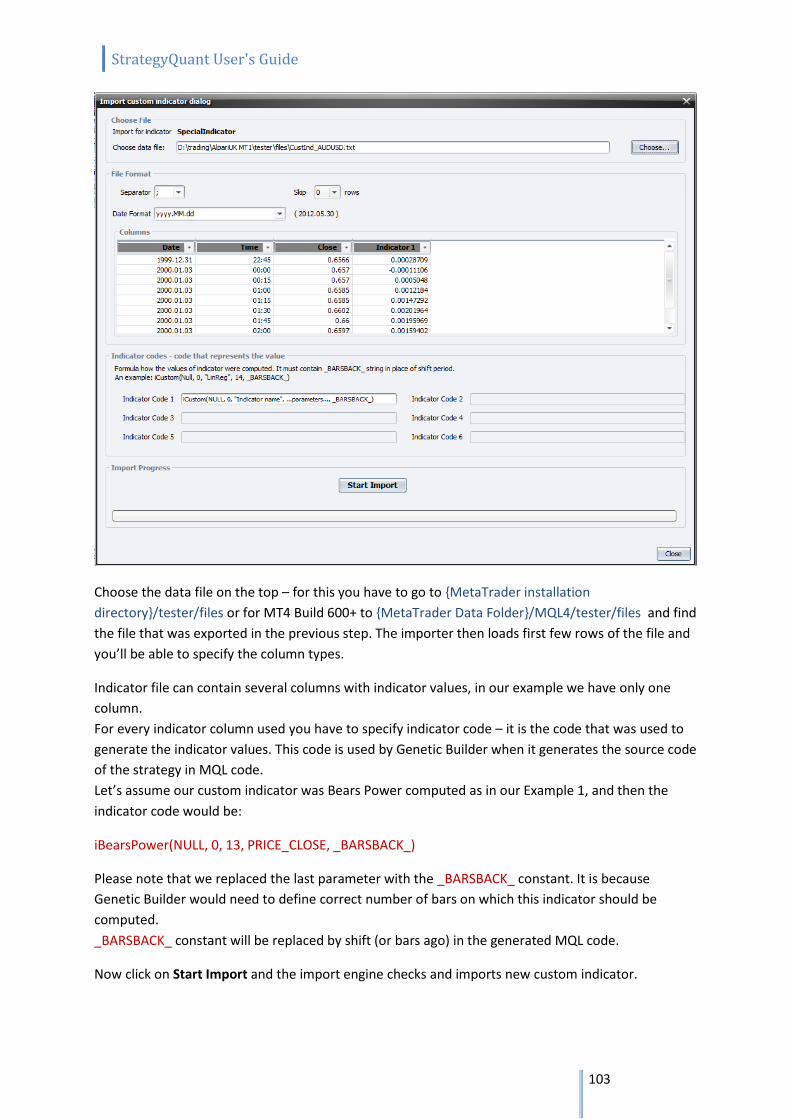
StrategyQuant User's Guide
103
Choose the data file on the top – for this you have to go to {MetaTrader installation
directory}/tester/files or for MT4 Build 600+ to {MetaTrader Data Folder}/MQL4/tester/files and find
the file that was exported in the previous step. The importer then loads first few rows of the file and
you’ll be able to specify the column types.
Indicator file can contain several columns with indicator values, in our example we have only one
column.
For every indicator column used you have to specify indicator code – it is the code that was used to
generate the indicator values. This code is used by Genetic Builder when it generates the source code
of the strategy in MQL code.
Let’s assume our custom indicator was Bears Power computed as in our Example 1, and then the
indicator code would be:
iBearsPower(NULL, 0, 13, PRICE_CLOSE, _BARSBACK_)
Please note that we replaced the last parameter with the _BARSBACK_ constant. It is because
Genetic Builder would need to define correct number of bars on which this indicator should be
computed.
_BARSBACK_ constant will be replaced by shift (or bars ago) in the generated MQL code.
Now click on Start Import and the import engine checks and imports new custom indicator.
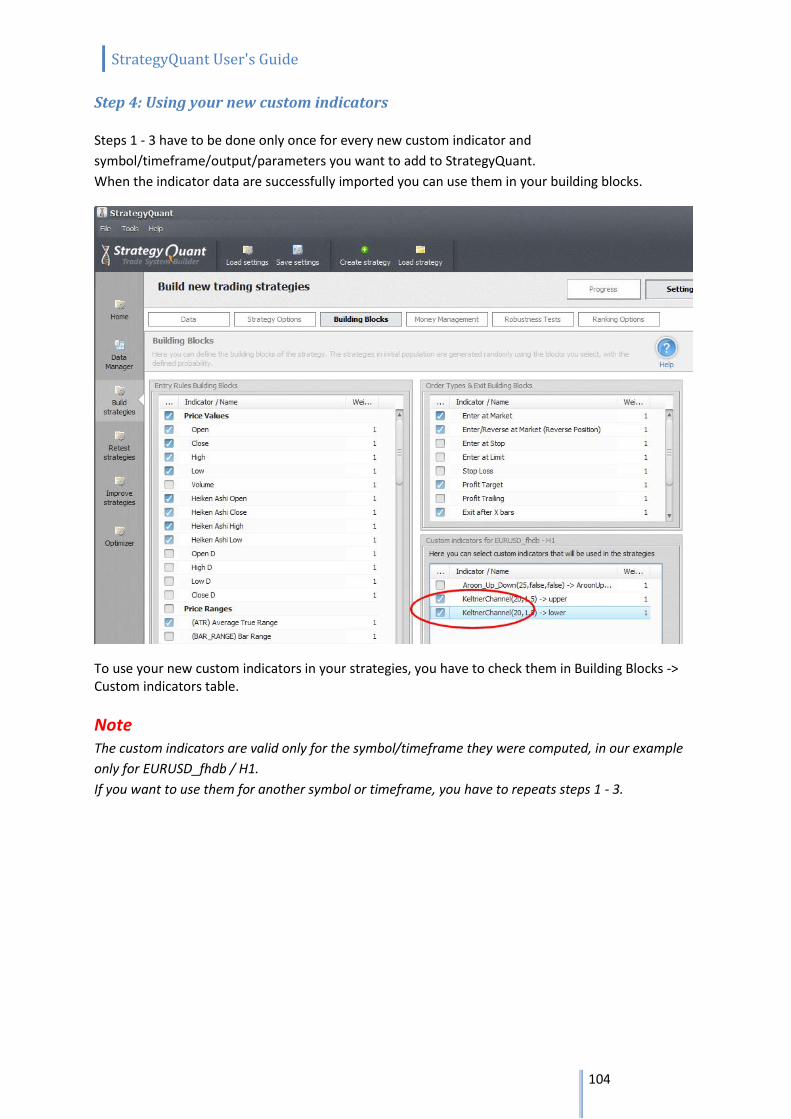
StrategyQuant User's Guide
104
Step 4: Using your new custom indicators Steps 1 - 3 have to be done only once for every new custom indicator and
symbol/timeframe/output/parameters you want to add to StrategyQuant.
When the indicator data are successfully imported you can use them in your building blocks.
To use your new custom indicators in your strategies, you have to check them in Building Blocks -> Custom indicators table.
Note The custom indicators are valid only for the symbol/timeframe they were computed, in our example
only for EURUSD_fhdb / H1.
If you want to use them for another symbol or timeframe, you have to repeats steps 1 - 3.
StrategyQuant User's Guide
105
7.8 Import new custom indicator from NinjaTrader Custom indicators are indicators that run under NinjaTrader platform and that are not implemented in StrategyQuant. StrategyQuant is not able to run indicator code, so the only way how to work with custom indicators in SQ is by importing their data.
Note Custom indicators are computed in NinjaTrader, not in SQ. To get the correct results you have to use
the same history data in both StrategyQuant and NT.
It will not work to compute your custom indicator in NinjaTrader with your broker data and then use
them in StrategyQuant on data from other source.
You have to compute your custom indicator on exactly the same data, the same data range and
trading session as you imported to StrategyQuant.
Step 1: Define new custom indicator in StrategyQuant
As an example we'll create new custom indicator MACD.
First add MACD indicator to the chart in NinjaTrader and open its properties so you can see which
parameter and output values (Plots) it uses.
Open StrategyQuant, go to Data manager -> Custom indicators and click on Add new in the Custom
Indicators definitions table.
This will open new indicator definition dialog. For NinjaTrader you have define your indicator
manually, so create some name for your new custom indicator (MACD_NT) and define its parameters
and outputs (Plots).
You can do it easily by copying indicator properties in NinjaTrader (see below).
For MACD we set the Return type to Number, because ti returns general number. We also check that
it is an oscillator, and that it oscillates around 0.
Return type is a type of return value indicator generates, it is used by StrategyQuant to properly match this custom indicator to other building blocks in the program, so that it compares price with price, and not for example price with CCI value. It can be either:
Number - if it is indicator such as CCI, RSI, MACD etc.
Price - if the indicator value is price, like moving average or Bollinger Bands.
Price range – if the indicator value is price range (difference between two prices), such as
ATR or Bollinger Bands Range.
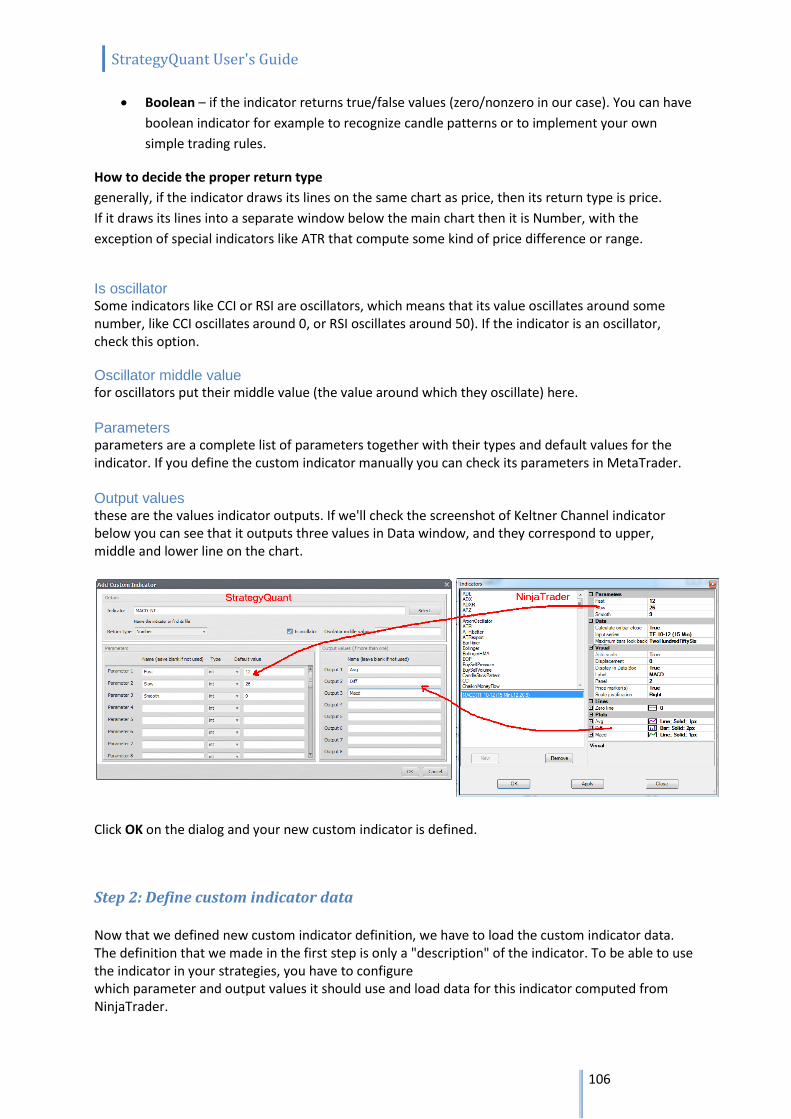
StrategyQuant User's Guide
106
Boolean – if the indicator returns true/false values (zero/nonzero in our case). You can have
boolean indicator for example to recognize candle patterns or to implement your own
simple trading rules.
How to decide the proper return type
generally, if the indicator draws its lines on the same chart as price, then its return type is price.
If it draws its lines into a separate window below the main chart then it is Number, with the
exception of special indicators like ATR that compute some kind of price difference or range.
Is oscillator Some indicators like CCI or RSI are oscillators, which means that its value oscillates around some number, like CCI oscillates around 0, or RSI oscillates around 50). If the indicator is an oscillator, check this option.
Oscillator middle value for oscillators put their middle value (the value around which they oscillate) here. Parameters parameters are a complete list of parameters together with their types and default values for the indicator. If you define the custom indicator manually you can check its parameters in MetaTrader. Output values these are the values indicator outputs. If we'll check the screenshot of Keltner Channel indicator below you can see that it outputs three values in Data window, and they correspond to upper, middle and lower line on the chart.
Click OK on the dialog and your new custom indicator is defined.
Step 2: Define custom indicator data Now that we defined new custom indicator definition, we have to load the custom indicator data. The definition that we made in the first step is only a "description" of the indicator. To be able to use the indicator in your strategies, you have to configure which parameter and output values it should use and load data for this indicator computed from NinjaTrader.
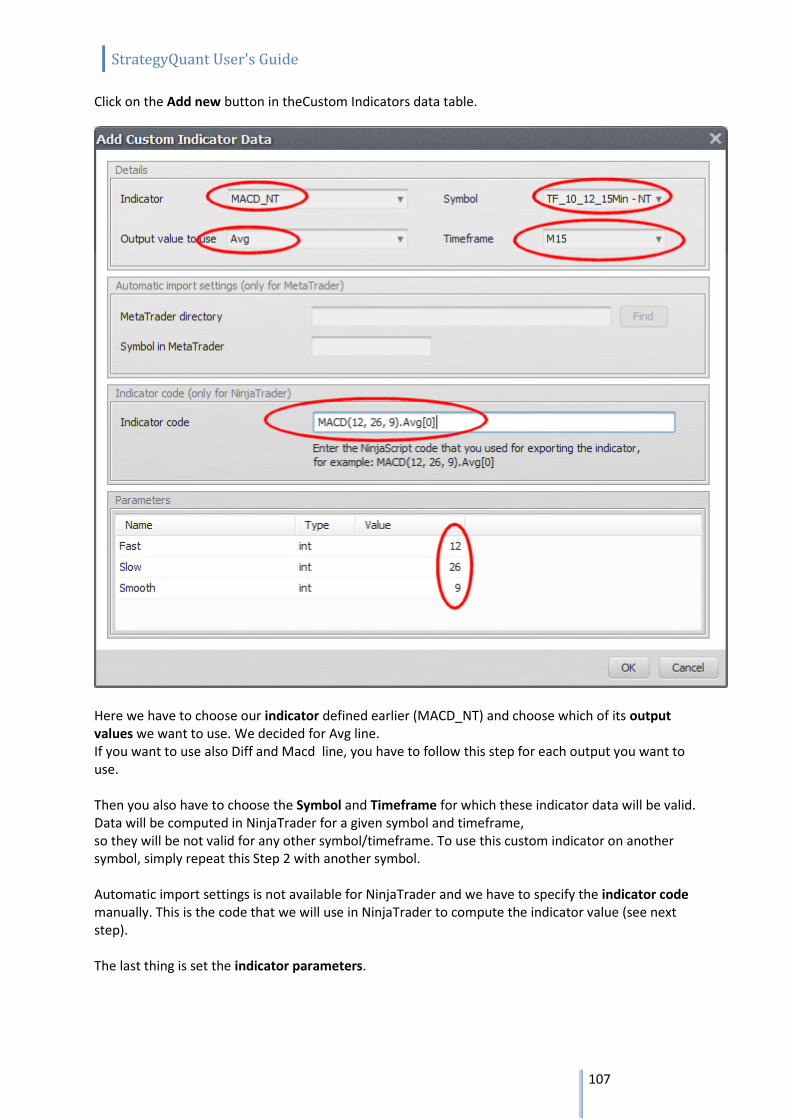
StrategyQuant User's Guide
107
Click on the Add new button in theCustom Indicators data table.
Here we have to choose our indicator defined earlier (MACD_NT) and choose which of its output values we want to use. We decided for Avg line. If you want to use also Diff and Macd line, you have to follow this step for each output you want to use. Then you also have to choose the Symbol and Timeframe for which these indicator data will be valid. Data will be computed in NinjaTrader for a given symbol and timeframe, so they will be not valid for any other symbol/timeframe. To use this custom indicator on another symbol, simply repeat this Step 2 with another symbol. Automatic import settings is not available for NinjaTrader and we have to specify the indicator code manually. This is the code that we will use in NinjaTrader to compute the indicator value (see next step). The last thing is set the indicator parameters.
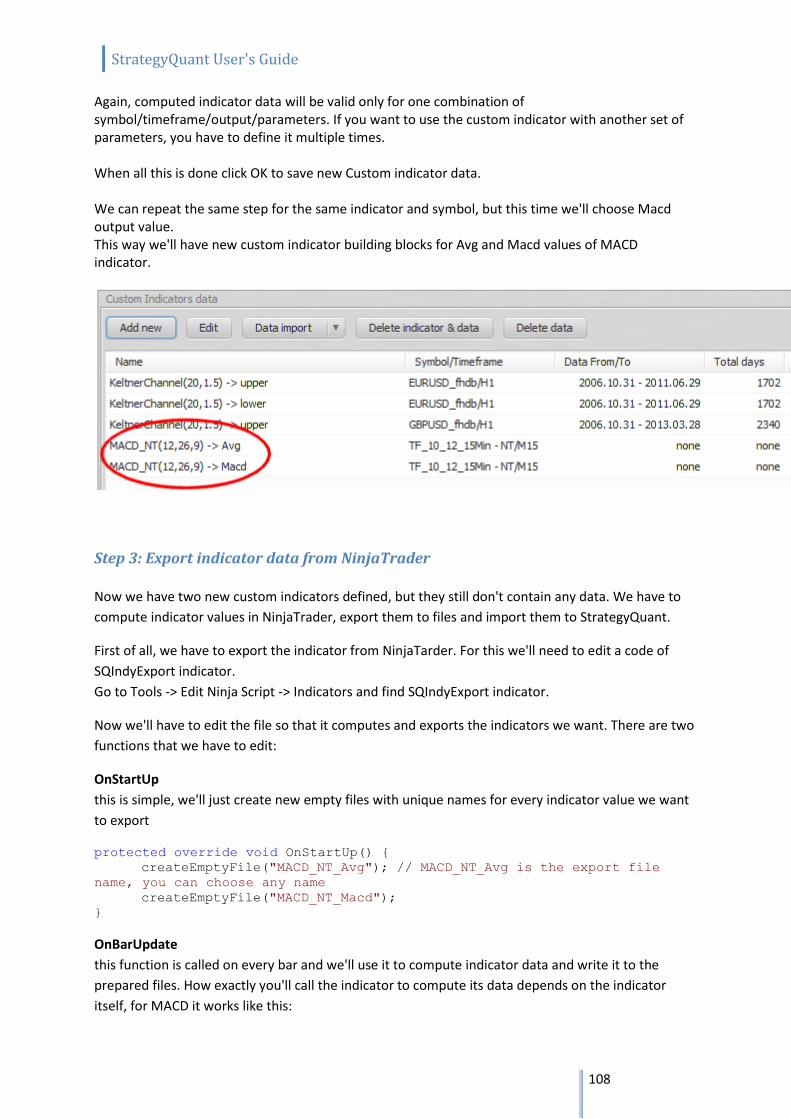
StrategyQuant User's Guide
108
Again, computed indicator data will be valid only for one combination of symbol/timeframe/output/parameters. If you want to use the custom indicator with another set of parameters, you have to define it multiple times. When all this is done click OK to save new Custom indicator data. We can repeat the same step for the same indicator and symbol, but this time we'll choose Macd output value. This way we'll have new custom indicator building blocks for Avg and Macd values of MACD indicator.
Step 3: Export indicator data from NinjaTrader
Now we have two new custom indicators defined, but they still don't contain any data. We have to
compute indicator values in NinjaTrader, export them to files and import them to StrategyQuant.
First of all, we have to export the indicator from NinjaTarder. For this we'll need to edit a code of
SQIndyExport indicator.
Go to Tools -> Edit Ninja Script -> Indicators and find SQIndyExport indicator.
Now we'll have to edit the file so that it computes and exports the indicators we want. There are two
functions that we have to edit:
OnStartUp
this is simple, we'll just create new empty files with unique names for every indicator value we want
to export
protected override void OnStartUp() {
createEmptyFile("MACD_NT_Avg"); // MACD_NT_Avg is the export file
name, you can choose any name
createEmptyFile("MACD_NT_Macd");
}
OnBarUpdate
this function is called on every bar and we'll use it to compute indicator data and write it to the
prepared files. How exactly you'll call the indicator to compute its data depends on the indicator
itself, for MACD it works like this:

StrategyQuant User's Guide
109
protected override void OnBarUpdate()
{
appendFile("MACD_NT_Avg", MACD(12, 26, 9).Avg[0]); // MACD(12, 26,
9).Avg[0] is how the Avg value of MACD is computed
appendFile("MACD_NT_Macd", MACD(12, 26, 9)[0]); // every indicator
has its own code
}
That's all, now we can compile this indicator.
When indicator successfully compiled, we can attach it to the chart (the chart must be the same one
which we used to export data for use in StrategyQuant).
It has one parameter - Path - we should put there the path where we want the exported data files to
be stored.
Now click on OK button, SQIndyExport will be added to the chart and it will start computing and
exporting our indicator data.
It might take a few seconds or minutes, depending on the size of your data and speed of your
computer.
Step 4: Loading custom indicator data
When we successfully exported indicator data from NinjaTrader we can import them to
StrategyQuant. Switch to StrategyQuant, go to Data -> Custom Indicators
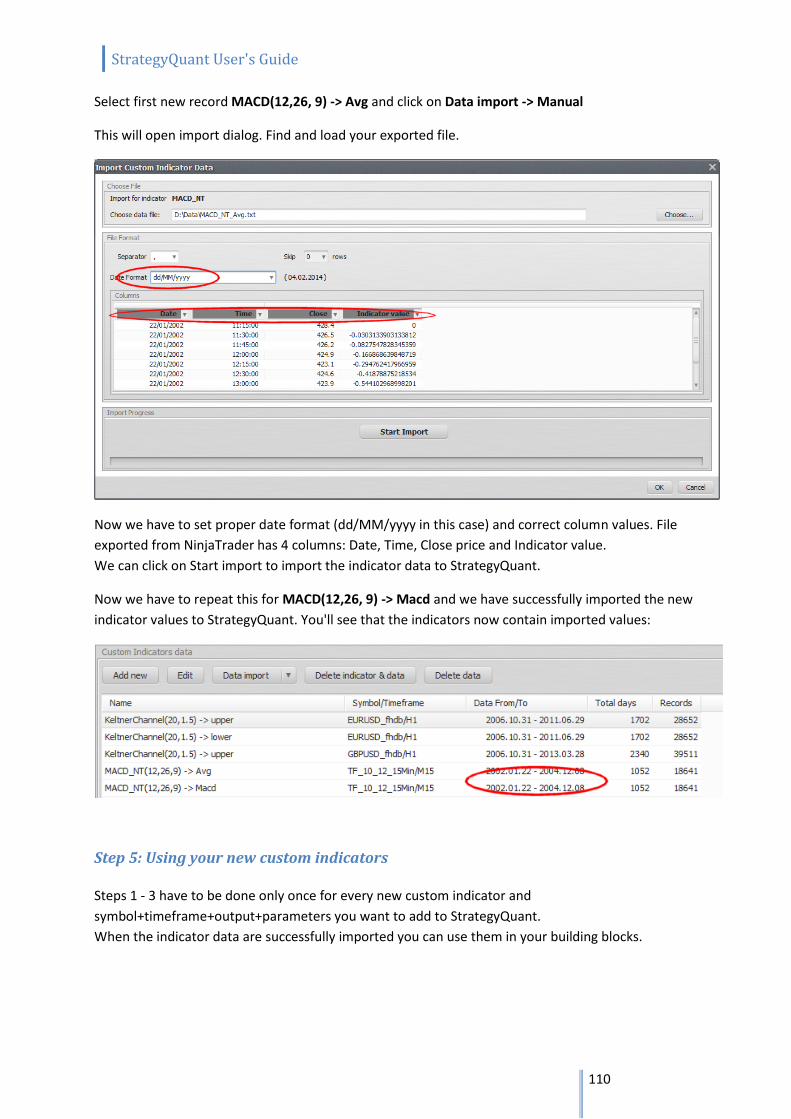
StrategyQuant User's Guide
110
Select first new record MACD(12,26, 9) -> Avg and click on Data import -> Manual
This will open import dialog. Find and load your exported file.
Now we have to set proper date format (dd/MM/yyyy in this case) and correct column values. File
exported from NinjaTrader has 4 columns: Date, Time, Close price and Indicator value.
We can click on Start import to import the indicator data to StrategyQuant.
Now we have to repeat this for MACD(12,26, 9) -> Macd and we have successfully imported the new
indicator values to StrategyQuant. You'll see that the indicators now contain imported values:
Step 5: Using your new custom indicators Steps 1 - 3 have to be done only once for every new custom indicator and
symbol+timeframe+output+parameters you want to add to StrategyQuant.
When the indicator data are successfully imported you can use them in your building blocks.
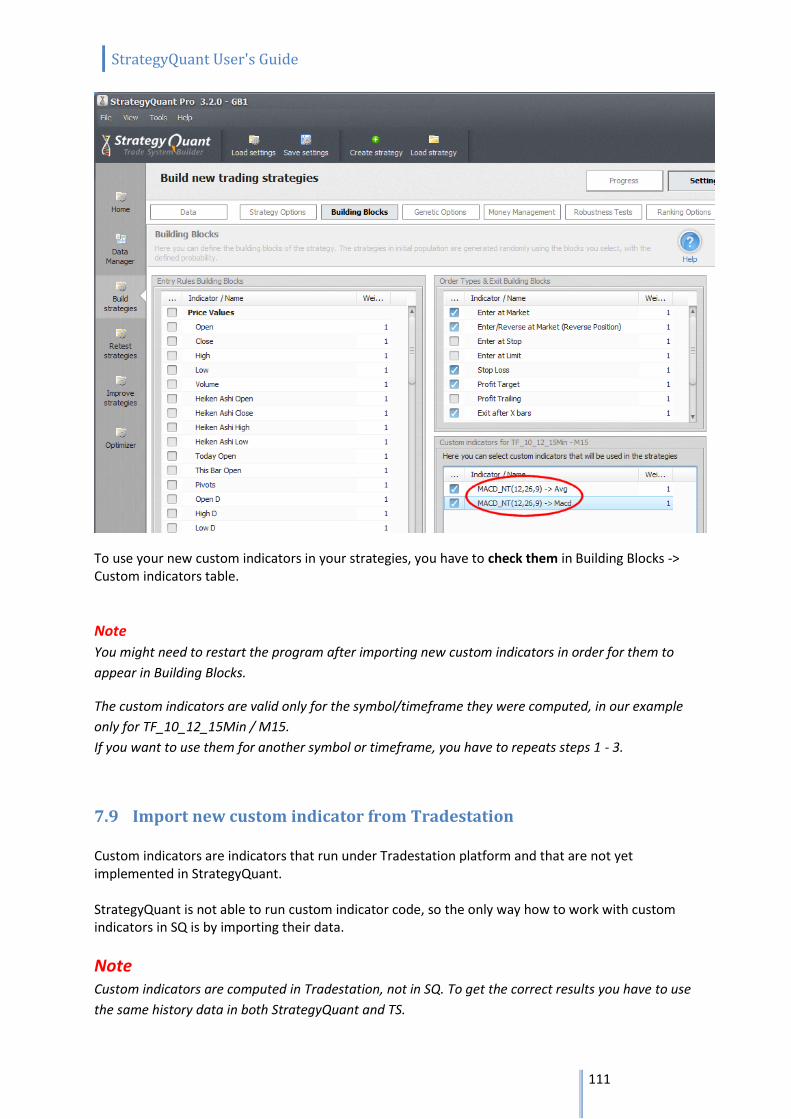
StrategyQuant User's Guide
111
To use your new custom indicators in your strategies, you have to check them in Building Blocks -> Custom indicators table.
Note You might need to restart the program after importing new custom indicators in order for them to
appear in Building Blocks.
The custom indicators are valid only for the symbol/timeframe they were computed, in our example
only for TF_10_12_15Min / M15.
If you want to use them for another symbol or timeframe, you have to repeats steps 1 - 3.
7.9 Import new custom indicator from Tradestation Custom indicators are indicators that run under Tradestation platform and that are not yet implemented in StrategyQuant. StrategyQuant is not able to run custom indicator code, so the only way how to work with custom indicators in SQ is by importing their data.
Note Custom indicators are computed in Tradestation, not in SQ. To get the correct results you have to use
the same history data in both StrategyQuant and TS.
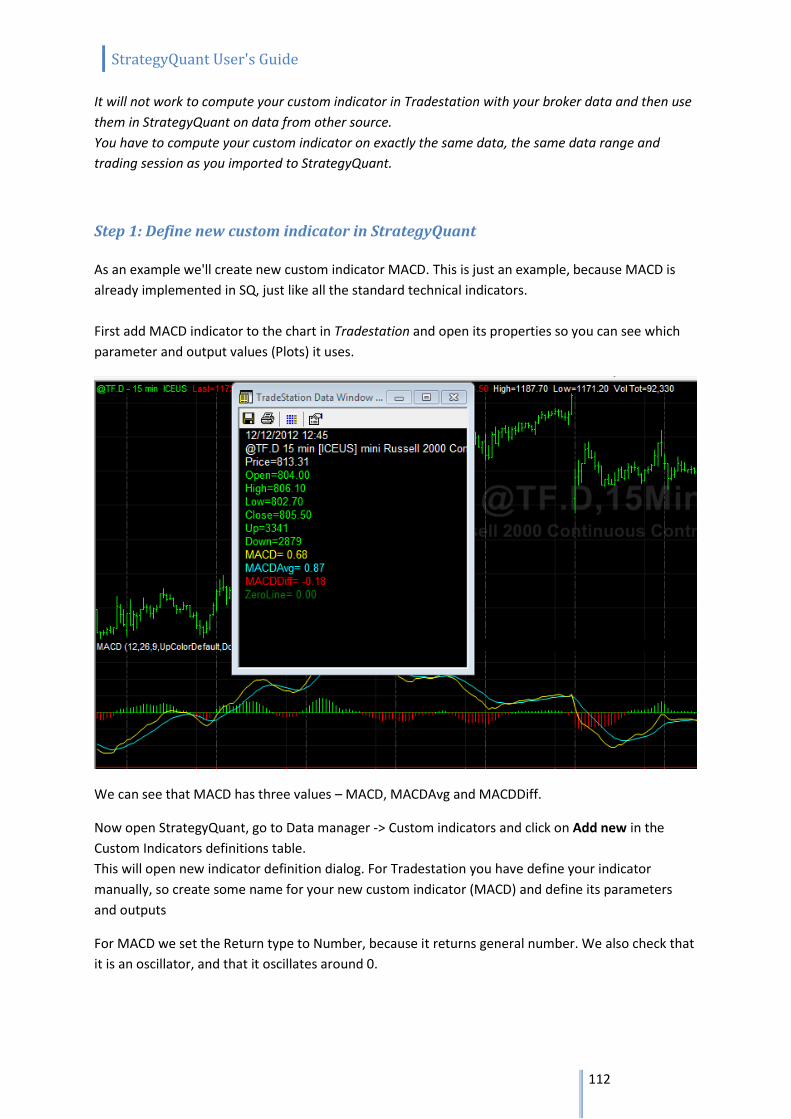
StrategyQuant User's Guide
112
It will not work to compute your custom indicator in Tradestation with your broker data and then use
them in StrategyQuant on data from other source.
You have to compute your custom indicator on exactly the same data, the same data range and
trading session as you imported to StrategyQuant.
Step 1: Define new custom indicator in StrategyQuant
As an example we'll create new custom indicator MACD. This is just an example, because MACD is
already implemented in SQ, just like all the standard technical indicators.
First add MACD indicator to the chart in Tradestation and open its properties so you can see which
parameter and output values (Plots) it uses.
We can see that MACD has three values – MACD, MACDAvg and MACDDiff.
Now open StrategyQuant, go to Data manager -> Custom indicators and click on Add new in the
Custom Indicators definitions table.
This will open new indicator definition dialog. For Tradestation you have define your indicator
manually, so create some name for your new custom indicator (MACD) and define its parameters
and outputs
For MACD we set the Return type to Number, because it returns general number. We also check that
it is an oscillator, and that it oscillates around 0.
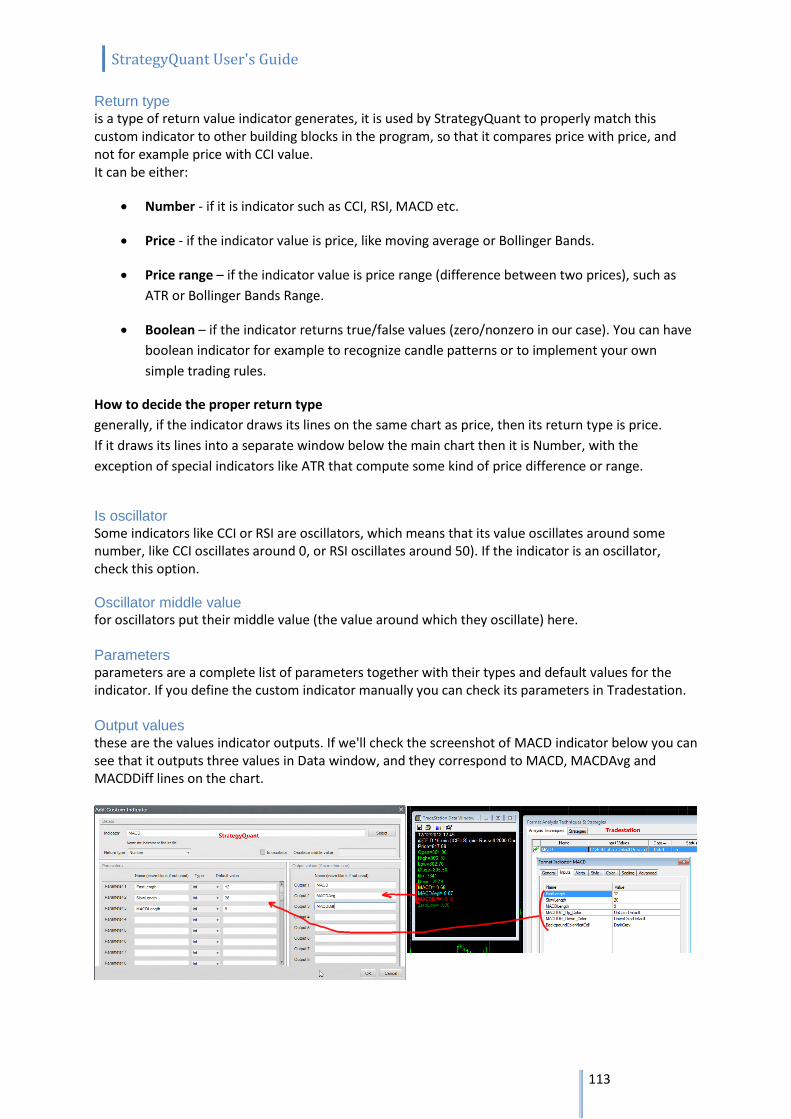
StrategyQuant User's Guide
113
Return type is a type of return value indicator generates, it is used by StrategyQuant to properly match this custom indicator to other building blocks in the program, so that it compares price with price, and not for example price with CCI value. It can be either:
Number - if it is indicator such as CCI, RSI, MACD etc.
Price - if the indicator value is price, like moving average or Bollinger Bands.
Price range – if the indicator value is price range (difference between two prices), such as
ATR or Bollinger Bands Range.
Boolean – if the indicator returns true/false values (zero/nonzero in our case). You can have
boolean indicator for example to recognize candle patterns or to implement your own
simple trading rules.
How to decide the proper return type
generally, if the indicator draws its lines on the same chart as price, then its return type is price.
If it draws its lines into a separate window below the main chart then it is Number, with the
exception of special indicators like ATR that compute some kind of price difference or range.
Is oscillator Some indicators like CCI or RSI are oscillators, which means that its value oscillates around some number, like CCI oscillates around 0, or RSI oscillates around 50). If the indicator is an oscillator, check this option.
Oscillator middle value for oscillators put their middle value (the value around which they oscillate) here. Parameters parameters are a complete list of parameters together with their types and default values for the indicator. If you define the custom indicator manually you can check its parameters in Tradestation. Output values these are the values indicator outputs. If we'll check the screenshot of MACD indicator below you can see that it outputs three values in Data window, and they correspond to MACD, MACDAvg and MACDDiff lines on the chart.
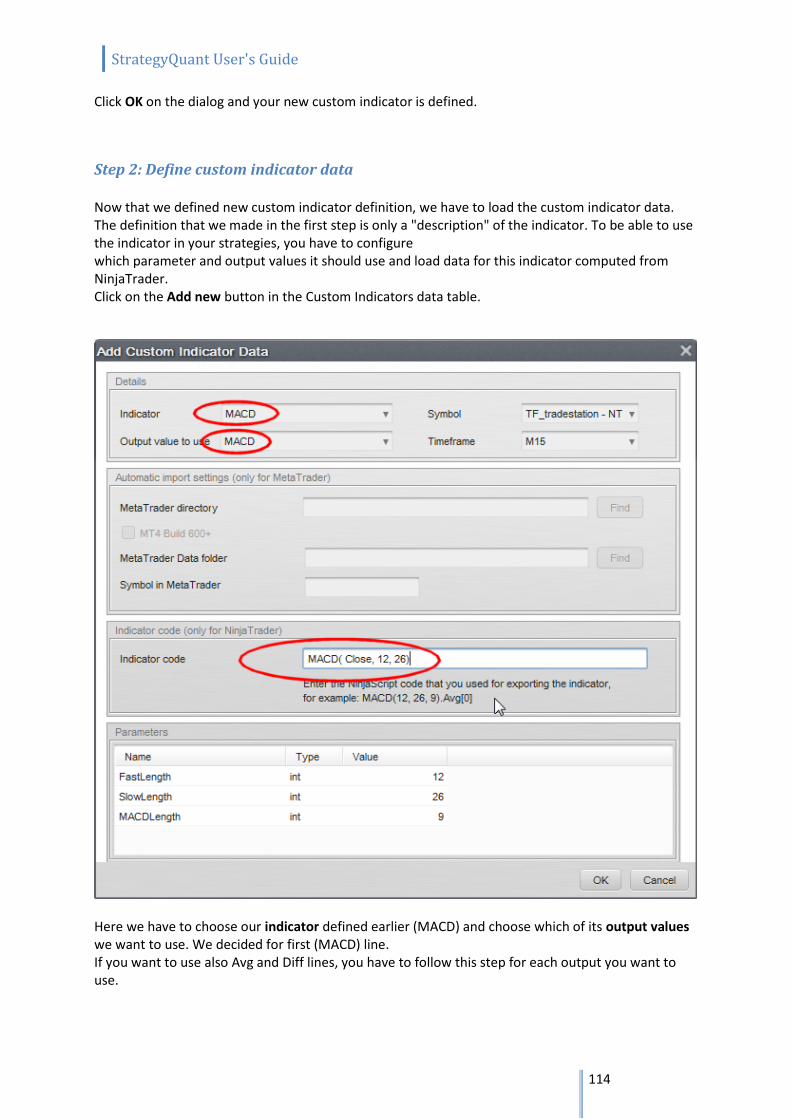
StrategyQuant User's Guide
114
Click OK on the dialog and your new custom indicator is defined.
Step 2: Define custom indicator data Now that we defined new custom indicator definition, we have to load the custom indicator data. The definition that we made in the first step is only a "description" of the indicator. To be able to use the indicator in your strategies, you have to configure which parameter and output values it should use and load data for this indicator computed from NinjaTrader. Click on the Add new button in the Custom Indicators data table.
Here we have to choose our indicator defined earlier (MACD) and choose which of its output values we want to use. We decided for first (MACD) line. If you want to use also Avg and Diff lines, you have to follow this step for each output you want to use.
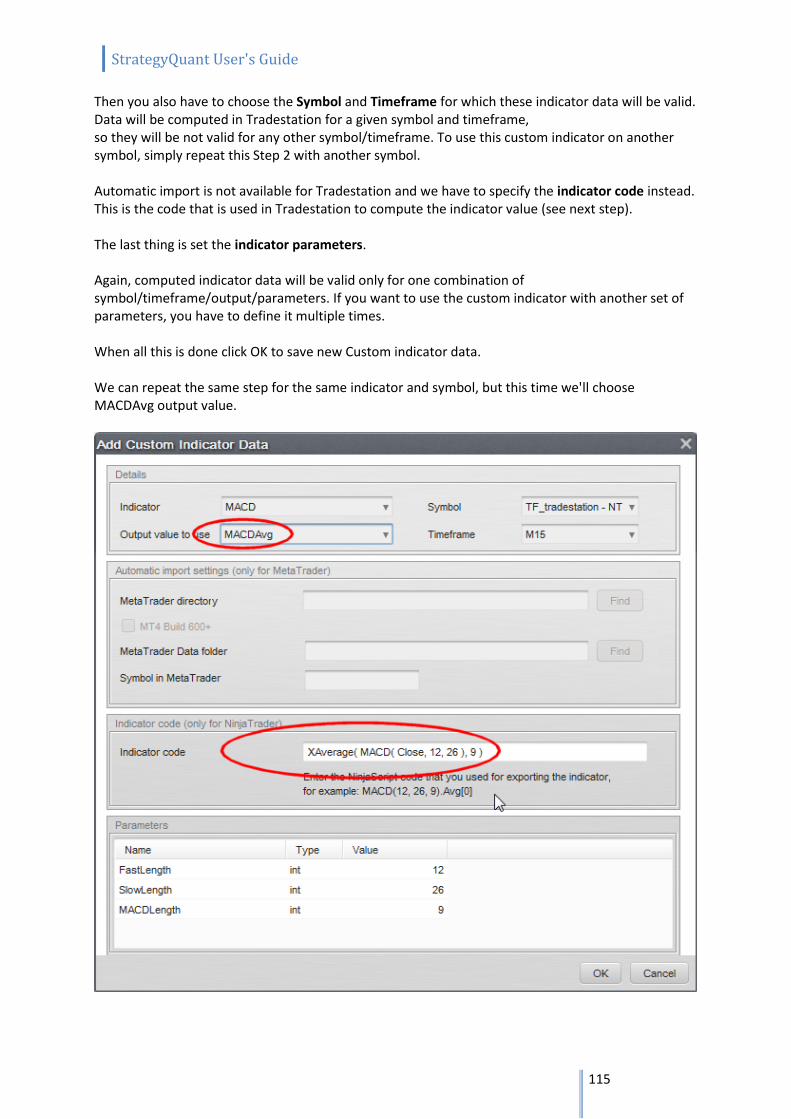
StrategyQuant User's Guide
115
Then you also have to choose the Symbol and Timeframe for which these indicator data will be valid. Data will be computed in Tradestation for a given symbol and timeframe, so they will be not valid for any other symbol/timeframe. To use this custom indicator on another symbol, simply repeat this Step 2 with another symbol. Automatic import is not available for Tradestation and we have to specify the indicator code instead. This is the code that is used in Tradestation to compute the indicator value (see next step). The last thing is set the indicator parameters. Again, computed indicator data will be valid only for one combination of symbol/timeframe/output/parameters. If you want to use the custom indicator with another set of parameters, you have to define it multiple times. When all this is done click OK to save new Custom indicator data. We can repeat the same step for the same indicator and symbol, but this time we'll choose MACDAvg output value.
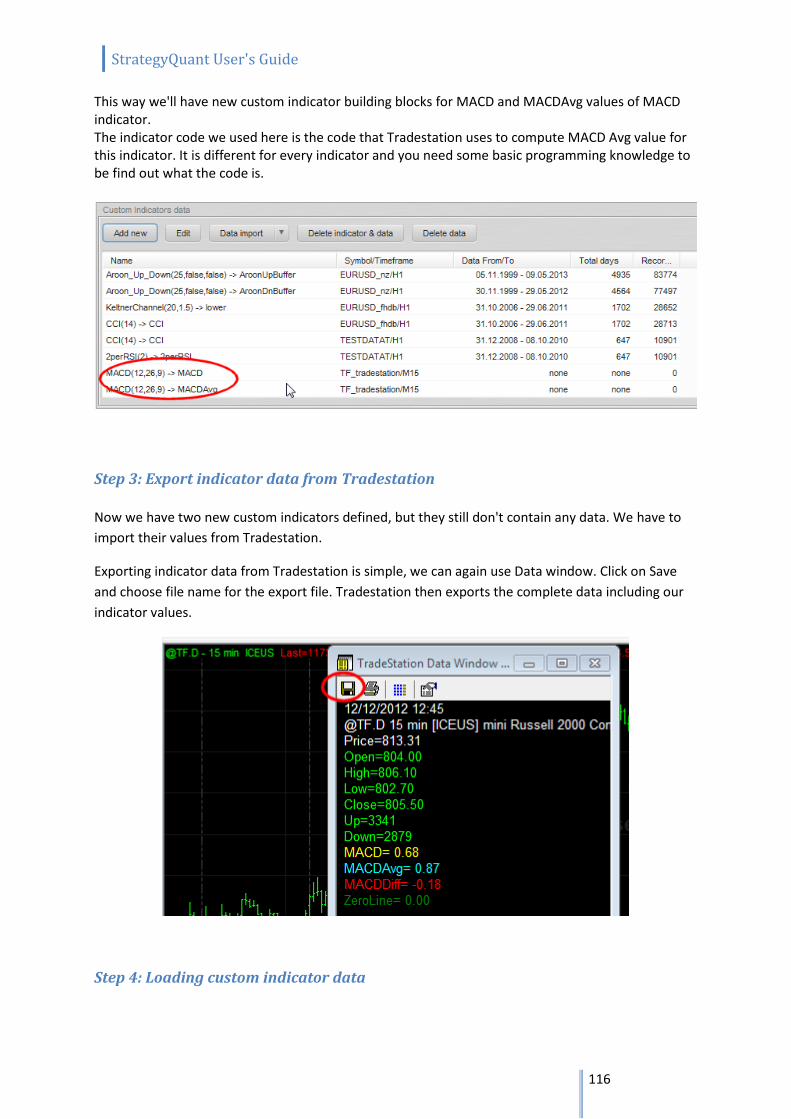
StrategyQuant User's Guide
116
This way we'll have new custom indicator building blocks for MACD and MACDAvg values of MACD indicator. The indicator code we used here is the code that Tradestation uses to compute MACD Avg value for this indicator. It is different for every indicator and you need some basic programming knowledge to be find out what the code is.
Step 3: Export indicator data from Tradestation
Now we have two new custom indicators defined, but they still don't contain any data. We have to
import their values from Tradestation.
Exporting indicator data from Tradestation is simple, we can again use Data window. Click on Save
and choose file name for the export file. Tradestation then exports the complete data including our
indicator values.
Step 4: Loading custom indicator data
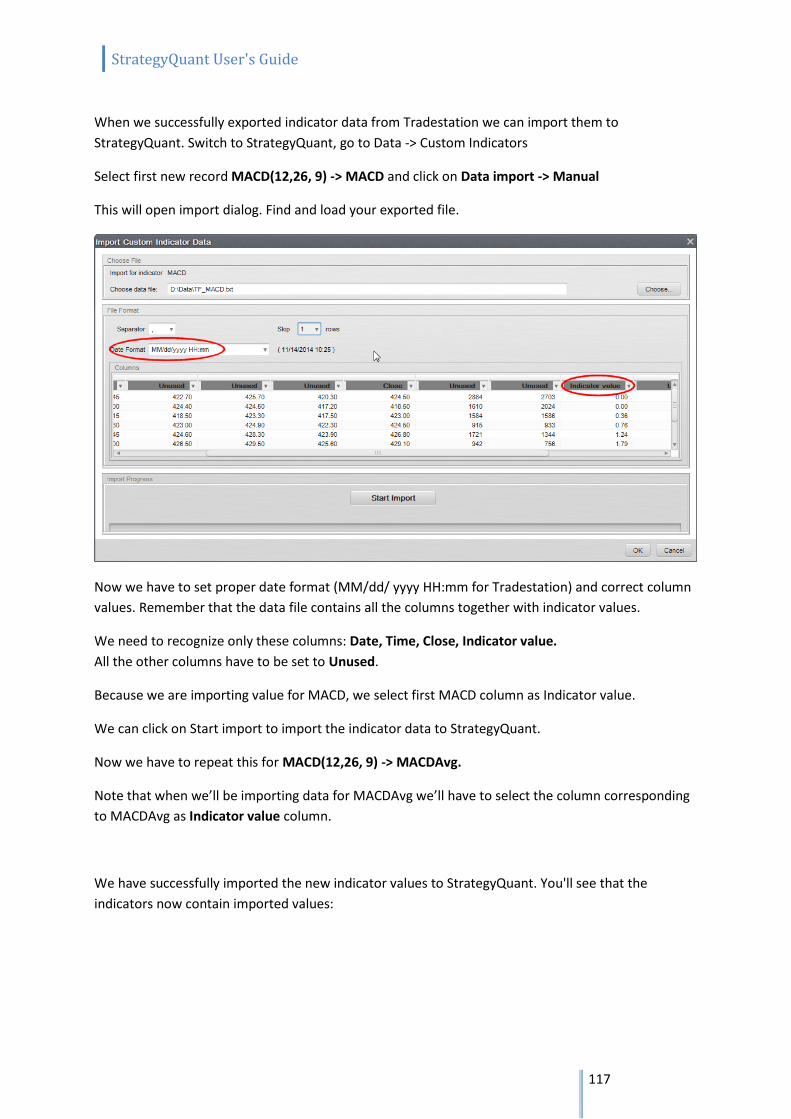
StrategyQuant User's Guide
117
When we successfully exported indicator data from Tradestation we can import them to
StrategyQuant. Switch to StrategyQuant, go to Data -> Custom Indicators
Select first new record MACD(12,26, 9) -> MACD and click on Data import -> Manual
This will open import dialog. Find and load your exported file.
Now we have to set proper date format (MM/dd/ yyyy HH:mm for Tradestation) and correct column
values. Remember that the data file contains all the columns together with indicator values.
We need to recognize only these columns: Date, Time, Close, Indicator value.
All the other columns have to be set to Unused.
Because we are importing value for MACD, we select first MACD column as Indicator value.
We can click on Start import to import the indicator data to StrategyQuant.
Now we have to repeat this for MACD(12,26, 9) -> MACDAvg.
Note that when we’ll be importing data for MACDAvg we’ll have to select the column corresponding
to MACDAvg as Indicator value column.
We have successfully imported the new indicator values to StrategyQuant. You'll see that the
indicators now contain imported values:
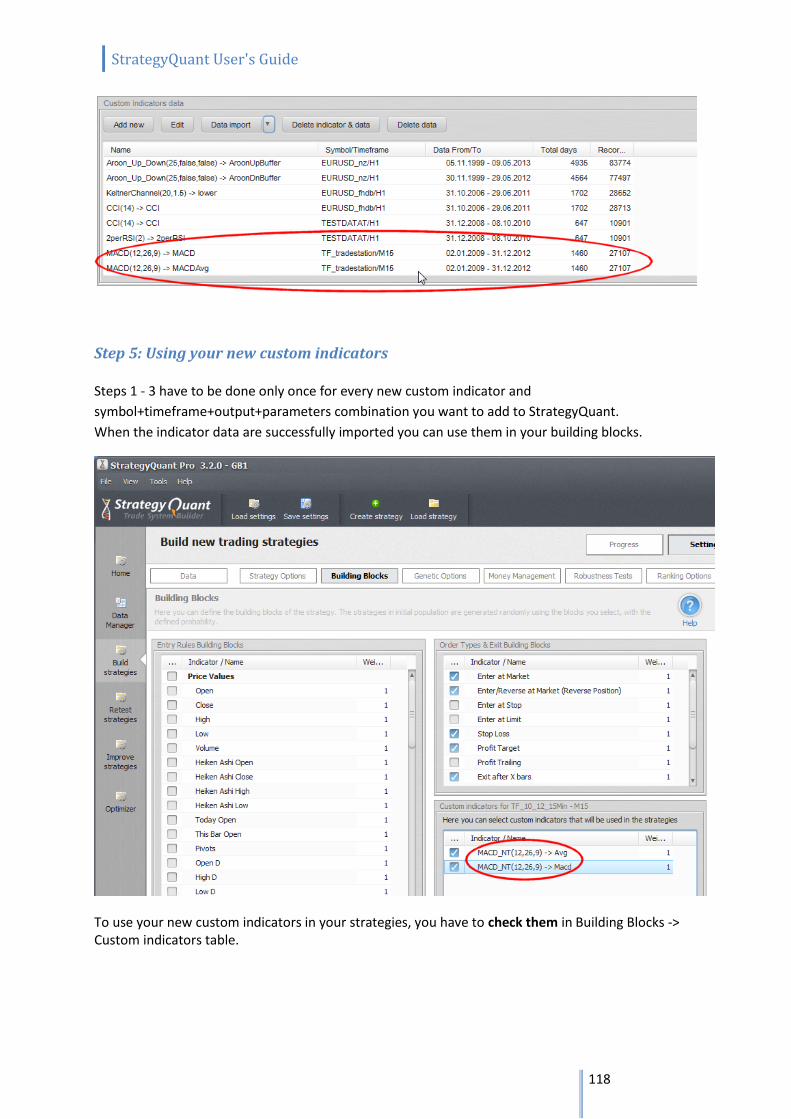
StrategyQuant User's Guide
118
Step 5: Using your new custom indicators Steps 1 - 3 have to be done only once for every new custom indicator and
symbol+timeframe+output+parameters combination you want to add to StrategyQuant.
When the indicator data are successfully imported you can use them in your building blocks.
To use your new custom indicators in your strategies, you have to check them in Building Blocks -> Custom indicators table.
StrategyQuant User's Guide
119
Note You might need to restart the program after importing new custom indicators in order for them to
appear in Building Blocks.
The custom indicators are valid only for the symbol/timeframe they were computed, in our example
only for TF_tradestation / M15.
If you want to use them for another symbol or timeframe, you have to repeat the steps 1 - 3.
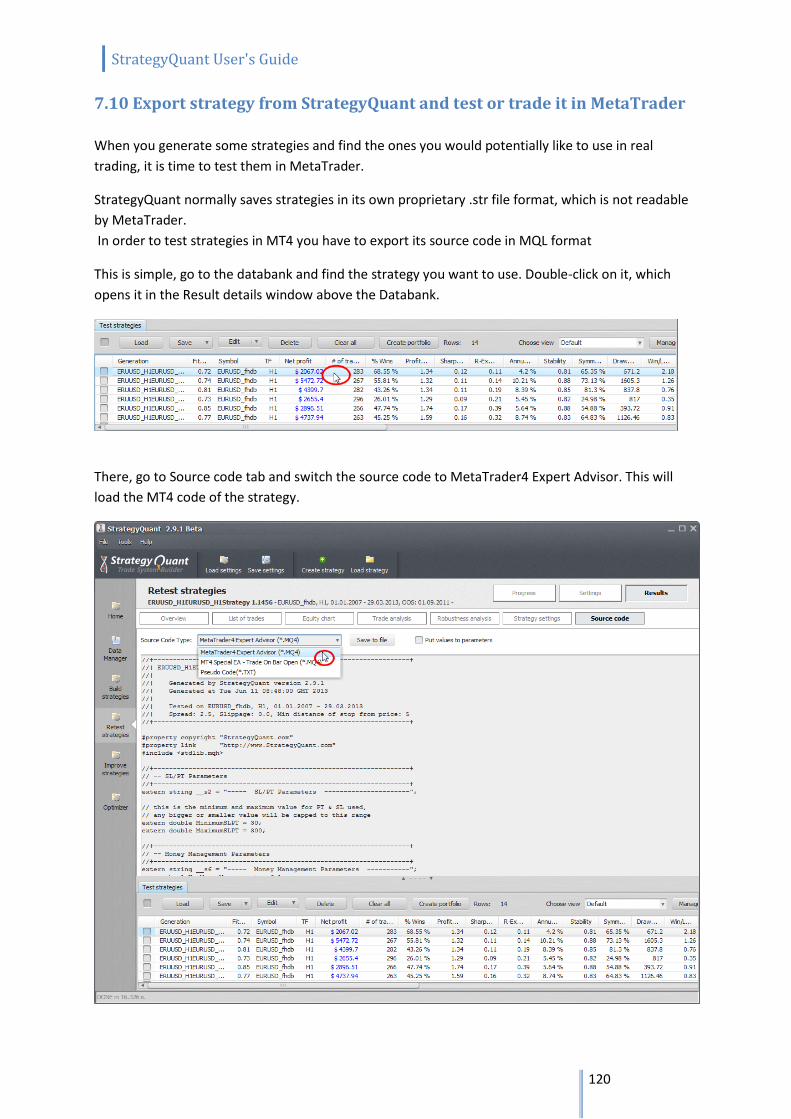
StrategyQuant User's Guide
120
7.10 Export strategy from StrategyQuant and test or trade it in MetaTrader
When you generate some strategies and find the ones you would potentially like to use in real
trading, it is time to test them in MetaTrader.
StrategyQuant normally saves strategies in its own proprietary .str file format, which is not readable
by MetaTrader.
In order to test strategies in MT4 you have to export its source code in MQL format
This is simple, go to the databank and find the strategy you want to use. Double-click on it, which
opens it in the Result details window above the Databank.
There, go to Source code tab and switch the source code to MetaTrader4 Expert Advisor. This will
load the MT4 code of the strategy.
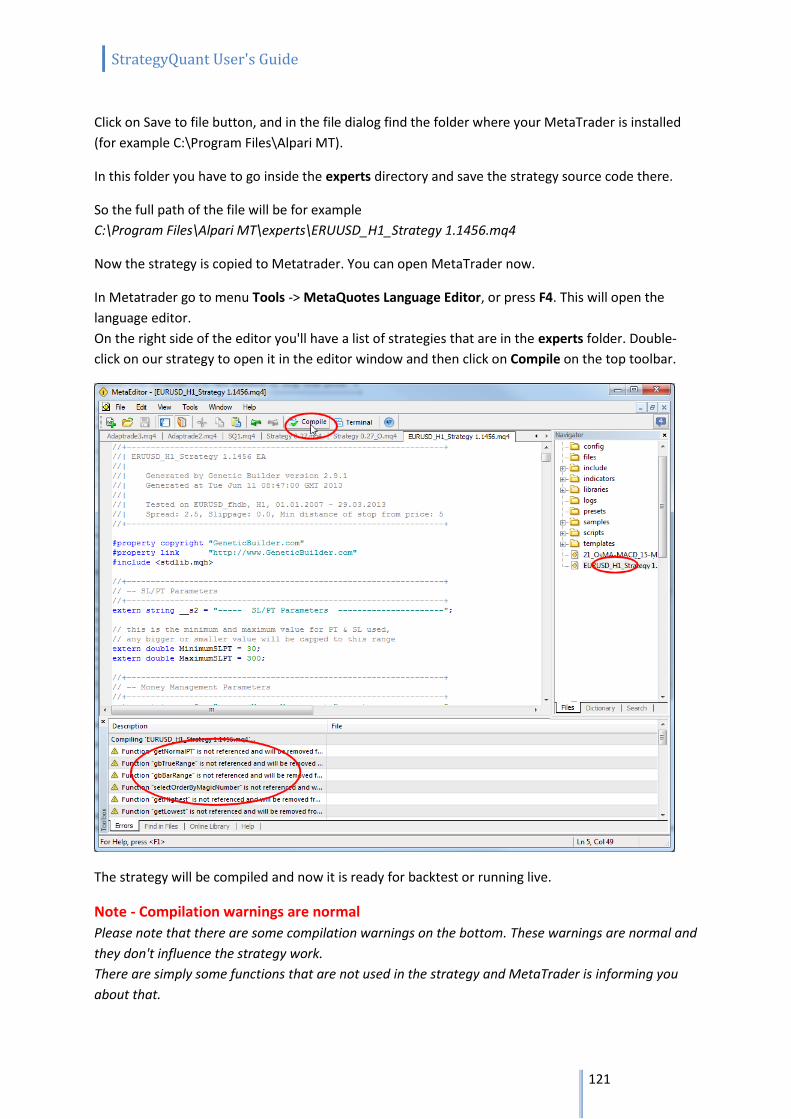
StrategyQuant User's Guide
121
Click on Save to file button, and in the file dialog find the folder where your MetaTrader is installed
(for example C:\Program Files\Alpari MT).
In this folder you have to go inside the experts directory and save the strategy source code there.
So the full path of the file will be for example
C:\Program Files\Alpari MT\experts\ERUUSD_H1_Strategy 1.1456.mq4
Now the strategy is copied to Metatrader. You can open MetaTrader now.
In Metatrader go to menu Tools -> MetaQuotes Language Editor, or press F4. This will open the
language editor.
On the right side of the editor you'll have a list of strategies that are in the experts folder. Double-
click on our strategy to open it in the editor window and then click on Compile on the top toolbar.
The strategy will be compiled and now it is ready for backtest or running live.
Note - Compilation warnings are normal
Please note that there are some compilation warnings on the bottom. These warnings are normal and
they don't influence the strategy work.
There are simply some functions that are not used in the strategy and MetaTrader is informing you
about that.
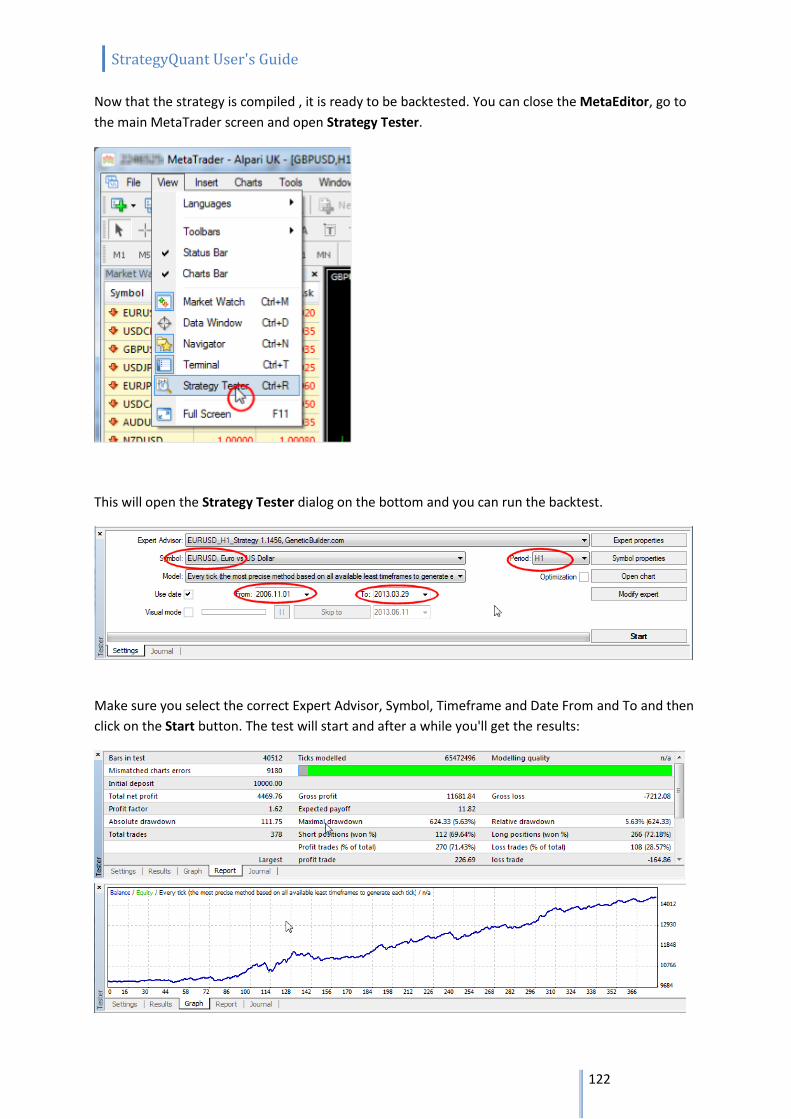
StrategyQuant User's Guide
122
Now that the strategy is compiled , it is ready to be backtested. You can close the MetaEditor, go to
the main MetaTrader screen and open Strategy Tester.
This will open the Strategy Tester dialog on the bottom and you can run the backtest.
Make sure you select the correct Expert Advisor, Symbol, Timeframe and Date From and To and then
click on the Start button. The test will start and after a while you'll get the results:
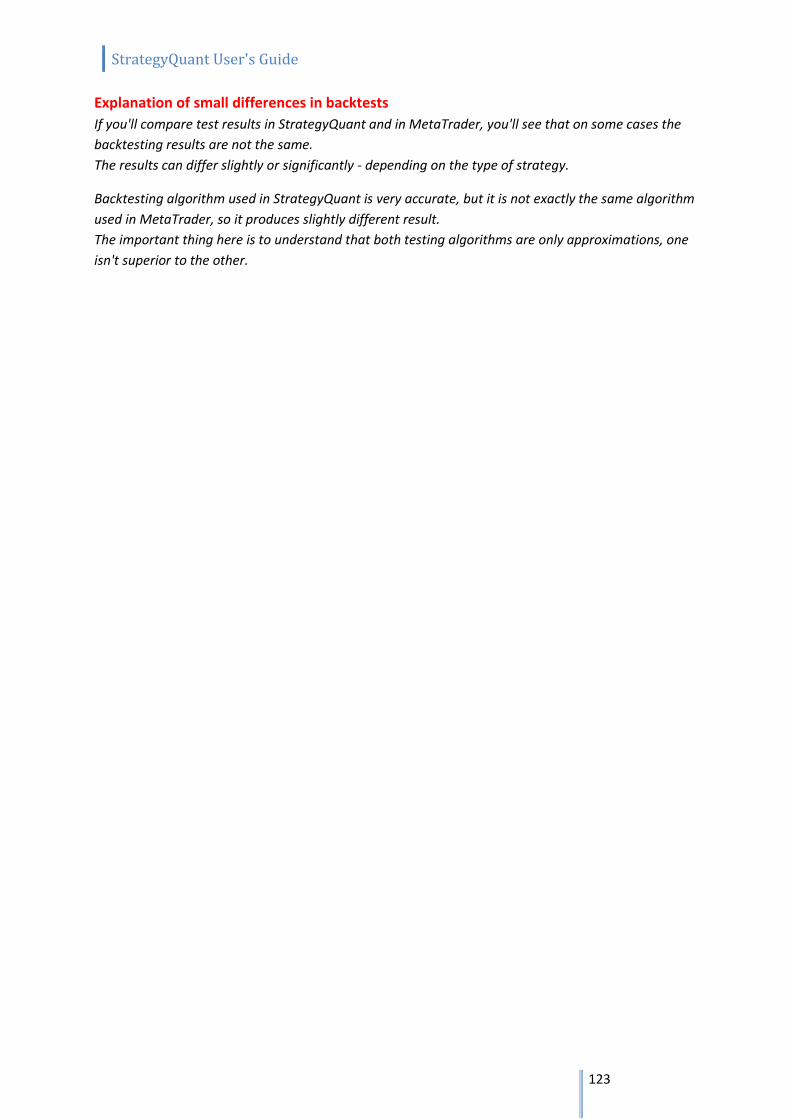
StrategyQuant User's Guide
123
Explanation of small differences in backtests
If you'll compare test results in StrategyQuant and in MetaTrader, you'll see that on some cases the
backtesting results are not the same.
The results can differ slightly or significantly - depending on the type of strategy.
Backtesting algorithm used in StrategyQuant is very accurate, but it is not exactly the same algorithm
used in MetaTrader, so it produces slightly different result.
The important thing here is to understand that both testing algorithms are only approximations, one
isn't superior to the other.
StrategyQuant User's Guide
124
7.11 Export strategy from StrategyQuant and test or trade it in NinjaTrader
When you generate some strategies and find the ones you would potentially like to use in real
trading, it is time to test them in NinjaTrader.
StrategyQuant saves strategies in its own proprietary .str file format, which is nor readable by
NinjaTrader.
In order to test strategies in NinjaTrader you have to export its source code in NinjaScript format
This is simple, go to the databank and find the strategy you want to use. Double-click on it, which
opens it in the Result details window above the Databank.
There, go to Source code tab and switch the source code to NinjaTrader code. This will load the
NinjaScript code of the strategy.
StrategyQuant User's Guide
125
Now right-click into the text area and select Copy to clipboard.
After this open your NinjaTrader, and go to Tools -> New NinjaScript -> Strategy
This will open new strategy wizard:
Click on Unlock code and confirm the dialog by clicking Yes. This will open new strategy editor with
basic strategy code.
Click inside the editor with right mouse and choose Select all from popup menu:
StrategyQuant User's Guide
126
This will select all the text in the strategy. We are doing this because we want to replace the whole
strategy code generated by NinjaTrader wizard by our code generated by StrategyQuant.
Now that the code is selected press Ctrl + V to paste the code from clipboard (remember, you copied
the strategy code to clipboard in StrategyQuant in the beginning.
This will replace the whole code with SQ code. Now press Compile button to compile the strategy
code.
StrategyQuant User's Guide
127
In the ideal case the strategy should compile and there should be no warnings or errors displayed.
From now on you can test your new strategy in NinjaTrader StrategyAnalyzer or trade it in Strategies
tab.
Note If you see some compilation errors make sure you imported StrategyQuant helper codes for
NinjaTrader as described in Post-installation steps
Updating the strategy in NinjaTrader
If you'll make some change in the strategy in StrategyQuant and you'll want to update your strategy
in NinjaTrader, go to Tools -> Edit NinjaScript -> Strategy,
find your strategy by the name and open it in editor. Then copy & paste the code from StrategyQuant
to NinjaTrader editor and compile it again.
Testing the strategy in NinjaTrader
Testing the strategies is described in NinjaTrader manual, so we'll go through it only very briefly.
NinjaTrader can backtest the strategy using Strategy Analyzer. Go to File -> New -> StrategyAnalyzer
there open the Backtest panel on the right and find your strategy.
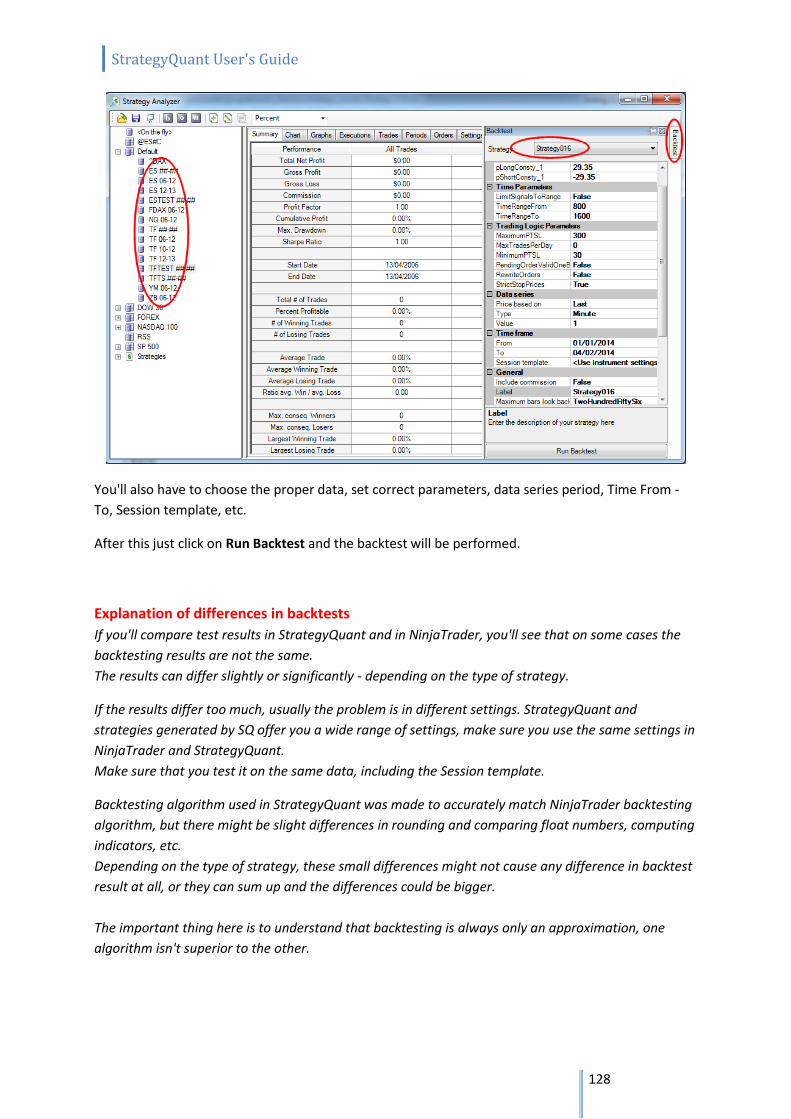
StrategyQuant User's Guide
128
You'll also have to choose the proper data, set correct parameters, data series period, Time From -
To, Session template, etc.
After this just click on Run Backtest and the backtest will be performed.
Explanation of differences in backtests
If you'll compare test results in StrategyQuant and in NinjaTrader, you'll see that on some cases the
backtesting results are not the same.
The results can differ slightly or significantly - depending on the type of strategy.
If the results differ too much, usually the problem is in different settings. StrategyQuant and
strategies generated by SQ offer you a wide range of settings, make sure you use the same settings in
NinjaTrader and StrategyQuant.
Make sure that you test it on the same data, including the Session template.
Backtesting algorithm used in StrategyQuant was made to accurately match NinjaTrader backtesting
algorithm, but there might be slight differences in rounding and comparing float numbers, computing
indicators, etc.
Depending on the type of strategy, these small differences might not cause any difference in backtest
result at all, or they can sum up and the differences could be bigger.
The important thing here is to understand that backtesting is always only an approximation, one
algorithm isn't superior to the other.
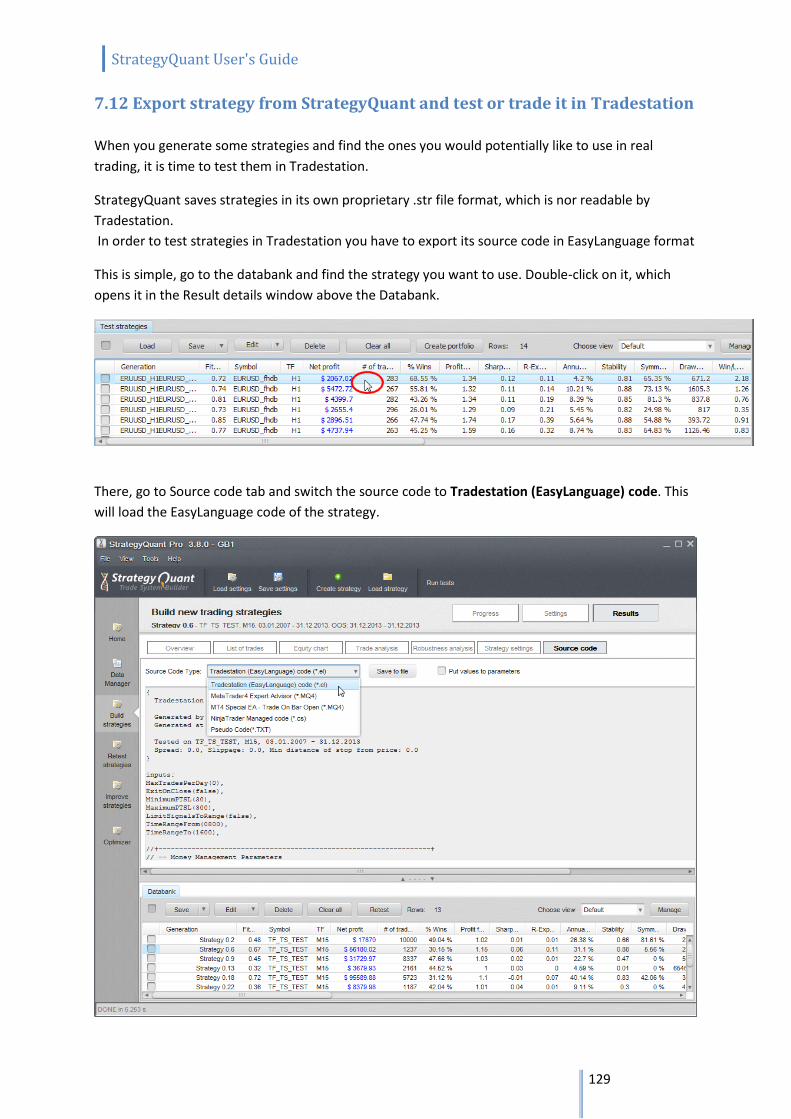
StrategyQuant User's Guide
129
7.12 Export strategy from StrategyQuant and test or trade it in Tradestation
When you generate some strategies and find the ones you would potentially like to use in real
trading, it is time to test them in Tradestation.
StrategyQuant saves strategies in its own proprietary .str file format, which is nor readable by
Tradestation.
In order to test strategies in Tradestation you have to export its source code in EasyLanguage format
This is simple, go to the databank and find the strategy you want to use. Double-click on it, which
opens it in the Result details window above the Databank.
There, go to Source code tab and switch the source code to Tradestation (EasyLanguage) code. This
will load the EasyLanguage code of the strategy.
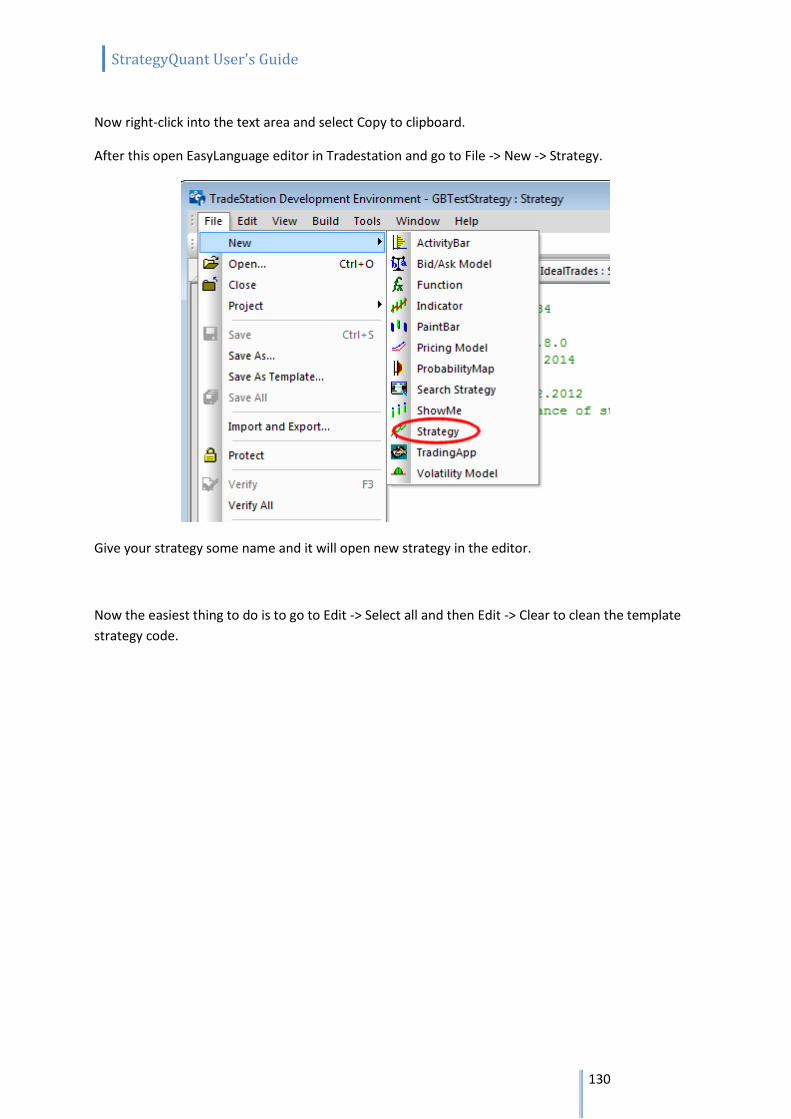
StrategyQuant User's Guide
130
Now right-click into the text area and select Copy to clipboard.
After this open EasyLanguage editor in Tradestation and go to File -> New -> Strategy.
Give your strategy some name and it will open new strategy in the editor.
Now the easiest thing to do is to go to Edit -> Select all and then Edit -> Clear to clean the template
strategy code.
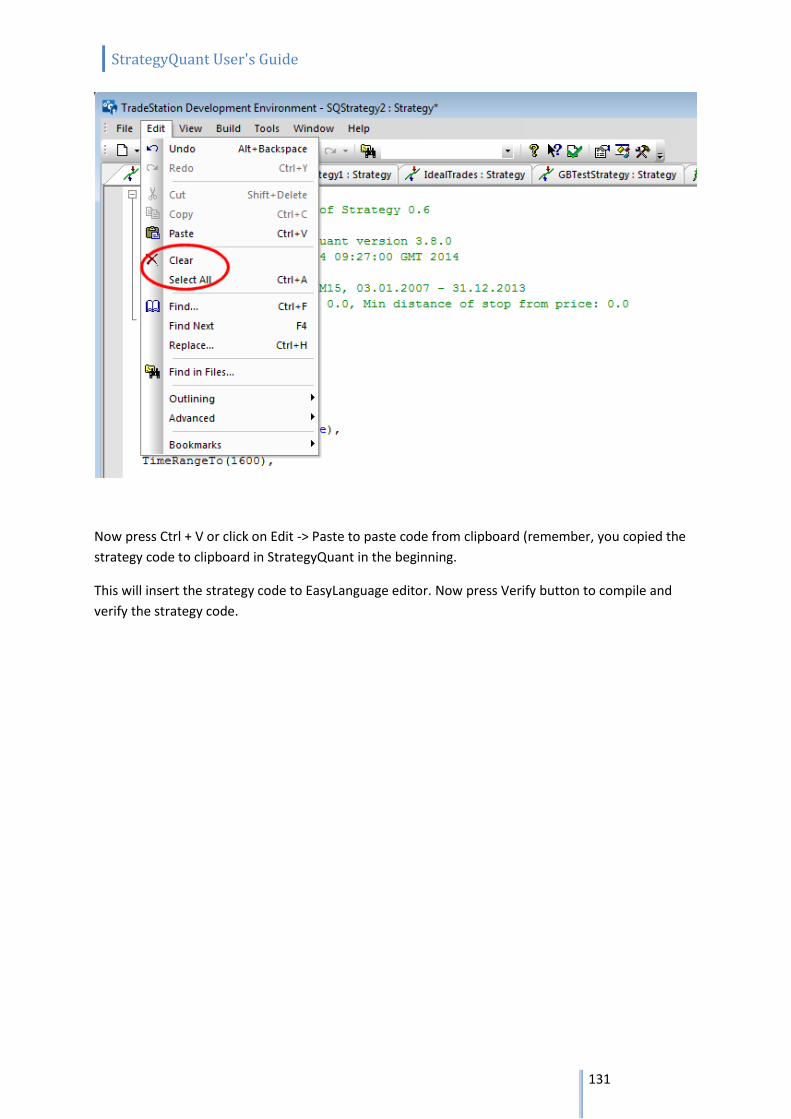
StrategyQuant User's Guide
131
Now press Ctrl + V or click on Edit -> Paste to paste code from clipboard (remember, you copied the
strategy code to clipboard in StrategyQuant in the beginning.
This will insert the strategy code to EasyLanguage editor. Now press Verify button to compile and
verify the strategy code.
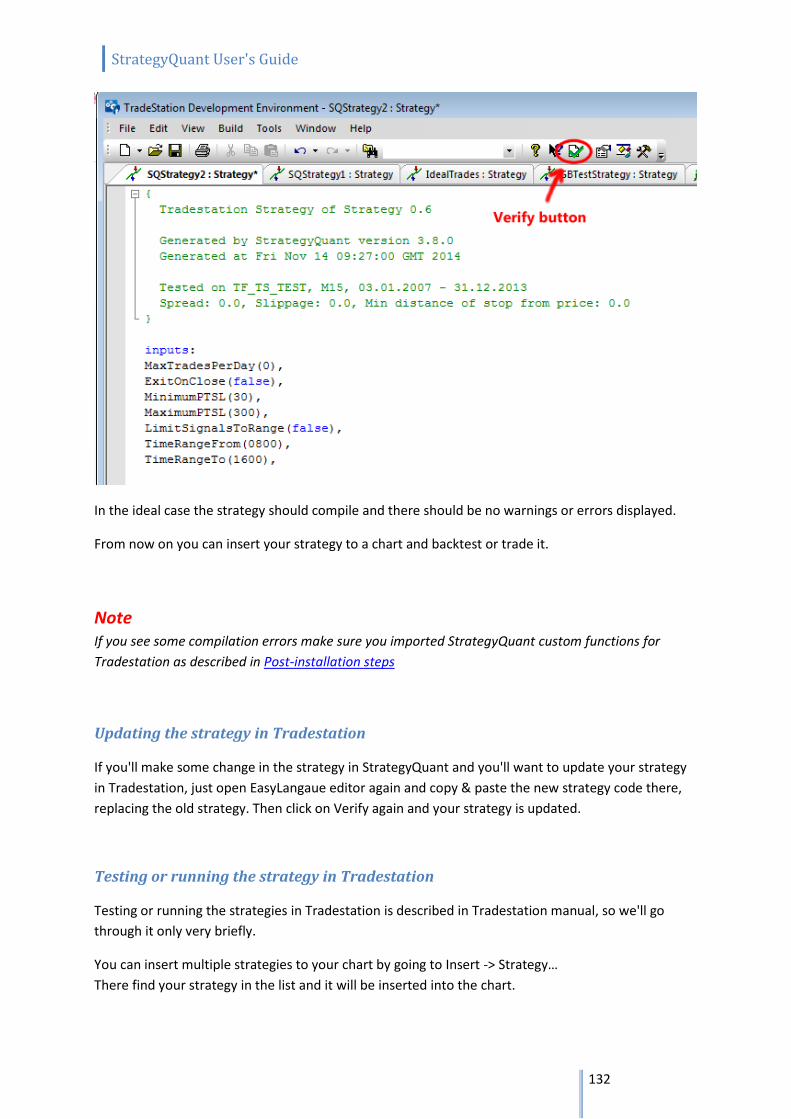
StrategyQuant User's Guide
132
In the ideal case the strategy should compile and there should be no warnings or errors displayed.
From now on you can insert your strategy to a chart and backtest or trade it.
Note If you see some compilation errors make sure you imported StrategyQuant custom functions for
Tradestation as described in Post-installation steps
Updating the strategy in Tradestation
If you'll make some change in the strategy in StrategyQuant and you'll want to update your strategy
in Tradestation, just open EasyLangaue editor again and copy & paste the new strategy code there,
replacing the old strategy. Then click on Verify again and your strategy is updated.
Testing or running the strategy in Tradestation
Testing or running the strategies in Tradestation is described in Tradestation manual, so we'll go
through it only very briefly.
You can insert multiple strategies to your chart by going to Insert -> Strategy…
There find your strategy in the list and it will be inserted into the chart.
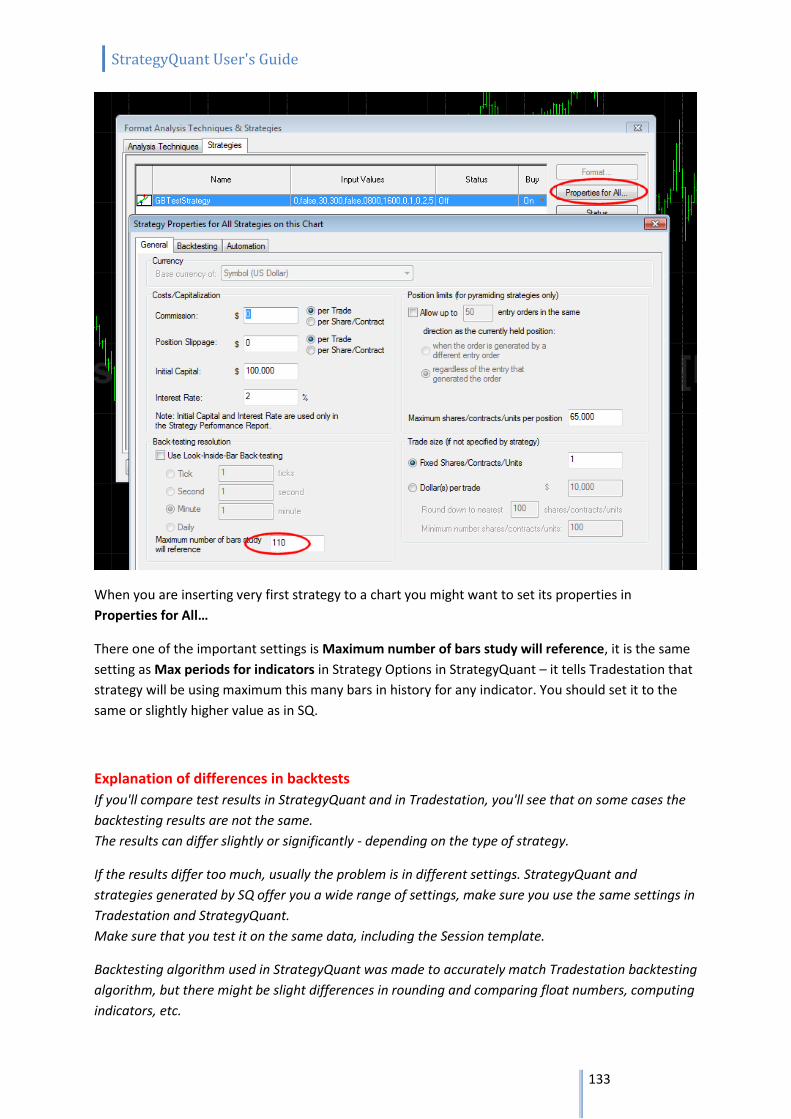
StrategyQuant User's Guide
133
When you are inserting very first strategy to a chart you might want to set its properties in
Properties for All…
There one of the important settings is Maximum number of bars study will reference, it is the same
setting as Max periods for indicators in Strategy Options in StrategyQuant – it tells Tradestation that
strategy will be using maximum this many bars in history for any indicator. You should set it to the
same or slightly higher value as in SQ.
Explanation of differences in backtests
If you'll compare test results in StrategyQuant and in Tradestation, you'll see that on some cases the
backtesting results are not the same.
The results can differ slightly or significantly - depending on the type of strategy.
If the results differ too much, usually the problem is in different settings. StrategyQuant and
strategies generated by SQ offer you a wide range of settings, make sure you use the same settings in
Tradestation and StrategyQuant.
Make sure that you test it on the same data, including the Session template.
Backtesting algorithm used in StrategyQuant was made to accurately match Tradestation backtesting
algorithm, but there might be slight differences in rounding and comparing float numbers, computing
indicators, etc.

StrategyQuant User's Guide
134
Depending on the type of strategy, these small differences might not cause any difference in backtest
result at all, or they can sum up and the differences could be bigger.
The important thing here is to understand that backtesting is always only an approximation, one
algorithm isn't superior to the other.

StrategyQuant User's Guide
135
7.13 Translate program to another language The program is by default in English, but it supports translation to another language. All you have to do is to create a new language file for your language in {StrategyQuant}/lang folder. There is an English.lng file that contains all language strings used in the program. All you have to do is to create a copy of this file, rename it for example to Deutsch.lng (for German) and then open it in plain text editor like Notepad and add translation for every string. The file format is simple – it shows language string in English, then equals (=) sign and after that
should be the string in another language.
For example: version=Your translated string Homepage=Your translated string Get Support=Your translated string etc. When you created new language file just restart the program and you should see your new language in menu View -> Language Notes for translation!
If you use any special characters the file has to be saved in UTF-8 format
For strings that contain special marks like %d, %s these marks will be replaced by the appropriate value by the program. You should use them in the correct places also in your translated text
The length of language string should be not much longer than the length of original string. Use abbreviation if needed. The reason is that there is only a limited place on the user interface for the texts. If you'll use too long text it might not fit to the label.
When you create language file for a new language share it with others! Send it to us and we will include it to the next update of the program.
StrategyQuant User's Guide
136
8 Appendix
8.1 Ranking criteria
Net Profit
Net Profit is a total profit/loss the strategy produced.
Drawdown, Max DD %
Drawdown is the measure of the decline from a historical peak in running cumulative profit of the
strategy. Max DD % is the maximum percentage drawdown of the strategy.
Stagnation, % Stagnation
stagnation is a maximum number of days during which strategy stagnates - which means it doesn't
make a new high on the equity. Obviously you'd want strategy with as little stagnation as possible.
% of Wins
percentage of winning trades
Annual % Return
average annual percentage return of the strategy. If it is 30 %, it means the strategy makes 30% every
year in average.
Annual % Return / Max DD %
important ratio between annual percentage and maximum percentage drawdown. You'd want this
number to be as high as possible.
Avg Daily, Monthly, Yearly profit
average profit for given period in $
Return/DD Ratio
a very good measure of strategy quality, the higher the number, the bigger are profits in relation to
maximum drawdown.
Expectancy
performance metrics developed by Van Tharp, it is computed as (percentage wins * average win) -
(percentage losses * average loss)
StrategyQuant User's Guide
137
R-Expectancy
performance metrics developed by Van Tharp, it gives you the average profit value related to
average risk (R) that you can expect from a system over many trades.
You can find more at: http://www.vantharp.com/tharp-concepts/expectancy.asp
R-Expectancy Score
standard R-Expectancy doesn't consider the length of testing period and number of trades produced.
There is a difference when you make for example $2000 per year by making 10 trades, or by making
100 trades.
R-Expectancy Score adds a score for trades frequency. It is computed as: R-Expectancy *
averageTradesPerYear
SQN (System Quality Number)
performance metrics developed by Van Tharp, it is the measure of the quality of a trading system.
You can find more at: http://www.vantharp.com/tharp-concepts/sqn.asp
Standard interpretation of SQN is:
Score: 1.6 – 1.9 Below average, but trade-able
Score: 2.0 – 2.4 Average
Score: 2.5 – 2.9 Good
Score: 3.0 – 5.0 Excellent
Score: 5.1 – 6.9 Superb
Score: 7.0 - Keep this up, and you may have the Holy Grail.
SQN Score (System Quality Number Score)
just like in case of R-Expectancy, SQN doesn't consider the length of testing period and number of
trades produced. In fact it is more favorable for systems that produce more trades, without
considering the length of the testing period.
It is computed as: SQN * (averageTradesPerYear / 100)
Number of trades
simply a number of trades of this strategy in the backtest. You can use this criterion to approximate
some preset value you would like to achieve (for example total 100 trades ). The value of this
criterion will be bigger for strategies closer to the desired number of trades.
Stability
a special value in range from 0 (worst) to 1 (best) that measures how stable is growth of the equity
chart.
StrategyQuant User's Guide
138
You can see three sample strategies on the picture above. All of them finished with the same profit,
but Strategy 1 was growing almost linearly (very stable), Strategy 2 was growing with occasional big
drawdowns (less stable) and Strategy 3 was moving up and down (very little stability of growth).
Stability is a value that is quite good in representing a "quality" of the trading strategy and it can be
used as the only one or the main criterion to compute the total strategy Fitness.
Symmetry
criterion to maximize strategy symmetry. Symmetry value is in %, and it is measuring how much is
the Profit/Loss for Long direction similar to Short direction.
For example, if strategy makes $600 on Long trades, and $400 on Short trades, symmetry in this case
is 66%. ($400 is 66% from $600).
If the strategy makes the same profit on both directions, the symmetry will be 100%. If one of the
directions produces loss or 0 profit, the symmetry will be 0%.
Win/Loss Ratio
criterion to maximize the ratio of winning trades vs. losing ones
Average Win, Average Loss
criterion to maximize average win or minimize average loss per trade
Average Bars in Trade
criterion to minimize the average number of bars the trade is open
Average Bars Win, Average Bars Loss
criterion to minimize the average number of bars for the winning/losing trade
Degrees of Freedom in a trading system relates to the number of criteria that are used to filter price action and/or volume and determine entry points. The more criteria and variables used to determine entry timing points, the fewer degrees of freedom the system will have and vice versa.

StrategyQuant User's Guide
139
Degrees of freedom are computed from strategy complexity and number of trades. The simpler the strategy is, the more degrees of freedom it will have. For this property, the bigger value is better.
Complexity measures the complexity of the strategy. It is simply a count of all the indicators, prices, operators and other building blocks that are used in the strategy. The higher this number is, the more “complicated” the strategy is. For this property, the smaller value is better.
Both properties can be used also in the ranking to influence the Fitness function.
StrategyQuant User's Guide
140
8.2 Entry and exit types
Profit Target (PT) is the opposite of the Stop Loss, it can be used to take the profit once the price moves in your favor. As in the example above, you can set up a profit target to close the position once it makes for example 100 pips.
Exit After X Bars
this is very simple exit condition. If used, the strategy will close the trade after given number of bars
(time periods on a given timeframe).
This is many times a simple, but effective way to close the trade when the market moves sideways or
when we want to lock in the profit.
Move Stop Loss to Break-Even
another simple but quite powerful condition. It tells the strategy to move protective Stop Loss to the
entry price (break-even) when the given profit is reached. This will not close the trade, so the
strategy will be still in position, but there is zero risk after this move. Because SL is at the entry price
we'll not lose anything even if the trade reverses and goes against us.
This condition is evaluated only on open bar (not on every tick).
Profit Trailing
a simple trailing stop that trails the Stop Loss specified distance from highest achieved profit. This
condition is evaluated on open bar (not on every tick).
Stop Trailing
more advanced trailing stop that can use a value of indicator or price (Open, High, Low, Close) to trail
the Stop Loss. For example the rule can trail SL at Lowest(20) + 20 pips.
This condition is evaluated on open bar (not on every tick).
Exit Rule (Price + Operators + Indicators, ...)
it is a special type of exit where strategy has not only rules for entering the trade (Entry rules) but
also rules for exiting it (Exit rules). Exit rules look as same as entry rules - it is a combination of all the
selected building blocks( indicators, operators, price values).
Example of entry and exit rule pair:
Entry Rule - if CCI > 0 Enter at Market
Exit Rule - if RSI crosses above 100 and we are in long position then Close Trade
Note on Stop Loss / Profit Target/Move Stop Loss to BE
Both Stop Loss and Profit Target can have either fixed value in pips (like 30, 50 or 100 pips), or they
can be based on ATR (Average True Range), for example 2*ATR.
This means that the actual value of the SL/PT will be 2 times the value of average true range at the
time the trade was opened.

StrategyQuant User's Guide
141
ATR based SL/PT have the advantage that they "adapt" to changed market conditions and changes of
volatility. Some strategies (but not all of them) can be more profitable when they use ATR based
SL/PT instead of fixed one.
To enable/disable ATR for SL/PT, you can enable/disable the Average True Range indicator in the
Entry Building Blocks.
StrategyQuant User's Guide
142
9 Final Words
Congratulations on completing the guide to StrategyQuant. I hope you'll like the program and you'll
use it as an important part of your trading.
StrategyQuant is very new program, and it is underactive development. This means you can look
forward for new exciting features that will move the program functionality even further.
I'm open to a new ideas or suggestions, so if you are missing something in StrategyQuant or if you
think something can work in a different way, don't hesitate to let me know.
I wish you many successful trades,
Mark Fric
P.S. I would love to hear your success stories, so please let me know at
mailto:[email protected]