Embed Size (px)
Citation preview

Strathprints Institutional Repository
Roscoe, Andrew J. and Burt, G.M. and McDonald, J.R. (2009) Frequency and fundamentalsignal measurement algorithms for distributed control and protection applications. IET GenerationTransmission and Distribution, 3 (5). pp. 485-495. ISSN 1751-8687
Strathprints is designed to allow users to access the research output of the University of Strathclyde.Copyright c© and Moral Rights for the papers on this site are retained by the individual authorsand/or other copyright owners. You may not engage in further distribution of the material for anyprofitmaking activities or any commercial gain. You may freely distribute both the url (http://strathprints.strath.ac.uk/) and the content of this paper for research or study, educational, ornot-for-profit purposes without prior permission or charge.
Any correspondence concerning this service should be sent to Strathprints administrator:mailto:[email protected]
http://strathprints.strath.ac.uk/

This paper is a postprint of a paper submitted to and accepted for publication in IET Generation, Transmission and Distribution (GTD) and is subject to IET copyright. The copy of record is available at [http://digital-library.theiet.org/]” and the paper is available through IEEE Xplore at [http://ieeexplore.ieee.org/xpls/abs_all.jsp?arnumber=4907255]
Page 1 of 26
Frequency and fundamental signal measurement algorithms for distributed control and protection applications
A.J. Roscoe, G.M. Burt and J.R. McDonald
Abstract: Increasing penetration of distributed generation within electricity networks leads to the
requirement for cheap, integrated, protection and control systems. To minimise cost,
algorithms for the measurement of AC voltage and current waveforms can be implemented
on a single microcontroller which also carries out all other protection and control tasks,
including communication and data logging. This limits the frame rate of the major
algorithms, although Analogue to Digital Converters (ADCs) can be over-sampled using
peripheral control processors on suitable microcontrollers. Measurement algorithms also
have to be tolerant of poor power quality which may arise within grid-connected or
islanded (e.g. emergency, battlefield or marine) power system scenarios. This paper
presents a “Clarke-FLL hybrid” architecture which combines a 3-phase Clarke
transformation measurement with a Frequency Locked Loop (FLL). This hybrid contains
suitable algorithms for the measurement of frequency, amplitude and phase within
dynamic 3-phase AC power systems. The Clarke-FLL hybrid is shown to be robust and
accurate, with harmonic content up to and above 28% THD, and with the major algorithms
executing at only 500 samples per second. This is achieved by careful optimisation and
cascaded use of exact-time averaging techniques, which prove to be useful at all stages of
the measurements: from DC bias removal through low-sample-rate Fourier analysis to
sub-harmonic ripple removal. Platform-independent algorithms for three-phase nodal
power flow analysis are benchmarked on three processors including the Infineon TC1796
microcontroller, on which only 10% of the 2000μs frame time is required, leaving the
remainder free for other algorithms.

This paper is a postprint of a paper submitted to and accepted for publication in IET Generation, Transmission and Distribution (GTD) and is subject to IET copyright. The copy of record is available at [http://digital-library.theiet.org/]” and the paper is available through IEEE Xplore at [http://ieeexplore.ieee.org/xpls/abs_all.jsp?arnumber=4907255]
Page 2 of 26
1 Introduction
This paper presents an architecture for the measurement of frequency, amplitude and
phase within 3-phase AC power systems. The architecture is designed to fulfil a number of
emerging requirements pertinent to distributed generation and microgrid control
applications:
The measurements must settle quickly; within ~5 cycles for a frequency or voltage
measurement used by a droop controller, and within ~2 cycles for an amplitude
measurement used for protective relaying. The measurements must be able to
track rapid frequency changes up to 10Hz/s during islanded operation.
The measurement of frequency should be able to ride through single-phase,
two-phase and partial-depth three-phase faults indefinitely. The frequency
measurement should also be able to ride through a full-depth three-phase fault for
a configurable amount of time.
To enable deployment on cheap microcontrollers, the major signal processing
algorithms should be able to operate at a fixed frame rate, possibly clocking as
slowly as 10 samples per cycle (500Hz for a 50Hz power system; a frame time of
2000μs). The execution time of the measurements should take much less than
2000μs; this allows other protection and control applications, including
communications and data logging applications, to share the same processor.
The architecture and algorithm should operate with acceptable accuracy under the
influence of significant levels of harmonics, inter-harmonics, unbalance, flicker,
and instrumentation/ADC noise. A suitable target frequency measurement
accuracy (ripple) is ±0.005Hz. Voltage amplitude measurement accuracy (ripple)
should be better than ±0.01pu for 2-cycle measurements (protective relaying) and
better than ±0.001pu for 5-cycle measurements used as inputs to reactive-power
droop controllers.
The simplest examples of algorithms for single-phase amplitude measurement are the
2-sample and 3-sample techniques for amplitude measurement [1], which give poor results
This paper is a postprint of a paper submitted to and accepted for publication in IET Generation, Transmission and Distribution (GTD) and is subject to IET copyright. The copy of record is available at [http://digital-library.theiet.org/]” and the paper is available through IEEE Xplore at [http://ieeexplore.ieee.org/xpls/abs_all.jsp?arnumber=4907255]
Page 3 of 26
in the presence of harmonic or noise contamination. Amplitudes can also be measured
using very slow (under-sampled) rates as presented by [2], although these techniques rely
on more static network conditions than the requirements of this paper allow. Amplitude
measurements can also be made using Fourier-based algorithms, with sensible
implementations available in [3]. These algorithms function at low sample rates down to
10 samples-per-cycle, and this paper presents methods for substantially decreasing the
output ripple due to harmonic contamination and interpolation at such low sample rates.
The simplest frequency measurement is the zero-crossing method, which is adapted in [4]
to reduce the errors due to interpolation at low sample rates. The final result, however, is
still subject to relatively large errors up to 0.05Hz under test conditions of 0.3pu 3rd
harmonic and a 30dB Signal to Noise ratio (SNR), using a 1440Hz sample rate. Other
methods for “instantaneous” frequency measurement of single-phase waveforms such as
[5] are also very sensitive to harmonics and noise, and require pre-filters of significant
latency in order to reject these effects. In [6] an algorithm is designed to be immune to
harmonic contamination, but still provides relatively poor performance (0.1Hz accuracy)
even at very high sample rates of nearly 30kHz.
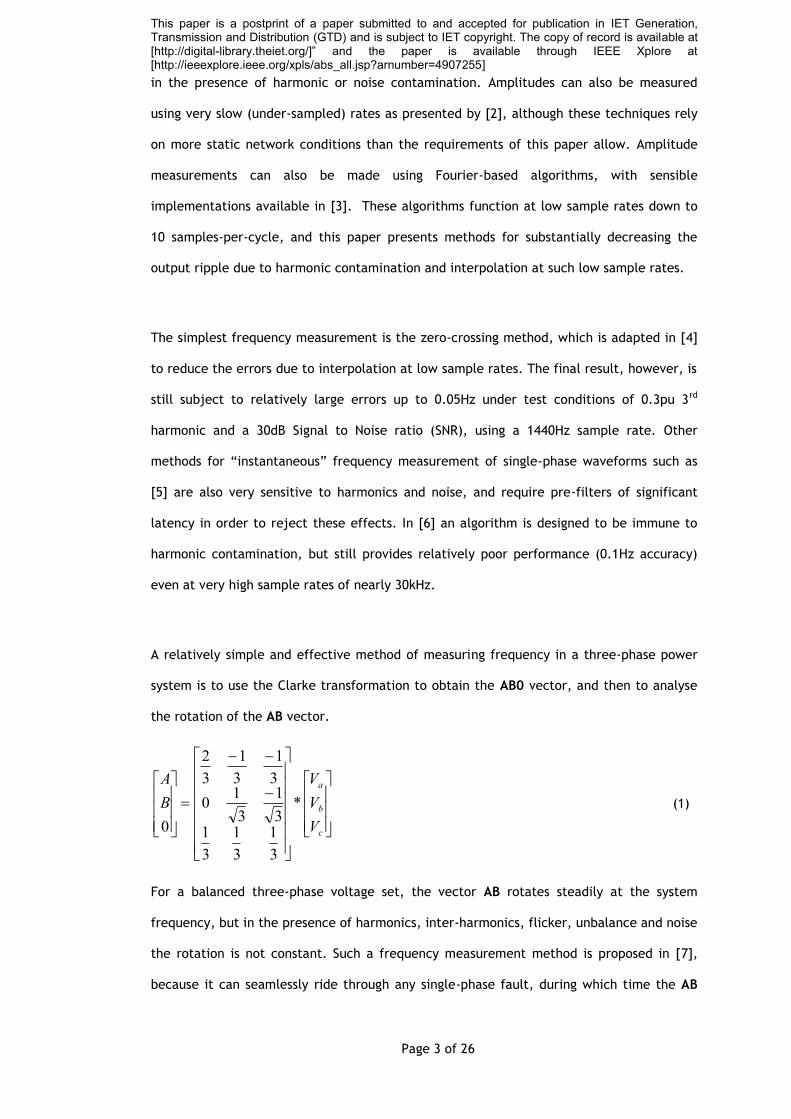
A relatively simple and effective method of measuring frequency in a three-phase power
system is to use the Clarke transformation to obtain the AB0 vector, and then to analyse
the rotation of the AB vector.
c
b
a
V
V
V
B
A
*
3
1
3
1
3
13
1
3
10
3
1
3
1
3
2
0
(1)
For a balanced three-phase voltage set, the vector AB rotates steadily at the system
frequency, but in the presence of harmonics, inter-harmonics, flicker, unbalance and noise
the rotation is not constant. Such a frequency measurement method is proposed in [7],
because it can seamlessly ride through any single-phase fault, during which time the AB
This paper is a postprint of a paper submitted to and accepted for publication in IET Generation, Transmission and Distribution (GTD) and is subject to IET copyright. The copy of record is available at [http://digital-library.theiet.org/]” and the paper is available through IEEE Xplore at [http://ieeexplore.ieee.org/xpls/abs_all.jsp?arnumber=4907255]
Page 4 of 26
vector trajectory changes from a circle to an ellipse [8]. However, AB vector angle change
in [7] is only measured on a sample-by-sample basis and not averaged over a half-cycle or
full-cycle period, and thus must be smoothed substantially to remove the ripple effects
introduced by harmonics and unbalance. Additionally, the AB vector angle change in [7] is
estimated using a Cartesian coordinate system instead of an atan2() function; this
introduces problems during large changes of signal amplitude. This mathematical
simplification avoids the computation time of the atan2() function, in a similar manner to
the avoidance of the sin() and cos() functions in [9], which was a sensible approach in the
1990s. Modern microcontrollers such as the Infineon TC1796 can compute atan2() in less
than 0.75μs and sine/cosine in 0.6μs, times which are not much greater than the execution
time of lookup tables (0.5μs) or other approximated algorithms. Thus, this paper proposes
that trigonometric functions should be used where necessary inside algorithms, and not
strictly avoided.
Attempts to measure single-phase signals can also be made using a rotating vector
approach using signal-splitting and ¼-cycle delaying algorithms such as presented in [10],
although this method produces large ripples due to discretised errors in the signal delay
implementation and in the presence of harmonics. Wavelet transforms have been used in
[11] to analyse single-phase signals, although [11] presents very poorly coded Fourier
transform results for comparison, and does not assess errors due to noise. The sample rate
at 600Hz approaches the 500Hz requirement, although only harmonics up to the 6th are
applied in the test scenarios. The measured frequency error during a voltage dip to 0.4pu
is also shown to be as high as 0.5% (0.25Hz), which is unacceptable.
Many Phase Locked Loops (PLLs) of the single-phase and three-phase variety have been
presented, most with the aim of controlling solid-state inverters. A useful concept is that
of normalising the response such that the dynamics of the frequency measurement are
unaffected by the amplitude of the input signal [12, 13]. A useful foundation for the work
presented in this paper is [14] which recognises the enormous value of averaging over
exactly one single signal period using [15]. Also in [14], a 2nd harmonic cancellation
This paper is a postprint of a paper submitted to and accepted for publication in IET Generation, Transmission and Distribution (GTD) and is subject to IET copyright. The copy of record is available at [http://digital-library.theiet.org/]” and the paper is available through IEEE Xplore at [http://ieeexplore.ieee.org/xpls/abs_all.jsp?arnumber=4907255]
Page 5 of 26
scheme is devised which reduces the interpolation errors (of the fundamental) due to low
sample rate measurement. In this paper, an alternative 1½-cycle measurement scheme is
proposed which provides better dynamic performance and better rejection of higher order
harmonics.
The paper presents an overview of a new “Clarke-FLL hybrid” measurement architecture
and algorithms to meet the strict requirements listed above. More in-depth details of the
actual code, including Simulink screenshots, are available in [16]. The target of this work
is not to design a PLL, but to measure frequency and amplitude/phase. However, many of
the concepts presented in this paper can also be applied to PLL design.
2 Amplitude, phase and frequency measurements
2.1 Averaging signals over exact-time periods
The benefit of being able to average (or integrate) a signal over an exact timeframe
(generally not equal to an exact number of sample intervals) cannot be overstated.
Normally, the most useful timeframe is one cycle period as used in [3] and [14]. However,
the work presented below uses several other averaging intervals, usually multiples of
half-periods, but sometimes other (longer) time lengths to remove sub-harmonic ripple.
The most obvious benefits are to obtain accurate, low-ripple outputs from single-cycle
Fourier correlations or measurements of elliptical AB vector rotation over half or one
cycle. Such ripples in the results of the works [7, 9, 10, 12, 13] could be removed by the
use of such exact-time averaging techniques. The difficulty with exact-time averaging
within a fixed-frame-rate system is that the desired time period to average over is
normally not an integral multiple of the frame time. Thus, interpolation is required. The
algorithm of [15] addresses this issue but contains two drawbacks. Firstly, the algorithm
output represents the result of an averaged time period which does not always end at the
current sample instant. The result is lagged by a time length which is dynamically variable
between 0 and the sample interval ∆t. The second issue is simply that the sub-algorithm
[17] is not fully optimised for speed or reliability within embedded code.
This paper is a postprint of a paper submitted to and accepted for publication in IET Generation, Transmission and Distribution (GTD) and is subject to IET copyright. The copy of record is available at [http://digital-library.theiet.org/]” and the paper is available through IEEE Xplore at [http://ieeexplore.ieee.org/xpls/abs_all.jsp?arnumber=4907255]
Page 6 of 26
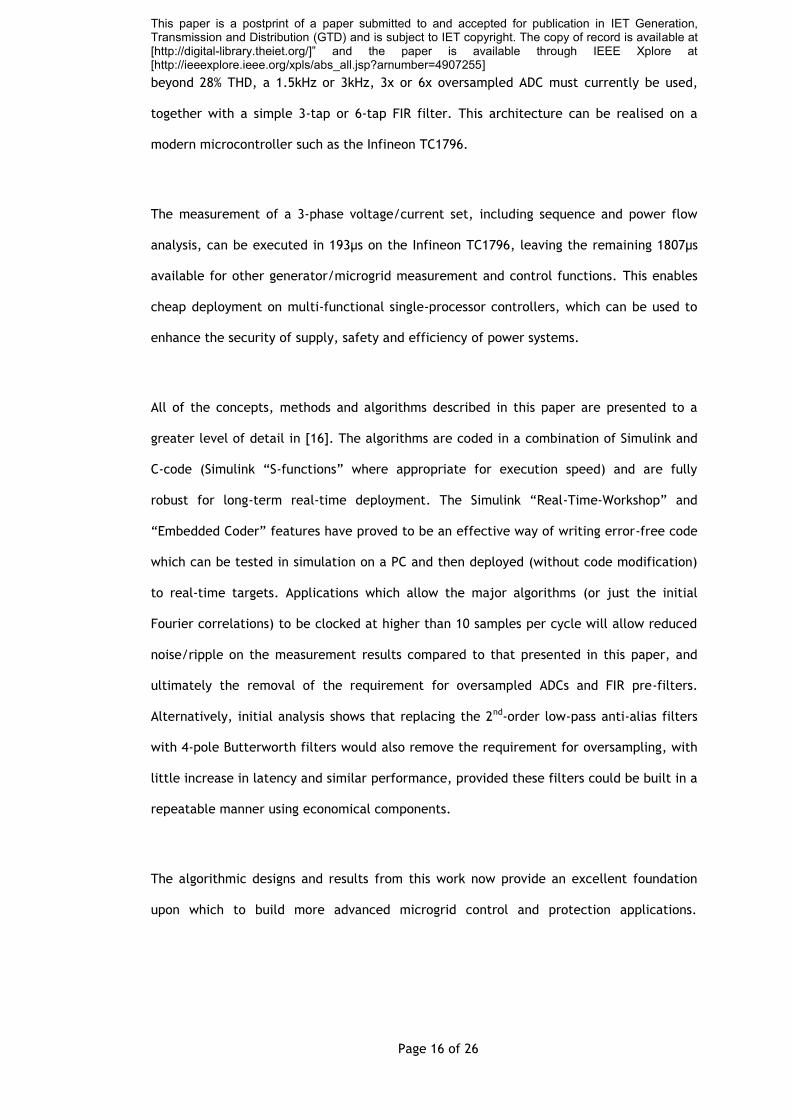
Fig. 1 shows how the first point can be addressed. The new, improved algorithm
continually adds trapezoidally integrated segments to an accumulator using the newest
two samples. The approximate signal average is then the difference between the current
value of this accumulator and its value n samples ago. To account for time intervals not
equal to multiples of the sample interval ∆t, a trapezoidal area calculated from the oldest
2 samples using linear interpolation must be subtracted from the result. This algorithm
requires the use of 2 rolling memory buffers: one for the accumulated area and one for the
sampled values, whereas [15] only requires 1 buffer.
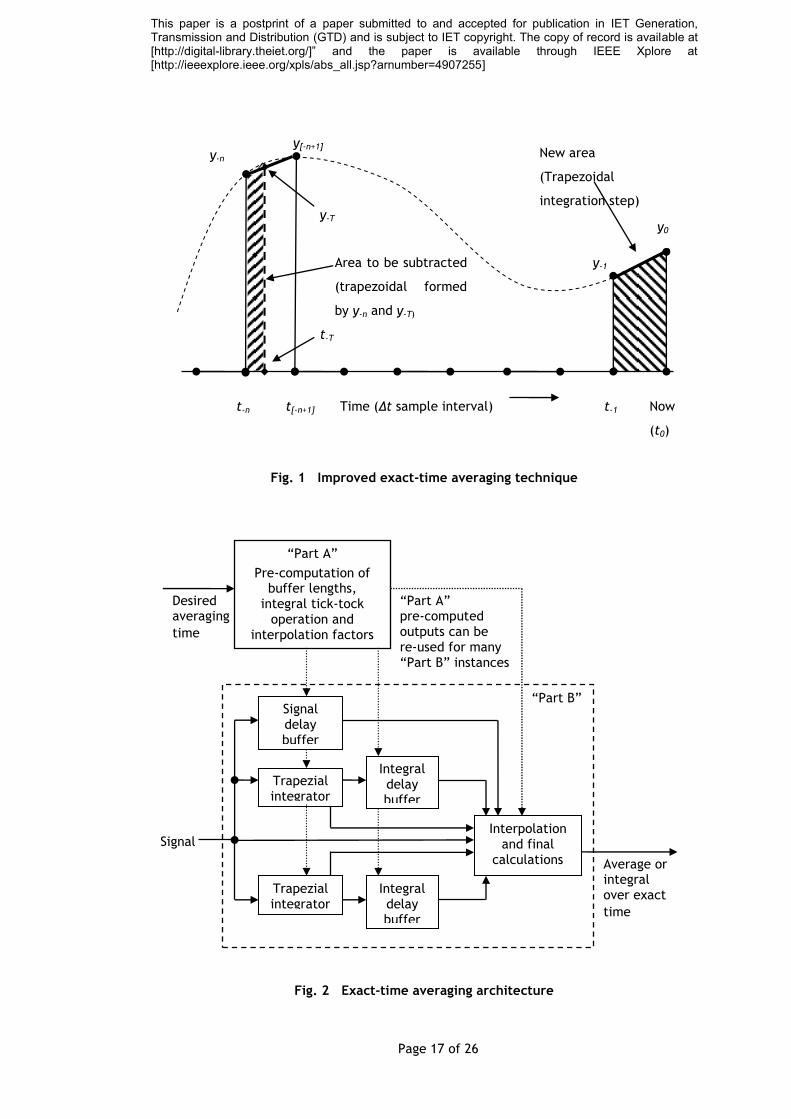
To optimise the speed and robustness of the algorithm compared to [15], three further
enhancements are required: 1) Given a single estimate of signal frequency, which
determines the required averaging time, a single “Part A” pre-computation block
determines the number of delay samples required and the factors required for linear
interpolation. This can be re-used by many “Part B” averaging stages which are required to
average different signals over the same averaging time. 2) The delay buffers are optimised
by careful coding within Simulink “S functions” (fully “in-lined”) using pointer arithmetic.
Execution time on the TC1796 microcontroller is reduced to 0.25μs per buffer compared to
0.75μs for [17]. 3) To avoid integrator wind-up and loss of precision, two independent
trapezial integration stages are used in parallel, with a separate delay buffer required for
each to form the definite integral. These are used in a tick-tock fashion which allows
resetting of the integrators to zero at regular intervals. The total number of delay buffers
required per averaging stage is thus increased further from 2 to 3. This architecture is
summarised in Fig. 2.
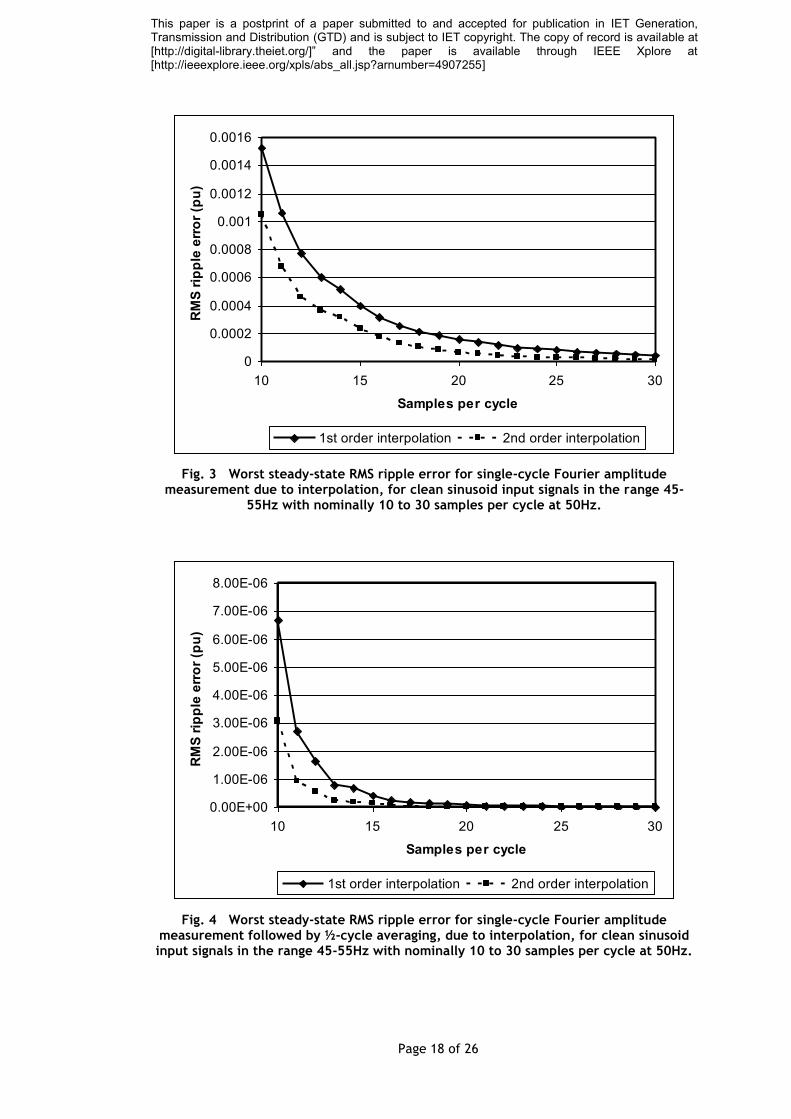
The architecture of Fig. 2. has been created in embedded code using both linear and
2nd-order interpolation for both the integration and interpolation stages. The 2nd-order
code can give better results in scenarios of low noise and low harmonic content (Fig. 3),
but the advantage decreases when noise or harmonic content is high. Therefore, the
This paper is a postprint of a paper submitted to and accepted for publication in IET Generation, Transmission and Distribution (GTD) and is subject to IET copyright. The copy of record is available at [http://digital-library.theiet.org/]” and the paper is available through IEEE Xplore at [http://ieeexplore.ieee.org/xpls/abs_all.jsp?arnumber=4907255]
Page 7 of 26
linearly interpolated algorithm, being slightly simpler, is generally more appropriate. This
averaging filter is a purely FIR (Finite Impulse Response) device.
2.2 Single and 1½ cycle Fourier-based measurements
To make a single-cycle Fourier measurement of the fundamental at sample rates down to
10 samples per cycle, [3] can be adapted by using the exact-time average block from
section 2.1. The complex value F representing the fundamental can be calculated using
the following equation, implemented in the digital domain using the averaging
(integrating) algorithm described in detail above.
dttyjdttyT
F
t
Tt
t
Tt
cossin2 0
0
0
0
where tf 2 , f is the estimate of frequency, t0 is “now” and T is the integration
time (1/f for a single-cycle measurement).
The signal magnitude is then given by F and the signal phase (relative to the correlating
waveform) is given by F . Notably, the “absolute phase” is then given by
and the fundamental may be estimated by sinF . A packet of data containing the
phase , the frequency f and an accurate timestamp (e.g. from a Global Positioning
system) can be passed to distant protection/control systems. Upon receipt, the phase data
can be compared to other similar data accurately, accounting for variable latencies in the
communications channels.
Another useful modification to [3] is to pre-compute the sine and cosine terms for the
current estimate of system frequency. These values can be re-used for many signals,
reducing execution time. The Fourier algorithm has a 1-cycle settling time, reasonable
attenuation of noise, and reasonably low ripple at the output due to interpolation error
(see Fig. 3). The ripple at the output is zero if the input signal period is equal at an exact
This paper is a postprint of a paper submitted to and accepted for publication in IET Generation, Transmission and Distribution (GTD) and is subject to IET copyright. The copy of record is available at [http://digital-library.theiet.org/]” and the paper is available through IEEE Xplore at [http://ieeexplore.ieee.org/xpls/abs_all.jsp?arnumber=4907255]
Page 8 of 26
number of sample intervals ∆t, but rises to a maximum if the signal period is equal to an
odd number of half-sample intervals i.e. m∆t/2 where m is odd. The ripple also increases
as the level of harmonic contamination rises.
To address the interpolation errors shown in Fig. 3, [14] proposes the use of 2nd harmonic
cancellation within the measurement algorithm. This works well for clean sinusoids, but
not for signals containing higher-order harmonics. It also introduces an extra undesirable
feedback loop into the analysis which affects the dynamic settling performance. An
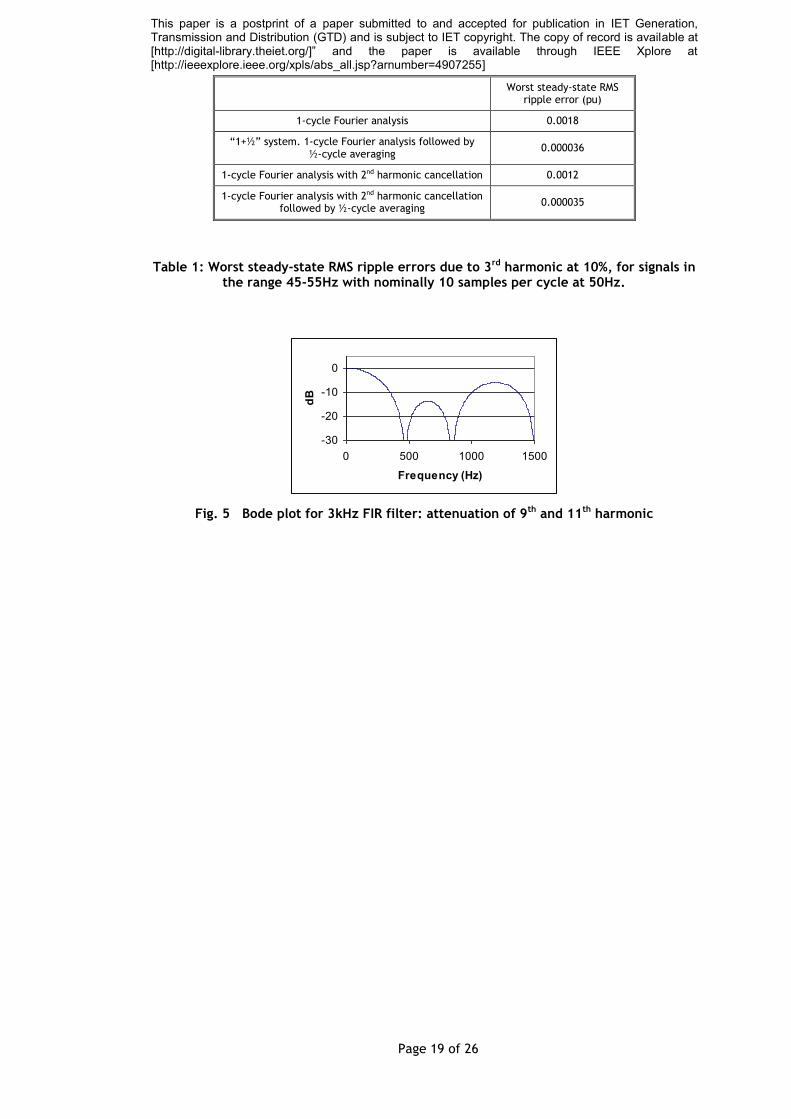
alternative method proposed in this paper is to apply a short subsequent section of
averaging, using the exact-time averaging blocks. The design of the subsequent averaging
filters is determined by the quality of the ripple to be removed. It can be shown that
under input conditions consisting of DC offset, fundamental frequency f, un-aliased higher
order harmonics, and/or an error in the estimate of signal frequency, that the ripple
frequencies at the output of a single-cycle Fourier correlation are predominantly at
multiples of 2f. Thus the ripple can be almost completely removed by a further stage of
averaging of exactly one half-period (or multiples thereof), as shown in Fig. 4. This can be
called a “1+½” measurement system, and consists purely of Finite Impulse Response (FIR)
filters. Similarly, the initial Fourier correlation can be calculated on a half-cycle basis,
leading to ripples which predominantly fall at frequencies which are multiples of f. In this
case, the ripples at the ½-cycle output due to DC offset and even harmonics are very
large. However, the ripples can be almost totally removed by subsequent averaging over
exactly one cycle, leading to a “½+1” system with virtually identical performance to the
“1+½” measurement system. This can be useful if the half-cycle output is desirable for
very fast, (but approximate) measurements for relaying purposes.
Table 1 shows the worst case RMS ripple errors resulting due to 10% 3rd harmonic (Twice
that allowed under BS EN 50160[18]) with a sample rate of 10 samples per cycle. This
shows that the performance of the purely FIR “1+½” system is, for practical purposes, as
good or better than any equivalent system using 2nd harmonic cancellation, although it is
significantly simpler to implement. It also settles fully within 1½ cycles, whereas the 2nd
This paper is a postprint of a paper submitted to and accepted for publication in IET Generation, Transmission and Distribution (GTD) and is subject to IET copyright. The copy of record is available at [http://digital-library.theiet.org/]” and the paper is available through IEEE Xplore at [http://ieeexplore.ieee.org/xpls/abs_all.jsp?arnumber=4907255]
Page 9 of 26
harmonic cancellation algorithm exhibits ringing following sudden signal changes.
2.3 Attenuation of potentially aliased harmonics
At such low sample rates as 10 samples per cycle within the core measurement algorithm,
many harmonics of the input signal will be aliased. To counter this, three techniques can
be used together. Firstly, a pair of simple cascaded low-pass filters (125Hz cutoff) can be
implemented in hardware using economical components. The cutoff frequency should not
be lowered too far to avoid excessive group delay. Secondly, many modern target
platforms such as the Infineon TC1796 contain parallel peripheral processors. These can be
used to over-sample ADCs and perform basic filtering. With the main algorithms executing
at only 500Hz, the 5th or higher harmonics may be aliased. The 9th and 11th cause most
practical concern, being at relatively high levels within power systems, attenuated by as
little as 22.9dB in the two low-pass filters, and because they can alias back onto or near
the fundamental with a 500Hz sample rate. This can cause sub-harmonic measurement
ripples/errors of up to 0.002pu RMS for a 9th harmonic at 3%, or 0.005pu RMS for an 11th
harmonic at 7%, these being twice the levels allowed by BS EN 50160 [18]. To attenuate
the 9th and 11th harmonics, over-sampling and simple FIR filters can be used at either 3kHz
or 1.5kHz. The 3kHz version attenuates the 9th and 11th by >20dB and >15dB respectively,
while the 1.5kHz version provides marginally 20dB and 15dB attenuation. The filter
weights for the 3kHz version shown in Fig. 5 are [0.238507, 0.0614238, 0.200069,
0.200069, 0.0614238, 0.238507]. The 1.5kHz version uses weights of [0.348834, 0.302331,
0.348834]. An alternative approach is to place the filter notches at exactly 500Hz, 1000Hz
etc. using equal weights (3-sample or 6 sample averaging). This attenuates the 9th and 11th
almost as well, with the added benefit of notching out switching harmonics for active
devices which inject at integer multiples of 500Hz. The amplitude and phase effect of the
FIR filter at the actual signal frequency must be added to the known effect of the two
125Hz low-pass filters when applying calibration corrections as shown in Fig. 7. The design
of the FIR filter would need to be modified for higher frame rates than 500Hz or different
oversampling ratios.
This paper is a postprint of a paper submitted to and accepted for publication in IET Generation, Transmission and Distribution (GTD) and is subject to IET copyright. The copy of record is available at [http://digital-library.theiet.org/]” and the paper is available through IEEE Xplore at [http://ieeexplore.ieee.org/xpls/abs_all.jsp?arnumber=4907255]
Page 10 of 26
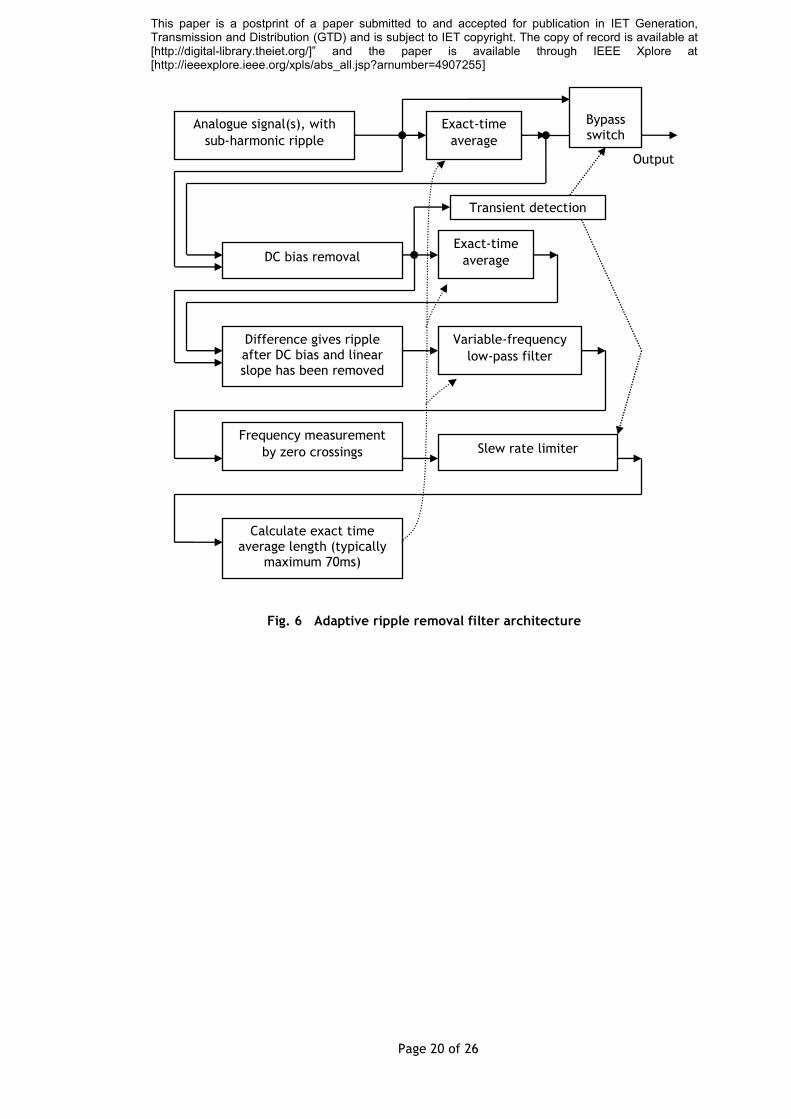
The third technique for minimising the effect of aliased harmonics is an adaptive ripple
rejection post-filtering stage. This novel filter (see Fig. 6) has been designed specifically
to reduce any remaining ripple from the measured signal(s), after all other processing. Due
to the previous measurement stages, which include averaging over at least 1½ cycles, any
remaining ripple is mostly sub-harmonic. Reducing such ripple at measurement outputs is
desirable because this ripple can induce oscillations within control systems which rely on
the measurements. The filter first removes both DC bias and linear slopes from the signal
using the exact-time averaging algorithm, and then searches for the fundamental
frequency of the remaining ripple using a variable-frequency low-pass filter followed by a
zero-crossing detector. The estimated ripple frequency is filtered using a slew-rate filter
and this determines the averaging time required to best remove the ripple (and its
harmonics). Additional code detects rapid changes in the signal. When this occurs, the
filter switches into a direct pass-through mode with zero latency (at the expense of higher
ripple/noise). The threshold for transient detection on voltage amplitude can be set as low
as ±0.005pu for the measurement system and (steady state) test conditions described in
this paper, without causing spurious transient detections. This means that an adaptive
ripple filter with substantial averaging time (up to 3.5 cycles, 70ms), can be used at all
times, because its latency will drop to zero during any significant transient events. Such
an averaging time can completely remove all sub-harmonics down to 14.3Hz. If
higher-order harmonics alias very closely to the actual signal frequency, within 14Hz, then
the ripple removal filter will not be able to completely remove the sub-harmonic ripple.
The extreme of this is a harmonic which aliases exactly onto the fundamental, which will
produce a relatively benign DC offset to the result. The worst case would be measurement
output ripples in the region of 0.1 to 1Hz which might contribute to sub-harmonic power
system oscillations if fed back through droop controllers. For this reason, the 125Hz
low-pass filters and 3x/6x over-sampled ADC are the front line of defence against aliased
harmonics.
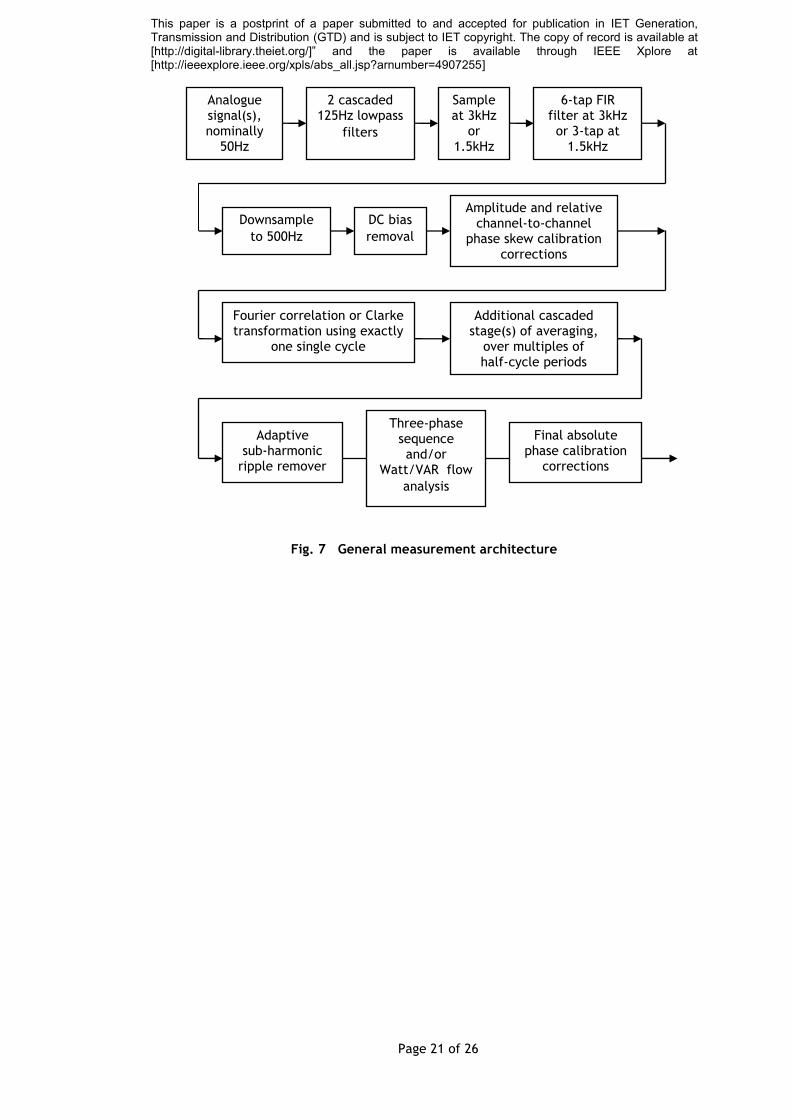
2.4 General measurement architecture
The combination of all the techniques described in sections 2.1-2.3 leads to the general
measurement architecture shown in Fig. 7. The DC bias removal consists of 2 cascaded
This paper is a postprint of a paper submitted to and accepted for publication in IET Generation, Transmission and Distribution (GTD) and is subject to IET copyright. The copy of record is available at [http://digital-library.theiet.org/]” and the paper is available through IEEE Xplore at [http://ieeexplore.ieee.org/xpls/abs_all.jsp?arnumber=4907255]
Page 11 of 26
averaging filters of length one cycle each, to calculate the DC bias which is subtracted
from the signal. The latency of this filter is thus zero, and its performance in this
application surpasses that of a high-pass filter. The calculation and implementation of the
calibration corrections, and the sequence/power-flow calculation algorithms cannot be
presented here for reasons of brevity. It should be noted, however, that the sequence and
power-flow analysis can be completed exactly without any further evaluations of sine or
cosine by careful treatment of the averaged data from the Fourier transforms.
The cascaded FIR averaging stages both within and subsequent to the Fourier correlations
provide excellent attenuation of noise and high-frequency inter-harmonics. A cascaded
pair or triplet of FIR averaging filters provides better attenuation of Gaussian noise than a
single FIR filter of equivalent length or an Infinite impulse response (IIR) low-pass filter of
equivalent latency, due to the positioning of the transfer function zeros and the
convolution of the rectangular impulse functions.
To measure amplitude/phase of voltage or current sets, given an estimate frequency, the
architecture of Fig. 7 can be used directly, with a total measurement latency of ~5.5
cycles during steady state conditions and ~2 cycles (40ms) during transients. These times
are made up of <½ cycle due to the 125Hz low-pass filters, 1/24th cycle due to the 3kHz
6-tap FIR filter, 1½ cycles for the Fourier and half-cycle averaging stages, and up to 3½
cycles (70ms average time) within the adaptive ripple removal.
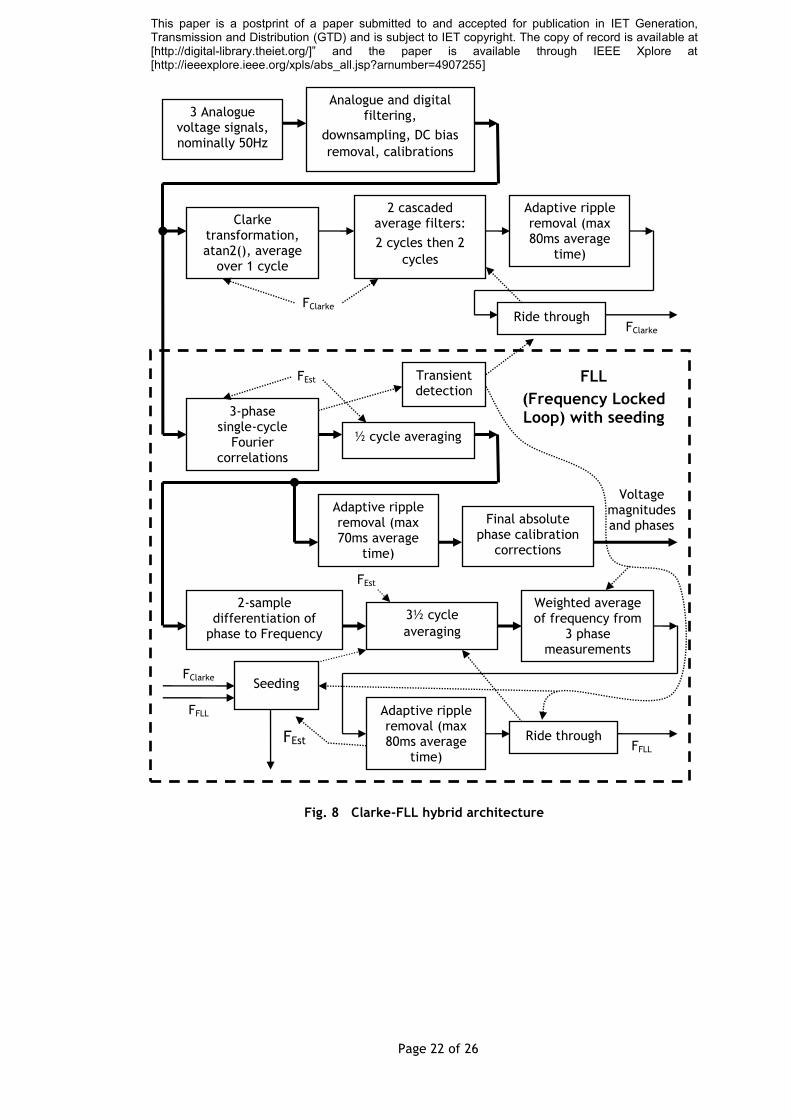
2.5 Clarke-FLL hybrid measurement
To measure frequency together with amplitude and phase, the general architecture of Fig.
7 can be used as the basis for a complex “Clarke-FLL hybrid” measurement, shown in Fig.
8. This is a simplified diagram and the entire algorithm is a significant piece of Simulink
coding, fully presented in [16]. A frequency measurement based upon a Clarke
transformation is first used. This provides very fast settling over a very wide frequency
range covering DC to the Nyquist frequency. Following application of measurable system
voltages after an outage, the 2-cycle averaging filters individually switch in at set times of
This paper is a postprint of a paper submitted to and accepted for publication in IET Generation, Transmission and Distribution (GTD) and is subject to IET copyright. The copy of record is available at [http://digital-library.theiet.org/]” and the paper is available through IEEE Xplore at [http://ieeexplore.ieee.org/xpls/abs_all.jsp?arnumber=4907255]
Page 12 of 26
100ms and 160ms. This provides a 1-cycle response initially, which then switches to a 3-
cycle and 5-cycle response as appropriate. Given a three-phase voltage signal with low
unbalance, this measurement has an almost entirely FIR type response, due to the steady
rotation of the AB vector. The measurement can fail during 2-phase faults due to collapse
of the AB vector trajectory [8], and cannot provide amplitude/phase measurements of the
3 phases. Measurement validity can be ascertained by placing suitable limits on the
sample-to-sample angular rotation velocity of the AB vector.
The Clarke’s frequency measurement is used as a seed for a Frequency Locked Loop (FLL).
The FLL contains 1½-cycle Fourier amplitude/phase measurements of the three phase
voltages. Frequency is detected for each of the 3 phases by the rate of phase change and
then averaged further over 3½ cycles. A weighted average from the 3 phases then reveals
a measurement of system frequency, which is fully tolerant to two-phase faults/transients
and large levels of unbalance. The adaptive sub-harmonic ripple filtering is then applied,
which switches out during fast-moving frequency transients. During the deepest
three-phase voltage transients, both the Clarke transformation and FLL may be unable to
obtain a valid measurement of frequency. This is due to low SNR and post-fault ringing
within the power system itself. In this case, a temporary ride-through action can be
initiated which holds frequency outputs to the last good values (taken from before the
transient) and also pre-loads the 3½ cycle frequency averaging filters with these values.
Similar averaging pre-load action takes place during seeding of the FLL’s frequency with
the value from the Clarke’s algorithm. Seeding occurs when the FLL is not well locked but
the fast-settling Clarke transform based measurement is valid. During transient events, an
FLL without seeding would behave with an IIR response due to the Fourier measurement
and feedback loop characteristics. Although the response would be more desirable than
that of PLL(s), it is preferable to avoid this effect by using seeding from the Clarke’s
measurement. This combination provides an extremely fast settling and robust
measurement algorithm hybrid.
This paper is a postprint of a paper submitted to and accepted for publication in IET Generation, Transmission and Distribution (GTD) and is subject to IET copyright. The copy of record is available at [http://digital-library.theiet.org/]” and the paper is available through IEEE Xplore at [http://ieeexplore.ieee.org/xpls/abs_all.jsp?arnumber=4907255]
Page 13 of 26
3 Results and benchmarking
The Clarke-FLL hyrid algorithm has been coded in MATLAB Simulink which provides
platform independence. The code can be used directly in simulation, converted into a
large “S function”, or built into embedded C code for virtually any target microcontroller
or other platform. Subsidiary “S functions” are used where appropriate to improve the
speed of certain key functions, most notably the delay buffer blocks. The entire code for
the Clarke-FLL hybrid of Fig. 8 (including 6 adaptive ripple-removal filters on the
three-phase voltage and current outputs) contains 1 sin(), 1 cos(), 4 atan2(), 6 sqrt(), and
123 delay buffers. The total algorithm execution time (for the 500Sa/s frame rate
algorithm) is 141μs on the Infineon TC1796 microcontroller [19, 20] when the program is
stored in the on-board flash memory. The delay buffers account for approximately 0.25μs
each, thus in total 35μs or 25% of the execution time. At a frame interval of 2000μs, the
algorithm requires 7% of the frame time. Extending the operation to measure both voltage
and current, with full sequence and power flow analysis, but limiting the requirement for
ripple-removal filters to 6, can be achieved in 193μs, less than 10% of the frame time. This
same algorithm has been implemented on the legacy MVME5100 [21] and the newer
MVME5500 [22] processors with execution times of 631 and 71μs respectively. Adding
further ripple-removal filters can lead to non-linear execution time increments on the
TC1796, because total data memory use then exceeds 48kB which requires paging between
multiple RAM areas. The MVME processors have much larger memory spaces and do not
show this symptom.
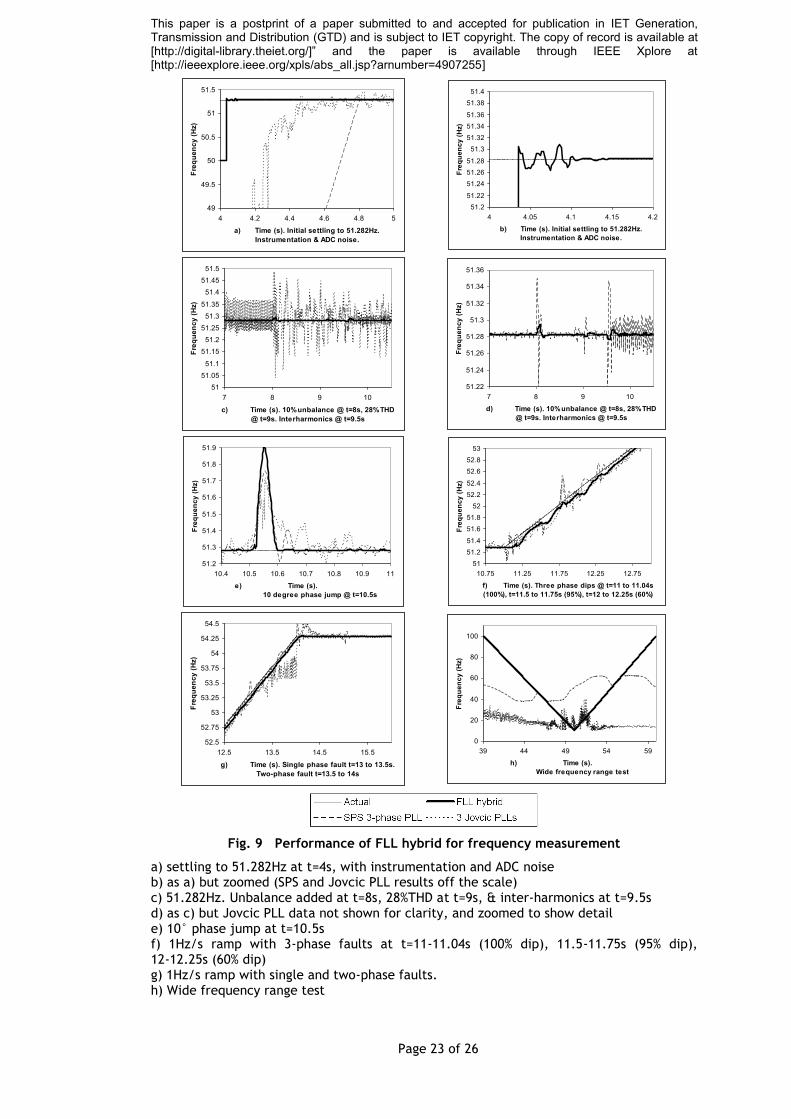
The performance of the Clarke-FLL hybrid for frequency measurement is shown in Fig. 9,
compared to the MATLAB SimPowerSystems (SPS) 3-phase PLL and the weighted average
(weights set by measured phase magnitudes) of a set of 3 PLLs of the Jovcic design [14].
These two competing solutions have been presented here for two reasons. Firstly, they can
easily be recreated by other researchers as benchmarks, due to the common availability of
SPS and the detail of [14]. Secondly, these two methods present better frequency
measurement accuracy then the other references [2, 4-7, 9, 10, 12, 13], particularly in the
presence of harmonic contamination. The SPS PLL contains a single-cycle average of q
This paper is a postprint of a paper submitted to and accepted for publication in IET Generation, Transmission and Distribution (GTD) and is subject to IET copyright. The copy of record is available at [http://digital-library.theiet.org/]” and the paper is available through IEEE Xplore at [http://ieeexplore.ieee.org/xpls/abs_all.jsp?arnumber=4907255]
Page 14 of 26
error magnitude which allows it to tolerate unbalance and harmonics with reasonable
effectiveness. The SPS PLL applies a 12Hz/s slew-rate limiter combined with a 2nd-order
25Hz low-pass filter to the frequency measurement. The Jovcic PLLs also contain
single-cycle averaging, together with a 1st-order 1.3Hz low-pass filter within the frequency
measurement.
A 60-second test waveform was used, incorporating noise and ADC quantisation (60dB SNR
with 11-bit effective ADC resolution) voltage dips/faults, frequency ramps to 10Hz/s, a
phase step, unbalance at 10%, harmonic contamination to 28% THD spread across
harmonics 2-40 using [18] and [23] as guides, and inter-harmonics at 2025Hz (6.5%) &
525Hz (23%) to simulate worst-case signalling or inverter interference. The same anti-alias
filters, oversampled ADCs, and FIR pre-filters were applied to all 3 methods to enable a
fair comparison.
The Clarke-FLL hybrid shows excellent results, better than the other candidate algorithms
in all cases apart from the phase jump test (Fig. 9e), where the SPS and Jovcic PLLs apply
significant slew-rate and low-pass filtering to their results. However, these filters
negatively impact the dynamic performance of the SPS and Jovcic PLLs. During initial
signal application (Fig. 9a & 9b), the FLL hybrid settles within 40-100ms, due to the use of
the fast-settling Clarke measurement algorithm, whereas the SPS and Jovcic PLLs take up
to 800ms to lock and settle. In the presence of unbalance, harmonic and inter-harmonic
contamination (Fig. 9c & 9d), the FLL hybrid shows at least an order of magnitude lower
steady-state error than the Jovcic PLLs, and significantly better performance than the SPS
PLL. This is due to the combined use of the extra ½-cycle averaging and the adaptive
ripple removal filter, which prove to be more effective techniques than slew-rate limiting
and/or low-pass filtering. Fig. 9h shows that the FLL hybrid is able to track signals
accurately over a wide frequency range with a high rate of change of frequency (ROCOF)
up to 10Hz/s by using the Clarke measurement as a seed, whereas the SPS and Jovcic PLLs
have lost lock before t=39 seconds due to the high frequency input, and they struggle or
fail to regain lock between t=39 and t=60 seconds as frequency ramps quickly from 100Hz
This paper is a postprint of a paper submitted to and accepted for publication in IET Generation, Transmission and Distribution (GTD) and is subject to IET copyright. The copy of record is available at [http://digital-library.theiet.org/]” and the paper is available through IEEE Xplore at [http://ieeexplore.ieee.org/xpls/abs_all.jsp?arnumber=4907255]
Page 15 of 26
to 10Hz and back again. Fig. 9f shows how the fault ride-through action of the FLL hybrid
allows it to exhibit less ringing than the PLLs during deep three-phase faults, and Fig. 9g
shows how the FLL hybrid is virtually immune to full-depth single and two-phase faults. On
Fig. 9g, the relatively poor performance of the Jovcic PLLs during the 2-phase fault is due
to amplitude measurement instability within the 3 Jovcic PLLs running at the 2000μs frame
time, which feeds through the 3-phase weighted average block which was added for this
test. The Jovcic PLLs appear to be much more stable at frame times of 500μs or below.
The frequency measurement accuracy of the Clarke-FLL hybrid exceeds that of [24] for a
class A instrument (±0.01 Hz) and generally achieves ±0.005 Hz, but at a fixed frame rate
of only 500Hz and requiring only 5½-9½ cycles (110-190ms) for full settling while [24]
allows 500 cycles (10 seconds).
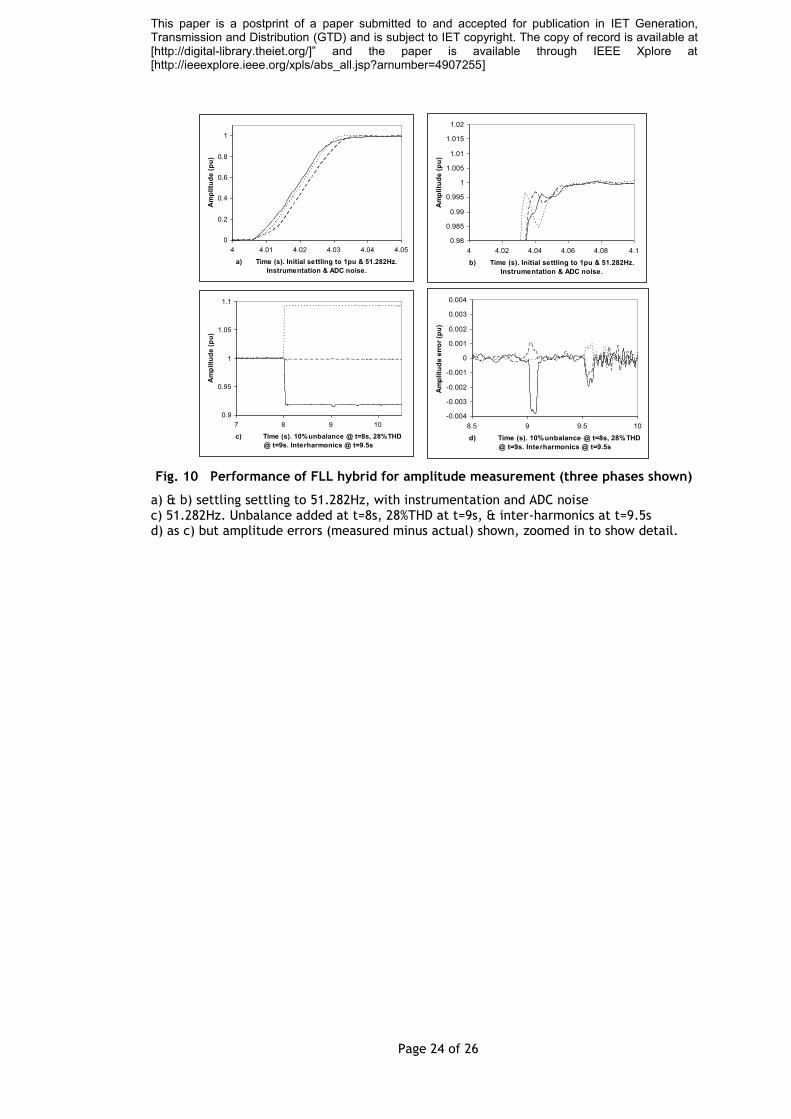
The amplitude measurement performance of the Clarke-FLL hybrid is shown in Fig. 10. The
performance again meets that of [24] for a class A instrument (±0.001pu), apart from brief
periods during the initial sudden onset or removal of harmonic content, but at a fixed
frame rate of only 500Hz and requiring only 2-5½ cycles (40-110ms) for full settling while
[24] allows 10 cycles (200ms). It should be noted that here the fundamental component is
measured, while [24] specifies an RMS voltage measurement. RMS voltages (which include
harmonic content) cannot be measured accurately at such low frame rates due to the
attenuation of the harmonic content in the anti-aliasing filters.
4 Conclusions
An architecture for a Clarke-FLL hybrid has been presented which allows measurement of
frequency, amplitude and phase to world-class accuracy within 3-phase AC power systems,
while the sample rate of the major algorithms can be reduced to only 500Hz. The
measurement latencies are appropriate for protective and control functions within a
microgrid scenario, incorporating autonomous filtering algorithms which adapt the latency
as appropriate during transient or steady-state operation. To enable the target
accuracy/ripple specification to be met for waveforms with harmonic content up to and
This paper is a postprint of a paper submitted to and accepted for publication in IET Generation, Transmission and Distribution (GTD) and is subject to IET copyright. The copy of record is available at [http://digital-library.theiet.org/]” and the paper is available through IEEE Xplore at [http://ieeexplore.ieee.org/xpls/abs_all.jsp?arnumber=4907255]
Page 16 of 26
beyond 28% THD, a 1.5kHz or 3kHz, 3x or 6x oversampled ADC must currently be used,
together with a simple 3-tap or 6-tap FIR filter. This architecture can be realised on a
modern microcontroller such as the Infineon TC1796.
The measurement of a 3-phase voltage/current set, including sequence and power flow
analysis, can be executed in 193μs on the Infineon TC1796, leaving the remaining 1807μs
available for other generator/microgrid measurement and control functions. This enables
cheap deployment on multi-functional single-processor controllers, which can be used to
enhance the security of supply, safety and efficiency of power systems.
All of the concepts, methods and algorithms described in this paper are presented to a
greater level of detail in [16]. The algorithms are coded in a combination of Simulink and
C-code (Simulink “S-functions” where appropriate for execution speed) and are fully
robust for long-term real-time deployment. The Simulink “Real-Time-Workshop” and
“Embedded Coder” features have proved to be an effective way of writing error-free code
which can be tested in simulation on a PC and then deployed (without code modification)
to real-time targets. Applications which allow the major algorithms (or just the initial
Fourier correlations) to be clocked at higher than 10 samples per cycle will allow reduced
noise/ripple on the measurement results compared to that presented in this paper, and
ultimately the removal of the requirement for oversampled ADCs and FIR pre-filters.
Alternatively, initial analysis shows that replacing the 2nd-order low-pass anti-alias filters
with 4-pole Butterworth filters would also remove the requirement for oversampling, with
little increase in latency and similar performance, provided these filters could be built in a
repeatable manner using economical components.
The algorithmic designs and results from this work now provide an excellent foundation
upon which to build more advanced microgrid control and protection applications.
This paper is a postprint of a paper submitted to and accepted for publication in IET Generation, Transmission and Distribution (GTD) and is subject to IET copyright. The copy of record is available at [http://digital-library.theiet.org/]” and the paper is available through IEEE Xplore at [http://ieeexplore.ieee.org/xpls/abs_all.jsp?arnumber=4907255]
Page 17 of 26
Fig. 1 Improved exact-time averaging technique
Fig. 2 Exact-time averaging architecture
“Part A”
Pre-computation of buffer lengths,
integral tick-tock operation and
interpolation factors
Desired averaging
time
Signal delay buffer
Integral delay buffer
Trapezial integrator
Interpolation and final
calculations Average or integral over exact
time
Signal
Trapezial integrator
Integral delay buffer
“Part A” pre-computed outputs can be re-used for many “Part B” instances
“Part B”
Area to be subtracted
(trapezoidal formed
by y-n and y-T)
Time (∆t sample interval) Now
(t0)
New area
(Trapezoidal
integration step)
t-1
y0
y-1
t[-n+1] t-n
y-n y[-n+1]
t-T
y-T
This paper is a postprint of a paper submitted to and accepted for publication in IET Generation, Transmission and Distribution (GTD) and is subject to IET copyright. The copy of record is available at [http://digital-library.theiet.org/]” and the paper is available through IEEE Xplore at [http://ieeexplore.ieee.org/xpls/abs_all.jsp?arnumber=4907255]
Page 18 of 26
0
0.0002
0.0004
0.0006
0.0008
0.001
0.0012
0.0014
0.0016
10 15 20 25 30
Samples per cycle
RM
S r
ipp
le e
rro
r (p
u)
1st order interpolation 2nd order interpolation
Fig. 3 Worst steady-state RMS ripple error for single-cycle Fourier amplitude measurement due to interpolation, for clean sinusoid input signals in the range 45-
55Hz with nominally 10 to 30 samples per cycle at 50Hz.
0.00E+00
1.00E-06
2.00E-06
3.00E-06
4.00E-06
5.00E-06
6.00E-06
7.00E-06
8.00E-06
10 15 20 25 30
Samples per cycle
RM
S r
ipp
le e
rro
r (p
u)
1st order interpolation 2nd order interpolation
Fig. 4 Worst steady-state RMS ripple error for single-cycle Fourier amplitude measurement followed by ½-cycle averaging, due to interpolation, for clean sinusoid input signals in the range 45-55Hz with nominally 10 to 30 samples per cycle at 50Hz.
This paper is a postprint of a paper submitted to and accepted for publication in IET Generation, Transmission and Distribution (GTD) and is subject to IET copyright. The copy of record is available at [http://digital-library.theiet.org/]” and the paper is available through IEEE Xplore at [http://ieeexplore.ieee.org/xpls/abs_all.jsp?arnumber=4907255]
Page 19 of 26
Worst steady-state RMS
ripple error (pu)
1-cycle Fourier analysis 0.0018
“1+½” system. 1-cycle Fourier analysis followed by ½-cycle averaging
0.000036
1-cycle Fourier analysis with 2nd harmonic cancellation 0.0012
1-cycle Fourier analysis with 2nd harmonic cancellation followed by ½-cycle averaging
0.000035
Table 1: Worst steady-state RMS ripple errors due to 3rd harmonic at 10%, for signals in the range 45-55Hz with nominally 10 samples per cycle at 50Hz.
-30
-20
-10
0
0 500 1000 1500
Frequency (Hz)
dB
Fig. 5 Bode plot for 3kHz FIR filter: attenuation of 9th and 11th harmonic
This paper is a postprint of a paper submitted to and accepted for publication in IET Generation, Transmission and Distribution (GTD) and is subject to IET copyright. The copy of record is available at [http://digital-library.theiet.org/]” and the paper is available through IEEE Xplore at [http://ieeexplore.ieee.org/xpls/abs_all.jsp?arnumber=4907255]
Page 20 of 26
Fig. 6 Adaptive ripple removal filter architecture
Exact-time
average
Analogue signal(s), with
sub-harmonic ripple
Output
Exact-time
average DC bias removal
Difference gives ripple after DC bias and linear slope has been removed
Variable-frequency
low-pass filter
Frequency measurement
by zero crossings Slew rate limiter
Calculate exact time average length (typically
maximum 70ms)
Transient detection
Bypass switch
This paper is a postprint of a paper submitted to and accepted for publication in IET Generation, Transmission and Distribution (GTD) and is subject to IET copyright. The copy of record is available at [http://digital-library.theiet.org/]” and the paper is available through IEEE Xplore at [http://ieeexplore.ieee.org/xpls/abs_all.jsp?arnumber=4907255]
Page 21 of 26
Fig. 7 General measurement architecture
Analogue signal(s), nominally
50Hz
2 cascaded 125Hz lowpass
filters
Sample at 3kHz
or 1.5kHz
6-tap FIR filter at 3kHz or 3-tap at
1.5kHz
Downsample
to 500Hz
DC bias
removal
Amplitude and relative channel-to-channel
phase skew calibration corrections
Fourier correlation or Clarke transformation using exactly
one single cycle
Additional cascaded stage(s) of averaging,
over multiples of half-cycle periods
Adaptive sub-harmonic
ripple remover
Final absolute phase calibration
corrections
Three-phase sequence and/or
Watt/VAR flow
analysis
This paper is a postprint of a paper submitted to and accepted for publication in IET Generation, Transmission and Distribution (GTD) and is subject to IET copyright. The copy of record is available at [http://digital-library.theiet.org/]” and the paper is available through IEEE Xplore at [http://ieeexplore.ieee.org/xpls/abs_all.jsp?arnumber=4907255]
Page 22 of 26
Fig. 8 Clarke-FLL hybrid architecture
3 Analogue voltage signals, nominally 50Hz
Analogue and digital filtering,
downsampling, DC bias
removal, calibrations
3-phase single-cycle
Fourier correlations
Final absolute phase calibration
corrections
Clarke transformation, atan2(), average
over 1 cycle
2 cascaded average filters:
2 cycles then 2
cycles
Adaptive ripple removal (max 80ms average
time)
½ cycle averaging
3½ cycle
averaging
Adaptive ripple removal (max 80ms average
time)
Weighted average of frequency from
3 phase measurements
Adaptive ripple removal (max 70ms average
time)
Ride through
Seeding
2-sample differentiation of
phase to Frequency
FClarke
FFLL
FClarke
Transient detection
Ride through
FFLL
Voltage magnitudes and phases
FEst
FEst
FEst
FClarke
FLL
(Frequency Locked Loop) with seeding
This paper is a postprint of a paper submitted to and accepted for publication in IET Generation, Transmission and Distribution (GTD) and is subject to IET copyright. The copy of record is available at [http://digital-library.theiet.org/]” and the paper is available through IEEE Xplore at [http://ieeexplore.ieee.org/xpls/abs_all.jsp?arnumber=4907255]
Page 23 of 26
49
49.5
50
50.5
51
51.5
4 4.2 4.4 4.6 4.8 5
a) Time (s). Initial settling to 51.282Hz.
Instrumentation & ADC noise.
Fre
qu
en
cy
(H
z)
51.2
51.22
51.24
51.26
51.28
51.3
51.32
51.34
51.36
51.38
51.4
4 4.05 4.1 4.15 4.2
b) Time (s). Initial settling to 51.282Hz.
Instrumentation & ADC noise.
Fre
qu
en
cy
(H
z)
51
51.05
51.1
51.15
51.2
51.25
51.3
51.35
51.4
51.45
51.5
7 8 9 10
c) Time (s). 10% unbalance @ t=8s, 28% THD
@ t=9s. Interharmonics @ t=9.5s
Fre
qu
en
cy
(H
z)
51.22
51.24
51.26
51.28
51.3
51.32
51.34
51.36
7 8 9 10
d) Time (s). 10% unbalance @ t=8s, 28% THD
@ t=9s. Interharmonics @ t=9.5s
Fre
qu
en
cy
(H
z)
51.2
51.3
51.4
51.5
51.6
51.7
51.8
51.9
10.4 10.5 10.6 10.7 10.8 10.9 11
e) Time (s).
10 degree phase jump @ t=10.5s
Fre
qu
en
cy
(H
z)
51
51.2
51.4
51.6
51.8
52
52.2
52.4
52.6
52.8
53
10.75 11.25 11.75 12.25 12.75
f) Time (s). Three phase dips @ t=11 to 11.04s
(100%), t=11.5 to 11.75s (95%), t=12 to 12.25s (60%)
Fre
qu
en
cy
(H
z)
52.5
52.75
53
53.25
53.5
53.75
54
54.25
54.5
12.5 13.5 14.5 15.5
g) Time (s). Single phase fault t=13 to 13.5s.
Two-phase fault t=13.5 to 14s
Fre
qu
en
cy
(H
z)
0
20
40
60
80
100
39 44 49 54 59
h) Time (s).
Wide frequency range test
Fre
qu
en
cy
(H
z)
Fig. 9 Performance of FLL hybrid for frequency measurement
a) settling to 51.282Hz at t=4s, with instrumentation and ADC noise b) as a) but zoomed (SPS and Jovcic PLL results off the scale) c) 51.282Hz. Unbalance added at t=8s, 28%THD at t=9s, & inter-harmonics at t=9.5s d) as c) but Jovcic PLL data not shown for clarity, and zoomed to show detail e) 10° phase jump at t=10.5s f) 1Hz/s ramp with 3-phase faults at t=11-11.04s (100% dip), 11.5-11.75s (95% dip), 12-12.25s (60% dip) g) 1Hz/s ramp with single and two-phase faults. h) Wide frequency range test
This paper is a postprint of a paper submitted to and accepted for publication in IET Generation, Transmission and Distribution (GTD) and is subject to IET copyright. The copy of record is available at [http://digital-library.theiet.org/]” and the paper is available through IEEE Xplore at [http://ieeexplore.ieee.org/xpls/abs_all.jsp?arnumber=4907255]
Page 24 of 26
0
0.2
0.4
0.6
0.8
1
4 4.01 4.02 4.03 4.04 4.05
a) Time (s). Initial settling to 1pu & 51.282Hz.
Instrumentation & ADC noise.
Am
pli
tud
e (
pu
)
0.98
0.985
0.99
0.995
1
1.005
1.01
1.015
1.02
4 4.02 4.04 4.06 4.08 4.1
b) Time (s). Initial settling to 1pu & 51.282Hz.
Instrumentation & ADC noise.
Am
pli
tud
e (
pu
)
0.9
0.95
1
1.05
1.1
7 8 9 10
c) Time (s). 10% unbalance @ t=8s, 28% THD
@ t=9s. Interharmonics @ t=9.5s
Am
pli
tud
e (
pu
)
-0.004
-0.003
-0.002
-0.001
0
0.001
0.002
0.003
0.004
8.5 9 9.5 10
d) Time (s). 10% unbalance @ t=8s, 28% THD
@ t=9s. Interharmonics @ t=9.5s
Am
pli
tud
e e
rro
r (p
u)
Fig. 10 Performance of FLL hybrid for amplitude measurement (three phases shown)
a) & b) settling settling to 51.282Hz, with instrumentation and ADC noise c) 51.282Hz. Unbalance added at t=8s, 28%THD at t=9s, & inter-harmonics at t=9.5s d) as c) but amplitude errors (measured minus actual) shown, zoomed in to show detail.
This paper is a postprint of a paper submitted to and accepted for publication in IET Generation, Transmission and Distribution (GTD) and is subject to IET copyright. The copy of record is available at [http://digital-library.theiet.org/]” and the paper is available through IEEE Xplore at [http://ieeexplore.ieee.org/xpls/abs_all.jsp?arnumber=4907255]
Page 25 of 26
5 References
1 Johns, A. & Salman, S. (1995). Digital protection for power systems. IEE Power Series 15, ISBN 086341303X
2 Petrovic, P., Marjanovic, S. & Stevanovic, M. (2000). New algorithm for measuring 50/60 Hz AC values based on the usage of slow A/D converters. IEEE transactions on instrumentation and measurement, vol.49 issue 1. pp 166-171.
3 MATLAB Simulink SimPowerSystems blockset, “Discrete Fourier”
4 Aghazadeh, R. et al. (2005). New technique for frequency and amplitude estimation of power system signals. IEE Proceedings on generation, transmission and distribution, vol. 152, no. 3, pp 435-440.
5 Lopez, A. et al. (2008). Power system frequency measurement under nonstationary situations. IEEE Transactions on power delivery, vol. 22 no. 2, pp562-567.
6 Salcic, Z., & Mikhael, R. (2000). A new method for instantaneous power system frequency measurement using reference points detection. Electric power systems research vol.55 issue 2. pp 97-102.
7 Canteli, M. et. al. (2006). Three-phase adaptive frequency measurement based on Clarke's transformation. IEEE transactions on power delivery vol.21 issue 3. pp 1101-5.
8 Ignatova, V. et. al. (2005). Classification and characterisation of three-phase voltage dips by space vector methodology. International conference on future power systems. P 1600556.
9 Moore, P., Carranza, R. & Johns, A. (1996). Model system tests on a new numeric method of power system frequency measurement. IEEE Transactions on power delivery, vol. 11 no. 2, pp 696-701.
10 Choi, J., Kim, Y. & Kim, H. (2006). Digital PLL control for single-phase photovoltaic system. IEE proceedings on electric power applications, vol.153 issue 1. pp 40-6.
11 Lin, T. & Domijan, A. (2005). On power quality indices and real time measurement. IEEE Transactions on power delivery, vol. 20 no. 4, pp 2552-2562.
12 Awad, H., Svensson, J. & Bollen, M. (2005). Tuning software phase-locked loop for series-connected converters. IEEE transactions on power delivery, vol.20 issue 1. pp 300-8.
13 Han, B. & Bae, B. (2006). Novel phase-locked loop using adaptive linear combiner. IEEE transactions on power delivery Han, vol.21 issue 1. pp 513-14.
14 Jovcic, D. (2003). Phase locked loop system for FACTS. IEEE transactions on power systems vol.18 issue 3. pp 1116-24.
15 MATLAB Simulink SimPowerSystems blockset, “Discrete Mean Value”
16 Roscoe, A. (2009). Measurement and control of microgrids at low frame rates to optimise security of supply. PhD thesis. University of Strathclyde.
17 MATLAB Simulink SimPowerSystems blockset, “Discrete Variable Transport Delay”
18 BSI, British Standards. (2000). Voltage characteristics of electricity supplies by public distribution systems. BS EN 50160:2000. ISBN 0 580 35925 5
19 TC1796 Tricore STKTC1796 starter kit: http://www.hitex.co.uk/shop/index1.html, accessed January 2009
20 Infineon Tricore family: http://www.infineon.com/cms/en/product, accessed January 2009
21 MVME5100: http://mototracker.atomicserver.co.uk/files/MVME5100%20DS.pdf, accessed January 2009.
22 MVME5500: http://mototracker.atomicserver.co.uk/files/MVME5500%20DS.pdf, accessed January 2009.

This paper is a postprint of a paper submitted to and accepted for publication in IET Generation, Transmission and Distribution (GTD) and is subject to IET copyright. The copy of record is available at [http://digital-library.theiet.org/]” and the paper is available through IEEE Xplore at [http://ieeexplore.ieee.org/xpls/abs_all.jsp?arnumber=4907255]
Page 26 of 26
23 BSI, British Standards. (2006). Electromagnetic compatibility (EMC) – Part 3-2: Limits for harmonic current emissions (equipment input current ≤ 16A per phase). BS EN 61000-3-2:2006. ISBN 0 580 48457 2
24 BSI, British Standards. (2003). Electromagnetic compatibility (EMC) – Part 4-30: Testing and measurement techniques – Power quality measurement methods. BS EN 61000-4-30. ISBN 0 580 42081 7