Embed Size (px)
Citation preview
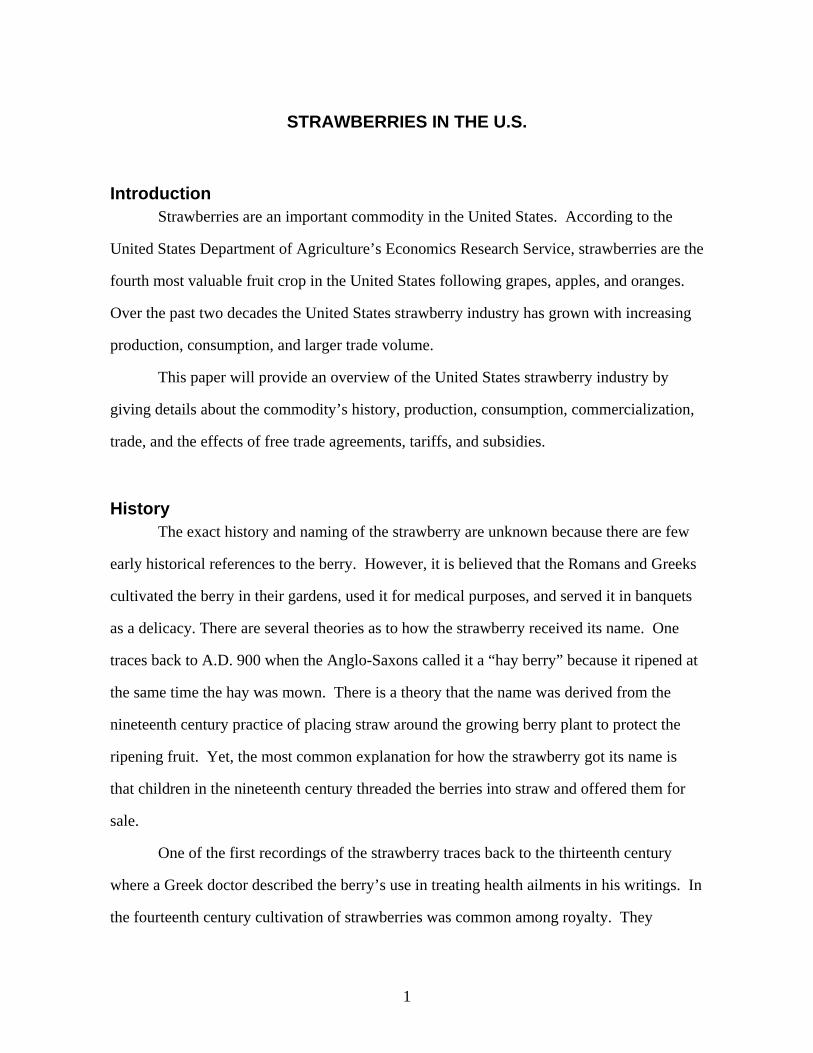
STRAWBERRIES IN THE U.S.
Introduction Strawberries are an important commodity in the United States. According to the
United States Department of Agriculture’s Economics Research Service, strawberries are the
fourth most valuable fruit crop in the United States following grapes, apples, and oranges.
Over the past two decades the United States strawberry industry has grown with increasing
production, consumption, and larger trade volume.
This paper will provide an overview of the United States strawberry industry by
giving details about the commodity’s history, production, consumption, commercialization,
trade, and the effects of free trade agreements, tariffs, and subsidies.
History The exact history and naming of the strawberry are unknown because there are few
early historical references to the berry. However, it is believed that the Romans and Greeks
cultivated the berry in their gardens, used it for medical purposes, and served it in banquets
as a delicacy. There are several theories as to how the strawberry received its name. One
traces back to A.D. 900 when the Anglo-Saxons called it a “hay berry” because it ripened at
the same time the hay was mown. There is a theory that the name was derived from the
nineteenth century practice of placing straw around the growing berry plant to protect the
ripening fruit. Yet, the most common explanation for how the strawberry got its name is
that children in the nineteenth century threaded the berries into straw and offered them for
sale.
One of the first recordings of the strawberry traces back to the thirteenth century
where a Greek doctor described the berry’s use in treating health ailments in his writings. In
the fourteenth century cultivation of strawberries was common among royalty. They
1

considered the flower to be more useful as an ornament than the berries as a fruit. By the
mid sixteenth century the demand for strawberries was increasing in England, as a result it
became a common garden plant, ornament, and a table delicacy.
Commercial strawberry production in America began in the nineteenth century. In
the early part of the century strawberries were grown on the east coast near large cities. As
the pioneers traveled west so did the introduction of the strawberry. According to the
Oregon Strawberry Commission, strawberries were introduced to the state in 1846 by a
pioneer who traveled from Iowa. This pioneer packed extra wagons of with fruit and nut
trees and berry plants.
By the 1950’s strawberries were produced in many states throughout the United
States, although production in California began to flourish due to their advanced and
improving cultivation technologies. California strawberry farmers worked closely with
scientists at the University of California to research and improve production efficiency.
Together they established an industry committed to finding scientific solutions to production
problems. New strawberry varieties were created, annual planting systems, high elevation
nurseries, wide plant beds, and drip irrigation technology introduced in the 1970’s are
examples of innovations that came from this research.
By the 1970’s California had a large growing strawberry industry. Production of
strawberries in other states could not compete with the quantity of berries California
supplied. For example, California farmers were able to produce between twenty and thirty
tons per acre compared to the five tons per acre grown by Oregon farmers.
Today the production and consumption of strawberries in the United States continues
to grow and production is concentrated in California, with Florida and Oregon also
contributing to the nation’s supply. Production efficiency continuously improves resulting
in a growing supply of berries to consumers and increasing awareness of strawberries
contributes to the increasing demand and consumption of the berry.
2
Production Overview In the United States strawberry production is growing. California is the nation’s
leading producer producing close to eighty percent of the United States strawberry crop.
Florida is the second largest strawberry producing state and supplies approximately fifteen
percent of the nation’s supply. The third largest commercial strawberry state is Oregon, it
provides between two and five percent of the nation’s strawberries. Other contributing
states include: New York, Michigan, Washington, Louisiana, North Carolina, Ohio,
Pennsylvania, Wisconsin, New Jersey, and Arkansas.
Strawberries grow in every state in the United States and are specifically bred for the
region in which they grow. Strawberries grow best in moisture retaining soil or when
irrigated frequently, they have low fertilizer requirements, and the plants are kept for one to
four years before being replaced. The quality, flavor, and vitamin content of the berries
depend upon the climate where they are grown. The ideal growing climate for strawberries
is one where the growing berries are exposed to warm, sunny days and cool nights. In this
type of climate the berry’s production of sugar and vitamin C are maximized.
There are several risks associated with producing strawberries commercially. The
weather greatly influences yields; extreme temperate, droughts, and excessive rain increase
diseases, and can interfere with pollination, fruit set, and harvest. Additional risks arise
from labor, marketing, and transportation. Once the berries ripen they must be picked
immediately. A labor shortage or strike can lead to crop loss. Because the berries are very
perishable, those intended for the fresh wholesale market must be sold before they are
picked to avoid spoilage. Also, a trucking strike or delayed delivery can result in berries
rotting before delivery.
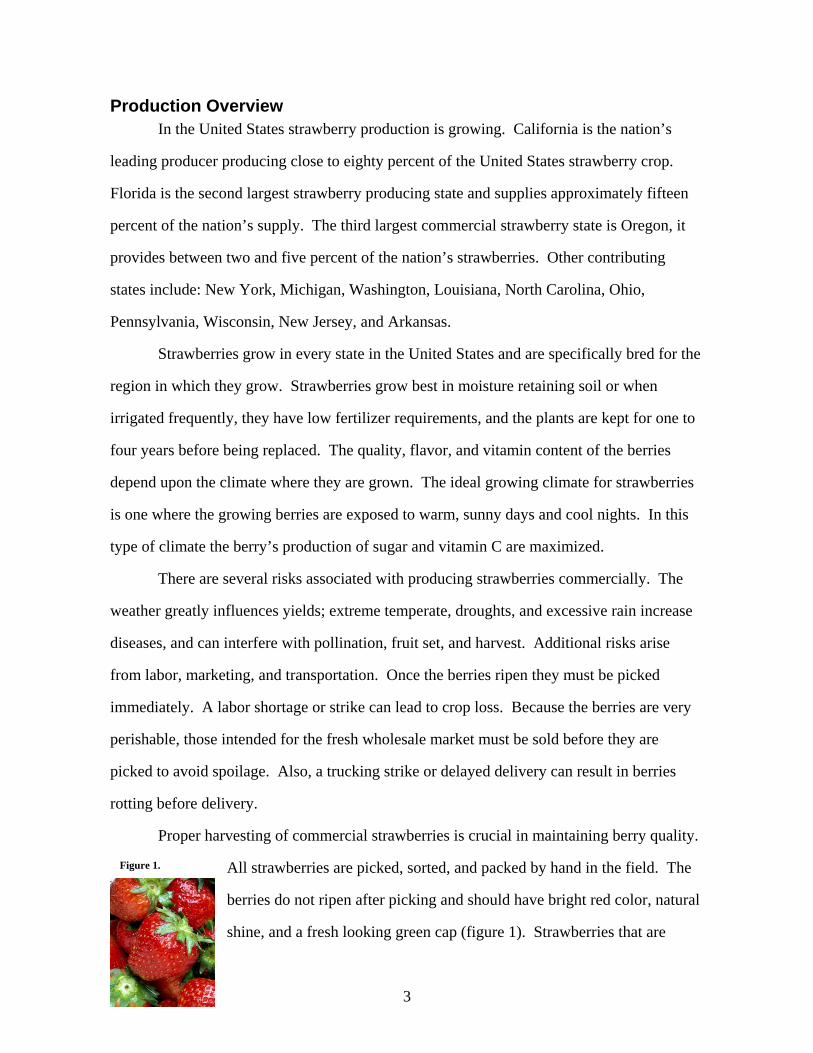
Proper harvesting of commercial strawberries is crucial in maintaining berry quality.
All strawberries are picked, sorted, and packed by hand in the field. The
berries do not ripen after picking and should have bright red color, natural
shine, and a fresh looking green cap (figure 1). Strawberries that are
Figure 1.
3

destined for the fresh market are rushed to facilities where they are cooled to about 34
degrees Fahrenheit. Within 24 hours of harvest, the berries are loaded on refrigerated trucks
for delivery to local supermarkets across the country. This post-harvest system ensures that
the delicate fruit reaches the consumer in good quality and under ideal conditions
strawberries will have a shelf life of fourteen days. Strawberries that are produced for
processing are gently washed, sorted, and quickly frozen after picking to ensure that their
flavor and appearance are retained.
Production/Supply Trends
The United
States is the world’s
largest producer and
supplier of
strawberries (table 1).
Strawberries are
produced for both the
fresh market and
processing in the
U
p
s
s
Table 1. World Strawberry Production Country 1998 1999 2000 2001 2002 1000 short tons
United States 820 916 951 826 985
Spain 340 416 378 359 362
Japan 200 224 226 230 231
Korea, Republic of 171 168 199 204 204
Poland 165 196 189 267 171
Italy 196 205 216 203 170
Others 1254 1348 1443 1380 1446 World 3146 3473 3602 3469 3569
Economic Research Service/USDA
nited States. However, fresh-market production is larger than the amount of berries
roduced for processing (table 2). Between 1980 and 2002 the acres of harvested
trawberries has increased by more than 10,000 acres, and grower price and the value of
trawberries have increased (table 3).
4
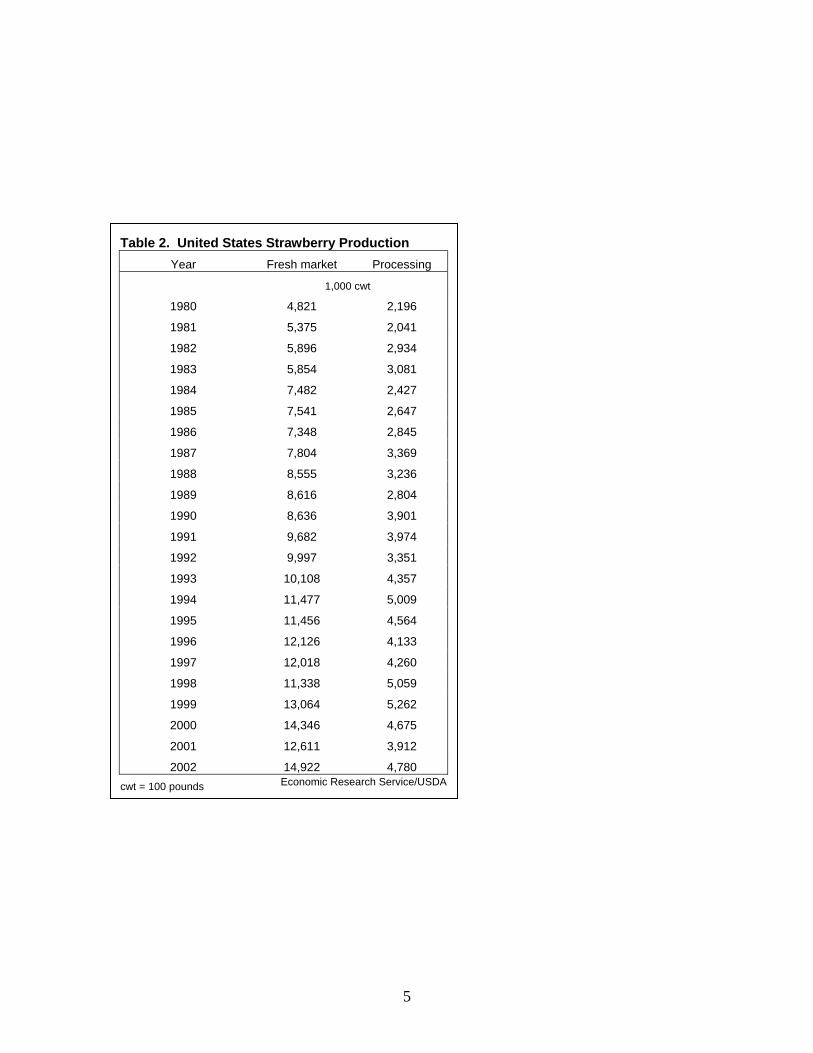
Table 2. United States Strawberry Production Year Fresh market Processing
1,000 cwt
1980 4,821 2,196
1981 5,375 2,041
1982 5,896 2,934
1983 5,854 3,081
1984 7,482 2,427
1985 7,541 2,647
1986 7,348 2,845
1987 7,804 3,369
1988 8,555 3,236
1989 8,616 2,804
1990 8,636 3,901
1991 9,682 3,974
1992 9,997 3,351
1993 10,108 4,357
1994 11,477 5,009
1995 11,456 4,564
1996 12,126 4,133
1997 12,018 4,260
1998 11,338 5,059
1999 13,064 5,262
2000 14,346 4,675
2001 12,611 3,912
2002 14,922 4,780 cwt = 100 pounds Economic Research Service/USDA
5

Table 3: United States Strawberries - acreage, production, season-average grower price, and value
Year Acres harvested Production Grower Price Value
Acres 1,000 cwt Dollars/cwt 1,000 dollars
1980 36,050 7,017 41.20 288,776
1981 37,000 7,416 42.00 311,147
1982 40,250 8,830 48.10 424,592
1983 43,300 8,935 45.60 407,188
1984 43,300 9,909 41.70 413,251
1985 44,050 10,188 44.30 450,819
1986 44,350 10,193 49.40 503,641
1987 46,120 11,173 49.40 552,336
1988 47,150 11,791 46.20 544,279
1989 46,100 11,420 47.10 537,756
1990 46,080 12,537 47.00 589,588
1991 46,080 13,656 46.20 631,458
1992 49,530 13,348 52.30 698,004
1993 51,230 14,465 46.30 669,937
1994 48,830 16,486 50.70 836,142
1995 48,080 16,020 50.70 811,634
1996 47,670 16,259 47.30 768,943
1997 44,260 16,278 55.50 903,350
1998 45,230 16,397 61.10 1,001,854
1999 46,760 18,326 61.80 1,133,412
2000 47,650 19,021 55.00 1,045,998
2001 46,000 16,523 64.80 107,052
2002 47,600 19,702 61.90 1,220,504
cwt=100 pounds Economic Research Service/USDA
6
The Three Largest Producing States
California California is the nation’s leading strawberry producer producing nearly eighty
percent of the nation’s strawberry output. In California strawberry plants are replaced
annually with a nursery crop. Throughout the harvest season strawberry plants continuously
produce new fruit, and need to be harvested every three days during the peak of the season.
The south and central coast of California is one of the ideal growing environments for
strawberry production. The Pacific Ocean provides the region with a moderate year round
temperature of warm days and cool foggy nights.
California’s growing region is between San Diego and the Monterey Bay area.
Harvesting of strawberries begins in San Diego and as the season progresses it moves north
up to the Monterey Bay area. In San Diego strawberry harvesting begins in June and peaks
around April. In the Santa Maria Area, north of Oxnard, strawberries are harvested from
March to July, and deliveries to processors continue through August. In the Monterey Bay
area, near Salinas and Watsonville, harvest begins in April and continues through
November, peaking in May or June. In this region year round production has been achieved.
Florida Florida produces about fifteen percent of the nation’s strawberries and close to all of
the nation’s berries grown during the winter months. The value of Florida’s strawberry has
more than tripled in the last two decades and has an impact of about $200 million in the
growing areas.
Oregon
Oregon produces approximately three percent of the nation’s strawberries. Oregon
strawberries are known worldwide for their exceptional taste, deep color, and intense
sweetness due to Oregon’s climate. The climate in Oregon is ideal for growing strawberries;
a long mild spring, and an early summer, with a lot of rainfall, warm sunny days, and cool
7

nights. Unfortunately the strawberry season in Oregon lasts only three to four weeks in the
beginning of summer. Because of this, the berries are difficult to ship long distances,
therefore Oregon supplies to a niche market with the majority of the berries produced for
processing.
Oregon strawberries are costly to produce; therefore they require a greater price in
the market to remain viable. However, recently growers have been unable to cover their
cost of production due to low strawberry prices. The price of Oregon strawberries is
influenced by the price of California strawberries. Furthermore, in Oregon the minimum
wage recently increased, as a result the per pound price of picking increased. This hurts
many growers and they have been reducing their strawberry acreage.
Consumption Americans are increasing their
consumption of fruits and vegetables.
Over the last two decades one of the
highest rates of consumption growth
of all fruits and vegetable crops has
been strawberries. Since 1986 per
capita consumption of both fresh and
frozen strawberries has grown by
more than two pounds (table 4).
Fresh strawberry per capita
consumption in 2002 was 4.9 pounds
compared to 2.9 pounds consumed in
1986. Per capita consumption of
frozen strawberries increased by
slightly more than half a pound between 1986 with 1.1 pounds, and 2002 with 1.7 pounds.
Table 4. United States Per Capita Consumption Year Consumption Fresh Frozen
pounds, farm-weight
1986 4.0 2.9 1.1
1987 4.3 3.1 1.1
1988 4.5 3.3 1.2
1989 4.5 3.0 1.2
1990 4.4 3.2 1.1
1991 4.8 3.6 1.2
1992 4.8 3.6 1.2
1993 4.8 3.6 1.2
1994 5.2 4.0 1.1
1995 5.3 4.1 1.3
1996 5.5 4.3 1.3
1997 5.1 4.1 1.1
1998 5.1 3.9 1.2
1999 5.7 4.5 1.2
2000 6.2 4.8 1.4
2001 5.8 4.2 1.6
2002 6.6 4.9 1.7 Economic Research Service/USDA
8

There are three major factors that contribute to increasing per capita consumption of
strawberries:
1. New information on the health benefits of berry consumption
2. The increasing supply of strawberries in the United States
3. The year round availability of strawberries to consumers
Other changes in strawberry consumption reflect higher incomes, a renewed interest in diet,
health, fitness, and natural foods; an aging population that eats more fruits and vegetables; a
growing immigrant and ethnic population whose diets contain more fruits and vegetables;
and the success of the industry’s “5 to 9-A-Day for Better Health” promotional program.
Commercialization In the United States strawberries are produced commercially for both fresh
consumption and processing. The marketing techniques and distribution methods of
strawberries are specialized so that the berries do not spoil before they reach the consumer.
All berries are hand picked directly into small baskets and crated for fresh markets or put
into trays for processing. Specific trends and changes within the strawberry industry and
marking methods include the following:
• Direct and wholesale marketing
• Distribution methods and grower prices
• Strawberry companies improving standards and creating brand loyalty
• Vertical integration of production
• Improved advertising and promotions
Depending on the destination of strawberries, the marketing of the berries differs.
Direct marketing of strawberries is used when berries will be sold directly to consumers
through roadside stands, farmers’ markets, or u-pick operations. Strawberry market
potential is better near large populations centers because local rural markets are easily
flooded. Selling strawberries in fresh or processing wholesale markets is more demanding
than direct local marketing, and is normally only suitable for large producers or grower
9
cooperatives. Grading, packaging, storage, and transportation must meet certain standards.
Transportation across state or national borders often requires special permits and tariffs.
Successful wholesale marketing requires expertise in post harvest refrigeration and
distribution. In the United States, California, Florida, Oregon and Washington dominate
wholesale export markets for strawberries.
Because strawberries are very perishable their distribution process is rapid.
Strawberry growers and companies use elaborate and extensive marketing channels,
facilities, and equipment for maintaining and enhancing berry quality. For example,
California strawberries that are sold in other states are flown to their destination to preserve
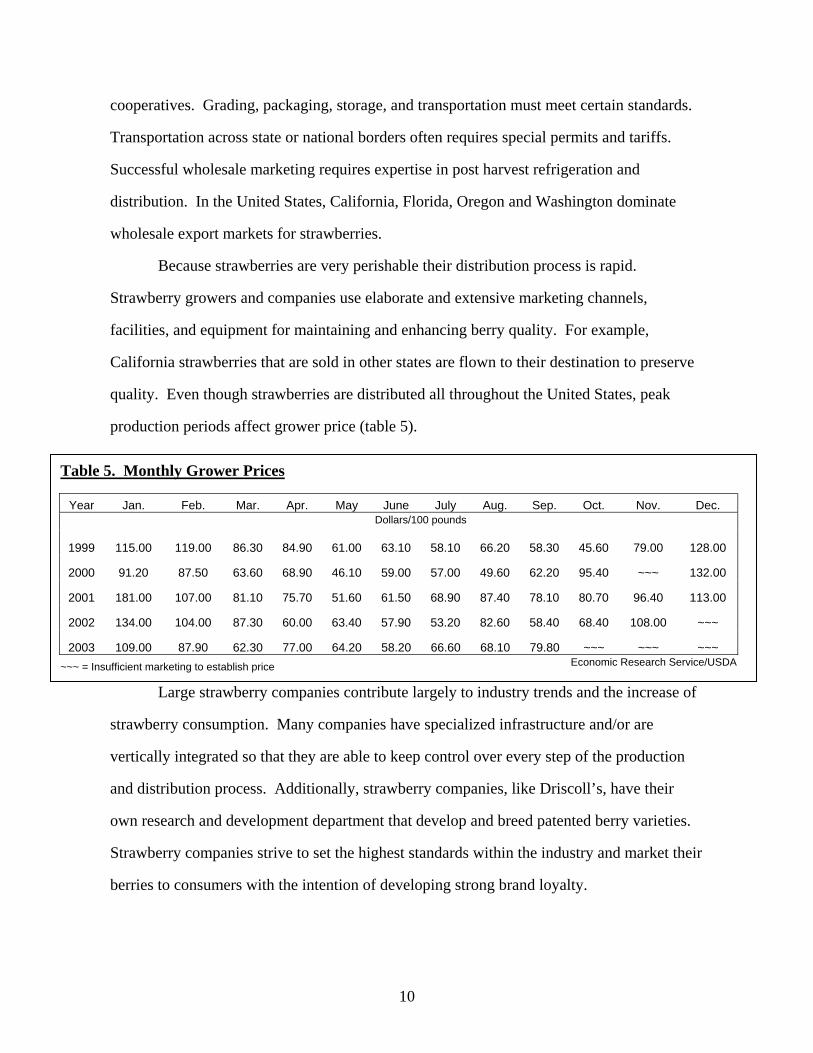
quality. Even though strawberries are distributed all throughout the United States, peak
production periods affect grower price (table 5).
Large strawberry companies contribute largely to industry trends and the increase of
strawberry consumption. Many companies have specialized infrastructure and/or are
vertically integrated so that they are able to keep control over every step of the production
and distribution process. Additionally, strawberry companies, like Driscoll’s, have their
own research and development department that develop and breed patented berry varieties.
Strawberry companies strive to set the highest standards within the industry and market their
berries to consumers with the intention of developing strong brand loyalty.
Table 5. Monthly Grower Prices
Year Jan. Feb. Mar. Apr. May June July Aug. Sep. Oct. Nov. Dec. Dollars/100 pounds
1999 115.00 119.00 86.30 84.90 61.00 63.10 58.10 66.20 58.30 45.60 79.00 128.00
2000 91.20 87.50 63.60 68.90 46.10 59.00 57.00 49.60 62.20 95.40 ~~~ 132.00
2001 181.00 107.00 81.10 75.70 51.60 61.50 68.90 87.40 78.10 80.70 96.40 113.00
2002 134.00 104.00 87.30 60.00 63.40 57.90 53.20 82.60 58.40 68.40 108.00 ~~~
2003 109.00 87.90 62.30 77.00 64.20 58.20 66.60 68.10 79.80 ~~~ ~~~ ~~~ ~~~ = Insufficient marketing to establish price Economic Research Service/USDA
10
Strawberry advertising and promotional programs successfully increase demand,
consumption, and consumer awareness of the health benefits strawberries provide.
Increasing strawberry demand and consumption results from the marketing efforts of the
United States Department of Agriculture in cooperation with many health institutions and
strawberry commissions and grower associations. Because of their advertising and various
promotional programs consumers are more knowledgeable of how strawberries can be part
of a healthy lifestyle. Strawberries are an easy way to increase fruit consumption and are a
healthy snack or versatile ingredient. One serving of eight medium sized strawberries has
only fifty calories. Strawberries are a great source of vitamin C, folate, potassium, and fiber.
Additionally, leading health association research links diets high in fruits and vegetables to
reduced risk of heart disease and various types of cancer.
One successful national promotional program that works to increase overall fruit and
vegetable consumption is the “5 to 9-A-Day For Better Health” program. This program is
represented and sponsored by the United States Department of Agriculture and health
institutions such as the National Cancer Institute and the American Cancer Society. Other
successful strawberry promotional and advertising efforts are from strawberry commissions
that represent their regional industry. These commissions, funded by growers, shippers,
processors and federal funds, oversee and conduct strawberry research and work to promote
strawberries through marketing programs. Through newspapers, magazines, broadcast
publicity, and other forms of media they target consumers, retail trade, foodservice
operations, and export markets throughout the United States and around the world.
Trade The United States imports and exports fresh and processed strawberries depending
upon peak growing seasons. Strawberry trade in the United States has been expanding; this
reflects the increasing availability of berries due to trade. The majority of imports occur
during the winter months when strawberry production is low (table 6). During the low
11

production season in the United States imports the majority of its strawberries from Mexico
(table 7). Canada and Japan are the main destinations for United States strawberry exports.
Table 6. United States Monthly Imports of Fresh-Market Strawberries Jan. Feb. Mar. Apr. May June July Aug. Sep. Oct. Nov. Dec. Annual
1,000 pounds
Imports
Strawberries 2002 9,547 10,441 18,069 22,212 12,011 9,831 2,456 219 174 280 1,866 2,792 89,898
Strawberries 2001 6,583 10,183 14,135 16,988 8,494 5,934 2,466 134 61 292 1,992 3,464 70,726
Strawberries 2000 7,610 10,876 14,941 18,632 10,349 7,893 1,543 95 28 236 2,361 1,675 76,239
Exports
Strawberries 2002 4,540 6,323 10,710 21,169 27,609 22,438 16,950 12,854 14,479 12,147 4,350 3,321 156,890
Strawberries 2001 3,371 5,682 10,242 14,662 28,512 16,487 12,829 11,383 9,345 8,913 3,628 3,054 128,108
Strawberries 2000 5,523 6,276 12,475 18,909 25,968 17,029 13,453 14,321 11,223 6,988 2,178 2,256 136,599 Economic Research Service/USDA
Table 7. United States Fresh Strawberry Imports
Country 1992 1993 1994 1995 1996 1997 1998 1999 2000 2001 2002 Short tons
Mexico 10,183 14,051 20,889 28,544 32,446 15,150 27,952 46,519 36,505 34,487 43,797
New Zealand 449 472 536 493 600 635 845 594 738 406 538
Canada 5 24 61 75 452 97 77 187 527 285 373
Australia 42 49 10 2 0 36 78 42 238 85 141
Argentina 4 0 0 3 8 8 30 33 60 19 51
Others 1,218 1,086 377 298 148 35 91 21 50 82 66
World 11,901 15,682 27,583 29,415 33,654 15,961 29,073 47,396 38,118 35,364 44,966
Economic Research Service/USDA
Effect of the North American Free Trade Agreement The majority of United States strawberry trade occurs in North American and has
been affected by the enactment of the North American Free Trade Agreement (NAFTA).
Since NAFTA became effective United States strawberry exports to Canada and Mexico
12
have increased. Prior to NAFTA strawberries from the United States faced a tariff of 6.61
cents per kilogram and Mexico’s tariff was twenty percent on strawberries. United States
imports faced a tariff of 0.4 cents per kilogram from June 15 to September 15, and 1.7 per
kilogram during the rest of the year.
Subsidies The United States government provides large subsidies for grains, oilseeds, and
cotton but very little direct subsidy for horticultural crops. However, strawberry growers
and producers indirectly receive monetary support form the United States government.
Some examples include:
• Marketing orders
o Federal and state governments provide industry benefits that are
paid for by both consumers and producers, i.e., California
Strawberry Commission.
o Federal and state governments have authorized voluntary industry
programs that often set minimum quality standards.
• Research and extension programs and related services
o Federal and state governments fund agriculture research
programs. A significant amount of this research is devoted to
environmental improvement and related broad benefits, rather
than productivity growth. Thus, the benefits are widely spread to
producers and consumers of various commodities
o The government also provides inspection, border protection and
related services that limit the spread of exotic agricultural pests
and diseases.
• Irrigation subsidies
o Growers and farmers are able to use water at reduced rate,
especially in California.
13
Conclusion The future outlook for the United States strawberry industry is favorable due to
growing production and consumption. However, there are two obstacles that the industry
needs to overcome to continue successful production and maintain a positive social image.
1. After January 1, 2005 the United States will no longer be able to use
methyl bromide because it is classified as a gas that depletes the ozone.
Methyl bromide is a gaseous fumigant used to treat the soil before crop
panting and allows growers to use marginal ground for production.
2. There have been class actions lawsuits filed against strawberry growers
and worker strikes because of the abuse some strawberry workers/pickers
have encountered. The types of abuse include low pay, no compensation
for overtime, dirty restrooms, sexual harassment, and discrimination
against women.
14

Sources
Barney, Danny. Davis, Bruce. Fellman, John. “Strawberry production: Overview.”
Alternative agricultural enterprises, University of Idaho. Brunke, Henrich. “Commodity Profile with an Emphasis on International Trade:
Strawberries.” Agricultural Issues Center, University of California. August 2002. California Strawberry Commission, www.calstrawberry.com Cook, Roberta. “Strawberry Production in the United States – 1999-2000.” Department of
Agricultural and Resource Economics, UC Davis. June 2002. Darrow, G.M. “The Strawberry: History, Breeding and Physiology.”
www.nal.usda.gov/pgdic/Strawberry/book/boktwent.htm Driscolls Strawberries, www.driscolls.com/strawberries Encyclopedia Britannica, “strawberry,” http://www.britannica.com/eb/article?eu71753 Kohls, R.L., and J. N. Uhl. Marketing of Agricultural Products, 9th Edition. Upper Saddle
River, NJ: Prentice Hall, Inc., 2001. Market and Trade Economics Division, Economic Research Service, U.S. Department of
Agriculture, October 2003, FTS-2003. “Fruit and Tree Nuts Situation and Outlook Yearbook.”
Naturipe Berry Growers, www.globalberryfarms.com Oregon Department of Agriculture. “Oregon growers cope with strawberry slump.”
www.ods.state.or.us/information/news/strawberry.html Oregon Strawberry Commission, www.oregon-strawberries.org “Strawberry Situation and Outlook.” FAS Online, Horticultural and Tropical Products
Division. www.fas.usda.gov/htp/circular/2001/01-01/strawbry.htm Sustainable Agriculture Newsletter Spring 2003. “SAREP sponsors first organic strawberry
production short course.” www.sarep.ucdavis.edu/newsltr/v15n1/sa-2.html
15
STRAWBERRIES IN MEXICO
Introduction Mexico’s Strawberry industry contributes less than one percent to the country’s
agriculture sector. However, strawberries are an important part of Mexico’s economy.
The industry employs a large number of the workers in the processing and freezing
facilities and field workers during harvest periods (Perera). When growing and
marketing conditions are favorable, strawberries are a highly profitable commodity.
However, it is also one of the most expensive and riskiest crops to grow.
The purpose of this paper is twofold. Firstly it will provide and overview of the
strawberry industry in Mexico, including information about the commodity’s history,
consumption, production, commercialization and marketing, and trade. Secondly, it will
discuss current issue of the elimination and use of methyl bromide and the future of the
industry in both countries.
History Commercial strawberry production in Mexico dates back to the last part of the
19th century in the state of Guanajuato. Before the late 1940s Mexico production was
only for the domestic market; it was not until WWII that Mexico began to export
strawberries. During the late 1940s strawberry demand in the United States was
increasing and imports from Mexico’s complemented North America’s consumption
during the winter months. The opening of freezing and packing plants in Guanajuato and
Michoacan also allowed Mexico to export strawberries to the United States.
During the second part of the 19th century, Mexico’s strawberry industry
increased in size. Prior to the 1950s, strawberry production was concentrated in the states
1
of Guanjuato, however, during the 1950s production expanded to the states of Michoacan
and Queretaro. In the 1960s, the number of acres in production increased because of the
growing number of small producers and processing facilities. In 1966 Mexico had
seventeen processing facilities, in 1972 there were thirty-three (Darrow).
By the 1970s, Mexico’s strawberry industry had efficient production methods and
there was potential for continued growth. However, in 1970 and 1974, the country
encountered a problem of over production. The strawberry industry in the United States
was flourishing, and as a result there was an abundance of strawberries. Prices
decreased, and producers in both countries had difficulty recovering production costs. To
improve the situation, the governments of Mexico and the United States agreed to
establish quotas for Mexican producers. These quotas were removed in 1988 (Runsten).
In the 1980s, strawberry production in Mexico is described as period of stagnation
and reduction in output and efficiency (Perera). During the 1990s production levels
varied each year. (SEE TABLE 1) The economic crisis in Mexico in the first part of the
1990s the overall financial situation for many strawberry growers was poor (Williams).
There was a sharp increase in input costs because of the devaluation of the peso; many
growers did not have the financial resources to maintain previous production levels.
Today the levels of strawberry production depend upon the economic situation of
producers, market prices and weather.
Production Mexico produces fresh and processed strawberries for domestic and international
markets. The states of Michoacan, Guanajuato and Baja California are the country’s
leading producers. Together they produce more than ninety percent of Mexico’s
strawberry crop. Small-scale production occurs in the states of Jualisco, Aguascaliented,
Mexico, Morelos, Sinaloa, Veracruz, and Zapatecas (Williams).
2
Strawberry yields vary greatly depending upon weather conditions, plant variety,
and area planted. With favorable weather conditions the country’s overall yields are
about 24 MT/Ha (59.3 MT/acre). Well-tended areas, however, can produce as much as
35 MT/Ha (86.485 MT/acre). Yields in Baja California tend to be the highest, and can
reach 40-50 MT/Ha (98.84-123.55 MT/acre) (Williams).
Strawberries are a risky crop to grow; their high production costs can make them
unprofitable depending on market prices. The cost of strawberry production includes the
establishment of the nursery, field preparation, strawberry plants, fertilizers and
fungicides, irrigation, harvesting, and labor.
The most expensive input of strawberry producing is the strawberry plant, which
is replanted each year. Mexico uses nursery stock from the United States; most
strawberry varieties from the United States are patented. In addition to cost of the plants,
royalties must be paid. Varieties from the United States produce sufficient yields,
however, they are not fully adapted the Mexico’s regions of cultivation. The plants are
bred specifically for the growing regions in the United States. Mexican producers in the
state of Michoacan have been working with the University of Chapingo to produce their
own strawberry plant in order to decrease their dependability on the United States
(Williams). If these new strawberry plants become available to producers, production
costs will decrease.
Planting occurs during the summer months, and can begin as early as May, but
most of the plants are planted in July and August. Harvesting begins in November and
stops in May or June once the rainy season begins. Recently, labor for harvesting in
Guanajuato has been scarce because several new industries, like the automotive, steel and
the maquiladoras, are hiring laborers that used to harvest strawberries. As a result
strawberry producers are paying higher wages to attract workers. Wages used to be
approximately 75 to 100 pesos/per shift (US$6.63 to 8.85 per shift); now wages are close
to 90 to 110 pesos/shift (US$7.96 to $9.73/shift) (Williams).
3
Production/Supply Trends Production of strawberries in Mexico varies upon the country’s economic
situation, weather, and current events (see Table 1.). The production levels in the early
1990s reflect the devaluation of the peso; producers had limited financial resources and
were unable to use the same amount of resources they had used in previous years. The
decreased level of domestic supply and exports in 1997 was a result of a food borne
illness being linked to tainted strawberries that originated from Baja California. The
publicity surrounding the outbreak of hepatitis A had a immediate negative effect on
fresh strawberry shippers from Baja California. Due to the decrease in market demand in
the United States, Mexican growers were told to stop harvesting in 1997. About 200
hectares of strawberries, out of 536-planted hectares were left un-harvested. The
strawberry industry in both the United States and Mexico quickly responded to the
situation by creating a quality assurance program. This regained consumer confidence
and production levels resumed in 1998 (Williams).
The production of frozen strawberries competes with the fresh market supply
strawberries. According to industry sources, frozen strawberry production has had
problems in the past, due to the lack of strawberries for processing in the domestic
market. Growers indicate that low international market prices in past years have driven
down the production of frozen strawberries, even though the demand has increased.
However, if more strawberries from the fresh market are diverted to freezing, production
could increase (FAS Online).
The cost to produce frozen strawberries in Mexico is less than the cost to produce
them in the state of Oregon in the United States. As a result, Oregon has lost its buyers to
Mexico (Oregon Department of Agriculture).
4
Growing Regions Michoacan Michoacan is the principal producing state in Mexico, producing about fifty-two
percent of the country’s strawberries (Perera). In Michoacan harvest begins in November
and the season continues until June, with peak harvest November to February.
Michoacan’s strawberries are the first berries to reach the market, and generally yield
high prices. According to producers, approximately seventy to eighty percent of the
state’s strawberries are produced for the processing industry, and twenty to thirty percent
go to the fresh export market (Williams).
Guanajuato Guanajuato is considered the second largest strawberry producer in Mexico,
producing about twenty-seven percent of the country’s crop (Perara). The state harvests
its strawberries from November to June, and peak harvest is February to April.
Guanajuato’s strawberries reach the market after Michoacan strawberries, and receive a
lower price. In an effort to increase profits, some growers from Guanajuato grow
strawberries in Michoacan and harvest their berries early to receive higher prices for their
crop. Other strawberry growers have switched to planting less risky crops, such as
broccoli, cauliflower, sorghum, wheat, or tomatoes. Producers indicate that
approximately thirty to forty percent of the strawberries produced in Guanajuato go to the
processing industry (Williams).
Baja California The state of Baja California is the third largest strawberry producing state in
Mexico and produces the highest quality strawberries in the country. The harvest season
in Baja California is January to June, with the peak season in March and April. Most of
the state’s strawberries are produced for fresh exports (Perara).
5

Consumption Mexicans have been increasing their consumption of fruits and vegetables as the
accessibility of produce has increased. However, the availability of produce, including
strawberries, depends upon the demand from the international market, and consumer
purchasing power. Mexico’s strawberry industry usually serves the international market
first, because international prices tend to be higher. Prices in the domestic market are
usually higher during Mexico’s export season in the winter months (Williams). As a
result domestic fresh strawberry supply is limited. It is believed that domestic fresh
strawberry consumption would increase if the amount supplied increased, and if prices
were affordable for consumers. Frozen strawberry consumption also varies upon the
international market and consumer purchasing power.
Strawberries are a popular fruit in Mexico and are used for a variety of purposes.
Some fresh strawberry uses include grocery store sales, the food service industry, local
markets and street vendors. Some uses of frozen strawberries are jams, breads, bakery
items, ice cream and yogurt. Obtaining Mexico’s per capita consumption of strawberries
is difficult; the strawberry industry and the government of Mexico have limit and
incomplete information available.
Commercialization In Mexico the commercialization and marketing of produce is changing. The
opening of markets, rising per capita income, urbanization, and foreign and domestic
investment are causing some of these changes. An example is international based retail
store chains, such as Wal-Mart and HEB, locating in Mexico. The international based
chain stores introduce their already developed marketing and management skills to the
employees of these stores. This includes modern technology, knowledge of the supply
6

chain system, and quality control. With these new introductions, Mexican’s are being
educated about various marketing methods; including the proper handling of
strawberries. Using these marketing methods they are able to increase consumer demand
for produce (Tropp).
Growers and international strawberry suppliers want to expand Mexico’s
domestic strawberry market. The Market Access Program, funded by the United State
Department of Agriculture’s Commodity Credit Corporation, provides funding to the
California Strawberry Commission for the expansion of foreign markets for United States
agriculture products (FAS Online). To increase strawberry demand and consumer
awareness in Mexico, the California Strawberry Commission provides point of purchase
promotional material for wholesalers and retailers to use. For example, they provide
brochures with recipes and the health benefits of consuming strawberries.
Even though there are changes occurring in the marketing and distributing of
strawberries, the first links in the supply chain are similar to many commodity chains
(Perera).
Grower
Intermediary
Wholesale markets
Grocery Store
Brokers
Terminal Markets
Packer
International Markets
Food Service
7

Growers and buyers/processors generally operate separately and there is little
integration with respect to marketing firms providing input to growers. Some marketing
companies are contemplating marketing integration with growers to have better quality
and verification controls.
Trade Mexico imports and exports fresh and frozen strawberries, although exports are
greater that imports. Approximately ninety-seven to ninety-nine percent of Mexico’s
exports go to the United States; the remainders are shipped by air to Japan and Europe.
Most of Mexico’s fresh strawberry exports occurs from December to March and do not
directly compete with strawberries produced within the United States. Mexico’s fresh
strawberry imports come from the United States. Mexico is one of the world’s top five
exporters of frozen strawberries. In 2002 Mexico was the second largest exporter after
Poland (Williams). (See Table 2.)
Free Trade Agreements The majority of Mexico’s strawberry trade occurs in North America and has been
affected by the enactment of the North America Free Trade Agreement. Since the
enactment of NAFTA in 1994 strawberry trade between Mexico and the United States
has increased.
Current Issue: the worldwide phase out of methyl bromide Methyl bromide is a widely used fumigant in agriculture. The gaseous fumigant
is used to treat the soil before crop planting, for post-harvest storage and facility
fumigation, and for government-required quarantine treatments. Methyl bromide
8
eliminates many pests and diseases that ruin crops. Methyl Bromide is one of many
chemicals that are being phased out worldwide because it is believed to contribute to the
depletion of the atmosphere’s ozone layer (Amber Waves).
The United States and 182 other countries signed the Montreal Protocol, an
international treaty, to eliminate the use of methyl bromide worldwide by 2015. Under
this treaty developed countries will be prohibited from producing or importing the
chemical for domestic use after 2004. Underdeveloped countries have until 2015 to
phase out their use of methyl bromide.
According to some strawberry producers, the use of methyl bromide can make a
fifty percent difference in yields compared to untreated fields. The elimination of methyl
bromide could result in a decrease of strawberry yields; increase the cost of production,
resulting in higher prices for consumers. It is believed when the United States must
eliminate their use of the chemical, imports from Mexico would significantly increase.
However, recently the United Nation’s authority regulating the treaty granted the
United States and ten other countries a temporary exemption for the January 1, 2005 ban.
Agriculture producers in the United States now have another year to research and find
alternative chemicals to replace methyl bromide.
Conclusion The future outlook for Mexico’s strawberry industry is positive, even with the
financial conditions of some growers. The future of strawberry trade between the United
States and Mexico may change, depending upon the elimination of methyl bromide and
the alternatives that producers will use. The increasing strawberry consumption in the
United States is very beneficial to Mexico since the majority of Mexico’s exports go to
the United States. Because of the marketing done by the strawberry industries,
consumers are becoming more aware of the link between a healthy diet and the
consumption of strawberries. As people begin to realize the importance of eating a
healthy diet strawberry consumption is going to increase.
9

Works Cited California Strawberry Commission, www.calstrawberry.com Carter, Colin, James Chalfant, Massimiliano De Santis, and Rachael Goodhue. "Economic Impacts of the Methyl Bromide Ban on teh California Strawberry Industry." Department of Agricultural and Resource Economics July 2000. Cook, Roberta. “Strawberry Production in the United States – 1999-2000.” Department of Agricultural and Resource Economics, UC Davis. June 2002. Darrow, G.M. “The Strawberry: History, Breeding and Physiology.” www.nal.usda.gov/pgdic/Strawberry/book/boktwent.htm Driscolls Strawberries, www.driscolls.com/strawberries FAS Online, (2003). Market access program. retrieved Apr 7, 2004, from www.fas.usda.gov. Karst, Tom. "Methyl Bromide exemption granted." The Packer.com. 10 Apr 2004 http://www.thepakcer.com/icms/_dtaa2/content/2004-114925-959.asp "Methyl Bromide Pahseout Proceeds: Users Request Exemption." Amber Waves, USDA Economic Research Service (2003). 28 Apr 2004 http://www.ers.usda.gov/AmberWaves/scripts/print.asp?page=/April03/Features/MethylBromide.htm Oregon Department of Agriculture. “Oregon growers cope with strawberry slump.” www.ods.state.or.us/information/news/strawberry.html Perera, M. De nuestra cosecha. Retrieved Apr 7, 2004, from www.infoaserca.gob.mx Runsten, David. “Transaction Costs in Mexican Fruit and Vegetable Contracting.” Department of Agriculture and Resource Economics, University Berkeley of California. March 1994. “Strawberry Situation and Outlook.” FAS Online, Horticultural and Tropical Products Division. www.fas.usda.gov/htp/circular/2001/01-01/strawbry.htm Topp, D., Skully, D., & Link J. (). Mexico's changing marketing system for fresh produce. Retrieved Apr 10, 2004. Williams, D. (2003). Mexico strawberries annual 1995-2003. USDA Foreign Agricultural Service. www.fas.usda.gov
10