Embed Size (px)
Citation preview

Stray Current MapperUser Manual
Rev 0July 2002

Stray Current Mapper-User Manual
Page i
SAFETY NOTES
Safety WarningsTwo levels of safety notices are used throughout the manual. They are:
WARNING. These notices are given where a procedure can cause personal injury if not carried outcorrectly.
Caution. These notices are given where a procedure can cause damage to equipment if notcarried out correctly.
Read the warning or caution information carefully and follow any instructions that may be given.
FCC StatementsThe manufacturer has classified the product as test equipment according to Part 15.103 of the FCCrules.
European Statements
"� complies with EMC directive 89/336/EEC."
CautionAny changes or modifications made to this product not expressly approved by Radiodetection Ltdcould void the user’s authority to operate the equipment.
For technical assistance contact: In the USA contact:Radiodetection Ltd Radiodetection CorpWestern Drive 35 Whitney RoadBristol BS14 OAZ UK Mahwah, NJ 07430, USATel: +44 (0) 117 976 7776 Tel: +1 (201) 848-8070Fax: +44 (0) 117 976 7775 Fax: +1 (201) 848-1303http://www.radiodetection.com http://www.radiodetection.com

Stray Current Mapper-User Manual
Page 1
TABLE OF CONTENTSSAFETY NOTES....................................................................................................................................... I
TABLE OF CONTENTS...........................................................................................................................11.1 CONCEPTS ....................................................................................................................................61.1.1 Existing methods of monitoring stray current interference ..............................................................71.1.2 Effects of stray current.....................................................................................................................71.1.3 Why current measurements are so important .................................................................................71.1.4 Why voltage measurements are so important .................................................................................7
2. EQUIPMENT OVERVIEW ...............................................................................................................82.1 COMPONENTS ...............................................................................................................................82.1.1 SCM SensorBar ...............................................................................................................................82.1.2 SmartProbe 2...................................................................................................................................92.1.3 Smart Interrupter..............................................................................................................................92.1.4 SCM SensorBar controller software ................................................................................................92.1.5 Data Viewer software.......................................................................................................................92.1.6 Laptop computer ..............................................................................................................................92.1.7 Global Positioning Option (GPS) option ........................................................................................102.1.8 General overview of how the system works ..................................................................................102.2 SCM KITS ...................................................................................................................................11
3. EQUIPMENT PREPARATION ......................................................................................................123.1 BATTERY CHARGING ....................................................................................................................123.1.1 SCM SensorBar .............................................................................................................................123.1.2 SmartProbe 2.................................................................................................................................123.1.3 Smart Interrupter............................................................................................................................123.1.4 Laptop computer ............................................................................................................................133.1.5 Software installation.......................................................................................................................13
4. OPERATION..................................................................................................................................144.1 STATIC MEASUREMENT.................................................................................................................144.1.1 Introduction ....................................................................................................................................144.1.2 Planning .........................................................................................................................................144.1.3 SCM SensorBar set-up..................................................................................................................144.1.4 SmartProbe set-up.........................................................................................................................154.1.5 Taking Measurements using the SensorBar or SmartProbe 2......................................................164.1.6 Setting up the Smart Interrupter (for static stray current mapping only)........................................174.1.7 Connecting the Smart Interrupter ..................................................................................................184.1.8 Operating the Smart Interrupter.....................................................................................................204.1.9 Activating the SCM SensorBar ......................................................................................................254.1.10 Using the SCM SensorBar Controller software...........................................................................254.1.11 Configuring the SCM SensorBar.................................................................................................26
5. DYNAMIC MEASUREMENT.........................................................................................................395.1 INTRODUCTION ............................................................................................................................395.2 DYNAMIC TESTING METHODOLOGY................................................................................................395.3 PLANNING ...................................................................................................................................395.4 SCM SENSORBAR SET-UP...........................................................................................................395.5 SMARTPROBE SET-UP..................................................................................................................405.6 CONNECTING THE SCM SENSORBAR TO THE LAPTOP COMPUTER..................................................405.7 SWITCHING OFF THE SCM SENSORBARS .....................................................................................40
6. READING AND ANALYSING DATA ............................................................................................426.1 SMARTMEDIA CARD REMOVAL ......................................................................................................426.2 READING THE DATALOG ...............................................................................................................436.2.1 Data Log Files................................................................................................................................43

Stray Current Mapper-User Manual
Page 2
6.3 USING THE VIEWER .....................................................................................................................446.3.1 Introduction ....................................................................................................................................446.3.2 SCM Data Viewer ..........................................................................................................................456.4 DISPLAYING MULTIPLE FILES........................................................................................................476.5 TOOLBARS ..................................................................................................................................486.5.1 File Handling Toolbar.....................................................................................................................496.5.2 Horizontal Data Displacement Toolbar ..........................................................................................516.5.3 Vertical Data Displacement Toolbar ..............................................................................................526.5.4 Data Measurement Toolbar ...........................................................................................................536.6 MENU..........................................................................................................................................596.6.1 File Sub-menu................................................................................................................................596.6.2 View Sub-menu..............................................................................................................................616.6.3 Configuration Sub-menu................................................................................................................636.6.4 Trace Sub-menu ............................................................................................................................656.6.5 Help Sub-menu..............................................................................................................................676.7 HORIZONTAL SCROLLING AND CURSOR CONTROL...........................................................................68
7 EXAMPLES ...................................................................................................................................72

Stray Current Mapper-User Manual
Page 3
List of Figures
1. INTRODUCTION ............................................................................................................................................ 5FIGURE 4.1 SMART INTERRUPTER CONNECTED TO STRUCTURE CABLE AND USING THE RECTIFIER AS
THE SI POWER SOURCE............................................................................................................................ 19FIGURE 4.2 SMART INTERRUPTER CONNECTED TO ANODE CABLE ............................................................ 19FIGURE 4.5 SCM SET-UP SCREEN..................................................................................................................... 26FIGURE 4.6 SENSORBAR DETAILS..................................................................................................................... 26FIGURE 4.7 CURRENT MEASUREMENT CHECK BOX.......................................................................................26FIGURE 4.8 VOLTAGE MEASUREMENT CHECK BOX .......................................................................................27FIGURE 4.9 CURRENT AND VOLTAGE DESCRIPTION SCREEN...................................................................... 27FIGURE 4.10 MEASUREMENT UNITS SCREEN.................................................................................................. 28FIGURE 4.11 SMART INTERRUPTER CHECK BOX............................................................................................ 28FIGURE 4.12 DATA LOG SETTINGS.................................................................................................................... 28FIGURE 4.13 SMARTMEDIA FILES ...................................................................................................................... 29FIGURE 4.14 APPLICATION BUTTONS ............................................................................................................... 29FIGURE 4.15 ABOUT SCM SCREEN.................................................................................................................... 30FIGURE 4.16 LOCATE VIEWER SCREENS ......................................................................................................... 31FIGURE 4.17 SCALING AND EXTENTS SCREEN ............................................................................................... 31FIGURE 4.18 SIGNAL VIEWER SCREEN............................................................................................................. 32FIGURE 4.19 LOCATE INFORMATION SCREENS .............................................................................................. 33FIGURE 4.20 TIME BASE CONTROL SCREEN.................................................................................................... 35FIGURE 4.21 VOLUME CONTROLS..................................................................................................................... 35FIGURE 4.22 COMMS LINK OK SCREEN ............................................................................................................ 36FIGURE 4.23 NO COMMS LINK SCREEN ............................................................................................................ 36FIGURE 4.24 REAL-TIME CLOCK SCREEN......................................................................................................... 36FIGURE 4.25 SCREEN CURSORS ....................................................................................................................... 37FIGURE 5.1 SCM SET-UP SCREEN..................................................................................................................... 40FIGURE 5.2 DATA LOG SETTINGS...................................................................................................................... 41FIGURE 5.3 SET DESCRIPTION FOR CURRENT FILE ....................................................................................... 42FIGURE 6.1 DATA VIEWER SCREEN .................................................................................................................. 44FIGURE 6.2 SCM DATA VIEWER SCREEN ......................................................................................................... 45FIGURE 6.3 CREATE SESSION SCREEN............................................................................................................ 45FIGURE 6.4 CREATE A NEW SESSION SCREEN............................................................................................... 46FIGURE 6.6 FOUR TRACES WITH TIME-ALIGNMENT DISABLED. .................................................................... 48FIGURE 6.7 TRACE PROPERTIES....................................................................................................................... 49FIGURE 6.8 ABOUT SCREEN............................................................................................................................... 50FIGURE 6.9 CORRELATE TRACES...................................................................................................................... 55FIGURE 6.10 CORRELATE TRACES RESULT SCREEN.....................................................................................56FIGURE 6.11 DRIFT REMOVAL SCREEN ............................................................................................................ 56FIGURE 6.12 DIFFERENCE TRACE SCREEN ..................................................................................................... 57FIGURE 6.13 UNPROTECTED PIPE DETECTION SCREEN ............................................................................... 57FIGURE 6.14 UNPROTECTED PIPE DETECTION RESULT SCREEN................................................................ 58FIGURE 6.15 AUTOMATED DYNAMIC-CURRENT CALCULATION SCREEN..................................................... 58FIGURE 6.16 AUTOMATED DYNAMIC CURRENT CALCULATION RESULT SCREEN...................................... 58FIGURE 6.17 VIEW LOG FILE SCREEN............................................................................................................... 59FIGURE 6.19 SPECIFY DATA DELIMITERS FOR EXPORT SCREEN................................................................. 60FIGURE 6.18 VIEW SUB-MENU............................................................................................................................ 61FIGURE 6.20 VIEW TRACES WITH OVERLAP SELECTED ................................................................................ 62FIGURE 6.21 VIEW TRACES WITH OVERLAP DESELECTED ........................................................................... 63FIGURE 6.22 CONFIGURATION SUB-MENU....................................................................................................... 63FIGURE 6.23 MEASUREMENT UNITS ................................................................................................................. 64FIGURE 6.24 NUMBER OF PREVIOUS SESSIONS SCREEN............................................................................. 64FIGURE 6.25 TRACE SUB-MENU......................................................................................................................... 65FIGURE 6.26 SELECT TRACE MENU .................................................................................................................. 65SELECT COLOUR MENU...................................................................................................................................... 66FIGURE 6.28 VISIBLE TRACES MENU ................................................................................................................ 66FIGURE 6.29 HELP SUB-MENU............................................................................................................................ 67FIGURE 6.30 HORIZONTAL SCROLLING MENU................................................................................................. 68FIGURE 6.31 VERTICAL AND HORIZONTAL CURSORS ....................................................................................69FIGURE 6.32 TRACE FEATURES......................................................................................................................... 70FIGURE 6.33 DEFINE ABSOLUTE ZERO..............................................................................................................70

Stray Current Mapper-User Manual
Page 4

Stray Current Mapper-User Manual
Page 5
1 INTRODUCTIONThis manual describes how to:
• Operate the Radiodetection Stray Current Mapper (SCM)• Operate the Smart Interrupter• Install the SCM software onto a laptop computer• Use the application software.
The SCM enables the magnitude and direction of any stray interference current on a pipeline to bemapped along the pipeline route. SCM mapping shows where the current is being picked-up on a pipeand where it is being discharged. With this information, the interference can be mitigated at anappropriate place, or places, on the pipeline. Once mitigation has been carried out, the SCM can beused to show that the mitigation design has been successful. The SCM can also be used to mapintentional current on a pipeline.
Note: This manual is not intended to be an in-depth authority on cathodic protection and pipelinecorrosion. To learn more about the theory of cathodic protection and pipeline corrosion controlcontact the National Association of Corrosion Engineers (Nace International) at www.nace.orgfor a list of suitable reading material. In particular, ‘Control of Pipeline Corrosion’ by A.W.Peabody, published by NACE publications is a good reference book for corrosion controlengineers.
Note: This manual assumes that you know how to use the Microsoft® Windows® operatingsystem and are familiar with directory and file structures, saving files and printing documents.For help on these topics refer to your computer owner’s guide.
The Microsoft® Windows® operating system is a registered trademark of Microsoft Corporationin the United States and/or other countries.
The SCM:
• Locates pick-up points• Locates discharge points• Confirms that mitigation has been successful• Maps individual current-source distribution on a pipeline system that has more than one
operating current-source• Maps the cathodic protection current distribution on a pipeline system from one or more
current sources• Performs pipeline system attenuation surveys using actual CP currents• Performs pipe-to-soil voltage potential measurements (in conjunction with a reference half-
cell).

Stray Current Mapper-User Manual
Page 6
1.1 ConceptsStray current interference is any direct (DC) electrical current that is being forced onto a metallicstructure from a foreign source. The two main sources of stray currents are:
a) Static interference current
Static interference current is usually forced onto a pipeline from the impressed-current,anode ground beds of other industrial plants, or from other foreign structures. An example oftypical static interference is shown in the following illustration.
b) Dynamic interference current
Dynamic interference current originates from electric transit systems (such as subways,trams, and mining operations) and can travel for miles over an adjoining network ofwell-coated pipelines. Unless mitigated, stray interference currents can have a profounddetrimental effect on adjacent metallic utility pipelines/substructures. A typical dynamicinterference situation is shown in the following illustration.

Stray Current Mapper-User Manual
Page 7
1.1.1 Existing methods of monitoring stray current interference
• Pipe-to-soil voltage potential measurement• Monitoring of existing electrical bonds• Voltage and current checks• Rectifier/transformer voltage and current checks• The use of corrosion coupons• Scheduled leakage-surveys• Local, interference-co-ordinating-committee notification of new impressed current
installations.
1.1.2 Effects of stray current
Typically, the first sign of stray current-induced corrosion on a pipeline is product leakage. However, ifa thorough (and usually costly) pipe-to-soil voltage survey is performed on the pipeline in theapproximate area that has the discharging stray currents, you will tend to see depressed voltagepotential readings (see 1.1.4).
1.1.3 Why current measurements are so important
Corrosion occurs when current leaves a pipeline. It is important to know the following:• Where the stray currents are coming from
• Where they are going (direction)• The magnitude of the currents.
When surveying a suspect area it is essential to gain enough information to ensure that mitigation isincorporated in the most effective places on the pipeline.
1.1.4 Why voltage measurements are so important
On a pipeline where pipe-to-soil voltage potential surveys are performed regularly, operators cansometimes find interference before the interference results in product leakage. An elevated voltagepotential on a pipeline with no additional current sources is the sign of a stray-current pick-up point. Adepressed voltage potential can be an indication of a stray-current discharge point. However, it shouldbe noted that voltage measurements are typically only useful when the pipeline is monitored regularly,thereby establishing a baseline for comparison. The pipe-to-soil measurements can complement thecurrent measurements obtained from the SCM.

Stray Current Mapper-User Manual
Page 8
2. EQUIPMENT OVERVIEW
2.1 ComponentsThe Stray Current Mapper (SCM) system comprises the following equipment:
� SCM SensorBar� SmartProbe 2� Smart Interrupter (GPS option available)� SCM SensorBar controller software (laptop computer application)� Data Viewer software (laptop computer application)� Customer supplied laptop computer.
The SCM system includes a data log and a real-time clock (RTC). This allows events to becaptured/logged for later review and analysis. In addition, a Radiodetection Pipeline Current Mapper(PCM) is highly desirable for accurately locating the pipeline and for locating faults/shorts in theinterfered-with pipeline system. Use the PCM before performing the SCM mapping process.
2.1.1 SCM SensorBar
When placed on the ground over the target pipe and activated, the SCM SensorBar detects selectedor made-specific interference current on the pipe. By measuring the interference current polarity andmagnitude, the SCM SensorBar determines where the interference current is being picked up, thedirection in which it is travelling, and where it is being discharged off the target pipeline. The SCMSensorBar transmits this information in real-time to the laptop computer via the SCM SensorBarcontroller software which is installed on the laptop computer. The laptop computer application softwaredisplays a bold arrow to indicate if the current direction is in the same direction as that conveyed by thered arrow on the SensorBar. The magnitude of the current is also displayed.
The SCM SensorBar is a portable device, and incorporates the following:
• On/off switch• SmartProbe connector• RS 232 connector for software download• Communications interface for connection to laptop computer• 6 ft connection lead• Direct connect input (for measuring voltage potential between pipeline and ground using a copper-
sulphate reference half-cell). This is useful when measuring dynamic stray current• Padlock anchor point• LED indicator• Bubble level• Current direction arrow• 6V 20 Ampere hour (Ah) rechargeable lead-acid battery pack, incorporating a SCM SensorBar
carrying handle• Slot for a 8, 16 or 32 Mb SmartMedia card enabling data logging to be performed• Software• Magnetometers• Compass
• Sounder/audio alarm.
The battery pack is supplied with a special-to-type mains-powered battery re-charger.

Stray Current Mapper-User Manual
Page 9
2.1.2 SmartProbe 2
The SmartProbe 2 is used for determining low current magnitudes and for use in congested urbanenvironments. The SmartProbe 2 can be pushed into the ground and placed directly over the pipe, inplace of the SCM SensorBar, and can significantly reduce magnetic interference from other parallel,current-carrying pipelines or from passing vehicular traffic.
The SmartProbe 2 incorporates the following:
� SCM software� RS232 connector for software download� Connection point for connection to the SMC SensorBar� ‘On’ Switch (the SmartProbe is switched ‘Off’ by the SCM SensorBar)� Current direction arrow.
2.1.3 Smart Interrupter
In determining static stray current interference from a particular foreign anode bed and its structures, itis necessary to place a Smart Interrupter in series with the CP supply or CP supplies for that structure.The Smart Interrupter modulates the foreign CP supply with a unique output current signature, whichenables the SCM SensorBar to identify stray currents originating from that CP supply. There are four,different, Smart Interrupter selectable settings, each setting having its own unique signature. Up to fourSmart Interrupters may be used together to enable assessment of the magnitude and direction of straycurrents from multiple foreign CP supplies.
The Smart Interrupter can also provide important information about an operator’s own current sourcewhen connected in-line with the target pipeline current source.
The Smart Interrupter is powered by two LR20 D-cells but can be connected to an external powersupply.
2.1.4 SCM SensorBar controller software
The controller software has three major functions:
� Configuring the SCM SensorBar� Viewing the signal information provided by the SCM SensorBar� Viewing the locate data obtained by the SCM SensorBar.
2.1.5 Data Viewer software
Data log files created by the SCM SensorBar are viewed and analysed using the Data Viewersoftware. The data is stored on a SmartMedia card, which is placed in the SCM SensorBar. Afterlogging, the cards are removed from the SCM SensorBar, and loaded into the laptop computer. Thedata log files are downloaded to the laptop computer and the results of the data logging analysed. It ispossible to read the results from more than one card on the same screen, and is a necessarycapability when analysing the results from dynamic stray-current-interference mapping.
2.1.6 Laptop computer
The minimum requirements for the laptop computer are:
� 133 MHz processor� 64 MB memory� PCMCIA slot for reading SmartMedia cards (laptop computer only) or floppy drive
SmartMedia card adapter� CD-ROM drive� 5 GB hard drive� Microsoft Windows® 95/98/ /NT/2000®� Radiodetection Stray Current Mapper software installed.

Stray Current Mapper-User Manual
Page 10
It is a good idea to house the laptop computer in a rugged case to protect it from transit damage orwhen using it outside. In bright sunlight, a sunscreen hood may be required to enable the user to viewthe screen comfortably. To overcome the inherent difficulties of reading the screen in bright sunlight itis possible to fit an extension to the RS232 communications lead to enable the laptop computer toplaced, and used, in a vehicle.
2.1.7 Global Positioning Option (GPS) option
The Smart Interrupter can be supplied with GPS as an option, which is most useful when using two ormore units at the same time. Units fitted with the GPS option will automatically synchronize with eachother when switched on and a GPS signal is available. Synchronization is required so that thewaveforms from multiple Smart interrupters are in step with each other and can be read by the SCMSensorBar. Synchronization is explained in detail in section 4.1.6.
2.1.8 General overview of how the system works
Static Interference
SCM SensorBarAfter you have located the target pipe, place the SCM SensorBar above the pipe, and, using thesupplied connector lead connect the SCM SensorBar to the laptop computer. Start the SCMSensorBar Setup software program and when it is running, activate the SCM SensorBar, which thendetects current on the pipe. The SCM SensorBar transmits this information (via a two-waycommunications link) in real-time, to the laptop computer. The laptop computer application softwaredisplays a bold arrow to indicate whether the current is travelling in the same direction as the red arrowon the SCM SensorBar or in the opposite direction. The magnitude of the current is also indicated. Bymeasuring the current polarity and magnitude, subsequent SensorBar measurements are used todetermine whether there is stray current on the pipeline and where it is being picked up or discharged.Although most static interference mapping is generally done in real-time, the information can still belogged for future analysis.
SmartProbe 2It is highly beneficial to use the SmartProbe 2, in place of the SCM SensorBar, in the followingcircumstances:
• To filter out unwanted traffic interference in urban areas• To filter out the effects of nearby parallel magnetically interfering pipelines• When encountering low current magnitudes.
Dynamic interference
In cases where stray current interference is dynamic, such as from an electrified rail system,it is often necessary to leave the stray current mapping equipment in place for extended periods. Inthese circumstances the data is logged by means of a SmartMedia card placed in each SCMSensorBar being used in the survey. A number of SCM SensorBars or SmartProbes are placeddirectly above the target pipeline at appropriate distances from each other and the logging period set,by means of the SCM SensorBar controller software. Each SCM SensorBar is capable of logging andstoring up to 36 hours of data on an 8 Mb SmartMedia card, although SmartMedia cards with morestorage capability are available if required. After the survey the logged data is downloaded to thelaptop computer and is analysed to reveal the profile of the dynamic stray current over the monitoredsection of pipeline. A Smart Interrupter is not used when taking dynamic measurements.

Stray Current Mapper-User Manual
Page 11
2.2 SCM kitsTypical SCM kits are shown below:
Static System
• One SCM SensorBar complete with battery and leads• Up to four 50A GPS Smart Interrupters or four 100A GPS Smart Interrupters or a
combination of both• One SmartProbe• PC applications software• One SmartMedia card.
Dynamic System
• Up to three SCM SensorBars complete with battery and leads• Up to three SmartProbes• PC applications software• One SmartMedia card per bar.
Note: SCM kits do not include the laptop computer.

Stray Current Mapper-User Manual
Page 12
3. EQUIPMENT PREPARATION
3.1 Battery charging3.1.1 SCM SensorBar
• The SCM SensorBar is supplied with a rechargeable lead-acid battery pack andbattery charger. The battery is capable of approximately 48 hours of operationbetween charges and takes approximately 4-6 hours to charge fully
• A battery level indicator on the Signal Viewer software screen indicates the SCMSensorBar battery charge-state
• As a precaution, before using the SCM, re-charge the battery when the battery scalereads less than half
• When the battery is almost exhausted the SCM SensorBar sounder/alarm willgenerate six cycles of the standard alert tone (a ‘beep’ sound) and the SCMSensorBar will then switch off. If this happens during data logging, data logged up tothe point of shutdown will not be lost.
Charge the SCM SensorBar battery as follows:
• Remove the battery pack from the SCM SensorBar by unscrewing the two quick release fastenersand lift the pack from the SCM SensorBar
• Place the battery on a suitable surface and plug the charging connector from the charger into thebattery pack (the connector receptacle is located on the underside of the battery in the centre)
• Plug one end of the charger power cable into the charger and the other end into a mains powersupply socket and switch on the socket. The battery charger will automatically start charging. Thegreen power light on the charger will illuminate and the amber charge light will illuminate toindicate that the battery is charging. Once charging is complete, the amber light will extinguish.
• Remove the charger from the mains power supply, disconnect the charging connector from thebattery and re-fit battery to the SCM SensorBar.
A 12V inverter (not supplied) can be used to recharge the battery pack from a vehicle.
3.1.2 SmartProbe 2The SmartProbe 2 takes its power from the SCM SensorBar rechargeable lead-acid battery pack anddoes not require any other power supply.
3.1.3 Smart Interrupter
The Smart Interrupter is powered by two LR20 1.5-volt alkaline batteries, which have a life ofapproximately 300 hours. However, to conserve battery life, the Smart Interrupter can be poweredfrom the transformer/rectifier CP supply although when running the Smart Interrupter from a CPsupply, the batteries must be fitted. The Smart Interrupter incorporates a battery level indicator, whichis displayed when operating the Smart Interrupter from batteries, and an external power indicator thatis displayed when operating the Smart Interrupter from an external power supply.
Replace the Smart Interrupter batteries as follows:
• Unscrew the two D-rings located on the front-face of the Smart Interrupter and remove the cover• Remove the batteries• Fit new batteries ensuring that the polarity is correct• Replace the cover and re-tighten the D-rings.
Note: Never renew a single battery on its own, always renew both batteries.

Stray Current Mapper-User Manual
Page 13
3.1.4 Laptop computer
Ensure that the laptop computer battery is fully charged before use. If performing long surveys ensurethat you have enough spare batteries to perform the task. A 12-volt inverter can be used to charge thelaptop computer from a vehicle battery or from a portable 12-volt motorcycle battery. A 12-volt inverterand motorcycle battery combination (not supplied) is a common method of providing portable power forthe laptop computer. When using this method of power source, putting the motorcycle battery in acarrying case makes it easier to handle.
3.1.5 Software installationThe SCM SensorBar and SmartProbe 2 are supplied with software already installed. The SCMSensorBar Setup software and Data Viewer software are supplied on a CD for installation onto alaptop computer.
Install the SCM SensorBar software and Data Viewer software as follows:• Switch on the laptop computer• Insert the CD containing the software into the computer CD drive• Click the Start button on the taskbar and select Run• Type D:\SETUP (where D: is the CD drive letter), and press OK. If D is not your CD drive letter use
the browse function to find it
Follow the on-screen instructions for installing the software.

Stray Current Mapper-User Manual
Page 14
4. OPERATION
4.1 Static measurement
4.1.1 Introduction
Why measure
By mapping the currents on a pipeline system, it is possible to determine the current magnitude,direction, and duration. From the results of the mapping, it is possible to calculate where the current iscoming from, where it is leaving one pipeline and joining another, and where mitigation is likely to bemost effective. After mitigation, subsequent mapping will confirm that the corrective measures wereappropriate.
Note: When performing static stray current mapping, the current duration and magnitude will remainreasonably constant.
4.1.2 Planning
Survey preparation
Proper pre-survey preparation is essential if the survey is to be conducted in an efficient, timely, andcost effective manner.
Maps
Before starting the survey obtain up-to-date utility/substructure maps that show where all metallicunderground pipelines are situated within the area. This will greatly assist in mapping the area with theSCM.
Strategy
Plan the strategy before starting. This will reduce the time taken to carry out the survey and will resultin a more efficient survey.
Liaison with other companies
When conducting surveys it is important to co-operate with members of other organisations who havepipelines in the area so that mitigation becomes a co-ordinated effort and all pipelines are protectedwithout causing damage to other pipelines. Proper mitigation may include, for example, bonding,coating, or current reduction to other company’s pipes.
Access to foreign transformer/rectifier (for location purposes)
When carrying out a static current survey it is necessary to connect a Smart Interrupter in series withthe foreign rectifier. This is so the SCM SensorBar or SmartProbe can read the output signal that theSmart Interrupter generates along the pipeline.
4.1.3 SCM SensorBar set-up
SCM SensorBar handling precautions
Although the SCM SensorBar is designed for outdoor use and is of rugged construction, it should betreated with care, as it is a precision instrument.
• Do not drop or handle the SCM SensorBar roughly as the magnetometers could be damaged• When stowing the SCM SensorBar in a vehicle or storage rack, avoid placing heavy objects on the
SCM SensorBar• Always use the battery-pack carrying handle to carry the SCM SensorBar• Always keep the battery pack attached except when charging the battery• Keep all connectors clean and periodically check cables for signs of damage, such as cuts and
fraying• The SCM SensorBar can be used in the rain, but must not be submersed in water.

Stray Current Mapper-User Manual
Page 15
Locating and tracing the target pipe
Before using the SCM to survey the pipeline for stray currents, precisely locate the pipe, record itsdepth at various locations, and trace its route. To locate the pipeline, use the Radiodetection PipelineCurrent Mapper (PCM) and apply the tracing signal with the PCM transmitter. For information on usingthe PCM, refer to the PCM User Guide. Other standard locators are available. Contact Radiodetectionfor more information.
Positioning the SCM SensorBar
Once the pipeline has been precisely located and traced, place the SCM SensorBar on the groundover the pipeline at right angles to the pipe. The arrow on the SCM SensorBar should be pointing inthe direction in which the current is presumed to be flowing. Place the SCM SensorBar place as levelas possible over the pipe and check that the SCM SensorBar is level by reference to the built-in bubblelevel.
When placing the SCM SensorBar on the ground it might be in a place where the pipe bends, or wherethere is a T-piece or it might be located over an area where the pipe changes depth. If the SCMSensorBar is placed over a bend or T-piece, the depth reading will be accurate but the current signalfrom SCM SensorBar will drop. If this happens re-position the SCM SensorBar further along the pipeand take a reading again. If a PCM is being used to locate the pipe, the null reading will be furtheraway from the pipe than normal. If this is the case take a reading further along the pipe.
If the pipe depth suddenly changes, the depth reading on the PCM or SCM SensorBar will beinaccurate at that point and bear no relationship to the expected reading. This is because of fielddistortion or possibly another utility on top of the pipe. In this case, take another PCM or SCMSensorBar reading further along the pipe until a sensible depth reading is obtained.
Connecting the SCM SensorBar to the laptop computer
Connect the RS232 end of the connection lead to the appropriate port on the laptop computer (usuallyCOM 1) and the other end to the communications connection on the SCM SensorBar. Ensure that theconnectors are clean and are mated correctly and securely.
4.1.4 SmartProbe set-up
When to use the SmartProbe
The SmartProbe is often used in urban environments where passing traffic or other nearby highcurrent carrying pipelines may cause interference and give inaccurate current and depth readingswhen using the SCM SensorBar. By making an insertion hole over the target pipeline or by pushing theSmartProbe into soft ground, the SmartProbe tip can be placed in close proximity to the top deadcentre (TDC) of the pipe.
When using the SmartProbe for Static measurement the Smart Interrupter must be set to PPL mode. Ifmore than one Smart Interrupter is being used switch off the interrupters apart from the one that isgenerating the signal of interest.
SmartProbe handling precautions
Although the SmartProbe is designed for outdoor use and is of rugged construction it should be treatedwith care, as it is a precision instrument.
• Do not drop or handle the SmartProbe roughly as the magnetometers could be damaged• When stowing the SmartProbe in a vehicle or storage rack, avoid placing heavy objects on the
SmartProbe• Do not use the SmartProbe as a digging tool• Do not bang the SmartProbe up and down on a pipe, this will damage the magnetometers and
possibly the pipe’s protective coating• Do not bend the SmartProbe• Keep all connectors clean and periodically check cables for signs of damage, such as cuts or
fraying.

Stray Current Mapper-User Manual
Page 16
Connecting the SmartProbe to the SCM SensorBar
• Ensure that the connectors are clean.• Connect one end of the connection lead to the SmartProbe (the connection port is located under
the head of the SmartProbe) and the other end to the SCM SensorBar connection marked‘SMARTPROBE CONNECTION’. Ensure that the connectors mate correctly and securely.
The connectors on the SCM SensorBar and on the connection cables are colour coded as follows:
SCM SensorBar to laptop computer—blueSmartProbe to SCM SensorBar—redDirect connection to SCM SensorBar—yellow.
Positioning the SmartProbe
Inserting the SmartProbe into the ground
If the pipe is under concrete, drill or make a hole in the concrete to enable the SmartProbe to beinserted and positioned as near as possible to the top dead centre of the pipe.If the pipe is under soft soil, push the SmartProbe into the ground using the two handles incorporatedfor this purpose.
Position the SmartProbe directly over the pipe and as near to the top dead centre of the pipe aspossible. When locating the pipe ensure that the offset from the top dead centre of the pipe is less thanhalf of the depth of the pipe. This ensures that the SmartProbe is placed in the optimum position toreduce interference and obtain the best signal.
When taking measurements with the SmartProbe, signal strength is dependent on the depth of thepipe. The signal gets weaker as the depth of the pipe increases.Before drilling any holes into roads, pavements, or sidewalks, contact the local authority to obtainguidance on any procedures that must be followed before any excavations are made. This will includeany repairs that may be necessary after the excavation.
WARNING. Before drilling a hole or pushing the SmartProbe into the ground, carry out athorough check of the location. Ensure there are no cables or pipes above thetarget pipe that could be struck during drilling or insertion of the SmartProbe.
Caution. Take great care when drilling holes prior to inserting the SmartProbe as the drill can easilydamage the pipe and coating. Locate the pipe carefully and note the depth of the pipe.When drilling the hole, stop drilling as soon as the drill has passed through the concrete.Insert the SmartProbe and, using the six-inch graduations on the SmartProbe, take a depthreading. Push the SmartProbe into the ground until the pipe is reached or the SmartProbe isas far into the ground as it will go. Do not bang the SmartProbe up and down on the pipe asthis can damage the SmartProbe and the pipe coating.
Ensure the red arrow on top of the SmartProbe is pointing in the direction in which the current ispresumed to be flowing.
4.1.5 Taking Measurements using the SensorBar or SmartProbe 2
Once the pipe has been located and the SensorBar or SmartProbe has been placed over the pipe, theprocedure for taking measurements can be summarised as follows:
- Set-up the Smart Interrupter- Position the SCM SensorBar or SmartProbe- Connect the SCM SensorBar to the laptop computer- Activate the SCM SensorBar or SmartProbe- Take the readings.

Stray Current Mapper-User Manual
Page 17
4.1.6 Setting up the Smart Interrupter (for static stray current mapping only)
User Controls
Power On/Off
Selects Stray Current Mapper (SCM) and Precision Pipeline Locator (PPL) signals.
Changes a field, adjusts a time or changes a selection and selects individual SCM signals
Stops and starts the Smart Interrupter running.
Selects pulse mode. You can define on and off pulsing periods—for example, On period 3seconds, Off period 8 seconds. Assists in signal identification when using more than oneSmart Interrupter at the same time.
With the timer function you can activate and de-activate the Smart Interrupter at defined timesof the day—for example, activate at 7 a.m., and de- activate at 5 p.m., every day until youdisconnect the Smart Interrupter or you change the timings.
Confirms all selections.
Enables LCD contrast control.
External Controls
Output cableentries
Serial synchronizationconnector socket
External power
GPS antennaconnectorsocket

Stray Current Mapper-User Manual
Page 18
4.1.7 Connecting the Smart Interrupter
Caution :• Always switch off the CP system before connecting and disconnecting the Smart
Interrupter.
• When connecting the Smart Interrupter to either the anode cable or to the structure cableensure that the red clip is connected to the most positive connection point and the blackclip to the most negative connection point. If the Smart Interrupter is connected the wrongway round it will indicate incorrect connection with a continuous warning tone.
• The Smart Interrupter must only be used by suitably trained personnel.
• When connecting the external supply lead, always connect it to the anode wire beforeplugging it into the Smart Interrupter.
• When disconnecting the external supply lead, always remove it from the Smart Interrupterbefore disconnecting it from the anode wire.
To prevent unauthorized access, keep the Smart Interrupter secure if it is left unattendedwhen in use.

Stray Current Mapper-User Manual
Page 19
Methods of Smart Interrupter connection
Figure 4.1 Smart Interrupter connected to structure cable and using the rectifier as the SI powersource
Figure 4.2 Smart Interrupter connected to anode cable

Stray Current Mapper-User Manual
Page 20
4.1.8 Operating the Smart InterrupterNote: Operating procedures are the same for both the 50 amp and 100 amp versions.
Power-on
Press the Power On/Off button.
The start-up screen is displayed for approximately 2 seconds, after which time the second screen isdisplayed. This screen displays the mode that the Smart Interrupter was in when it was last switchedoff.
If the screen shows anything other than “Running SCM” or “Stopped SCM”, press the SCMbutton to return to the SCM screen. The following screen is displayed.
ModesThe capability of the Smart Interrupter to generate any one of 4 unique SCM output signals is aparticularly helpful feature if you are using the SCM with more than one Smart Interrupter at the sametime. The Smart Interrupter can also be set to generate a PPL signal.
SCM Mode. The 4 selectable SCM output signals are numbered 0-3.
Press the right or left arrow button to cycle through the output signals until the desiredsignal number is displayed. If using several Smart Interrupters ensure they havedifferent signal output numbers
PPL Mode.
Press the right or left arrow button to cycle through the output signals until PPL 1 isdisplayed.
Press the Run/Stop button to start the Smart Interrupter running and apply the signal tothe pipe.The ‘Running SCM’ screen is displayed.
Pulse ModeIn pulse mode the Smart Interrupter puts a simple on/off pulse onto the line and assists in signalidentification when using more than one Smart Interrupter at the same time. If using more than oneSmart Interrupter make the pulse On/Off times different for each unit.
Stray Current Mapper-User Manual
Page 21
Press the pulse mode button to select pulse mode. The following screen is displayedwith the On time highlighted. Press the OK button to toggle between On time and Offtime.
To set the ‘On’ time, press the left/right buttons until the desired time is displayed and press OK. TheOff time is now highlighted.
To set the ‘Off’ time, press the left/right buttons until the desired time is displayed.
Note: From 0 to 10 seconds the time increases in steps of 0.1 seconds. From 10 to 100 seconds thetime increases in steps of 1 second. Times can be changed with the Smart Interrupter running orstopped.
Once you have set the On and Off times press the Run/Stop button to start the SmartInterrupter running and apply the signal to the pipe.
Previous SettingsTo retrieve any one of the last ten settings in pulse mode, press and hold down the pulse button and atthe same time press either the left or right arrow button. The screen will cycle through the last tensettings, showing the number of each setting (1 is the most recent). When you have selected a setting,release the pulse button and press the OK button. The pulse mode screen is displayed with theselected settings.
Contrast Screen
Press the contrast button to adjust the screen contrast.The Contrast screen is displayed.
Press the left/right arrow buttons to adjust the contrast to the desired level. Contrast settings are from1 (lightest) to 20 (darkest). The setting ‘wraps’ round from 1 to 20. To select the desired setting, pressOK or leave the buttons untouched for 5 seconds.
Temperature WarningIf the Smart Interrupter overheats and operates the thermal cut-out, the Over Temperature warningscreen is displayed. The Smart Interrupter keeps displaying this screen and all buttons, except thepower off button, are disabled until the thermal cut-out resets. Once the cut-out has reset the SmartInterrupter resumes normal operation in stopped mode.

Stray Current Mapper-User Manual
Page 22
SynchronizationThe GPS Smart Interrupter can be individually synchronized. The unit will synchronize and stay insynchronization as long as the antenna is plugged in to the GPS antenna socket on the Smart Interrupter,has a clear view of the sky, and is receiving a GPS signal. Synchronization is automatically updated every30 minutes.
Note: If the unit has not been used for some time (over 4 weeks) it may take several minutes for theSmart Interrupter to obtain a GPS signal. This is normal and does not require any user action.
GPS operation symbols are:
GPS standby-GPS asleep (no action required)
GPS searching
Timer active
Antenna
Flashing symbol-fault (replace antenna)
Steady symbol- move Smart Interrupter to a better GPS reception area
Signal level
Minimum signal strength
Maximum signal strength
Synchronization being determined
Synchronization to GPS OK last time
No synchronization to GPS last time (“free running”)
Timer ModeNote: The Smart Interrupter clock is automatically adjusted every time a GPS signal is received. The
clock also automatically adjusts to local time.
A GPS Smart Interrupter can be instructed to activate at a certain time and de-activate at another. Forexample, the Smart Interrupter can be set to be active during the day and inactive at night. To set thetimer proceed as follows:
Press the timer button. The Use Timer screen is displayed.
Press the left/right arrow buttons to select either Yes or No. If you select No the unit reverts to the mainscreen and the timer will not operate. If you select Yes, the timer screen is displayed.
If there is no GPS signal or the GPS antenna is not connected, the timer cannot be enabled and thefollowing screen is displayed.
Press OK to return to the previous screen without setting the timer.

Stray Current Mapper-User Manual
Page 23
Setting the timerPress the timer button and using the left/right arrows, select Yes. The timer screen is displayed:
Press the left/right buttons to change the set time. Press OK to toggle from start time to stop time.Once the start/stop times have been set press OK to display the Local Time Now screen.
Press the left/right arrows to adjust the current time in steps of 1 hour (this allow to make adjustmentsfor daylight saving, for example). Press OK. The screen reverts to the previous mode with the additionof the flashing timer symbol. The run/stop button is disabled as the timer now has control.
When the start time is reached the screen shows the unit running as normal. When the stop time isreached the display shows stopped.
Temperature Warning
Operating the Smart Interrupter in a hot environment, such as in an enclosed CP cubicle in a hotcountry can cause the Smart Interrupter to overheat. To prevent this happening the Smart Interrupterincorporates a thermal cut-out. If the thermal cut-out operates, the following screen is displayed:
The Smart Interrupter will keep displaying this screen and the output signal will stop. All buttonpresses, except ‘Power Off’, will be ignored until the thermal cut-out resets. Once the cut-out hasreset, the Smart Interrupter will resume normal operation in stopped mode. If the thermal cut-outoperates try moving the Smart Interrupter to a cooler location.
Smart Interrupter MaintenanceThe Smart Interrupter is powered by 2xLR20, D-cell batteries
Battery level indication. When the battery level is full the battery symbol remains black.When the battery level becomes low the battery icon shows a single bar. If there is nobar, replace the batteries.
External power operating. When using the external power supply the battery levelindicator is replaced by the external power icon.

Stray Current Mapper-User Manual
Page 24
The Smart Interrupter connection cables can be replaced if they are damaged or do not fit a particularapplication. Remove the grey cover from the under side of the Smart Interrupter to expose theconnection cable grub screws. Loosen the grub screws and the cable glands that hold the connectioncables and pull the cables free.
RS232 connector (forRadiodetection use)
Grub screwcover
To change the outputcables removegrub screws
Battery cover

Stray Current Mapper-User Manual
Page 25
4.1.9 Activating the SCM SensorBar
Once the pipe has been located place the SCM SensorBar on the ground over the pipe at right anglesto the pipe with the red arrow pointing in the direction in which it is thought that the current is flowing.Do not activate the SCM SensorBar at this stage.
Connect the SCM SensorBar lead to the laptop computer. Ensure that the connectors mate correctlyand securely.
To activate the SCM SensorBar, press the green button on the SCM SensorBar until the SCMSensorBar emits a continuous ‘beep’. Release the green button and ensure that the red LED isilluminated. Once mapping is finished press the green button until the unit beeps and the red lightextinguishes.
Note: When connected to a laptop computer, and activated, the SCM SensorBar will stay active until itis manually switched off. If the SCM SensorBar is accidentally activated whilst disconnectedfrom a laptop computer it will automatically switch off after approximately 15 minutes to conserveSCM SensorBar battery life.
4.1.10 Using the SCM SensorBar Controller software
Setting up the application software
During software installation (see paragraph 3.1.5), a shortcut icon is automatically placed on thecomputer desktop. Click on the icon to start the program or, alternatively, open the directory into whichyou installed the software and select SCM Setup; this will open the program.
The SCM Set-up software has three major functions:
� Configuring the SCM SensorBar� Viewing the vector data obtained by the SCM SensorBar (Locate Viewer)� Viewing the pipeline current information provided by the SCM SensorBar (Signal Viewer).

Stray Current Mapper-User Manual
Page 26
4.1.11 Configuring the SCM SensorBar
When configuring the SCM SensorBar refer to Figure 4.5.
Figure 4.5 SCM set-up screen
When the SCM SensorBar has been placed over the pipeline and activated, configure the SCMSensorBar as follows:
• Ensure the SCM Set-up screen is displayed on the laptop computer• Check that the display shows ‘Firmware version’ and ‘Serial Number’ of the SCM SensorBar. This
is a good indication that communication has been established between the laptop computer andthe SCM Bar as it is not readily apparent from other parts of the screen. This information is alsouseful if you need to contact Radiodetection with a query.
Figure 4.6 SensorBar details
• To select current measurement, place the cursor over the ‘Measure Current’ tick box and pressand release the left mouse button. A tick appears in the box
Figure 4.7 Current Measurement check box

Stray Current Mapper-User Manual
Page 27
• To select voltage measurement, place the cursor over the ‘Measure Voltage’ tick box and pressand release the left mouse button. A tick appears in the box
Figure 4.8 Voltage measurement check box
Although both current and voltage can be measured at the same time, It is only possible to displayone of them a time. If both tick boxes are selected you will be prompted to select which one youwant to display.
• Tick the ‘Measure Voltage’ tick box only if you are going to measure voltage. If this box is ticked,the ‘High Voltage Sensor’, ‘Low Voltage Sensor’, and ‘Voltage Filename’ boxes become enabled.
• Tick the ‘High Voltage Sensor’ or ‘Low Voltage Sensor’ as appropriate. The low voltage input hasa voltage range of +/- 9.5V and is used when measuring pipe-to-soil voltage potentials. The highvoltage input has an input range of up to 250V RMS.
• Enter a ‘Voltage Filename’ and ‘Description’ as explained below.
If you are logging data, it is advisable to include a description of a particular logging operation. To dothis:
• Enter a filename into the ‘Current Filename’ or ‘Voltage Filename’ box• Click the ‘Description’ button. A dialogue box opens as shown in Figure 4.9• Enter details (optional) of the site or any information that you may wish to refer to later. Information
could include such things as- Position and orientation of the SCM SensorBar- Details of other services in the vicinity- Details of nearby roads, railways, and anything else that may assist you when analysing
the data.• Press ‘Save Description’.
Figure 4.9 Current and Voltage Description screen

Stray Current Mapper-User Manual
Page 28
• Click the Imperial (feet and inches)or metric radio button to select measurement units. Themeasurement units can be changed at any time without interrupting the mapping process.
Figure 4.10 Measurement units screen
• If a Smart interrupter is connected into the system click the ‘Interrupter connected in system’ tick box.
Figure 4.11 Smart Interrupter check box
Note: If a Smart Interrupter is connected into the system, the SCM software will automaticallycalculate the depth and enter ‘Depth of pipe/cable’. The ‘depth of pipe/cable’ box will turngrey. If an interrupter is not connected, for example when performing dynamic stray currentsurveys, the ‘Depth of pipe/cable’ box will turn white, allowing you to enter the depthmanually. The depth can be obtained by using a PCM or other locator that measures depth.
The ‘Data log settings’ enable you to define the data logging start time and duration. Press‘SmartMedia Files’ to interrogate the SmartMedia card (if one is fitted) to determine if any log filesalready exist on the card. The ‘Current date’ and ‘Current time’ show actual time and date. They areadjusted through Windows by opening ‘Control Panel’, and selecting ‘Date/Time’.
The ‘Start Logging’ and ‘Stop Logging’ buttons control the timing of the logging process. Once the‘Start Logging’ button is pressed, the ‘Start Logging’ button and ‘Duration’ box are disabled to preventfurther changes from being made and the ’Stop logging’ button becomes enabled. The loggingprocess stops automatically at the end of the duration period. Logging can be stopped at any time bypressing the ‘Stop Logging’ button but cannot be stopped by switching off the SCM SensorBar.
Figure 4.12 Data log settings

Stray Current Mapper-User Manual
Page 29
When the ‘’SmartMedia Files ’ button is pressed the following dialogue box is displayed.
Figure 4.13 SmartMedia Files
Note: If a SmartMedia card is not fitted, a dialogue box will open stating ’SmartMedia card not fitted’.
• Ensure that a SmartMedia card is fitted.
The currently saved files can be deleted one at a time by highlighting the file name and pressing the‘Delete Selected File’ button. All files can be deleted by pressing the ‘Delete ALL Files’ button.
The screen shows the available space on the SmartMedia card and updates the display as files aredeleted. When all changes have been made, press ‘OK’ to return the display to the Set-up menu.SmartMedia cards are available with 4 Mb, 8 Mb, 16 Mb, and 32 Mb capacity. Storage capabilities forthe cards are:
4 Mb—18 hours worth of data 8 MB—36 hours worth of data16 Mb—72 hours worth of data32 Mb—144 hours worth of data
The lower part of the Set-up screen shows the following buttons:
Figure 4.14 Application buttons
Stray Current Mapper-User Manual
Page 30
About screen
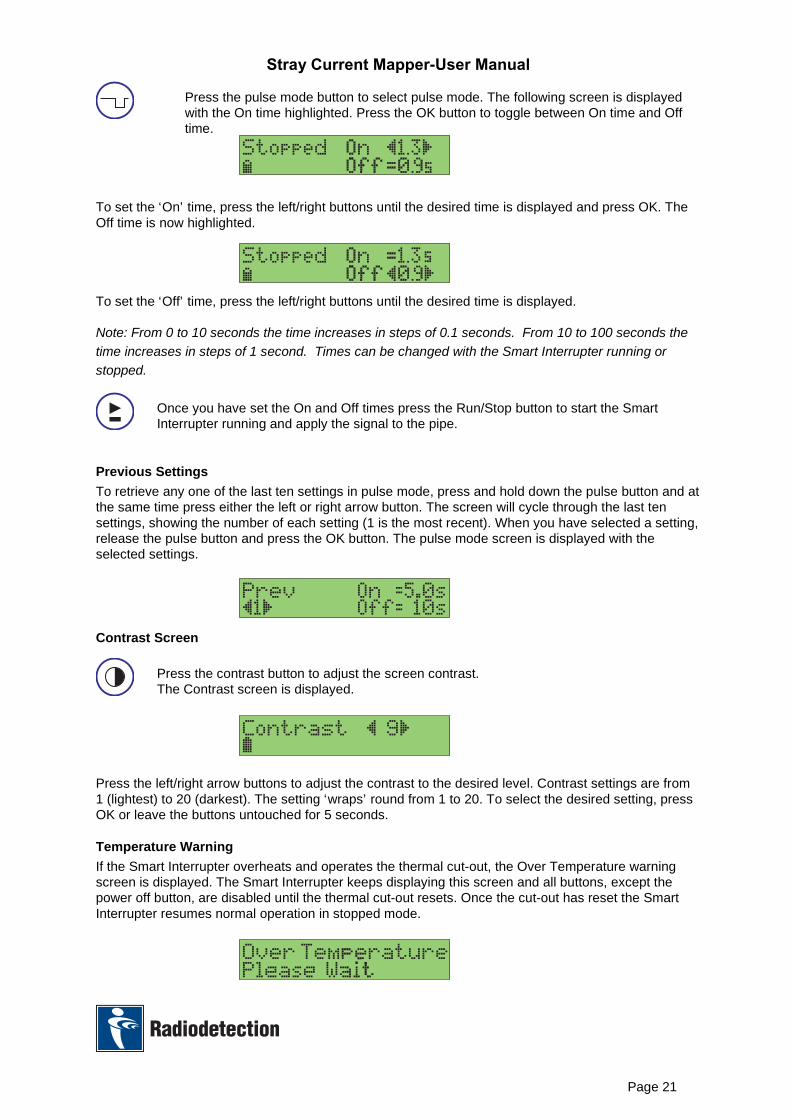
To access the ‘About SCM’ screen press the ‘About’ button. The About SCM screen is displayed andshows the Version No, Creation Date, and Creation Time for the SCM Controller software . Quote thisinformation whenever you contact Radiodetection Technical Support.
Figure 4.15 About SCM screen
Locate Viewer (viewing vector data)
Selecting ‘Locate Viewer’ displays the ‘Locate Viewer’ screen.
The Locate Viewer indicates if field distortion is present on a pipe. The four lines represent themagnitude and direction of signal from the four SCM SensorBar magnetometers. On a good location,the lines converge at the bottom of the screen into a ‘V’ shape as shown in the first example below. Inthe second example shown below, the field is being distorted (possibly by a stronger signal fromanother adjoining, large current carrying, pipeline) indicating that the SmartProbe should be used inplace of the SCM SensorBar.

Stray Current Mapper-User Manual
Page 31
The figures at the top of the screen show:
• Depth of pipeline• Offset of the SCM SensorBar or SmartProbe from the top dead centre of the pipeline• Current• Accuracy
The software calculates the readings from the four magnetometers and displays the averaged results.
Figure 4.16 Locate Viewer screens
The figures at the bottom of the screen are for Radiodetection use only and can be ignored.
Use the ‘Interrupter ID’ field to select the same code as that selected on the Smart Interrupter.
Interrupter ID
• Press the + or – button to increase or decrease the ID by one.
Re-Start
• Press the ‘Re-Start’ button to re-initialise another reading.
Adjust Scaling
Adjusting the scaling enables you to read the diagram more clearly. Measurements represent metres.It is not possible to alter the format to read Imperial (feet and inches) measurement units.
• Press the ‘Adjust Scaling’ button to open the dialogue box as shown below.
Figure 4.17 Scaling and extents screen
When the figures are changed, pressing the OK button re-draws the vectors and returns the display tothe Locate Viewer screen.
Press the ‘Exit’ button on the ‘Locate Viewer’ screen to return to the SCM Set-up screen.
Press the ‘Exit’ button on the SCM set-up screen to exit the program.

Stray Current Mapper-User Manual
Page 32
Signal Viewer (viewing pipeline current information)
Pressing the ‘Signal Viewer’ button transmits the entered settings to the SCM SensorBar orSmartProbe and the Signal Viewer screen is displayed.
Note: It may take a few seconds for this screen to appear.
Figure 4.18 Signal Viewer screen
There are several control areas on the screen. The controls (Signal Trace Controls) on the right-handedge of the display are used to adjust how the signal data is presented. The Signal trace controls aredescribed below.
The ‘Locate Info’ fields shown in the bottom left hand corner of the display show the results of thecurrent locate data and are described later.
Signal Trace Controls
The signal trace controls are shown opposite.Starting from the bottom of the control panel,there are four distinct groups:
• Grid and ruler controls• DC controls• Gain controls• Signal measurements.
Grid and ruler Controls
The grid controls consist of two buttons labelled ‘Grid’ and ‘Ruler’.
The grid control displays (or removes) a grid, enabling precise interpretation of the signal whenanalysing measurements. By default, the grid is not displayed.
When selected, the ruler control places a graduated horizontal ruler through the centre of the signaldisplay area. By default, the ruler is always drawn.
Both of these controls operate in a toggling manner, placing/removing the grid/ruler as appropriate.

Stray Current Mapper-User Manual
Page 33
DC Controls
The DC controls allow the zero reference for the signal to be placed anywhere on the screen. Threebuttons are provided for this. Pressing the ‘Zero’ button causes the zero reference to be aligned withthe horizontal ruler in the centre of the display area. Pressing the ‘+’ and ‘-‘ buttons allow the referenceto be adjusted up or down the screen as required. The DC should be zeroed at the beginning of thesurvey and further adjusted as required.
Gain Controls
Buttons are provided for increasing (‘+’) and decreasing (‘-‘) the height of the displayed waveform.Each press adjusts the gain by a factor of two. The current gain setting is shown at the top of the panel(underneath the top ‘Y’ graphic) and is always displayed.
Signal Measurements
The top three fields of the panel are active when cursors are placed on the signal area. The top field isthe gain interval as already described. The second field (under the delta Y graphic, second from thetop) is used when both measurement cursors are in use, and shows the difference in Milliampsbetween the two-cursor positions. The third field is used when a direct connect voltage sensor is inuse, and shows the voltage level of the lower cursor. Cursors are described later in this section
Locate info
Location information is displayed in a Results panel as shown below.
Figure 4.19 Locate information screens
Note: The depth, signal, offset, and direction fields are only valid when a Smart Interrupter is beingused to generate an SCM waveform or when using a SmartProbe. The use of a direct connectsensor invalidates the use of these fields.
Depth
This field shows the depth of the pipe from the base of the SCM SensorBar feet to the centre of thepipe and, when using a SmartProbe, the depth from the probe tip to the centre of the pipe.
Signal
This field shows the calculated signal current.
Stray Current Mapper-User Manual
Page 34
Offset
This field shows the offset of the pipe from the centre of the SCM SensorBar (i.e. the battery packhandle) or from the SmartProbe.
Positive values indicate that the pipe is to the right of the SCM SensorBar or SmartProbe when the redarrow on the SCM SensorBar or SmartProbe is pointing away from you.
Negative values indicate that the pipe is to the left of the SCM SensorBar when the red arrow on theSCM SensorBar is pointing away from you
Log Time
The log time field indicates logged time in hours and minutes. If data logging is not in progress thisfield will contain a zero value.
During logging, the elapsed log time appears as white text on a red background. The elapsed timestays at zero for the first minute of logging and then increments in steps of one minute.
Battery Status
This status indicator shows the calculated remaining charge left in the SCM SensorBar battery.
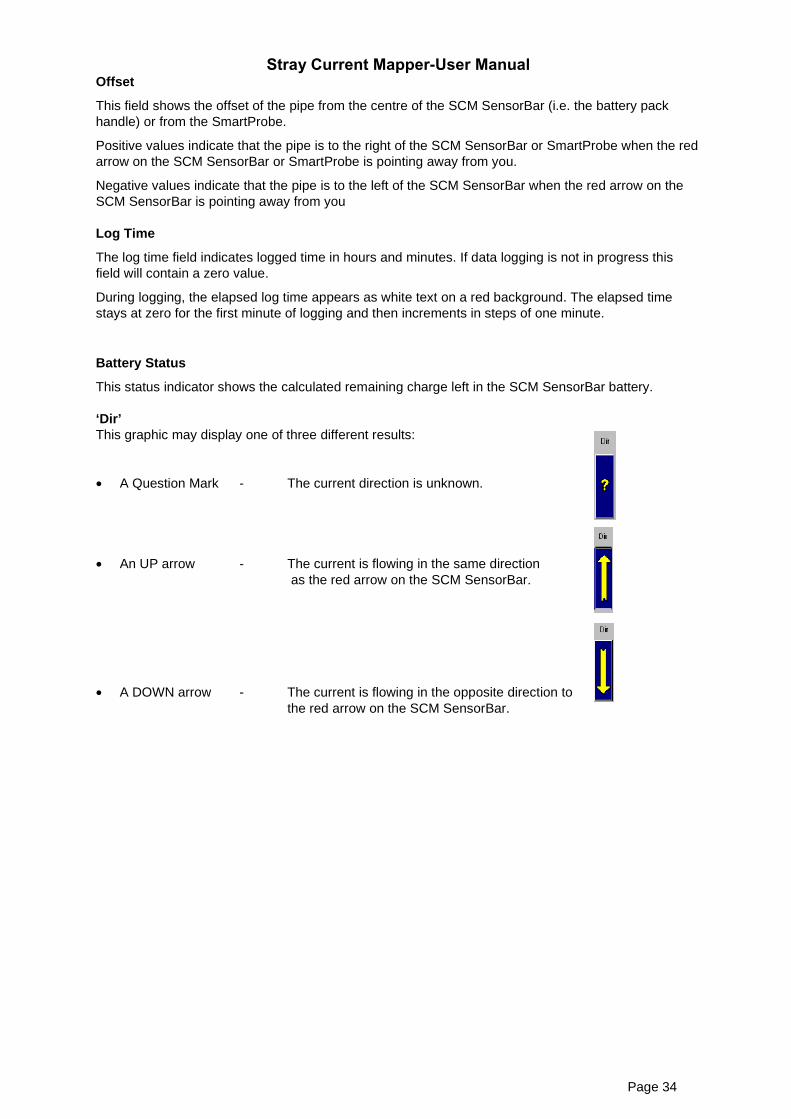
‘Dir’This graphic may display one of three different results:
• A Question Mark - The current direction is unknown.
• An UP arrow - The current is flowing in the same direction as the red arrow on the SCM SensorBar.
• A DOWN arrow - The current is flowing in the opposite direction tothe red arrow on the SCM SensorBar.

Stray Current Mapper-User Manual
Page 35
Time Base Control
The Time Base Control alters the current sampling frequency and adjusts the signal filtering to enablean appropriate waveform to be displayed for the time base selected. A short time base, such as 0.125seconds will produce a waveform with maximum resolution. A long time base will compress the traceon the screen. There are two buttons, one for increasing (‘+’) and one for decreasing (‘-‘) the timebase interval. The time base increases or decreases by a factor of two (for example, 0.125 seconds,0.25 seconds, and 0.5 seconds). There is no upper limit for the time base and the lower limit is 0.125seconds.
Figure 4.20 Time base control screen
Compass
The compass indicates in which direction the arrow on the SCM SensorBar is pointing relative tomagnetic north. This feature is particularly useful for establishing pipeline orientation, and for mappinga pipeline network.
Volume Control
The SCM SensorBar contains an audible beeper to act as a thief deterrent when the SCM SensorBaris in use and has three volume levels—low, high, and ‘off’. These levels are set using the ‘+; and ‘-‘buttons, which increase and decrease the volume level.
Figure 4.21 Volume controls
The volume levels are as follows:
0 = Sounder OFF1 = Sounder ON – low sound level2 = Sounder ON – high sound level
Interrupter ID
The Smart Interrupter control has two buttons to select the required interrupter signal identification(ID). The ‘+’ button increases the ID and the ‘-‘ button decreases it. Four Smart Interrupter waveformsare currently available, corresponding to ID’s in the range 0 to 3. It is important that the interrupter IDselected in the SCM SensorBar setup software matches the ID of the Smart Interrupter that isgenerating the signal that is being located.

Stray Current Mapper-User Manual
Page 36
Communications Status
There is a communication link status indicator at the top of the Signal Viewer screen. This indicateswhether a communication link has been established with the SCM SensorBar. If the link has beenestablished the status will be as shown.
Figure 4.22 Comms link OK screen
If there is no link, or the link fails, the ‘Comms Link’ status will change to that shown below
Figure 4.23 No Comms Link screen
Re-Start Facility
Once a SCM SensorBar has started detecting an interrupter signal a number of calculations arecontinually performed to generate the locate results. However, problems may occur if the SCMSensorBar is disturbed (e.g., by someone accidentally kicking it or if the SCM SensorBar needs to bere-positioned). Due to the averaging nature of the signal processing it may take a significant time forsuch disturbances to be ‘averaged out’. To overcome this problem, a ‘Re-Start’ button is provided.Press this button to reset the SCM SensorBar internal buffers and to re-start the locate process.Results will be obtained more quickly than waiting for the disturbances to be averaged out.
Close button
Select the ‘close button’ to return to the SCM Setup screen.
Real-Time Clock
A time display is located in the top right hand corner of the Signal Viewer screen but is notautomatically updated. Press the ‘Read Now’ button to read the real time clock in the SCM SensorBarand display the current date and time, as shown below.
Figure 4.24 Real-time clock screen
Measurement Cursors
The Signal Viewer screen has two measurement cursors that enable measurements to be calculatedfrom the data being displayed. To place the cursors on the signal area of the Signal Viewer move themouse into the signal display area and click the left mouse button. On the first click, a solid-linehorizontal cursor is drawn. Click the left mouse button a second time to add a second, dotted-linehorizontal cursor. If you click the mouse twice on the same area of the screen only one cursor will bevisible since the two cursors will be overlaid on top of each other. To see both cursors, move one ofthe cursors.
Move the cursors by positioning the mouse on the cursor to be moved, then press and hold the leftmouse button, and drag the cursor around the screen. When the cursor is in the new position releasethe left mouse button and the cursor will remain in the new position.

Stray Current Mapper-User Manual
Page 37
Note: The dotted cursor is always shown above the solid cursor. If you drag the dotted cursor belowthe solid cursor, the cursors will change position as soon as you release the left mouse button.
Figure 4.25 Screen Cursors
As you move the cursors around the screen, the values displayed in the ‘Signal Measurements’ controlpanel (to the right of the screen) will be updated.
Printer Support
The controller software does not currently have any in-built printer support for printing screen shots.However, it is possible to obtain printouts of the screens by performing the following actions:
a.) Move to the screen to be printedb.) If the displayed screen is either the Set-up Screen or the Locate Viewer screen, press
the <Alt> and <Print Screen> keys at the same timeIf the displayed screen is the Signal Viewer, press the <Ctrl> and <Print Screen> keysat the same time
c.) Open a new Windows application – WordPad. This is an application provided as part ofWindows. Select ‘Start’/programs/Accessories/WordPad.
d.) Once WordPad is open, press the <Ctrl> and <V> keys at the same time. Thecaptured screen image will now be copied into WordPad, from where you can print thescreen shot (with any comments that you may wish to add). The Print command is underthe ‘File’ menu in WordPad.
Note: The steps described in step (b) above are important. If the Signal Viewer screen is not capturedin the described manner, only a portion of the screen will be copied into WordPad.
When you capture a Signal Viewer screen image, the background behind the signal viewerscreen is also captured. You can remove this ‘clutter’ by means of a drawing package andselecting a ‘cropping’ tool, or an ‘eraser’. This does not happen with the Set-up screen or LocateViewer screens.

Stray Current Mapper-User Manual
Page 38
Datalogging
Reasons datalogging may be required
Use Datalogging when it is necessary to take readings over an extended period, or in areas of heavytraffic, where real-time analysis is not always practical. Data is logged onto a SmartMedia card, whichfits into the SCM SensorBar. The procedure is fully described in section 5.
Datalogging periods
The SCM is capable of datalogging for up to 36 hours with an 8 Mb card. The time of day whendatalogging is done will depend on individual circumstances such as when traffic is at its mostfrequent. When measuring dynamic current, such as that from electrified transport systems, it may bebetter to carry out the logging overnight or during different times of the day. Choose a time when thereis less vehicular traffic to cause interference and clutter up the display; this makes it is easier toanalyse the results.

Stray Current Mapper-User Manual
Page 39
5. DYNAMIC MEASUREMENT5.1 IntroductionWhy measure?
Dynamic currents, although transient, can be of high magnitude and put an unacceptable level of DCcurrent onto the pipeline.
Causes of dynamic stray current
Dynamic interference current comes from a number of sources. For example, it leaks off the rails ofelectrified transit systems to ground at points of rail insulation breakdown; it is caused by miningactivity, and by DC power systems.
5.2 Dynamic testing methodologyWhen performing dynamic stray current interference surveys, the Smart Interrupter is not used but it isnecessary to have at least two SCM SensorBars.
Use the SCM SensorBars as follows:
• Place one SCM SensorBar over the pipe near suspected current pick-up areas, and use it as areference. This SCM SensorBar is not moved during the survey.
• Place a second SCM SensorBar some distance away (but still over the pipe) and log the readings.• Move the second SCM SensorBar further along the pipeline and log the readings.• Use a similar procedure if you are using more than two SensorBars.
By using this method, current magnitude and direction can be determined.
The data collected over the data logging time is stored on ‘SmartMedia’ cards, which are placed in theSCM SensorBars before logging begins. After logging has finished, the cards are removed and put intoa SmartMedia adapter, which is then placed in the laptop computer and the files downloaded to beread by the SCM software.
5.3 PlanningWhen planning a dynamic survey the same principles apply as for static stray current surveys. Inaddition, it may be necessary to leave the equipment in place for some time. In this case, additionalplanning may be necessary to ensure that access rights are given, possibly for extended periods, andthat the equipment is secure, and that public safety issues are addressed.
5.4 SCM SensorBar set-upPosition and set-up the SCM SensorBar in the same way as for static current measurement. Beforeconnecting the SCM SensorBar to the laptop computer, insert a ‘SmartMedia’ card into the SCMSensorBar so that the logging results can be stored for later retrieval. When datalogging with morethan one SensorBar, insert a SmartMedia card into each SensorBar.
Insert a card as follows:
• Ensure the SensorBar is switched off.• Remove the battery pack by turning the two quick-release screws anti-clockwise a quarter of a turn• Lift off the battery pack.• Insert a SmartMedia card into the slot, ensuring that it faces in the correct direction as indicated on
the label attached next to the slot. Push the card down until you hear a click. This indicates that thecard is fully inserted.
• Replace the battery pack and tighten the two quick-release screws in a clockwise direction onequarter of a turn.

Stray Current Mapper-User Manual
Page 40
5.5 SmartProbe set-upThe SmartProbe is used in exactly the same way as for static stray current measurement and isconnected to the SCM SensorBar in the same way. The SmartProbe does not need a separateSmartMedia card as the SmartMedia card is placed in the accompanying SCM SensorBar.
5.6 Connecting the SCM SensorBar to the laptop computerConnect the SCM SensorBar in the same way as for static stray current measurement. When usingmore than one SCM SensorBar, connect and configure each SensorBar, one at a time. Once the SCMSensorBar has been configured through the software and the datalogging time has been set, it willremain switched on even when disconnected from the laptop computer. Once the SCM SensorBar hasbeen disconnected from the laptop computer, repeat the procedure for the next SCM SensorBar.
Note: When configuring more than one SCM SensorBar, ensure you configure them with the samecomputer to ensure they have the same time synchronization.
5.7 Switching off the SCM SensorBarsWhen datalogging has finished, the SCM SensorBars/SmartProbes are automatically switched off bythe software. During logging, it is not possible to switch off the SCM SensorBar by pressing the greenbutton. The ‘stop logging’ button must be pressed first and then the green button on the SCMSensorBar must be pressed. Do not switch off the SCM SensorBar by removing the battery, as data onthe SmartMedia card could be lost or corrupted.
Configure the SCM SensorBar using the SCM set-up screen as shown below:
Figure 5.1 SCM Set-up screen
The set-up is the same as for static interference measurement with the addition of setting the data logsettings.

Stray Current Mapper-User Manual
Page 41
Setting the logging duration
Once the SCM SensorBar has been activated and configured, but still connected to the laptopcomputer, set the ‘Start log time’ and ‘Duration’. Refer to the screen shot below:
Figure 5.2 Data log settings
• Ensure that the ‘Current date’ and ‘Current time’ are correct. If not, adjust them through Windows,Control Panel, Time/Date.
• Enter the ‘Start log time’. This is the time you want to start logging.• Set the ‘Duration’ period. The maximum duration of an 8 Mb SmartMedia card is approximately 36
hours but, realistically, a shorter time is normally entered. If more than 36 hours is entered, theSCM SensorBar will end the logging process if it detects that the SmartMedia card is almost full.
Data logging can be set to start up to 24 hours in advance. This could cause confusion whenspecifying the ‘Start logging’ to start at the current time and then taking a few seconds before pressingthe ‘Start Logging’ button. To overcome this problem, the following scheme has been implemented:
Any time that the SCM SensorBar sees as being less than two minutes in the past (to take account ofdelays in pressing the ‘Start Logging’ button) will be treated as the current time and data logging willstart immediately. Any time that is more than two minutes in the past is interpreted to mean a futurestart time.
The following is an example of how the scheme works:
Assume that the current time is 11:00 a.m. and the date is the 1st August. The start time is entered asthe current time, using the ‘Set To Current Time’ button. You then press the ‘Start Logging’ button aminute later (at 11:01). Data Logging starts immediately, since the time entered is less than twominutes in the past.
If the current time is 11:00 a.m. on the 1st August and the start time is set to 10:55 a.m., and the ‘StartLogging’ button is pressed the SCM SensorBar will interpret the time as a future start time. DataLogging will actually start at 10:55 on 2nd August.
If you forget to enter the logging duration, the following screen is displayed:
• Enter the logging duration.
• Press the ‘Start logging’ button. You will be prompted to enter a filename for the datalog. Thename should be entered as a text string consisting of 8 characters. No file extension should beentered as this is added automatically (as .lgf). The filename should conform to the DOS filenaming convention (punctuation-type characters should be avoided).

Stray Current Mapper-User Manual
Page 42
You will then be prompted to enter a file description as shown below. Use this to enter details of thesite and any other information that might help you when analysing the data. Press ‘Save Description’to save the information to the log file.
Figure 5.3 Set description for current file
Once the ‘Start logging’ button has been pressed it will turn grey and the ‘Stop Logging’ button willbecome enabled. It is not possible to switch off the SCM SensorBar once logging has started.If you have forgotten to fit a SmartMedia card to the SCM SensorBar, the following screen is displayed:
• Insert a SmartMedia card into the SCM SensorBar.
6. READING AND ANALYSING DATA
6.1 SmartMedia card removalEnsure datalogging has finished. When datalogging has finished, the software will automatically switchoff the SCM SensorBar and the red light on the SCM SensorBar will extinguish. If the red light is still onor you wish to manually stop data logging, switch off datalogging via the software. If you use any othermethod, data already on the SmartMedia card can be lost or corrupted. If the battery becomes flatduring data logging the software will switch off the SensorBar as if logging had finished normally. Thisensures that data already collected will not be lost.
Stray Current Mapper-User Manual
Page 43
SmartMedia card removal
To remove the SmartMedia card
• Ensure the SensorBar is switched off.• Remove the battery from the SCM SensorBar• Push down the raised arm next to the card. This releases the card and allows it to be removed• Lift the card from its slot, taking care not to damage the card.
Fitting the SmartMedia card into the laptop computer
To enable the card to be inserted into the laptop computer the laptop computer must have aSmartMedia adapter, available from computer supply stores. There are two versions of adaptercurrently available:
• Floppy drive version (this fits into a floppy drive in the same way as a normal floppy disk).• PCMCIA version. This is for laptop computers only.
Follow the manufacturer’s guide for instructions on how to install the adapter and fit a SmartMediacard into the adapter.
Before viewing the log files it is good practice to copy them to a directory on the laptop computer harddrive. Do this for all SmartMedia files that you wish to read. To copy files to the hard drive proceed asfollows:
• Ensure that the SmartMedia card adapter is fitted to the laptop computer and a SmartMedia card isfitted in the adapter.
• Open Windows Explorer• Make a new directory and give it a meaningful name.• Under ‘Folders’ click on the drive letter that contains the SmartMedia card files.• Select the files that you wish to save, select ‘copy’, and ‘paste’ them into the new directory.
6.2 Reading the DatalogSmartMedia cards are read using the Data Viewer Software. When the application software isinstalled, an icon, titled ‘SCMViewLog’, is automatically placed on the laptop computer desktop. Toopen the program, click the icon.
6.2.1 Data Log Files
Each data file from the SCM SensorBar has a time stamp to enable it to be time-aligned with otherdata files captured during the same session.
In addition, each data file also has its own header block that is saved when the log is started and inwhich miscellaneous information is stored, such as comments describing the location where the datawas captured, locate information, depth of the pipe, and offset.

Stray Current Mapper-User Manual
Page 44
6.3 Using the viewer
6.3.1 Introduction
The basic viewing screen comprises a menu bar at the top of the screen, a number of ‘dockable’toolbars, and the data view area itself, where the data is displayed. At the bottom of the data area is ahorizontal scroll bar, which is used to indicate the approximate position of the displayed data in relationto the complete data log. Behind the scroll bar is a compressed trace of the whole of the data logenabling an ‘at a glance’ view of the nature of the log file(s). This overview trace is based, initially, onthe first file listed in the session. It may be changed subsequently by editing the session control file (viaa dialogue box).
Figure 6.1 Data Viewer screenOnce data is present on the screen, it can be manipulated in a number of ways. The cursor is the mainway of handling the data, supported by the toolbars and the menu bar.
Help information is available under the Help Sub-menu to provide assistance in using the moreinvolved features and those features that are rarely used.

Stray Current Mapper-User Manual
Page 45
6.3.2 SCM Data Viewer
To open the program, click the SCM_Viewlog.exe icon on the desktop.When the Data Viewer program is opened the following screen is displayed.
Figure 6.2 SCM Data Viewer screen
6.3.3 Creating A Session
General overview
Before the data viewer can read the data files they must be put into a ‘session’. The data viewersoftware has the ability to view up to 16 sets of data simultaneously. Data files can be read straightfrom a SmartMedia card or from data files that have already been copied to the computer hard disk.(See para 6.1 for information on how to save data files to the computer hard disk.) New sessions canbe created or previously created sessions that have been saved can be opened. Once a session hasbeen created and the required files have been added, the files are opened, and their data displayed onthe screen, using a different colour for each trace. The ‘session’ and its files can be saved to the harddisk and simplifies future accessing of the data. Instead of selecting each file in turn, the session file isopened, resulting in the files listed previously being opened and displayed. Facilities exist to edit thesession (e.g. adding and removing data files).
To create a new session select ‘New Session’ option on the File drop-down menu, as shown below
Figure 6.3 Create session screen
This results in a ‘Create A New Session’ dialogue box being opened as shown below.

Stray Current Mapper-User Manual
Page 46
Figure 6.4 Create a new session screen
Note: Session file names end with the extension .vsc. This extension is automatically added when youcreate a session file.
To create a new session proceed as follows:
• Click Session Name. A Windows open dialogue box is opened as shown below:
• Browse through the directories and find the one that contains the log files that were copiedpreviously. If you have not made a directory, make one now. It is a good idea to store all sessionfiles and log files in one directory for easy recall at a later date.
• Open the directory• In the ‘File name’ box, type in the name you wish to call the session file• Click ‘Open’. The session name and directory path are displayed in the Session Name dialogue box.
This has created a new session. To add files to the session proceed as follows:
• Press the ‘Browse For Log Files’ button. Choose the directory to which you have already copiedthe data log files from the SmartMedia cards or, if you are entering files directly from theSmartMedia cards, select the drive letter to which the SmartMedia card is attached
• Double click each file or select the file (s) to be added by highlighting them and then click open.
Note: Data files end with the extension .lgf. This extension is automatically added when the file iscreated.

Stray Current Mapper-User Manual
Page 47
An example of a session with files added is shown below
To remove a file from a session highlight the file name and click the 'Remove Log File(s)’ button. If afile is removed it is only removed from the session and is not deleted. Files that have been removedfrom a session can be added later.
Once all files have been added, click the OK button. The data from the files will be displayed as shownin Figure 6.5.
There are two ways to open a previously created session, either select ‘File’ from the main menu andselect ‘Open Session’ or click on the ‘Open Session’ button, which is located on the toolbar. Thedirectory in which the session was saved is displayed. Choose the session to be opened from the listof session files.
Instructions for saving sessions are described later.
6.4 Displaying Multiple FilesWhere two or more files are displayed, they will automatically be displayed using time-alignment.Switch off this feature by using the disable feature under the Configuration Sub-menu. If any of thefiles do not contain any time-alignment data, a warning message is displayed.Fig 6.5 shows a session containing four data log files with time alignment enabled. The four tracesoccupy distinct time slots, which do not overlap.
Figure 6.5 Four Traces Time –alignment traces

Stray Current Mapper-User Manual
Page 48
Fig 6.6 shows the same four traces, but this time with time-alignment disabled. In this case, the fourtraces overlap, since they all begin with the same time origin. Also shown are two cursors, which maybe used to take measurements from the data displayed. Each cursor has a horizontal and a verticalcomponent.
The status line at the bottom of the screen shows the start and stop times for the section of trace(s)displayed, and the positions of each cursor, as well as the difference in milliamps between the twocursor positions. The use of the cursors is dealt with more fully in section 6.5.4.
Figure 6.6 Four Traces with Time-alignment disabled.
6.5 ToolbarsFour ‘dockable’ toolbars allow easy access to commonly used features. These toolbars provide alogical user interface, as described in the following sections. The toolbars can be placed anywhere onthe screen. To move a toolbar, place the mouse pointer over the toolbar (but not on a button), holddown the left mouse button, and drag the toolbar to the required position. Release the mouse button toplace the toolbar at its new position.
To activate a toolbar button place the mouse pointer over the button and click the left mouse button.
File handlingtoolbar
Horizontal datadisplacementtoolbar
Verticaldisplacementtoolbar
Datameasurementtoolbar
Cursors
Status line

Stray Current Mapper-User Manual
Page 49
6.5.1 File Handling Toolbar
The File handling Toolbar is shown below.
Each toolbar button is described below, moving from left to right.
Open Session
Displays a browser that enables you to select the session to be opened.
Save Session
Allows any changes made to the current session to be saved in the session control file(irrespective of the state of the ‘Save On Exit’ flag in the Configuration sub-menu).
Print File
Prints the currently displayed data if a printer is attached to the laptop computer.
Properties
Displays the Trace Properties dialogue box. This provides additional information about eachtrace: the depth and offset of the pipe/cable, the descriptive text describing the site, as wellas time-alignment and DC level information.
Figure 6.7 Trace properties

Stray Current Mapper-User Manual
Page 50
The DC Level and time-alignment fields may be edited to manually adjust the position of the selectedtrace with respect to the other traces contained within the given session. The DC Level may beremoved by selecting the ‘Remove DC’ checkbox. Removing DC offset brings the traces closertogether so they can be more easily compared.
To remove the DC offset from a trace do the following
• Select the required trace from the toolbar or with the trace button• Click Trace on the menu• Click properties• Click the remove DC check box• Click Next or Previous to select another trace• Click OK when finished.
Similarly, the selected trace may be made invisible by clearing the ‘Trace Visible’ checkbox. Thisfeature is useful when a session contains many traces, and improves visibility when analysing traces inturn. The ‘Next’ and ‘Previous’ buttons display the properties of the next and previous tracesrespectively. Click ‘OK’ to close the dialogue box.
About
Displays the Viewer application revision information. This information is used primarilywhen Radiodetection support is required.
Figure 6.8 About screen
Note: This information will not be the same as that shown on the SCM Setup ‘About’ screen as theapplications are separate and may be revised individually.
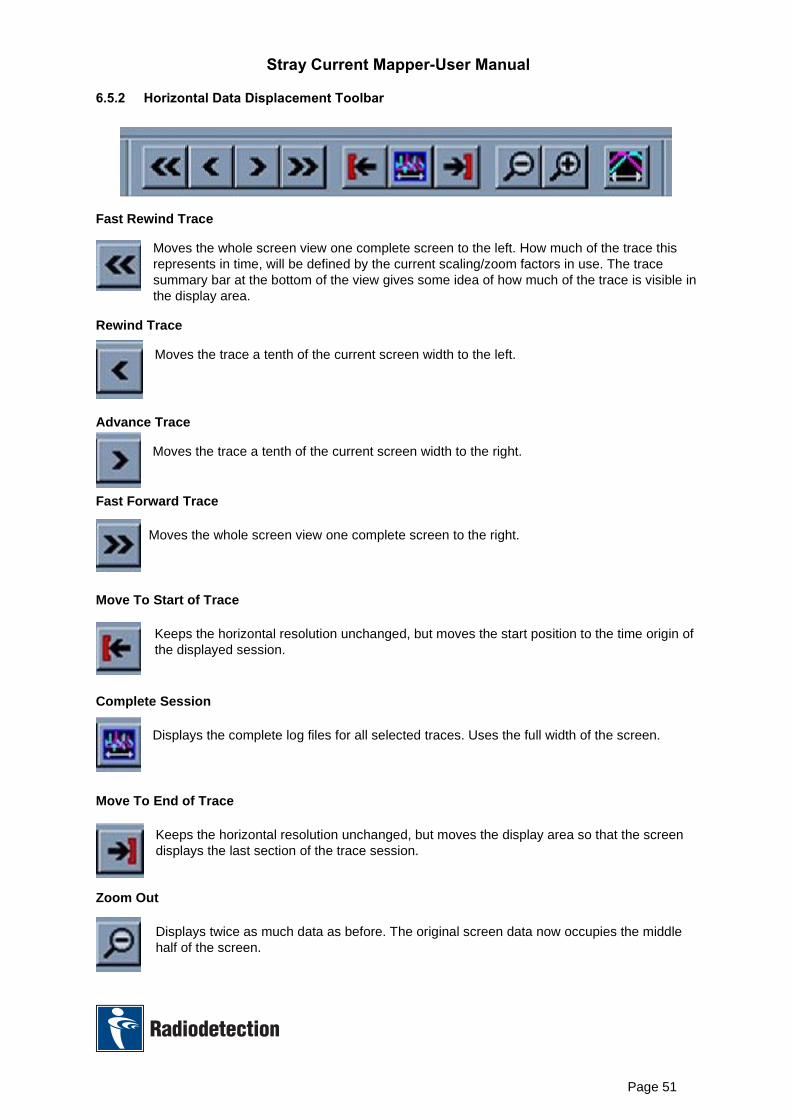
Stray Current Mapper-User Manual
Page 51
6.5.2 Horizontal Data Displacement Toolbar
Fast Rewind Trace
Moves the whole screen view one complete screen to the left. How much of the trace thisrepresents in time, will be defined by the current scaling/zoom factors in use. The tracesummary bar at the bottom of the view gives some idea of how much of the trace is visible inthe display area.
Rewind Trace
Moves the trace a tenth of the current screen width to the left.
Advance Trace
Moves the trace a tenth of the current screen width to the right.
Fast Forward Trace
Moves the whole screen view one complete screen to the right.
Move To Start of Trace
Keeps the horizontal resolution unchanged, but moves the start position to the time origin ofthe displayed session.
Complete Session
Displays the complete log files for all selected traces. Uses the full width of the screen.
Move To End of Trace
Keeps the horizontal resolution unchanged, but moves the display area so that the screendisplays the last section of the trace session.
Zoom Out
Displays twice as much data as before. The original screen data now occupies the middlehalf of the screen.

Stray Current Mapper-User Manual
Page 52
Zoom In
Causes the trace to be expanded by a factor of 2 about the centre of the trace, so that thetrace occupies the full screen width. Alternatively, hold down the left mouse button, drag themouse pointer across the trace, and then release the button.
Manually Align Trace(s)
This is a two-state button which enables/disables traces to be manually aligned. Click thebutton to allow manual alignment whilst the button is depressed (in a similar manner to thebold/italic font buttons in word processor packages). When enabled, the selected trace maybe manually move using the left and right arrows on the horizontal scrollbar. Alignmentadjustments can be saved in the session control file. To revert to normal scrolling along thetime axis, release the ‘Manual Alignment’ button.
Note: The button is only enabled if a trace is selected and cursors have been placed on thescreen.
6.5.3 Vertical Data Displacement ToolbarThe Vertical Data Displacement Toolbar is shown below
Adjust the magnitude of the signal data by using the following toolbar buttons. In addition, to enablefine adjustment of data, the small increment/decrement buttons may be used whilst holding down theshift key.
Small Gain Decrement
Each button click decreases the size of each selected trace by a small amount. If you holdthe shift key down whilst clicking the button, a much smaller decrement is applied to allow forfine-tuning between traces.
Large Gain Decrement
Each button click decreases the size of each selected trace by a larger amount than thesmall gain button. If you hold the shift key down whilst clicking the button, a much smallerdecrement is applied to allow for fine-tuning between traces.
Small Gain Increment
Each button click increases the size of each selected trace by a small amount. If the shiftkey is held down whilst clicking the button, a much smaller increase is applied to allow forfine-tuning between traces.

Stray Current Mapper-User Manual
Page 53
Large Gain Increment
Each button click increases the size of each selected trace by a larger amount than thesmall increment button. If you hold the shift key down whilst clicking the button, a muchsmaller increase is applied to allow for fine-tuning between traces.
Auto-Scale Button
Re-scales the displayed trace. This gives the maximum signal magnitude possible,according to the amount of screen space available for each trace, as well as making use ofthe maximum screen height available.
Remove DC Offset
Centralises the display on the screen for easier viewing.
6.5.4 Data Measurement Toolbar
The Data Measurement Toolbar is shown below
In general, most measurements are obtained by using the measurement cursors and the co-ordinatefields located at the bottom of the screen. The following buttons provide additional features that fallwithin the general category of measurement features.
Current trace selection
A drop-down menu allows specific traces to be selected. This feature is used to correlatetraces, and to manually align traces in time, as well as horizontal displacements. All tracesmay be selected. The button is coloured with the currently selected trace. If all traces areselected, the button is given a black background and the word ‘ALL’ is displayed in white.

Stray Current Mapper-User Manual
Page 54
Cursors
Two measurement cursors are available and are brought onto the display by double-clicking the leftmouse button. To move a cursor, click and hold the left mouse button and drag the cursor around thescreen or click the button on the toolbar as described below.
For a full explanation of using the measurement cursors refer to section 6.7.
Reposition Cursor 1 Vertical
Allows the vertical cursor of the first measurement cursor (solid line) to be re-positioned. Toselect the cursor place the mouse pointer on the cursor and hold down the left mouse button.The solid vertical cursor automatically starts to follow the mouse around the screen (whilst itis in the trace display area). Click the left mouse button to position the vertical cursor at thecurrent mouse pointer position.
Reposition Cursor 1 Horizontal
Allows the horizontal cursor of the first measurement cursor (solid line) to be re-positioned.To select the cursor place the mouse pointer on the cursor and hold down the left mousebutton. The solid horizontal cursor automatically starts to follow the mouse around thescreen (whilst it is in the trace display area). Click the left mouse button to position thehorizontal cursor at the current mouse pointer position.
Reposition Cursor 2 Vertical
Allows the vertical cursor of the second cursor (dotted line) to be re-positioned.To select the cursor place the mouse pointer on the cursor and hold down the left mousebutton. The dotted vertical cursor automatically starts to follow the mouse around the screen(whilst it is in the trace display area). Click the left mouse button to position the vertical cursorat the current mouse pointer position.
Reposition Cursor 2 Horizontal
Allows the horizontal cursor of the second cursor (dotted line) to be re-positioned.To select the cursor place the mouse pointer on the cursor and hold down the left mousebutton. The dotted vertical cursor automatically starts to follow the mouse around the screen(whilst it is in the trace display area). Click the left mouse button to position the vertical cursorat the current mouse pointer position.
Fit To Cursors
Displays the section of traces between the cursors across the whole of the display area. Thetime scale updates accordingly.

Stray Current Mapper-User Manual
Page 55
Correlate Trace
Allows two selected traces to be correlated. Select the Correlate button to display the followingdialogue box. The second trace selected will be compared with reference to the first trace.
Figure 6.9 Correlate traces
When correlating two traces the traces must both be either current measurement or both traces mustbe voltage measurement. The purpose of correlating two traces is to check if both waveforms aresimilar in appearance, and is done by showing the similarity in percentage.
• A positive 100% similarity indicates that the traces have exactly the same shape• 0% indicates that the traces have no similar features• A minus 100% correlate indicates that the traces have the same shape but are inverted from each
other, showing that the current is travelling in different directions, possibly because of a pick-up ordischarge of stray current.
Dissimilar waveforms indicate that the current is not coming from the same source.
• A negative correlate indicates that there is stray current being picked up or discharged at a pointbetween the two Sensorbars
• A large positive result indicates that the stray current is in the same direction under both bars. Theautomatic dynamic current calculation function can then be used to determine the change incurrent between the two SensorBars
It is important to note that correlation will not show whether the stray current is being picked up at thatpoint or if it is being discharged.

Stray Current Mapper-User Manual
Page 56
Click the Correlate button to display the Correlation percentage as shown in the screen below.
Figure 6.10 Correlate traces result screen
Remove Drift
Compensates traces for clock drift. This feature is particularly useful when traces represent along data-logging interval, and slight variations between SCM SensorBar start times maybecome noticeable.
Figure 6.11 Drift Removal screen

Stray Current Mapper-User Manual
Page 57
Difference Trace (Subtraction)
Subtracts one trace from another and displays the result as an additional trace. Only twotraces may be selected, the second trace being subtracted from the first.
Figure 6.12 Difference trace screen
Unprotected Pipe Detection
When measuring voltage you can enter a voltage below which you consider the pipe to beunprotected. Clicking this button causes the following dialogue box to open:
Figure 6.13 Unprotected pipe detection screen

Stray Current Mapper-User Manual
Page 58
When you have entered the threshold level and clicked the OK button, a box opens giving thepercentage of time that the pipe was un-protected during the logging period. This information is usefulin determining if stray current from an electric rail, for example, is of any real concern.
Figure 6.14 Unprotected pipe detection result screen
Automated Dynamic Current Calculation
This function enables you to compare the stray current percentage between two traces whenSensorBars are placed over different sections of a pipe. To select the Reference trace, clickthe Reference Trace button and select the trace to be used as the reference. Click the Testtrace button to select the trace you wish to test. The result is always given for the test tracein relation to the reference trace.
Figure 6.15 Automated dynamic-current calculation screen
Clicking OK produces the following result dialogue box
Figure 6.16 Automated dynamic current calculation result screen
• A value of 100% indicates that there is no current loss between the reference SensorBar and thetest SensorBar
• A value of, for example, 90% indicates that 10% of the dynamic stray current has been lostbetween the two Sensorbars. By re-positioning the SensorBars and taking further readings thearea of stray current change on the pipeline can be found.

Stray Current Mapper-User Manual
Page 59
Note: A value of greeter than 100% indicates that there is more stray current on the test trace than thereference trace.
6.6 Menu
6.6.1 File Sub-menu
Figure 6.17 View log file screen
The ‘File’ menu comprises five sections. The first deals with the opening and closing of ‘sessions’. Thesecond provides an Export function to enable you to export trace data to a spreadsheet for additionalanalysis. The third section provides printer support, whilst the fourth section provides a quick means ofopening a recently viewed session. Up to eight ‘recent’ sessions may be opened in this way. Suchshortcuts avoid you having to use the browser in the ‘Open Session’ function. The final sectionprovides an ‘Exit’ function for closing the application.
The various functions, except for the ‘shortcuts’ (described above) are explained in the followingsections.
New Session
Creates a new session. A dialogue box/browser allows you to define the data files that are to beassociated with the session being created. See paragraph 6.3.3 for details of creating a new session.
Open Session
Opens an existing session. All data files associated with the session are opened and displayed on thescreen, using the settings that are currently defined within the session.
Close Session
The currently selected session, and its associated data files, is closed.
Save Session
Saves all changes made to the current session in the session’s control file.
Export Data
This feature enables data from the Viewer to be transferred to a third-party spreadsheet package. Thegenerated file is suitable for importing into the commonly used spreadsheet packages available (forexample, Microsoft Excel, and Lotus 1-2-3).

Stray Current Mapper-User Manual
Page 60
In order to ensure that the maximum capabilities of the spreadsheet (for example, the number of rowsin particular) are not exceeded, several options are provided to control the amount of data that isexported, and how it is compressed. The options are described in the following sections.
• Select the data to be exported by using the cursors to define the start and end of the data ofinterest and select ‘Export Data’ from the File menu. The Specify Data Delimiters For Exportdialogue box opens.
Figure 6.19 Specify Data Delimiters For export screen
Select Delimiters
This option determines how the columns of data will be separated when the data is exported to thespreadsheet. Click a radio button to select how you want the columns to appear.
Sampling Method
Raw Data
This option exports every available data sample within the range bounded by the current screen,without compressing the data in any way. If the number of available samples is greater than thenumber of samples that the spreadsheet can handle, the spreadsheet will accept data until it is fullthen stop accepting data. You can manually enter the number of samples handled by the spreadsheet;the default being no limit (all samples are exported).
Averaged Data
This option is used when more data samples are to be exported than a spreadsheet can handle. If youselect this option, the data viewer software scales the samples to produce a moving average of thesamples before exporting the data. If the number of samples to be exported is less than the numberthat the spreadsheet can cope with all samples are exported.
Decimated Data
Use this option when more data samples are to be exported than the spreadsheet can handle. In thisinstance the sample set is decimated, to give every ‘nth’ sample (user specified), to reduce thenumber of samples to a value that the spreadsheet can handle. If the number of samples to beexported is less than the number that the spreadsheet can cope with, all samples are exported.

Stray Current Mapper-User Manual
Page 61
Saving and reading the data
• Once you have set the delimiters and the method of export click OK. The ‘Open’ dialogue box isdisplayed, allowing you to choose a directory to save the data in. Choose the directory and givethe file a meaningful name
• Open the spreadsheet package and open the file. The data file will be displayed.• Use the spreadsheet functions to manipulate the data as required.
Print File
Print a hardcopy version of the data currently being viewed on the display.
Print Preview
Select this option to preview the data that is about to be printed, to ensure that there are no formattingproblems.
Print Set-up
Select this option to select and configure the printer that is to be used.
Last ‘n’ Opened Files (‘Shortcuts’)
A list of the last ‘n’ sessions that have been viewed is maintained to simplify the process of re-openinga session, without having to browse the directory structure. Up to 8 files can be displayed in this way.The number of files in the list is selected through the configuration menu.
Exit
Select to close the application. Changes made to the session are only saved if the ‘Save On Exit’option is enabled (see Configuration Sub-menu).
6.6.2 View Sub-menu
The options in this menu enable the toolbars (described in section 6.5) to be displayed or hidden asrequired. The toolbars are visible when their menu entries have a tick alongside them.
Figure 6.18 View sub-menu

Stray Current Mapper-User Manual
Page 62
Toolbar
Display or hide the File Toolbar.
Position Bar
Display or hide the Horizontal Position Toolbar.
Gain Bar
Display or hide the Gain Control Toolbar.
Selector BarDisplay or hide the Measurement Control Toolbar.
Overlap traces
This feature controls the way in which the traces are displayed. If you select overlap mode, all of thetraces in the session are superimposed on top of each other and make use of the whole signal displayarea, as shown in Fig 6.20.
Figure 6.20 View traces with overlap selected

Stray Current Mapper-User Manual
Page 63
If overlap mode is deselected, the traces are separated out into their own signal windows, as shown inFig 6.21. In this mode, the signal area is reduced in headroom depending upon the number of tracesbeing displayed.
Figure 6.21 View traces with overlap deselected
6.6.3 Configuration Sub-menu
The following options allow you to configure the viewer to your own preferences.
Figure 6.22 Configuration sub-menu
Edit Session
This option presents you with a list of the data files that are in the current session. You can add orremove files from the session as required.
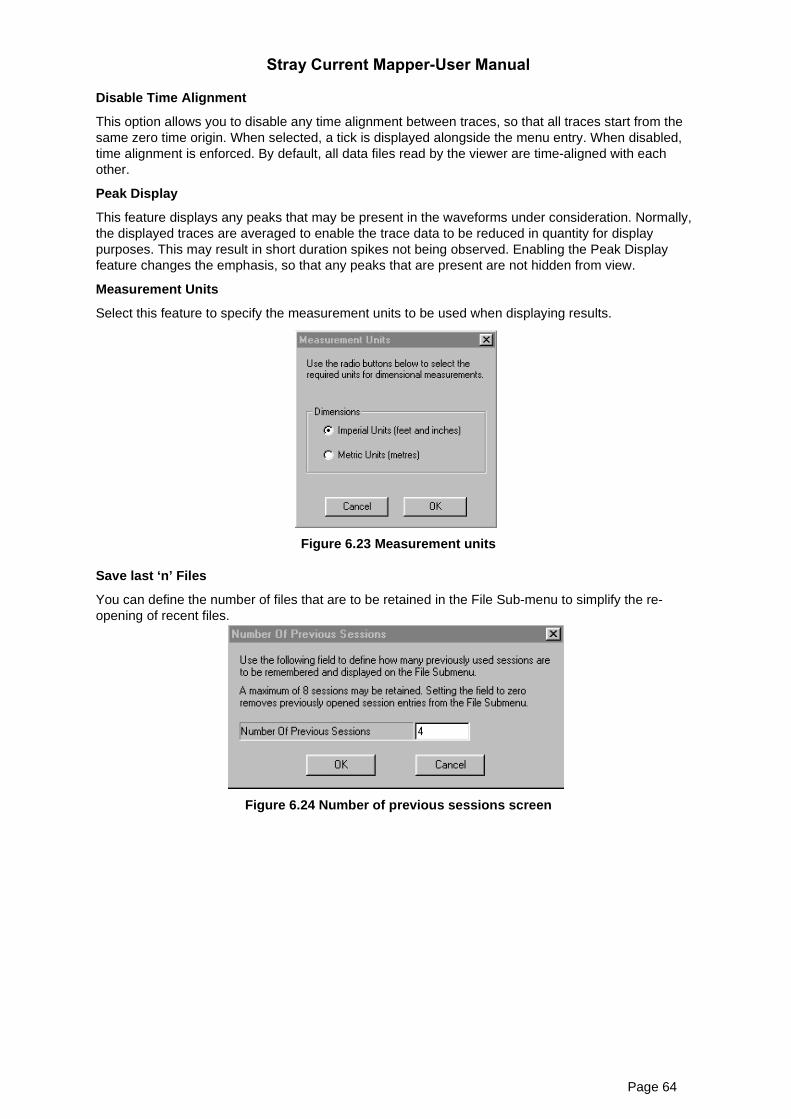
Stray Current Mapper-User Manual
Page 64
Disable Time Alignment
This option allows you to disable any time alignment between traces, so that all traces start from thesame zero time origin. When selected, a tick is displayed alongside the menu entry. When disabled,time alignment is enforced. By default, all data files read by the viewer are time-aligned with eachother.
Peak Display
This feature displays any peaks that may be present in the waveforms under consideration. Normally,the displayed traces are averaged to enable the trace data to be reduced in quantity for displaypurposes. This may result in short duration spikes not being observed. Enabling the Peak Displayfeature changes the emphasis, so that any peaks that are present are not hidden from view.
Measurement Units
Select this feature to specify the measurement units to be used when displaying results.
Figure 6.23 Measurement units
Save last ‘n’ Files
You can define the number of files that are to be retained in the File Sub-menu to simplify the re-opening of recent files.
Figure 6.24 Number of previous sessions screen

Stray Current Mapper-User Manual
Page 65
Save On Exit
A flag controls whether changes made to the configuration, during a session, are to be automaticallysaved when the application is closed. A tick alongside the entry indicates that the option is enabled(i.e. changes will be saved).
6.6.4 Trace Sub-menu
This sub-menu provides a means of identifying which traces are to be used by the data manipulationfunctions provided as part of the datalog viewer.
Figure 6.25 Trace sub-menu
Select Trace
If you select this, you are presented with a dialogue box (as shown in Fig 6.26) showing all of thetraces that comprise the current session. To select the required trace click on the appropriate colouredsquare. To select all traces click the ‘Select All’ button
Figure 6.26 Select trace menu

Stray Current Mapper-User Manual
Page 66
Change Colours
This option provides a means of changing the colours assigned to each trace being displayed. Forty-eight pre-defined colours are provided, any one of which may be selected by clicking on theappropriate square. Alternatively, up to sixteen custom colours may be defined by clicking on the‘Define Custom Colours’ button.
Select colour menu
Hide Trace
When Hide trace is displayed, the traces defined within the current session are shown. You may tickthose traces that are to be visible, or un-tick those traces that are to be hidden. Hiding traces helps toincrease the clarity of the display if a session contains a significant number of traces
Figure 6.28 Visible traces menu

Stray Current Mapper-User Manual
Page 67
Properties
When selected, the Properties dialogue box for the selected trace is displayed.
6.6.5 Help Sub-menu
The Help sub-menu is shown below:
Figure 6.29 Help sub-menuHelp Topics
Provides a detailed list of help topics.
About
Provides information regarding the package’s software revision.

Stray Current Mapper-User Manual
Page 68
6.7 Horizontal scrolling and cursor controlTwo cursors are provided within the viewer application, each comprising a horizontal and vertical line.The cursors serve a number of purposes. They provide a quick and simple means of ‘zooming in’ on asection of trace of interest, a means of taking measurements, as well as selecting other availableoptions and features. The following sections explain the various ways in which the cursors can beused.
Horizontal Scrolling
A horizontal scrollbar along the bottom of the screen allows you to traverse the displayed traces intime. Fig 6.30 shows a section of the scrollbar. The complete scrollbar presents a summary of the datalog in its entirety. It may show all traces defined by the session, or just a specific trace (as in theexample shown). Its primary purpose is to show the general trends within the log, so that you canquickly move to the areas of interest. The grey area of the scroll bar represents the portion of the logthat is currently being displayed. If you move the mouse onto this shaded area, and hold down the leftmouse button, the displayed trace will be scrolled in the horizontal direction. You can also clickanywhere on the horizontal scroll bar to move to that point of the trace.
Figure 6.30 Horizontal scrolling menu
Measurement Cursors
Measurement Cursor FeaturesNote: You can only place a cursor on the display when a single trace has been selected. If ‘ALL
TRACES’ is the current selection, you cannot place a measurement cursor on the screen.
Once you have selected an individual trace, you can position the cursors on the screen. The viewermaintains a pair of cursors for each trace, so as you select different traces, the cursors (if positioned)will be re-positioned at their last position for that trace.
You can place up to two measurement cursors on the screen by positioning the mouse pointeranywhere in the screen display area and double-clicking the left mouse button. Whenever ameasurement cursor is displayed, the cursor’s current position is shown at the bottom of the screen.When both measurement cursors are present, two delta fields will be displayed, indicating thedifference between the two cursor points. The values displayed in these cursor fields depend uponwhether the cursors are being used in a relative (to each other) mode, or are being referenced againsta defined absolute zero. Fig 6.30 shows the measurements of two cursors on the display. Eachmeasurement string is preceded by a red cross graphic - a solid cross for cursor 1, and a dotted crossfor cursor 2. The measurement string consists of three parts: a date (day, month, and year), a time(hours, minutes, seconds, and milliseconds), and the signal value.

Stray Current Mapper-User Manual
Page 69
Each cursor comprises a horizontal and vertical line forming a cross-hair sight, as shown in Fig 6.31The solid lines represent cursor 1 and the dotted lines represent cursor 2.
Figure 6.31 Vertical and horizontal cursors
To move the measurement cursors, place the mouse pointer over the measurement cursor to bemoved, hold down the left mouse button, drag the cursor to the new position and then release the leftmouse button. How the cursor moves will depend upon where the mouse cursor is placed to ‘grab’ themeasurement cursor. If the mouse is close to the intersection of the horizontal and vertical lines, bothlines will move as the mouse moves. If the mouse is only close to one of the two lines, only that linewill move as the mouse moves.
To remove a cursor
• Place the mouse pointer over a vertical cursor and click the right mouse button. The followingdialogue box is displayed
• Click ‘Remove Cursor’ with the left mouse button.

Stray Current Mapper-User Manual
Page 70
Trace Features
You can access a number of additional features by clicking the right mouse button whilst the mousehas been positioned on a trace of interest. A pop-up menu is then displayed, as shown in Fig 6.32
Figure 6.32 Trace features
There are three distinct functional areas in this pop-up menu. The first area relates to themeasurement cursors. The second is concerned with features related to the signal traces themselves,whilst the third area provides a ‘where am I?’ feature.
These features are described in the following sections.
Define Absolute Zero
To define an absolute zero value (reference) place a measurement cursor at the required point on thetrace, click the right mouse button on the cursor, and select ‘Define Absolute Zero’ in the pop-upwindow. A horizontal marker will then be positioned on the screen at the chosen spot, and all verticalmeasurement cursors referenced to this point. This is shown as a hashed line in Fig 6.33 below.
Figure 6.33 Define absolute zero

Stray Current Mapper-User Manual
Page 71
Remove Absolute Zero
Select this option to remove the absolute reference that was previously defined. This option is onlyavailable when you position the mouse on the absolute reference itself and click the right mousebutton.
Remove Cursor
Select this feature to remove the selected cursor from the screen. This also removes the entries in thestatus bar at the bottom of the display.
Log Comment
Select this option to display a dialogue box containing the site description embedded in the signal tracethat has been selected.
Select Trace
Select this feature to cause the trace being highlighted to become the active trace –all measurementsdisplayed at the bottom of the display will be with respect to this trace. The ‘Select Trace’ button (seesection 6.6.4.) is updated to reflect the selected trace.
NOTE: Although all traces may appear to be the same approximate size on the display, their scalingfactors could be significantly different. You should only take measurements for a given traceafter it has been made the active trace by selecting it.
Select All Traces
This option provides a simple means of selecting ALL traces. This option is available whenever theright mouse button is clicked, irrespective of whether the mouse is on a trace or not.
Hide Trace
This option provides a simple means of hiding a trace. When selected, the trace being pointed at ishidden, and no longer displayed on the screen. The trace may be restored by using theTrace/Hide Trace menu option.
‘Where Am I?’ Feature
Hold down the right mouse button whilst the pointer is anywhere in the display and a pop-up box willbe displayed, indicating the current time position of the trace. This pop-up box will automatically updateas the mouse is moved and the right mouse button is clicked. Clear the pop-up box by clicking the leftmouse button.
Time position of trace

Stray Current Mapper-User Manual
Page 72
7 EXAMPLES
Static Interference
In the above example, Smart Interrupters were placed at transformer rectifiers at each end of apipeline, which incorporates a T-piece. The current increase shown between the cursors is caused bystray current coming along the T-junction and going along both sides of the pipe, affecting the SmartInterrupter signal.

Stray Current Mapper-User Manual
Page 73
Dynamic interference
In the above example the SCM SensorBar was placed over oil pipeline and the logging period set.There was a railway station nearby, and as a train accelerated from the station, a current increase wasseen on the screen. By placing the cursors at the lowest current and the highest current, the differencein current was calculated to be over 7 amps. This indicated that stray current was being forced ontothe oil pipe from the train through the rails to ground. To determine the extent of the problem a moreextensive logging period would be needed to establish the extent of the problem
Radiodetection products are under continuous developmentand are subject to change without notice
90/UG058EN0All rights reserved
Radiodetection LtdWestern DriveBristol BS14 OAZ, UKTel: +44 (0) 117 976 7776Fax: +44 (0) 117 976 7775email:[email protected]://www.radiodetection.com