Embed Size (px)
Citation preview

Data fusion algorithm for the 3D-MFD estimation
Igor Dakic, ETH Zurich
Monica Menendez, ETH Zurich
May 2017
STRC 17th Swiss Transport Research Conference Monte Verità / Ascona, May 17 – 19, 2017
Data fusion algorithm for the 3D-MFD estimation May 2017
Data fusion algorithm for the 3D-MFD estimation
Igor DakicInstitute for Transport Planning and SystemsETH Zurich, 8093 Zurich
phone: +41 44 633 31 92fax: +41 44 633 1057{igor.dakic}@ivt.baug.ethz.ch
Monica MenendezInstitute for Transport Planning and SystemsETH Zurich, 8093 Zurich
phone: +41 44 633 6695fax: +41 44 633 [email protected]
May 2017
Abstract
The concept of the Macroscopic Fundamental Diagram (MFD) has been recognized as a powerfultool to develop network-wide control strategies. Recently, it has been extended to the three-dimensional MFD (3D-MFD), used to investigate traffic dynamics of multimodal urban citieswhere different transport modes compete for, and share road infrastructure. Due to the limitedamount of available data used to develop the MFD or 3D-MFD, different estimation methodshave been proposed. In most cases, the data comes from either loop detectors or GPS-equippedmobile probe vehicles. Recent research has shown the value of fusing those two data sources forimproving the accuracy of an estimated MFD, but requires a priori information about the probepenetration rate (PPR). Considering that this information is not very often available or is verydifficult to infer, implementation of such a fusion method has been constrained so far only tosimulation data. In this study, however, we propose a methodology to estimate the 3D-MFDthat does not require the PPR as an input. To that end, we have developed a fusion algorithmthat combines information from probe vehicles and automatic vehicle location devices of publictransport to estimate the average speed of cars and further a 3D-MFD in a mixed bi-modal urbannetwork. The findings show that the proposed algorithm can significantly reduce the estimationerror when compared to an estimation method that uses only one data source.
KeywordsThree-dimensional MFD, MFD, Traffic state estimation
i
Data fusion algorithm for the 3D-MFD estimation May 2017
1 Introduction and background
In traffic flow theory, the concept of the Macroscopic Fundamental Diagram (MFD), whichprovides a well-defined relationship between the spatially-averaged flow and density, has beenrecognized as a powerful tool to develop network-wide control strategies. Only recently didresearchers proved its existence, using empirical data from the city of Yokohama (Geroliminisand Daganzo, 2008) and derived an analytical approximation method based on variational theory(Daganzo and Geroliminis, 2008).
Despite the large amount of research efforts that have been placed on investigating differentaspects of single-mode networks, only few studies have looked at the features of multi-modaloperations, focusing on designing an optimal transit service (Wirasinghe and Hurdle, 1977),special bus lanes (Daganzo and Cassidy, 2008), pre-signals for bus priority (Guler and Menendez,
2014a,b, He et al., 2016, 2017) or providing traffic signal priority for public transport (Eichlerand Daganzo, 2006). Aiming to fill this gap in the current state of the art, Geroliminis et al.
(2014) extended the concept of the MFD to the three-dimensional MFD (3D-MFD), with thepurpose to investigate traffic dynamics of multi-modal urban cities where different transportmodes compete for, and share road infrastructure. The authors derived both vehicular andpassenger 3D-MFD, relating the accumulation of cars and buses and the total circulating flowof vehicles (passengers) in a mixed bi-modal network. The discussion on passenger MFD canalso be found in (Chiabaut, 2015). Previous studies also used bi-modal MFD as a quantitativeapproach connecting the impact of dedicated space to the global traffic performance (Zheng andGeroliminis, 2013, Ortigosa et al., 2017).
Due to the limited amount of available data used to develop an MFD, different estimationmethods have been proposed (Courbon and Leclercq, 2011, Leclercq et al., 2014). In most cases,the information comes from either loop detector data (LDD) or floating car data (FCD). If noneof these sources is available, traffic information might also come from some other sources, suchas adaptive traffic control systems that report a density-like performance measures, which canpotentially be used for constructing the fundamental relationships (Dakic and Stevanovic, 2017).Recent research (Ambühl and Menendez, 2016) has shown the value of fusing LDD and FCD toimprove the accuracy of an estimated MFD, but requires a priori knowledge about the probepenetration rate (PPR). Given that this information is not very often (if ever) available or is verydifficult to infer (Du et al., 2016), implementation of such a fusion method has been constrainedso far only to simulation data. This study tries to close this gap by proposing a methodologyfor estimating the space-mean speed of cars and further a 3D-MFD in a mixed bi-modal urbannetwork, combining information from FCD, automatic vehicle location devices (AVL) of publictransport, and LDD. As such, it does not require the PPR as an input.
1
Data fusion algorithm for the 3D-MFD estimation May 2017
2 Limitations of the existing estimation methods
Assuming that GPS equipped mobile probe vehicles are homogeneously distributed acrossthe network, Nagle and Gayah (2014) proposed an MFD estimation method using the FCD.This assumption, however, cannot be considered to be realistic, as, in most cases, the marketpenetration level of mobile probes is not uniform across the entire set of origin-destination (OD)pairs. Aiming to address such problems, Du et al. (2016) derived an MFD from FCD, using anew probe penetration estimation method based on the k-means clustering analysis. Althoughthe findings are encouraging, the following constrains are imposed on the implementation ofthe proposed method: (i) the detector location can have a great impact on the estimated numberof probes for a given OD pair, which has not been addressed in the study; (ii) the optimalnumber of clusters, shown to have a significant impact on the accuracy of the results, can benetwork-specific, making the generalization of the procedure very difficult; (iii) LDD and FCDmight come in different time formats (e.g. detectors counts are given in a 5-min resolution,whereas the GPS data are only available in a 15-min resolution), preventing one to utilize theproposed methodology to estimate the FCD penetration rate.
On the other hand, the accuracy of an estimated MFD can be improved by fusing LDD andFCD (Ambühl and Menendez, 2016). However, the main assumptions on which such a fusionalgorithm is based, is to have a priori knowledge about the PPR and that loop detectors canproperly measure flow and density. Considering that the PPR is not often available or isvery difficult to infer, as we previously explained, and that, in most cases, loop detectors arenot capable of reporting the exact measurements, practical implementation of such a fusionprocedure remains challenging.
To overcome the aforementioned problems, Leclercq et al. (2014) suggested a method thatcombines the speed from probes and counts from loops, showing an estimated MFD can besignificantly improved compared to a single, LDD data source. Even though the informationregarding the PPR is not explicitly required, the accuracy of the proposed method highly dependson: (i) the number of trajectories used to determine the space-mean speed of cars for the entirenetwork; and (ii) the level of homogeneity in terms of the spatial distribution of probe vehicles.Given such dependencies, one can pose the following research questions: What happens if theFCD is very limited or non-existent, especially for some time intervals? Can we still use thecombined method in such case and/or have a lack of data for time intervals when the FCD is notavailable? Is there any other data source that can provide us with additional information aboutthe state of traffic (e.g. speed) when no FCD exists?
In this study we seek to find the answers to these questions, by proposing a novel method for
2
Data fusion algorithm for the 3D-MFD estimation May 2017
estimating the space-mean speed of cars in a mixed bi-modal system of cars and buses. Theproposed method fuses different data sources including FCD and AVL data. Moreover, a lack ofthe trajectory data is compensated with the information coming from public transport vehicles.
3 Methodology
3.1 Estimation of the space-mean speed of cars from the trajectory
data
Let {i | i ∈ L} be an index of the one-directional link, where |L| is the total number of one-directional links in the network. For any given time interval τ, denote a dynamic set ofone-directional links with FCD as F (τ) = {i | i ∈ L ∧ ∃ j ∈ Pi(τ)}, where Pi(τ) is the set ofprobe vehicles traveling on link i at time τ. Then, the space-mean speed of cars from FCD canbe derived using generalized definitions of Edie (1961):
vFCDc (τ) =
∑i∈F (τ)
∑j∈Pi(τ) di, j(τ)∑
i∈F (τ)∑
j∈Pi(τ) ti, j(τ)(1)
where di, j(τ) and ti, j(τ) stand for the distance and time traveled by probe vehicle j during time τ,on the subnetwork where the FCD is available.
In multi-modal systems, data can be acquired from different modes, which can be used to drawsome conclusions regarding the mode for which the data is not available. For instance, in (Zhengand Geroliminis, 2013), the speed of buses is estimated based on the known speed of cars,following the concept of the two-fluid theory (Herman and Prigogine, 1979). Building on suchideas, in the following we will present a novel AVL-based estimation model for the space-meanspeed of cars.
Let us first define a dynamic set of shared mixed-lane one-directional links containing the AVLdata, A(τ) = {i | i ∈ L ∧ ∃z ∈ Bi(τ)} ⊆ L, where z is a bus index and Bi(τ) is a dynamic setof buses operating on link i in time τ. If we assume that cars and buses drive with the samefree-flow speed in a shared mixed-lane (excluding the dwell time), we can approximate thespace-mean speed of cars, vAVL
c (τ), based on the ground truth space-mean speed of buses, vb(τ),
3
Data fusion algorithm for the 3D-MFD estimation May 2017
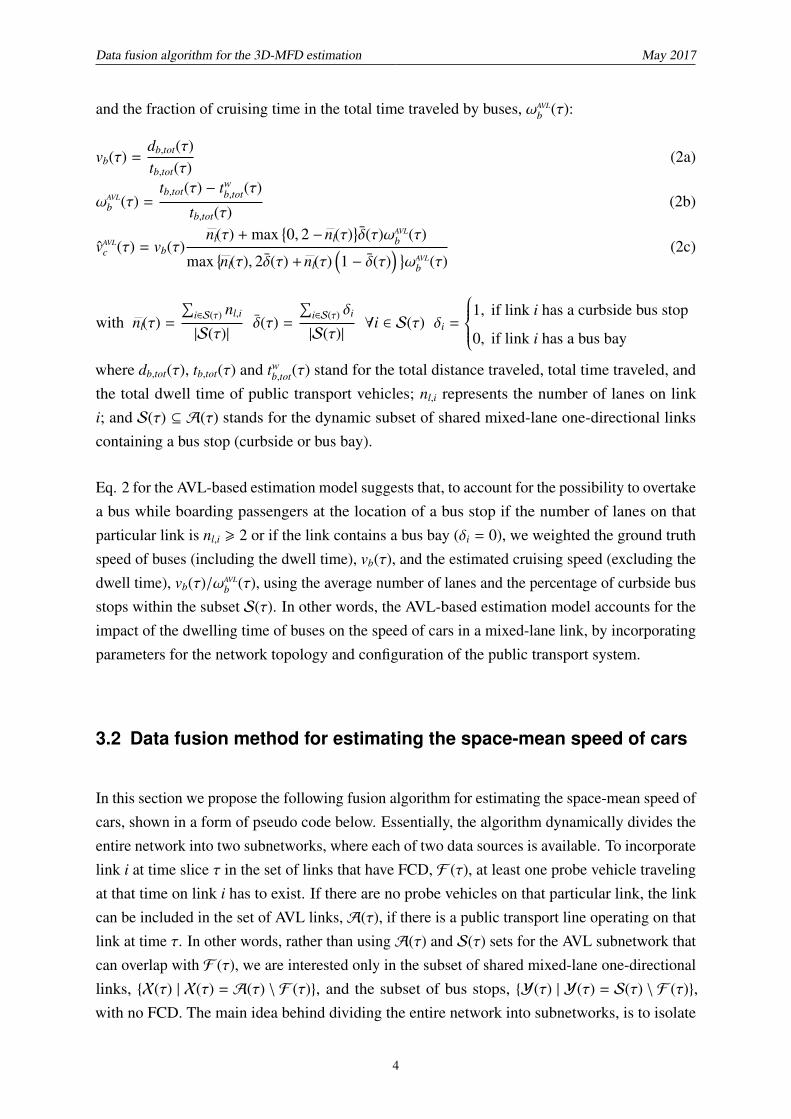
and the fraction of cruising time in the total time traveled by buses, ωAVLb (τ):
vb(τ) =db,tot(τ)tb,tot(τ)
(2a)
ωAVLb (τ) =
tb,tot(τ) − twb,tot(τ)
tb,tot(τ)(2b)
vAVLc (τ) = vb(τ)
nl(τ) + max{0, 2 −nl(τ)
}δ(τ)ωAVL
b (τ)
max{nl(τ), 2δ(τ) +nl(τ)
(1 − δ(τ)
) }ωAVL
b (τ)(2c)
with nl(τ) =
∑i∈S(τ) nl,i
|S(τ)|δ(τ) =
∑i∈S(τ) δi
|S(τ)|∀i ∈ S(τ) δi =
1, if link i has a curbside bus stop
0, if link i has a bus bay
where db,tot(τ), tb,tot(τ) and twb,tot(τ) stand for the total distance traveled, total time traveled, and
the total dwell time of public transport vehicles; nl,i represents the number of lanes on linki; and S(τ) ⊆ A(τ) stands for the dynamic subset of shared mixed-lane one-directional linkscontaining a bus stop (curbside or bus bay).
Eq. 2 for the AVL-based estimation model suggests that, to account for the possibility to overtakea bus while boarding passengers at the location of a bus stop if the number of lanes on thatparticular link is nl,i > 2 or if the link contains a bus bay (δi = 0), we weighted the ground truthspeed of buses (including the dwell time), vb(τ), and the estimated cruising speed (excluding thedwell time), vb(τ)/ωAVL
b (τ), using the average number of lanes and the percentage of curbside busstops within the subset S(τ). In other words, the AVL-based estimation model accounts for theimpact of the dwelling time of buses on the speed of cars in a mixed-lane link, by incorporatingparameters for the network topology and configuration of the public transport system.
3.2 Data fusion method for estimating the space-mean speed of cars
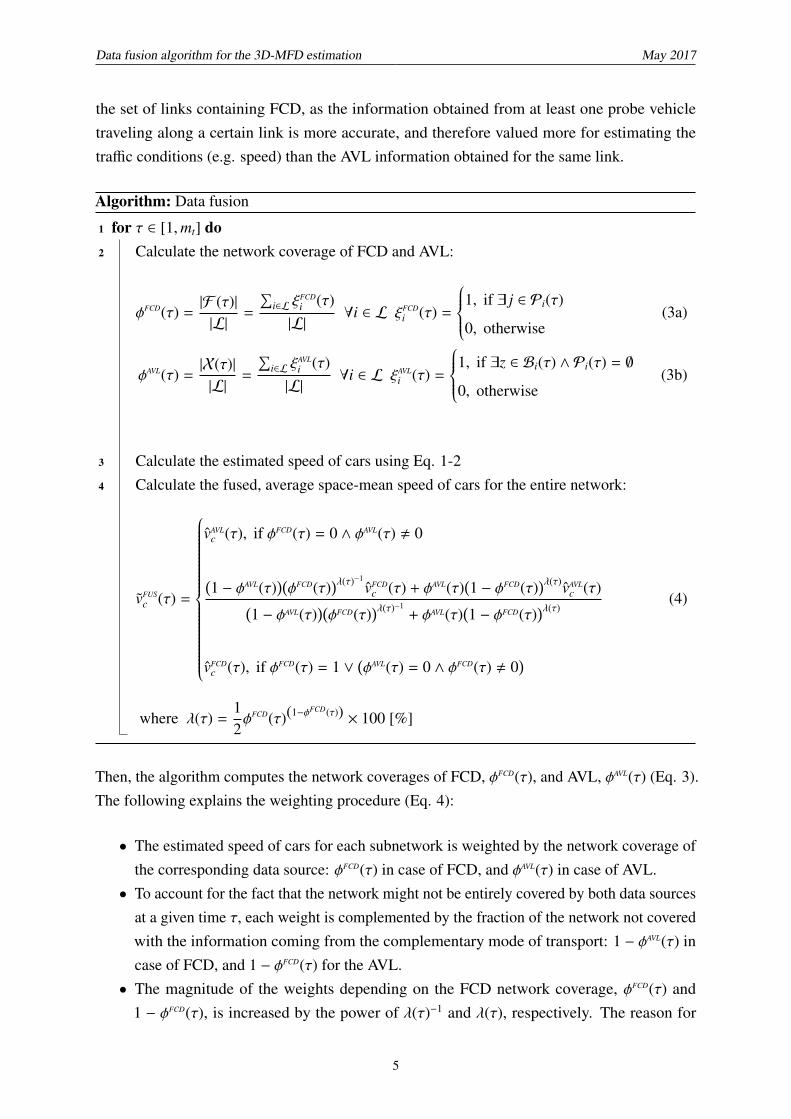
In this section we propose the following fusion algorithm for estimating the space-mean speed ofcars, shown in a form of pseudo code below. Essentially, the algorithm dynamically divides theentire network into two subnetworks, where each of two data sources is available. To incorporatelink i at time slice τ in the set of links that have FCD, F (τ), at least one probe vehicle travelingat that time on link i has to exist. If there are no probe vehicles on that particular link, the linkcan be included in the set of AVL links,A(τ), if there is a public transport line operating on thatlink at time τ. In other words, rather than usingA(τ) and S(τ) sets for the AVL subnetwork thatcan overlap with F (τ), we are interested only in the subset of shared mixed-lane one-directionallinks, {X(τ) | X(τ) = A(τ) \ F (τ)}, and the subset of bus stops, {Y(τ) | Y(τ) = S(τ) \ F (τ)},with no FCD. The main idea behind dividing the entire network into subnetworks, is to isolate
4
Data fusion algorithm for the 3D-MFD estimation May 2017
the set of links containing FCD, as the information obtained from at least one probe vehicletraveling along a certain link is more accurate, and therefore valued more for estimating thetraffic conditions (e.g. speed) than the AVL information obtained for the same link.
Algorithm: Data fusion
1 for τ ∈ [1,mt] do2 Calculate the network coverage of FCD and AVL:
φFCD(τ) =|F (τ)||L|
=
∑i∈L ξ
FCDi (τ)|L|
∀i ∈ L ξFCDi (τ) =
1, if ∃ j ∈ Pi(τ)
0, otherwise(3a)
φAVL(τ) =|X(τ)||L|
=
∑i∈L ξ
AVLi (τ)|L|
∀i ∈ L ξAVLi (τ) =
1, if ∃z ∈ Bi(τ) ∧ Pi(τ) = ∅
0, otherwise(3b)
3 Calculate the estimated speed of cars using Eq. 1-24 Calculate the fused, average space-mean speed of cars for the entire network:
vFUSc (τ) =
vAVLc (τ), if φFCD(τ) = 0 ∧ φAVL(τ) , 0
(1 − φAVL(τ)
)(φFCD(τ)
)λ(τ)−1vFCD
c (τ) + φAVL(τ)(1 − φFCD(τ)
)λ(τ)vAVLc (τ)(
1 − φAVL(τ))(φFCD(τ)
)λ(τ)−1+ φAVL(τ)
(1 − φFCD(τ)
)λ(τ)
vFCDc (τ), if φFCD(τ) = 1 ∨
(φAVL(τ) = 0 ∧ φFCD(τ) , 0
)(4)
where λ(τ) =12φFCD(τ)(1−φFCD(τ)) × 100 [%]
Then, the algorithm computes the network coverages of FCD, φFCD(τ), and AVL, φAVL(τ) (Eq. 3).The following explains the weighting procedure (Eq. 4):
• The estimated speed of cars for each subnetwork is weighted by the network coverage ofthe corresponding data source: φFCD(τ) in case of FCD, and φAVL(τ) in case of AVL.
• To account for the fact that the network might not be entirely covered by both data sourcesat a given time τ, each weight is complemented by the fraction of the network not coveredwith the information coming from the complementary mode of transport: 1 − φAVL(τ) incase of FCD, and 1 − φFCD(τ) for the AVL.
• The magnitude of the weights depending on the FCD network coverage, φFCD(τ) and1 − φFCD(τ), is increased by the power of λ(τ)−1 and λ(τ), respectively. The reason for
5
Data fusion algorithm for the 3D-MFD estimation May 2017
defining λ(τ) = f (φFCD(τ)), and for taking the inverse value of λ(τ) as the exponentfor φFCD(τ), but not for 1 − φFCD(τ), is based on: (i) the knowledge that the FCD, ifavailable, is considered to be more accurate than the AVL and therefore valued more forthe fusion process, as we stated before; (ii) the nature of numbers that can be obtained forφFCD(τ) and 1 − φFCD(τ), ranging between 0 and 1, and the way how such numbers can beincreased (using the positive exponent < 1) or decreased (using the positive exponent > 1),depending on the FCD network coverage; (iii) the fact that the proposed fusion algorithmshould be generalized (should perform equally well for different settings in terms of thenetwork configuration and operational characteristics of public transport); and (iv) thelarge number of empirical trials.
3.3 Accuracy of the estimated space-mean speed of cars
Let vc(τ) and vc(τ) stand for the full network coverage (the ground truth) space-mean speedof cars and the estimated average speed of cars (calculated when the network has incompletecoverage), respectively. Following the approach by Nagle and Gayah (2014), we can formulatethe measurements error for a given time slice τ using Eq. 5. The average relative error for theentire period of time can then be computed as ∆RV =
∑mtτ=1 ∆RV(τ)/mt.
∆RV(τ) =
∣∣∣∣∣vc(τ) − vc(τ)vc(τ)
∣∣∣∣∣ (5)
3.4 Performance of the proposed fusion method
To determine how accurately the proposed fusion algorithm estimates the space-mean speed ofcars, we will compare its performance with the performance of a reference method, consideredto be the best possible estimation given the available, incomplete measurements. The solution isobtained using Nelder and Mead heuristic search approach:
vREFc (τ) = αvFCD
c (τ) + βvAVLc (τ) (6)
where α and β are model parameters. In the first step, the starting value are set to be (0.5,0.5).In the next iteration, values are changed depending on the obtained objective function, ∆RV,according to Nelder and Mead procedure. The procedure is repeated until convergence (adifference of less than 10−8) is reached at an iteration step. In addition to the reference method,we will also compare the fusion algorithm with the method by Leclercq (Eq. 1).
6
Data fusion algorithm for the 3D-MFD estimation May 2017
4 Case study
4.1 General simulation setting
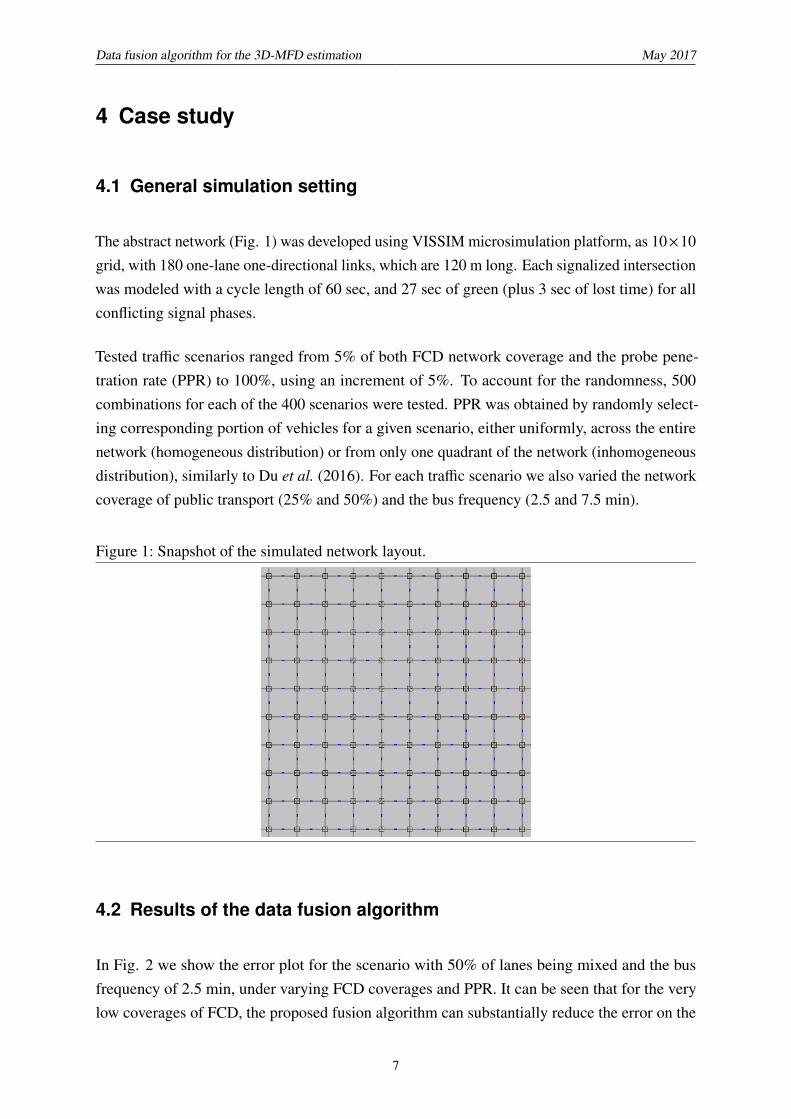
The abstract network (Fig. 1) was developed using VISSIM microsimulation platform, as 10×10grid, with 180 one-lane one-directional links, which are 120 m long. Each signalized intersectionwas modeled with a cycle length of 60 sec, and 27 sec of green (plus 3 sec of lost time) for allconflicting signal phases.
Tested traffic scenarios ranged from 5% of both FCD network coverage and the probe pene-tration rate (PPR) to 100%, using an increment of 5%. To account for the randomness, 500combinations for each of the 400 scenarios were tested. PPR was obtained by randomly select-ing corresponding portion of vehicles for a given scenario, either uniformly, across the entirenetwork (homogeneous distribution) or from only one quadrant of the network (inhomogeneousdistribution), similarly to Du et al. (2016). For each traffic scenario we also varied the networkcoverage of public transport (25% and 50%) and the bus frequency (2.5 and 7.5 min).
Figure 1: Snapshot of the simulated network layout.
4.2 Results of the data fusion algorithm
In Fig. 2 we show the error plot for the scenario with 50% of lanes being mixed and the busfrequency of 2.5 min, under varying FCD coverages and PPR. It can be seen that for the verylow coverages of FCD, the proposed fusion algorithm can substantially reduce the error on the
7
Data fusion algorithm for the 3D-MFD estimation May 2017
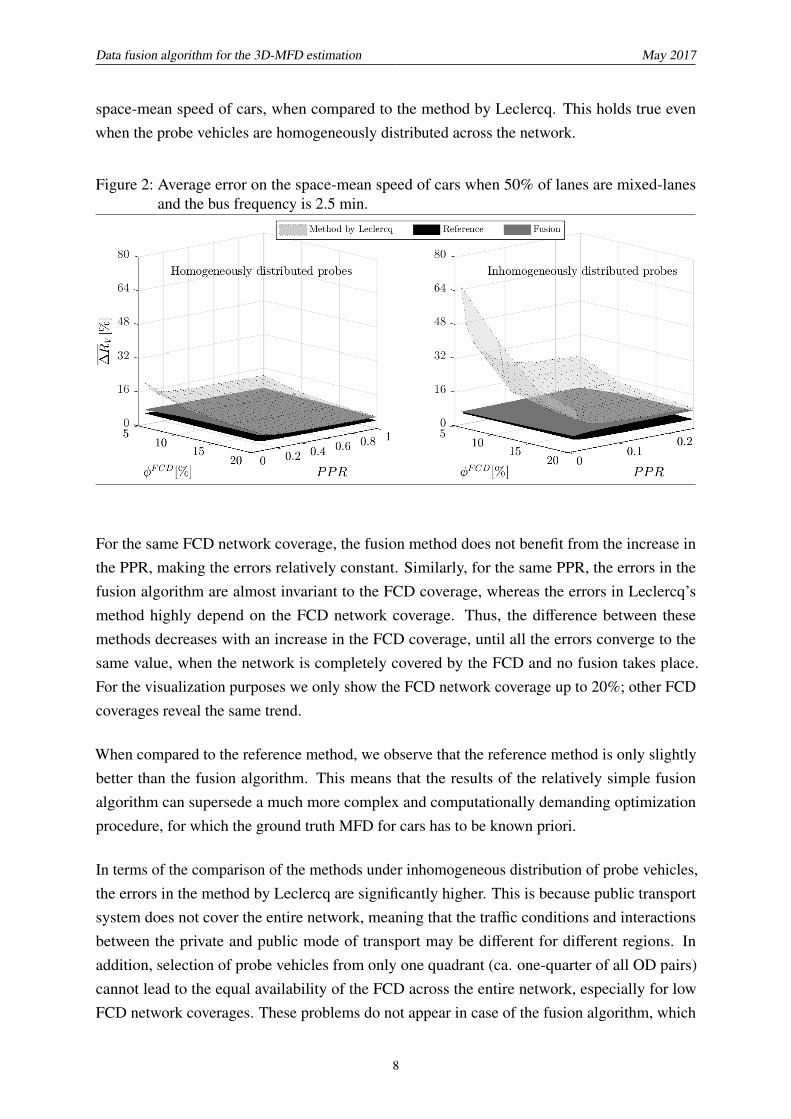
space-mean speed of cars, when compared to the method by Leclercq. This holds true evenwhen the probe vehicles are homogeneously distributed across the network.
Figure 2: Average error on the space-mean speed of cars when 50% of lanes are mixed-lanesand the bus frequency is 2.5 min.
For the same FCD network coverage, the fusion method does not benefit from the increase inthe PPR, making the errors relatively constant. Similarly, for the same PPR, the errors in thefusion algorithm are almost invariant to the FCD coverage, whereas the errors in Leclercq’smethod highly depend on the FCD network coverage. Thus, the difference between thesemethods decreases with an increase in the FCD coverage, until all the errors converge to thesame value, when the network is completely covered by the FCD and no fusion takes place.For the visualization purposes we only show the FCD network coverage up to 20%; other FCDcoverages reveal the same trend.
When compared to the reference method, we observe that the reference method is only slightlybetter than the fusion algorithm. This means that the results of the relatively simple fusionalgorithm can supersede a much more complex and computationally demanding optimizationprocedure, for which the ground truth MFD for cars has to be known priori.
In terms of the comparison of the methods under inhomogeneous distribution of probe vehicles,the errors in the method by Leclercq are significantly higher. This is because public transportsystem does not cover the entire network, meaning that the traffic conditions and interactionsbetween the private and public mode of transport may be different for different regions. Inaddition, selection of probe vehicles from only one quadrant (ca. one-quarter of all OD pairs)cannot lead to the equal availability of the FCD across the entire network, especially for lowFCD network coverages. These problems do not appear in case of the fusion algorithm, which
8

Data fusion algorithm for the 3D-MFD estimation May 2017
complements the lack of data (low FCD coverage) with the information coming from publictransport. In other words, the fusion algorithm only depends on the percentage of links coveredby the FCD. For the rest of the network where no FCD is available, the speed of buses ina mixed-lane is used to estimate the speed of cars, according to the network configurationlayout (i.e. number of lanes in mixed-lane links) and configuration of public transport system(i.e. location of the bus stop in a mixed-lane link) (Eq. 2). As the result, the proposed fusionalgorithm becomes independent of the distribution of probe vehicles, substantially reducing theerror on the estimated space-mean speed of cars and outperforming the commonly used methodby Leclercq (Fig. 2).
To address a potential question, how does the fusion algorithm perform when the granularityof the AVL data is rather low, we have performed another set of experiments, using the samepercentage of mixed-lanes as in the previous scenario (50%) and the bus frequency of 7.5min. Results of these experiments are shown in Fig. 3 and reveal the lower error obtainedby Leclercq’s method compared to the previous case, due to the reduced interactions betweendifferent modes of transport.
Figure 3: Average error on the space-mean speed of cars when 50% of lanes are mixed-lanesand the bus frequency is 7.5 min.
Nevertheless, the proposed fusion algorithm once again outperformed the method by Leclercq.This is because the overall percentage of mixed-lanes is relatively high (50%), suggesting thatthe AVL data can still provide a good approximation of the speed of cars, especially in case ofthe sparse FCD. In addition, due to the reduced coverage of the AVL data, more weight is givento the FCD-based estimated speed of cars (Eq. 5), which by itself has a lower error comparedto the previous scenario. Finally, we have executed additional experiments for assessing theimpact of the low AVL network coverage on the performance of the proposed fusion algorithm.
9
Data fusion algorithm for the 3D-MFD estimation May 2017
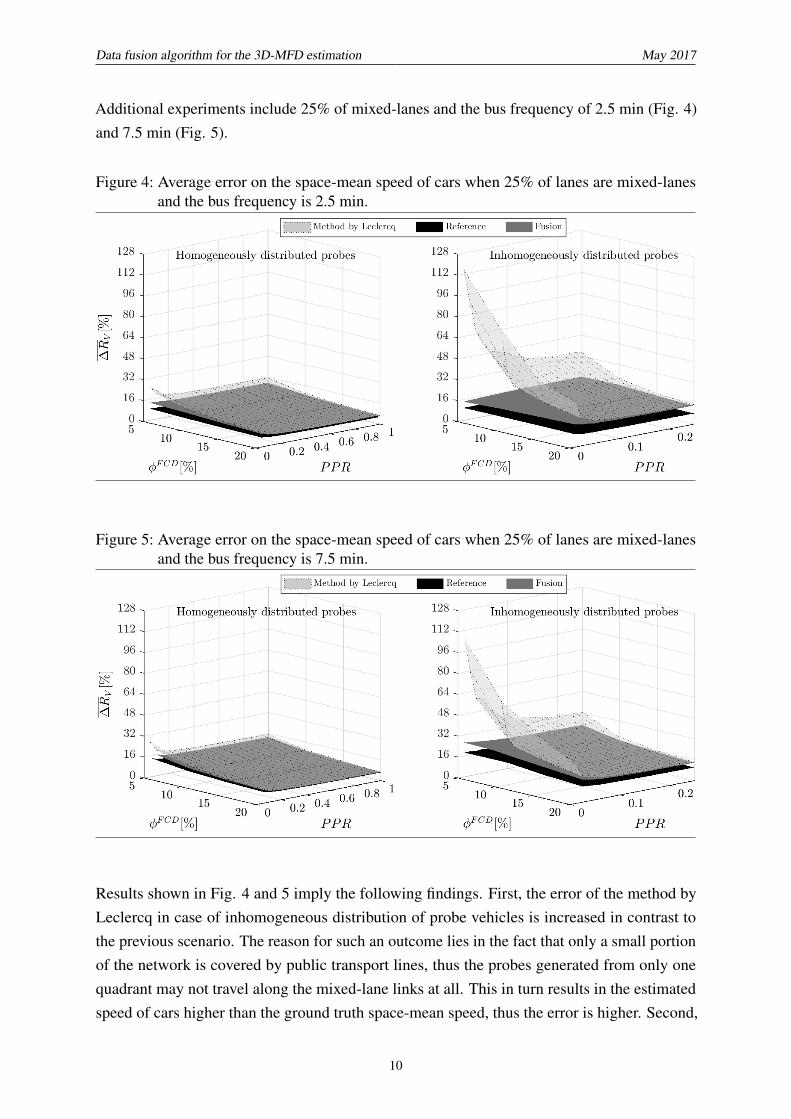
Additional experiments include 25% of mixed-lanes and the bus frequency of 2.5 min (Fig. 4)and 7.5 min (Fig. 5).
Figure 4: Average error on the space-mean speed of cars when 25% of lanes are mixed-lanesand the bus frequency is 2.5 min.
Figure 5: Average error on the space-mean speed of cars when 25% of lanes are mixed-lanesand the bus frequency is 7.5 min.
Results shown in Fig. 4 and 5 imply the following findings. First, the error of the method byLeclercq in case of inhomogeneous distribution of probe vehicles is increased in contrast tothe previous scenario. The reason for such an outcome lies in the fact that only a small portionof the network is covered by public transport lines, thus the probes generated from only onequadrant may not travel along the mixed-lane links at all. This in turn results in the estimatedspeed of cars higher than the ground truth space-mean speed, thus the error is higher. Second,
10

Data fusion algorithm for the 3D-MFD estimation May 2017
due to the less space allocated to the mixed traffic and reduced interactions between cars andbuses when the bus frequency is reduced, the error in the FCD-based method is also reduced.Third, the fusion algorithm once again significantly outperformed Leclercq’s method, especiallyfor inhomogeneous FCD distribution Last, the difference between the methods is reduced forthe lower bus frequency, due to the limited amount of AVL data and the higher weight given tothe FCD.
5 Concluding remarks
This paper presents a novel fusion algorithm for estimating the space-mean speed of cars inbi-model urban networks that fuses different sources of information including the FCD andAVL data. To that end, we have derived a new estimation model for estimating the speed ofcars in mixed-lane network based on the AVL data, which accounts for the network topologyand configuration of public transport system (number of lanes and the location of bus stop inmixed-lane links).
The preliminary simulation results revealed that it substantially reduces the error on the space-mean speed of cars, especially for low FCD network coverages. In all tested scenarios, itoutperformed the commonly used method by Leclercq et al. (2014). The results are relativelyconsistent under different public transport settings and network configuration, and are inde-pendent of the spatial distribution and the penetration rate of probe vehicles. This makes theproposed fusion algorithm a very robust and promising framework for assessing the performanceof multi-modal traffic.
Future research should test the impact of other network configurations on the performance ofthe fusion algorithm and confirm the robustness of the proposed method. In addition, futureefforts should try to incorporate other public transport modes to estimate the speed of cars.Finally, empirical data should be included to demonstrate the applicability of the proposedmethodology.
6 Acknowledgments
This research has been partially funded by the Swiss National Science Foundation (SNSF) underthe project name DIPLOMAT.
11
Data fusion algorithm for the 3D-MFD estimation May 2017
7 References
Ambühl, L. and M. Menendez (2016) Data fusion algorithm for macroscopic fundamentaldiagram estimation, Transportation Research Part C: Emerging Technologies, 71, 184–197,oct 2016, ISSN 0968090X.
Chiabaut, N. (2015) Evaluation of a multimodal urban arterial: The passenger macroscopicfundamental diagram, Transportation Research Part B: Methodological, 81, 410–420, ISSN01912615.
Courbon, T. and L. Leclercq (2011) Cross-comparison of macroscopic fundamental diagramestimation methods, Procedia - Social and Behavioral Sciences, 20, 417–426, ISSN 18770428.
Daganzo, C. F. and M. J. Cassidy (2008) Effects of high occupancy vehicle lanes on free-way congestion, Transportation Research Part B: Methodological, 42 (10) 861–872, ISSN01912615.
Daganzo, C. F. and N. Geroliminis (2008) An analytical approximation for the macroscopicfundamental diagram of urban traffic, Transportation Research Part B: Methodological, 42 (9)771–781, ISSN 01912615.
Dakic, I. and A. Stevanovic (2017) On development of arterial fundamental diagrams based onsurrogate density measures from adaptive traffic control systems utilizing stop-line detection,Proceedings of the 22nd International Symposium on Transportation and Traffic Theory.
Du, J., H. Rakha and V. V. Gayah (2016) Deriving macroscopic fundamental diagrams from probedata: Issues and proposed solutions, Transportation Research Part C: Emerging Technologies,66, 136–149, may 2016, ISSN 0968090X.
Edie, L. (1961) Car-following and steady-state theory for noncongested traffic, Operations
Research.
Eichler, M. and C. Daganzo (2006) Bus lanes with intermittent priority: Strategy formulae andan evaluation, Transportation Research Part B: Methodological.
Geroliminis, N. and C. F. Daganzo (2008) Existence of urban-scale macroscopic fundamentaldiagrams: Some experimental findings, Transportation Research Part B: Methodological,42 (9) 759–770, ISSN 01912615.
Geroliminis, N., N. Zheng and K. Ampountolas (2014) A three-dimensional macroscopicfundamental diagram for mixed bi-modal urban networks, Transportation Research Part C:
Emerging Technologies, 42, 168–181, may 2014, ISSN 0968090X.
12
Data fusion algorithm for the 3D-MFD estimation May 2017
Guler, S. and M. Menendez (2014a) Evaluation of Presignals at Oversaturated SignalizedIntersections, Transportation Research Record: Journal of the Transportation Research
Board, 2418, 11–19, dec 2014, ISSN 0361-1981.
Guler, S. I. and M. Menendez (2014b) Analytical formulation and empirical evaluation ofpre-signals for bus priority, Transportation Research Part B: Methodological, 64, 41–53, jun2014, ISSN 01912615.
He, H., S. I. Guler and M. Menendez (2016) Adaptive control algorithm to provide bus prioritywith a pre-signal, Transportation Research Part C: Emerging Technologies, 64, 28–44, mar2016, ISSN 0968090X.
He, H., M. Menendez and I. S. Guler (2017) Analytical evaluation of flexible sharing strategieson multi-modal arterials, Proceedings of the 22nd International Symposium on Transportation
and Traffic Theory.
Herman, R. and I. Prigogine (1979) A Two-Fluid Approach to Town Traffic, Science, 204 (4389)148–151, ISSN 0036-8075.
Leclercq, L., N. Chiabaut and B. Trinquier (2014) Macroscopic Fundamental Diagrams: Across-comparison of estimation methods, Transportation Research Part B: Methodological,62, 1–12, ISSN 01912615.
Nagle, A. S. and V. V. Gayah (2014) Accuracy of Networkwide Traffic States Estimated fromMobile Probe Data, Transportation Research Record, 2421 (2421) 1–11, ISSN 0361-1981.
Ortigosa, J., N. Zheng, M. Menendez and N. Geroliminis (2017) Traffic performance androad space allocation in multimodal urban networks with an MFD representation, 96th
Transportation Research Board Annual Meeting (TRB), Washington D.C.
Wirasinghe, S. and V. Hurdle (1977) Optimal parameters for a coordinated rail and bus transitsystem, Transportation.
Zheng, N. and N. Geroliminis (2013) On the distribution of urban road space for multimodalcongested networks, Procedia-Social and Behavioral Sciences.
13