Embed Size (px)
Citation preview

ACCOMODATING GROWTH
STR
EET
SMA
RTS:
R
EPO
RT
OF
THE
CO
MM
ISSI
ON
ON
TH
E FU
TUR
E O
F LO
ND
ON
’S R
OA
DS
AN
D S
TREE
TS

Street smarts, n.Pronunciation: /’stri:t ,sma:ts/InformalThe experience and knowledge necessary to deal with the potential difficulties or dangers of life in an urban environment.

Published by Centre for London, October 2017
STREET SMARTS: REPORT OF THE COMMISSION ON THE FUTURE OF LONDON’S ROADS AND STREETS Silviya Barrett, Martin Wedderburn, Tom Colthorpe on behalf of The Commission on the Future of London’s Roads and Streets, chaired by Sir Malcolm Grant
Open Access. Some rights reserved.
As the publisher of this work, Centre for London wants to encourage the circulation of our work as widely as possible while retaining the copyright. We therefore have an open access policy which enables anyone to access our content online without charge. Anyone can download, save, perform or distribute this work in any format, including translation, without written permission. This is subject to the terms of the Centre for London licence.
Its main conditions are:
· Centre for London and the author(s) are credited · This summary and the address centreforlondon.org are displayed · The text is not altered and is used in full · The work is not resold · A copy of the work or link to its use online is sent to Centre for London.
You are welcome to ask for permission to use this work for purposes other than those covered by the licence. Centre for London gratefully acknowledges the work of Creative Commons in inspiring our approach to copyright.
To find out more go to creativecommons.org
Published by: Centre for London 2017 © Centre for London. Some rights reserved. 32 - 33 Hatton Garden London , EC1N 8DL T: 020 3757 5555 [email protected] centreforlondon.org Company Number: 8414909 Charity Number: 1151435

About Centre for London
We are London’s think tank.Our mission is to develop new solutions to London’s critical challenges and advocate for a fair and prosperous global city.
We are a politically independent charity.We help national and London policymakers think beyond the next election and plan for the future.
We have ideas with impact.Through research, analysis and events we generate bold and creative solutions that improve the city we share.
We believe in the power of collaboration.We bring together people from different parts of the city - with a range of experience and expertise - to develop new ideas and implement them.
As a charity we rely on the support of our funders.Our work is funded by a mixture of organisations and individuals who share our vision for a better London.
Find out more at centreforlondon.org


v
Preface
Ben Rogers, Director, Centre for LondonWe at Centre for London are delighted to have been able to convene and support this important Commission. London’s roads and streets make a vital contribution to the capital’s economy, community life, public health and wellbeing. As such, they are at the very centre of our concern. And as the Commission sets out, London has taken steps to address congestion and pollution, and to create a safer and more inviting public realm. But we have much further to go. Congestion and pollution will only get worse as London’s population grows unless we adopt new policies and approaches. London tends to score badly on measures of liveability. Tackling this is imperative if London is going to sustain and build on its standing as great world city – a particularly urgent priority post-Brexit.
This report comes at an opportune time. The Mayor, Sadiq Khan, has recently launched a draft Transport Strategy for consultation, alongside draft Environment and Housing Strategies. The Commission welcomes the Transport Strategy’s ambitious, if high level, objectives around cleaning up London’s air, reducing reliance on private cars and promoting the use of public transport, walking and cycling. The Commissioners’ radical but practical recommendations show how the Mayor’s objectives can be realised.
I would like to thank all of the Commissioners for their hard work and Malcolm Grant in particular, for chairing the Commission so well. I’d also like to thank the Commission’s supporters and sponsors, without whom the project would never have been possible.
Over the next months and years, Centre for London will build on the work of the Commission, promoting its vision, championing its recommendations, and developing its thinking. We look forward to working with the Mayor, Transport for London, the boroughs and everyone who loves London and wants to see it become a more welcoming, healthier and attractive city.


vii
The CommissionersThe Commission was chaired by Sir Malcolm Grant, Chair of NHS England. The other members of the Commission were:
1— Prof Peter Bishop, Professor of Urban Design, The Bartlett School of Architecture, University College London
2— Patricia Brown, Director, Central
3— Dr Ellie Cosgrave, Lecturer in Urban Innovation and Policy, University College London
4— Prof Peter Jones OBE, Professor of Transport and Sustainable Development, University College London
5— Prof Frank Kelly, Professor of Environmental Health, King’s College London
6— Nick Lester-Davis, Director, Nick Lester-Davis Consultancy, and Vice Chair, ERTRAC
7— Tony Meehan, Transportation Consultancy, Practice Director, Atkins
8— Prof David Metz, Honorary Professor, Centre for Transport Studies, University College London

ix
About the Commission and acknowledgements
This is the final report of Centre for London’s independent, expert-led Commission on the Future of London’s Roads and Streets. The Commission set itself the task of developing fresh thinking and making recommendations on how London could best manage the conflicting pressures on its roads and streets, address challenges of congestion, air pollution, road safety and poor quality of place, and make the most of the opportunities presented by new technology.
The Commission met five times between February and September 2017. Its deliberations were informed by:
• Submissions received to a public call for evidence.
• A roundtable with business representatives, hosted by London First.
• Targeted engagement with a wide range of stakeholders, including road user groups, campaign organisations, charities, businesses, politicians and academics.
Our call for evidence elicited a total of 48 submissions from a variety of organisations, bodies and individuals. These included responses from six London boroughs, 12 business representatives (from sectors including logistics, retail and construction), five campaign groups, three membership groups, three architects/planners, three business organisations, two bus operators, a car club company and private hire company and eight individuals.
The Commission would like to thank everyone who submitted evidence and engaged with its work. We are particularly grateful to Valerie Shawcross, Deputy Mayor for Transport, and Leon Daniels, Managing Director, Surface Transport, at Transport for London, and their teams, for their support and

x
input throughout the Commission’s work. We are also grateful to King’s College London for hosting the Commission’s meetings.
This report has been generously supported by Chris Rokos and sponsored by Thales, Canary Wharf Group, Atkins and Future Cities Catapult. This project would not have been possible without them.
Commissioners would like to thank the team at Atkins for in-kind research support, particularly Mike Frobel, Principal Engineer, Transportation, and Nathan Watt, Intelligent Transport Systems Consultant, and the team at Centre for London who provided the secretariat. Any errors and omissions in the report remain solely those of the authors. The arguments and analysis contained in the report are those of the Commission and don’t necessarily reflect those of the funders.
Secretariat
The secretariat was led by Silviya Barrett, with help from Tom Colthorpe, and Martin Wedderburn, a transport expert and Associate of Centre for London.
Silviya BarrettSilviya Barrett is a Research Manager at Centre for London and works on projects on a wide range of policy issues. Prior to joining the Centre, Silviya worked at the London Chamber of Commerce and Industry, where she managed the research and survey programme and authored reports on issues affecting London businesses, including housing and construction skill shortages, immigration and skills, and fiscal devolution. Silviya holds a Master’s degree in European Studies from King’s College London and a BA (Hons) degree in International Relations and Management from Regent’s American College London.
Martin WedderburnA Centre for London Associate, Martin is an independent transport planning consultant. He has

xi
clients internationally, and strives to ensures that the full spatial, wider economic, social and environmental impacts of transport are assessed. Martin holds a BSc (Hons) Transport Planning from Loughborough University, and MPhil Town and Country Planning from UCL Bartlett School. Current and recent projects in London include work on improved connectivity in Old Oak and Park Royal, the business case for the Rotherhithe-Canary Wharf crossing, and assessing options for public transport to support regeneration in Thamesmead.
Tom ColthorpeTom Colthorpe is a Researcher at Centre forLondon. His research interests include health policy and population health, urban transport planning, and issues surrounding social exclusion in a city context. Tom holds a BA (Hons) in Geography and an MSc in Evidence-Based Social Intervention and Policy Evaluation, both from the University of Oxford.


xiii
Foreword
Sir Malcolm Grant, Chair of the CommissionLondon’s roads and streets, built up over centuries, face unprecedented pressure today. With a larger population than ever before, and an increase in traffic of most types, many of London’s roads and streets are congested, polluting and poor quality places.
In response to this, Centre for London set up this Commission as an independent body to consider the challenges facing London’s roads and streets, to develop a compelling and comprehensive vision for change, and to recommend the packages of policies that could bring this vision about.
For while the challenges are large, so are the opportunities: public awareness of the environmental and public health impact of driving is growing, cities around the world have been experimenting with ways of reallocating road space and promoting active transport, and technological developments promise dramatic change in how mobility is provided to citizens.
As London’s growth continues, we need a fundamental reappraisal of how our roads and streets operate – not only as conduits for travel but also as public spaces, enabling activity and sociability, adding to the vitality of neighbourhoods, and creating a better city.
The recommendations made in this report will require political courage, investment and a long-term view. But London needs action now to preserve economic and social vitality, and environmental sustainability in the years to come. I am grateful to the experts who served on the Commission for giving so generously their expertise and wisdom, and for the liveliness of our debates that led to the conclusions and recommendations set out below.
I am also grateful to the funders who supported the Commission, and the teams at Centre for London and Atkins who provided administration and research support.
I commend the Commission’s findings to London and national government.


Summary 3
Introduction 9
1. Challenges and opportunities 13
2. Visions and objectives 27
3. Policy packages 37
Conclusion and recommendations 91
References 98


Summary

4
Highlighted five important developments that represent challenges to and opportunities for London’s roads and streets…
• Population growth: London’s population and its economy are continuing to expand, placing unprecedented demands on its finite system of roads and streets. At the same time, this growth could support a more extensive public transport service, stronger local economies and better local amenities, so lessening the need to travel.
• Equity and deprivation: Despite its wealth London has high and long enduring levels of deprivation and on some measures at least, inequality is growing. It has a significant population with physical and sensory impairments – including a growing population of older people – who can find moving around the city more difficult. The design and management of London’s roads and streets shapes these patterns of equality, deprivation and opportunity. Poorer Londoners are more likely to fall victim to air pollution, road accidents and street crime, and to live and work in places with poor quality public realm and transport connectivity.
• Quality of place: Roads and streets are not just transport corridors linking one part of the city to another. They also have a place function. People use them to do business, socialise, play, exercise, protest and celebrate. We have seen, over recent decades, a growing appreciation of the value of
Centre for London’s Commission on the Future of London’s Roads and Streets was set up to develop new thinking on what London could do to manage the conflicting pressures on the capital’s surface transport system and public realm, and how it can address the challenges it faces and make the most of its opportunities.
The Commission has:

5
the ‘place’ dimensions of roads and streets. As London’s population and density grows, a high quality public realm and local quality of life will become increasingly important to the economic and social life of the city.
• Health and wellbeing: London faces some major transport related public health challenges. Air pollution from vehicles has worsened in recent years and is doing real harm to Londoners’ health. The pervasive presence of cars and the neglect of the public realm have helped foster sedentary lifestyles, which have contributed to a growth in obesity and associated diseases. We still have an accident rate on our roads and streets that we would not tolerate in any other area of life. A move to a transport system that is less car-reliant and promotes more active travel would have large health benefits.
• New technologies: Technological advances are changing the way that people travel, communicate, live and work. Smart personal devices are making it easier for Londoners to plan routes and order services. New vehicle technologies could make London’s roads safer, more efficient and less polluting. The rise of new mobility services could expand choice, free up valuable kerb space and enable greater ride-sharing. But these new technologies could also provoke greater vehicle use and worsen congestion and pollution.
… set out a vision for London in 10-15 years…
• The Commission’s vision is for a London that is loved by its citizens and admired across the world for the way it enables easy, pollution-free and affordable movement around the city, the vitality of its neighbourhoods and the quality of its public realm.

6
… identified a range of tactical objectives to help achieve this vision…
• These include: reducing the impact of congestion; improving journey times and reliability; improving accessibility for different users; reducing air and noise pollution and CO2 emissions; reducing private car ownership and encouraging shared and active modes of travel; improving road safety; and improving the public realm and quality of place.
… and developed seven packages of policies to meet the objectives:
• Managing competing demands on road space by continuing to reallocate space to the most efficient, safest and least polluting users, and reforming and extending road pricing.
• Managing traffic flow by reforming traffic signals and integrating app-based devices; introducing a London Movement Code, to better guide the interaction between different road users; and implementing traffic restriction measures where these align with broader objectives.
• Managing kerb space by reducing space allocated to residential parking; and using dynamic pricing to better match supply and demand for non-residential kerb space and reduce searching traffic.
• Managing freight and servicing by encouraging both on- and off-site consolidation; introducing greater incentives for cleaner and safer fleets and exploring new delivery models to improve freight efficiency on the strategic road network; and developing a better understanding of the contribution of servicing trips to London’s traffic.
• Tackling air pollution by introducing a cashback diesel scrappage scheme; providing more charging

7
points for electric vehicles; and conducting more research into damaging particulate emissions from brakes and tyres – a source of pollution that needs more attention than it currently gets.
• Planning for good growth by ensuring spatial planning and urban design policies apply a set of strategic principles to actively promote non-car-dependent and healthy lifestyles, in densifying areas, especially Opportunity Areas; and by boroughs, the Mayor and Transport for London adopting design-led road upkeep and improvement programmes, with strong leadership from design advocates.
• Managing the arrival of new mobility services, by developing a smart ticketing and information platform; trialling a targeted Mobility as a Service (MaaS) subscription model; conducting a trial for a demand-responsive transport service; and developing appropriate regulation, including an automation strategy for London.


Introduction

10
Everyone who lives in, works in, or visits London depends on its roads and streets. They serve to move us around the city. They provide spaces where we can work, trade, meet, play, relax and exercise. They are vital to London’s ongoing success as a welcoming and creative global city.
In many respects London has, over recent years, done a good job in maintaining and improving its surface transport system. The capital has a uniquely rich and varied public realm. After decades of neglect, this has seen relatively large scale investment, with extensive programmes of traffic calming, pavement widening, tree planting and pedestrianisation. The capital has invested heavily in its rail services, so relieving demands on the road network, but also in bus services and cycling infrastructure. The Congestion Charge was widely acclaimed when it was first introduced, as an innovative and effective way of managing road space in a crowded city centre. As a result, more and more of us have given up on our private cars and are getting around on trains, buses and, to a lesser extent, by bicycle.
But as London’s population grows so its roads and streets are under intense and intensifying pressure. Congestion is on the rise. Air pollution, road safety and the cost of travel are all major public concerns. And too much of the capital’s public realm still feels undervalued and neglected – a state of affairs that could easily get worse as cuts to public funding continue to bite. While new technologies have made it easier, cheaper and more enjoyable to move around the city, they have also had unexpected and unwanted effects, including increased congestion.
Against this background, this report looks at new ways of tackling the challenges facing London’s roads and streets – including congestion, pollution, safety and poor quality of place – and making the most of the potential of new technology.
During the Commission’s deliberations, the Mayor published his draft Transport Strategy, alongside his draft Environment and Housing Strategies. Together they place a strong emphasis on creating a clean, safe, efficient and sustainable transport system, attractive and
This report looks at new ways of tackling the challenges facing London’s roads and streets – including congestion, pollution, safety and poor quality of place – and making the most of the potential of new technology.

11
walkable mixed-activity neighbourhoods, and a more reliable, enjoyable transport experience.
The draft Transport Strategy, of particular relevance, has three themes: (i) Healthy Streets and healthy people, (ii) a good public transport experience, and (iii) transport to support good growth. The Commission welcomes the powerful vision and the ambitious targets contained in this, and supports its commitment to tackling air pollution, promoting public and active travel over the private car and improving London’s street environment.
We hope that this report will help support the Mayor’s work and the work of the boroughs, by providing more detailed policy thinking than the necessarily high level Strategy provides and by addressing challenges and opportunities that perhaps need more attention than they get in the Strategy – notably the challenges and opportunities of new technology.
We also hope that this report helps identify and advances thinking on the difficult choices facing London — choices for instance, around the pricing of road use and parking. Facing up to these choices will not be painless, but the gains to the capital in doing so will be enormous.


1. Challenges and opportunitiesThis chapter explores the most important challenges and opportunities facing London’s roads and streets. We identify five developments in particular that are raising new issues and opening up possibilities for London’s surface transport system and public realm.

14
1.1 A Growing CityLondon’s population and economy have been growing. Its population has increased rapidly over the last two decades and is predicted to keep growing by roughly 100,000 people a year for the foreseeable future. Economic growth in London, meanwhile, was significantly higher – 27.1 per cent – from 2010-15 than any other region in the UK.1
The result of this growth in population and economic activity is that London’s surface transport systems have become increasingly congested and, without radical intervention, this congestion is only going to get worse, as London’s roads and streets have a finite capacity.
Vehicle journey times rose by an average of 12 per cent annually across central London between 2012 and 2015.2 Increased competition for carriageway space is illustrated by the rapid growth in cycling (133 per cent in the years 2000-15),3 with cyclists now making up over a quarter of all rush hour vehicle traffic in central London. And the competition for space does not stop at the kerb,4 with many of London’s pavements already crowded and demand set to grow. The arrival of the Elizabeth Line, for example, is expected to increase the capacity of the rail network to discharge pedestrians onto central London streets by 10 per cent.
The impact of congestion, however, is contested and dependent on how one measures it. There are broadly three ways to look at congestion:
• Speed of traffic and time spent in delays.
• Reliability of journey time, irrespective of speed.
• Proportion of trips caught up in delays caused by traffic.
On the one hand, journey speeds5 and total vehicle delays measured by minutes per kilometre are worsening,6 with the cost of vehicle delays expected to double by 2036.7 Journey time reliability has also

15
dropped.8 Many road users, including businesses involved in the consultation process, report that with tight delivery windows to meet, it is the unreliability of journeys and the uncertainty this causes, rather than the journey speeds and delays, that has the most severe impact of them.9 There is, however, a realisation from business membership organisations consulted by the Commission that if journey speeds continued to fall, this would also likely become an issue. Bus operations are also disproportionately affected by unreliability, which has been rising since 2013/14,10 and has meant operators are forced to use more buses to meet their schedules or turn buses around before the end of routes more frequently.
Yet London’s growth is also an opportunity. A larger population, living at higher densities and the economic growth it will bring with it, could support a more extensive public transport service, while sustaining stronger local economies and better local amenities, so lessening the need to travel. Indeed, congestion is already affecting a smaller proportion of trips and people, as travel time spent in a vehicle has fallen, and more trips are being made by public transport, walking and cycling. The percentage of journeys completed by car, as well as travel time spent as the driver or passenger of a car, have both fallen significantly over the last decade,11 although this is probably as a result of the shift away from car use generally.
So can we alleviate congestion? In the past, many suggested that the answer lay in increasing road capacity, but in cities with growing population numbers, this is unlikely to ease congestion in the long term, as more trips would likely be made by road users previously deterred by any expected time delays. Individuals are both price and time sensitive, and suppressed trips will be freed up when spare road space emerges. No matter what the capacity, congestion – as measured by journey speeds – reaches an equilibrium.12
However, we can reduce the impact of congestion by reducing the proportion of people it affects and also
A larger population, living at higher densities and the economic growth it will bring with it, could support a more extensive public transport service, while sustaining stronger local economies and better local amenities, so lessening the need to travel.

16
improving the reliability of journey times. Measures that encourage a higher use of active travel (i.e. walking and cycling) and more efficient modes (i.e. public transport) will reduce the proportion of car trips and, while delays from congestion may not reduce, fewer travellers will be affected by them and many of those remaining may find that alternatives will be more suitable for them in the long run.
Finally, it is important to remember that it’s not just road space that has come under increasing pressure in recent years, so has parking space—kerb-side space in particular. Drivers looking to leave a vehicle or make a delivery find it increasingly hard to secure a place to park. And as with road space, transport authorities face difficult choices between different demands when allocating kerb space. Different road users – taxis, private cars, delivery and service vehicles, motor cyclists and cyclists, pedestrians – all lay claim to it. And there are many alternative uses for converted parking spaces, from wider pavements to servicing facilities cycle lanes.
1.2 Equity and DeprivationThough London is a rich city, it is very far from an equitable one.
The capital has long had high levels of deprivation and this remains the case today – roughly a third of London’s children grow up in poverty, compared to around a quarter across the UK as a whole.13 Moreover, on many measures, inequality and poverty have worsened over the last decade. The growing housing shortage has led to a widening wealth gap between (mainly older) people, who own property and (mainly younger) people, who do not.14 Living costs, especially housing costs, have gone up much faster than earnings and welfare benefits, putting huge pressure on household budgets.15 And there are good reasons for thinking that these trends are likely to continue, as population growth pushes up living costs and public spending cuts intensify. If Brexit weakens the London economy, as most economists predict, this is likely to
17
make things even tougher for disadvantaged Londoners.The design and management of London’s roads
and streets, along with its broader transport system, shape patterns of equity, opportunity and deprivation in many ways. Transport costs are high and make up a sizeable proportion of many household budgets. Poorer Londoners are more likely to fall victim of air pollution16
and road accidents,17 and to live and work in places with poor quality public realm, and transport connectivity.18
Another aspect of equity and disadvantage is related to disability and reduced mobility. For many years, most public transport was profoundly inaccessible to physically disabled people because of the use of steps or stairs. Although much has been done to improve accessibility, this process is not yet complete. At the same time the number of Londoners with disabilities is likely to grow as London’s population ages. For both older and younger Londoners who are not fully mobile, there are challenges with moving around the city and having access to services. The design and management of roads and streets will shape their ability to move around the city.
For all the progress made by women in recent decades, they continue to remain disadvantaged in many respects. London’s women, for instance, earn less through their life time than men,19 are more likely to live in poverty,20 and take on more than their fair share of domestic caring duties. They can feel less safe using public transport and streets, parks and other public spaces in London. Our transport system and roads and streets need to be designed and managed to cater to the particular needs of London’s women — including distinct and more local travel patterns21 — and, as far as possible, address rather than exacerbate gender-based inequalities.
Against this background, the Commission took issues of equity, opportunity and deprivation very seriously. Our recommendations are designed to ensure a fair distribution of costs and benefits and promote economic and social inclusion.
The design and management of London’s roads and streets, along with its broader transport system, shape patterns of equity, opportunity and deprivation in many ways.
The Commission took issues of equity, opportunity and deprivation very seriously. Our recommendations are designed to ensure a fair distribution of costs and benefits and promote economic and social inclusion.

18
1.3 Roads and Streets as PlacesRoads and streets are not just conduits of movement for people and vehicles, but also places where people play, exercise, socialise, interact and trade (see Figure 1).
Too often in the past, however, planners and policy makers have prioritised the transport function of roads and streets to the neglect of their place function.
The public realm has always been important to cities, but it is becoming more so. London has placed a much higher value on public realm and social spaces over the past decade or so, with differently designed roads and places, and an appetite for occupying the city in a different way. As the city grows, and density increases, the availability of public outdoor space becomes more important.
The economic value of investment in public realm improvements is increasingly recognised. For example, it has been reported that better quality design can increase property and land values, rental yields, retail footfall, and consumer spend.22 It is sometimes argued that businesses oppose moves to curtail car use and tame traffic movement, but London’s leading developers invest heavily in creating attractive public realm, with car free or car-light environments in their own developments, because they understand that is what occupiers want. Yet London consistently ranks poorly when it comes to the quality of its roads and streets. Low scores in these areas was a main factor in London ranking 40th globally in Mercer’s 2017 Quality of Living Ranking.23
It is not that we fail to spend money on our roads and streets. TfL and the boroughs spend large amounts on highway maintenance, safety schemes, paving, and layout and junction modification. These are, however, not viewed as design or public realm projects but as purely engineering solutions. Components of good urban design are well understood and codified in numerous manuals and reviews, but good public realm cannot be guided purely by manuals and codes – it requires good designers. Urban design capacity at the local level is therefore another challenge that needs to be addressed.

19
Figure 1: Conflicting demands on roads and streets as conduits of movement and places
All figures from London Travel Demand Survey (LTDS), for 2015/16
1. Actual figure likely to be higher as LTDS only surveys London residents 2. Daily trip numbers are currently unavailable for freight, servicing and utilities, but more information
on the freight aspect can be found at: Allen, J. et al (2016)24
3. Includes 4.54m as drivers, 2.29m as passengers
Mov
emen
t
Emergency ServicesNeed fast and reliable access
Cyclists (464,000 trips per day)Need safe roads and parking
Taxi and private hire passengers (294,000 trips per day)1
Need journey reliability and waiting bays
Pedestrians (5.5m trips per day)Need safe and pleasant streets with convenient crossings
Bus and tram passengers (2.71m trips per day)Need journey reliability
Motorcycle drivers (93, 000 trips per day)Need safe roads and parking
Freight, servicing and utilities2
Need journey reliability and loading bays
Private vehicles drivers and passengers (7.07m trips per day)3
Need journey reliability
Pla
ce
Sit and relax
Socialise
Play and exercise
Sightseeing and cultural activity
Shop
Commercial and market activity
Civic and political activity

20
1.4 Healthy Streets, Healthy PeopleLondon faces some big public health challenges and the way we use our roads and streets plays a major role in them. We distinguish four ways in particular in which the way we plan, design and manage our roads and streets shapes our health.
First, traffic collisions have long been an important source of serious injury and death. In 2015, there were 2,092 people killed or seriously injured on London’s roads, equating to nearly six every day, half of which were pedestrians or cyclists.25 Our apparent acceptance of injury and death from motor vehicles now stands in stark contrast to our attitude to what we will tolerate in other contexts. Construction companies, for instance, and airline businesses now adhere to zero-harm policies – they take the view that no serious injuries or death are acceptable.
Second, transport-related air pollution has emerged as a very significant health concern – approximately half of air pollution in London is estimated to stem from road transport.26 While the concentrations of some air pollutants have fallen recently, there are a number of regulatory breaches in London’s air in terms of nitrogen dioxide (NO2) and particulate matter (PM).27, 28
There are both European Union (EU) and World Health Organisation (WHO) limits and guidelines for acceptable levels of each pollutant, as shown in the table on the following page.29 The Government suggests that 48 major roads in London alone breach legal limits for NO2 (although data quality issues mean this figure may be an underestimate).30
There are a number of studies which link exposure to NO2 and increasingly PM, even for a short period, to a range of serious illnesses and adverse health effects, increased hospital admissions and higher mortality rates.31
Actual and perceived air quality is a significant determinant of life satisfaction for Londoners,32 indicating improving air quality and perceptions of it would be important to attract people to the city, as well as improving the quality of life for current Londoners.
London faces some big public health challenges and the way we use our roads and streets plays a major role in them.

21
Electric vehicles offer an opportunity to improve air quality, since they produce less pollution at source than diesel or petrol ones. As a result, government and transport authorities are trying to promote their take up. But even these produce harmful particulate emissions from brake, tyre and road wear.
Third, transport choices determine levels of physical activity, which in turn shapes both our physical and mental health. Half of the top 12 causes of illness and early death in Londoners relate to, or are exacerbated by, physical inactivity and encouraging active travel can help with the broader health needs of the population.33 While 32 per cent of adult males and 47 per cent of females do not meet minimum physical activity levels, this problem is even more acute for children: 76 per cent of boys and 78 per cent of girls are not active enough.34 The latest figures for the 2015-16 school year for London school children show that 21.9 per cent of those in reception, and 38.1 per cent of those in year six, are overweight or obese.35 This is a public health time bomb.36 While most school children live within walking distance of their school, less than half (43.7 per cent) actually do walk, while only 2.6 per cent cycle.37
People who own cars are less likely to be active,38 so creating environments where people need to walk or cycle as part of their daily lives will contribute to lowering high levels of obesity and inactivity. Currently only an average of 28 per cent of travel time is spent walking or
Pollutant EU limit WHO guidelines
NO2
200 µg/m3 – 18 hourly exceedances per year
40 µg/m3 – annual average
Same as EU values
PM10
50 µg/m3 – 35 hourly exceedances per year
40 µg/m3 – annual average
Same as EU value
20 µg/m3 – annual average
PM2.520 µg/m3 – annual average 10 µg/m3 – annual average
Source: European Commission (2016)

22
cycling.39 Yet, nearly half of car trips made by London residents could be cycled in around 10 minutes and more than a third of car trips could be walked in under 25 minutes.40 The Greater London Authority (GLA)estimates that there is potential for the proportion of travel time spent walking or cycling to more than double to 60 per cent. If this is achieved, it would deliver a health benefit of 61,500 life years and an economic benefit of £2.2bn per annum.41
Finally, roads and streets shape social interactions in a way that can affect our health. There is a rich body of research demonstrating the way in which the design of cities and the management of traffic affects crime,42 neighbourly relations and other aspects of social capital, and well established evidence of relations between social capital and human health and well-being.43
Relying solely on technology and the electrification of the vehicle fleet will not address the multi-faceted nature of London’s health crisis. Moving to a transport system that is less car-reliant and promotes more active travel would have large health benefits.
1.5 Harnessing Technological InnovationTechnology has always been a major determinant in how we move around. Just think about the way in which the development of the steam engine and then road-based combustion engines led to the development of suburbs. Transport is now being revolutionised by a new wave of technologies – and ones that will have profound, perhaps particularly acute, implications for cities. The way we use technology sits within a wider societal shift away from a culture of owning goods to a digital and sharing economy. Rapid technological development is disrupting traditional transport markets, revolutionizing information and sales channels, and creating entirely new supply chains.
There are two main interlinked developments that are impacting and will impact roads and streets: Mobility as a Service (MaaS) and Connected and Autonomous Vehicles (CAVs). Both of these are at their early stages of development and deployment, but are starting to, and
Currently 28 per cent of travel time is spent walking or cycling.Yet, nearly half of car trips made by London residents could be cycled in around 10 minutes and more than a third of car trips could be walked in under 25 minutes.
Transport is now being revolutionised by a new wave of technologies – and ones that will have profound, perhaps particularly acute, implications for cities.

23
have the potential to, transform the way we move around our cities, necessitating action now if we are to influence their effects.
Digital technology is already making it much easier to plan and personalise our journeys. We can map a route, call up a cab, unlock a car club car or pay for a bus or train with a smart phone or other digital device. The same technology allows us to access live updates while we are travelling and adapt our route accordingly, allowing for work, entertainment, or socialising on the journey. One result is that private cars are not as useful or as alluring as they once were – especially in a city like London with good public transport. We are moving from a world of mobility as a product – the private car – to Mobility as a Service, and car ownership in London has fallen accordingly.44
It is estimated that by 2030 the value of the Mobility as a Service sector globally will exceed $1tn.45 London is already home to several important players in the MaaS sector and a continued open data policy and tech-friendly stance could enable the capital to maintain or advance its position – to the benefit of London’s transport users but also to its engineering and transport businesses, who can sell the services they develop in London around the world.
Autonomous vehicles (AVs) are intended to be capable of safely completing journeys without the need for a driver. Advanced driver assistance systems, a step towards autonomy, are already available, and include self-parking, lane control and autonomous emergency braking systems.
Connected vehicle technologies, meanwhile, allow vehicles to communicate with one another or with highway infrastructure and other appropriate technologies.
Connected and autonomous vehicle technologies are not necessarily reliant on one another. However, combining the connected and autonomous elements within vehicles potentially allows for safer, quicker and more efficient vehicle movement.
We are moving from a world of mobility as a product – the private car – to Mobility as a Service and car ownership in London has fallen accordingly.

24
Figure 2: What a future Mobility as a Service (MaaS) system could look like
5 step core MaaS Connect customer journey
Source: Atkins
Daniel and Hannah need to get their daughter to school for 8:30am.
'One Journey' — an integrated transport information and payment system — provides a status update and suggest the best alternative, based on our preset preference (e.g. speed, comfort, mode).
Plan journey A to B
Alternative options are available: take a short bus from a stop 8 mins from home, or access a local carclub car, which can be left near to school or at the train station.
Simply tap in and out with smartphone (or card).
Your optimal journey
'One Journey' gives Daniel and Hannah continuous information on where to go to connect between different transport types, and live wait times.
'Frictionless' journeys make it easier to choose public transport over car.
Easy wayfinding i
'One Journey' features auto-rerouting and delay repayment.
If Daniel’s train is delayed, he will be notified and offered suggestions on how to proceed.
Re-routing
Daniel and Hannah's subscription covers end-to-end journeys; changing to bus, tram or bike is simple.
No need to worry about cash or the cost of a bus.
Full journey covered

25
All of these new transport technologies promise potential benefits. They should make it easier to make informed travel choices and move around the city in less expensive, and more efficient, productive, enjoyable and safer ways. They promise to lessen the need for space-greedy private cars and promote shared or public forms of transport. But they also bring potential challenges. In making it easier and cheaper to move around in cars, they could encourage car use and so contribute to congestion and pollution – witness the increase in use of private cabs with the advent of Uber and similar services – and discourage walking and cycling for some trips. Mobility as a Service models also challenge some of the traditional structures of transport ownership, operation and regulation.

2. Visions and objectivesBased on the Commission’s remit and the developments, challenges and opportunities laid out in Chapter 1, the Commission has formulated a vision of what London should look like in 10-15 years’ time and a set of objectives for its roads and streets.
28
2.1 A vision for LondonThe Commission’s vision is for a London that is:
Loved by its citizens and admired across the world for the way it enables easy, pollution-free and affordable movement around the city, the vitality of its neighbourhoods and the quality of its public realm.
To make this vision a reality, we need a package of measures that achieve the following tactical objectives:
• Reducing the impact of congestion.
• Improving journey times.
• Improving journey reliability.
• Improving accessibility for diverse users.
• Reducing air and noise pollution and CO2 emissions.
• Reducing private car ownership.
• Encouraging active modes of travel.
• Improving road safety.
• Improving the public realm and quality of place.
In order to achieve these objectives, we need a wide mixture of policies at different levels of governance, which are grouped under seven headings and discussed in Chapter 3.
• Managing competing demands for road space.
• Managing traffic flow.
• Managing the kerb space.
29
• Freight and servicing.
• Tackling air pollution.
• Planning for good growth.
• Maximising the benefits of new mobility services.
The policy packages are mainly aimed at boroughs, Transport for London (TfL), the Mayor and national government, although we recognise that there is also a role the private sector, the third sector and civil society in realising our vision for London’s roads and streets. We also recognise that while our recommendations are focused on the design and management of London’s roads and streets, further enhancements to London’s rail services, as well as utilising the capacity of the river where appropriate, are needed to relieve pressure on the capital’s road network.
2.2 A vision for different parts of LondonDifferent areas of London face distinct challenges and the way that the above policies are applied will need to be tailored to suit individual circumstances. Below, we briefly examine what the vision means for the following geographical areas:
• Central London
• Urban residential
• Urban town centres and main roads
• Suburban residential
• Suburban town centres
• Suburban main roads
30
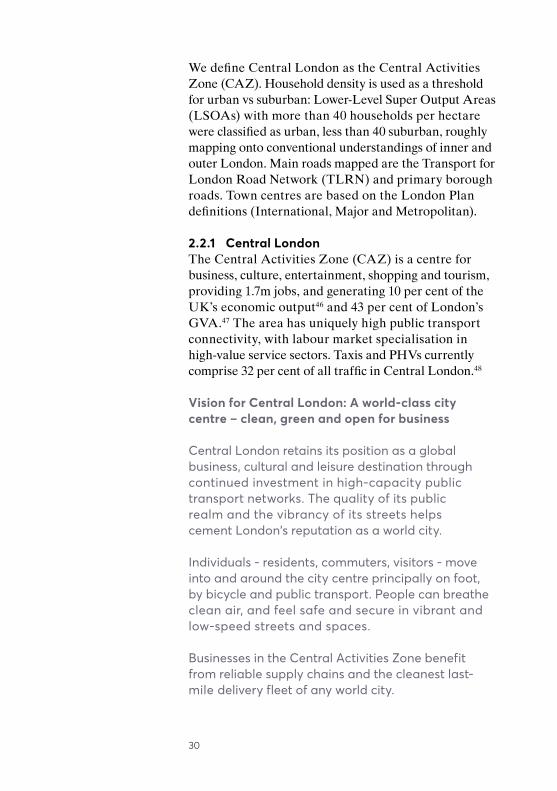
We define Central London as the Central Activities Zone (CAZ). Household density is used as a threshold for urban vs suburban: Lower-Level Super Output Areas (LSOAs) with more than 40 households per hectare were classified as urban, less than 40 suburban, roughly mapping onto conventional understandings of inner and outer London. Main roads mapped are the Transport for London Road Network (TLRN) and primary borough roads. Town centres are based on the London Plan definitions (International, Major and Metropolitan).
2.2.1 Central LondonThe Central Activities Zone (CAZ) is a centre for business, culture, entertainment, shopping and tourism, providing 1.7m jobs, and generating 10 per cent of the UK’s economic output46 and 43 per cent of London’s GVA.47 The area has uniquely high public transport connectivity, with labour market specialisation in high-value service sectors. Taxis and PHVs currently comprise 32 per cent of all traffic in Central London.48
Vision for Central London: A world-class city centre – clean, green and open for business
Central London retains its position as a global business, cultural and leisure destination through continued investment in high-capacity public transport networks. The quality of its public realm and the vibrancy of its streets helps cement London’s reputation as a world city.
Individuals - residents, commuters, visitors - move into and around the city centre principally on foot, by bicycle and public transport. People can breathe clean air, and feel safe and secure in vibrant and low-speed streets and spaces.
Businesses in the Central Activities Zone benefit from reliable supply chains and the cleanest last- mile delivery fleet of any world city.

31
Fig
ure
3: M
ap
of d
iffe
rent
typ
es o
f are
as
in L
ond
on
Cen
tral
Lon
don
Urb
an
Sub
urb
an
Riv
ers
and
larg
e gr
een
spac
es
Tow
n C
entr
e
Roa
ds

32
2.2.2 Urban residentialMostly across inner London, these are areas with higher household densities made up mainly of terraced housing and flats.
Vision for Urban London residential: Healthy urban living
The dense residential streets of Urban London have adapted to new technologies and mobility services. Residents enjoy an expanded green and welcoming public realm, with a good range of shops and other services and amenities in walking and cycling distance, excellent public transport connections and access to cars and taxis when required.
Private car ownership is reduced, with a reliance on car sharing and car clubs when a car is needed. Residential parking spaces have been converted into other uses, including wider pavements, green space and cycling infrastructure. The impact of through traffic on residents’ lives is minimised.
New development is high density and mixed use, and designed around walking, cycling, public transport and new mobility services.
2.2.3 Urban town centres and main roadsUrban London contains a number of Major and Metropolitan town centres, which tend to coincide with main roads and which are well served by public transport.
These areas share many of the same issues as central London: congestion, poor air quality and noise pollution, delays to bus services, road user conflicts, and competition for kerbside parking and loading.
33
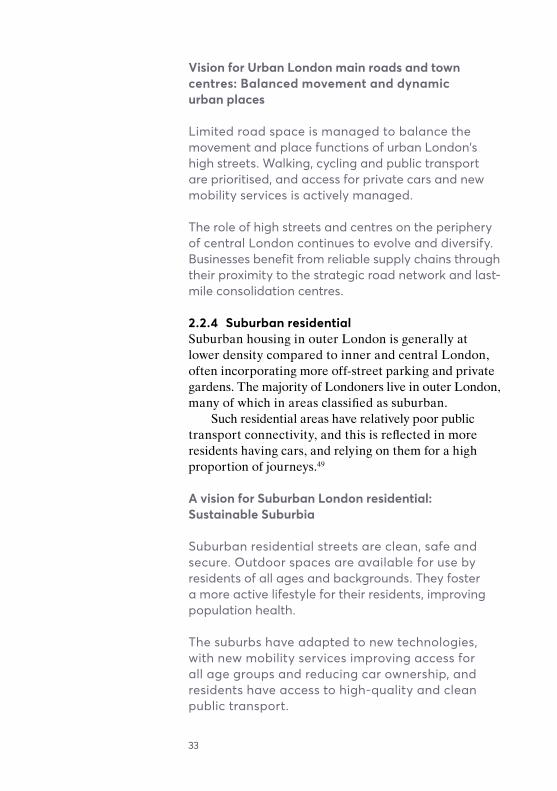
Vision for Urban London main roads and town centres: Balanced movement and dynamic urban places
Limited road space is managed to balance the movement and place functions of urban London’s high streets. Walking, cycling and public transport are prioritised, and access for private cars and new mobility services is actively managed.
The role of high streets and centres on the periphery of central London continues to evolve and diversify. Businesses benefit from reliable supply chains through their proximity to the strategic road network and last-mile consolidation centres.
2.2.4 Suburban residentialSuburban housing in outer London is generally at lower density compared to inner and central London, often incorporating more off-street parking and private gardens. The majority of Londoners live in outer London, many of which in areas classified as suburban.
Such residential areas have relatively poor public transport connectivity, and this is reflected in more residents having cars, and relying on them for a high proportion of journeys.49
A vision for Suburban London residential: Sustainable Suburbia
Suburban residential streets are clean, safe and secure. Outdoor spaces are available for use by residents of all ages and backgrounds. They foster a more active lifestyle for their residents, improving population health.
The suburbs have adapted to new technologies, with new mobility services improving access for all age groups and reducing car ownership, and residents have access to high-quality and clean public transport.

34
New suburban communities with a mix of housing, work and amenity space have been developed. Residents can walk or cycle to day-to-day services and amenities.
2.2.5 Suburban town centresSuburban town centres are characterised by concentrated retail, leisure and service floorspace, with a large catchment area and good connections to road and public transport networks.
There is a conflict between the vehicle movement and place functions supported by town centres: they need to be easily accessible, but also attractive so people still want to spend time (and money) there.50 But reducing car access, if managed in conjunction with other policies, can boost trade and economic vitality.
A vision for Suburban London town centres: Dynamic and adaptable hubs
While the role of high streets continues to evolve, Suburban London’s town centres are attractive, busy and prosperous.
Suburban town centres are designed around pedestrians, cyclists and public transport and can accommodate new mobility services. They are clean, attractive and well designed.
Active town centre partnerships help coordinate efficient and clean delivery and servicing activities.
2.2.6 Suburban main roadsThere are a number of main roads in London’s suburban areas, operated by TfL and the boroughs, which have ‘low place, high movement functions51 – these tend to be heavily geared towards motor vehicle travel. They are used throughout the day, not just in traditional peak periods. In some cases, the areas along these corridors are relatively well connected to public transport.

35
Congestion on these main roads is an increasing problem, and they are often pollution hotspots – research suggests they will face a big challenge to reduce emissions to EU limits.52
A vision for Suburban London main roads: Highways for a new millennium
London’s strategic road network is managed in line with a clear road user hierarchy, and successful demand management guarantees reliable journeys for essential freight and servicing activities.
The adverse noise and pollution impacts of the strategic road network on surrounding communities are minimised through a combination of mitigation measures and demand management.
A comprehensive network of high quality walking and cycling links along and across the strategic network reduces severance effects and minimises local car trips on these roads.


3. Policy packagesThis chapter sets out in more detail the seven packages of policies and specific measures required to achieve our overall vision for London and how they would need to be applied in different types of locations, as well as options for their implementation.
38
3.1 Managing competing demands for road spaceWith London’s population expected to exceed 10 million by 2040, there will be increasing demands on the road space and the capital will have to find ways of managing this.
3.1.1 Wider roads and new roadsAs already set out in our earlier discussion, the Commission does not believe that creating additional road capacity in a crowded city like London is an effective way to alleviate congestion. Experience shows that it merely unlocks suppressed demand and increases vehicle use (see Section 1.1).
Extracting additional capacity for certain vehicle classes from the existing road network is a possibility. For example, relatively small infrastructure changes (e.g. bridge heights) could assist freight vehicles in accessing certain sections of the strategic road network. Or changes to certain junctions could enable the creation of high quality bus rapid transit corridors.
There might also be the case for new road schemes to shift demand away from particular stress points or connect new developments to the larger road network. The Commission takes the view that new road capacity in London should only be considered if it meets certain criteria:
• The new infrastructure is intended to provide significant environmental improvements to a particular location without downgrading others;
• Legal air quality limits are met, and there is no significant adverse air quality impact in sensitive locations;
• The impact of any increase in general traffic on accessibility for pedestrian and cyclists, and on public transport operations can be fully mitigated;

39
• The proposal includes adequate mechanisms to mitigate any negative impacts on the surrounding areas.
In addition, consideration should be given to ensuring that future road infrastructure can be funded by users and beneficiaries without subsidy from TfL fares or general taxation wherever possible.
3.1.2 Prioritising usersIf London cannot build its way out of growing congestion, how can it tackle it? One approach that the capital has used to considerable effect over recent years is to allocate priority to more efficient and less polluting modes of transport. Like some other transport authorities, TfL has developed a ‘road user hierarchy’ as a device to guide allocating road space (see below). The Commission supports the principle of a road user hierarchy but believes that the one currently used by TfL needs to be updated to take into account new and emerging mobility services, new transport choices, and to differentiate between the capacity and efficiency of various types of freight vehicles.
Road user hierarchies
Over recent years transport planners have developed the tool of a ‘road user hierarchy’ to guide the allocation of road space. A road user hierarchy typically prioritises pedestrians, cyclists, public transport users, freight and then private motorised vehicles. The hierarchy set out below is a basic one. TfL uses a classification of roads and streets based on their movement and place functions (see Section 3.6) that seeks to adapt the concept of a hierarchy to different character areas.53

40
3.1.3 PedestriansThe continued reallocation of road space in central London will be necessary to accommodate increasing volumes of pedestrians, especially around key tube and rail stations. Section 3.2 on traffic management looks at further measures to restrict motorised traffic in these areas, while Section 3.6, on planning for good growth, recommends measures to prioritise well-designed, high-quality public spaces that are attractive environments for pedestrians.
3.1.4 Cyclists and busesFurther allocation of road space to safe cycling corridors and high-quality bus priority will also be required to achieve the mode shift necessary to tackle London’s growing congestion problem. When it comes to buses, we need to see radical improvements in bus journey speed and reliability, and a substantial increase in bus trips across London. The Commission believes more advanced forms of bus priority will be needed to achieve these objectives. The draft Mayor’s Transport Strategy
Figure 4: Road user hierarchy (in descending order of priority)
Pedestrians A dense network of footways, crossings on desire lines and footpaths
CyclistsA comprehensive network of shared paths, quiet streets and segregated cycle lanes
Public transport and other mass transit
Priority bus lanes and rapid transit, in some locations with access for new shared mobility services
FreightAdditional incentives to prioritise high-capacity and higher utilisation HGVs and clean-fleet vehicles over LGVs
Commuter and tourist coaches
Additional incentives for clean vehicles
Taxis and PHVs Mobility services for individual use, additional incentives for clean vehicles
Private motor vehicles
General traffic, with additional incentives for clean vehicles
41
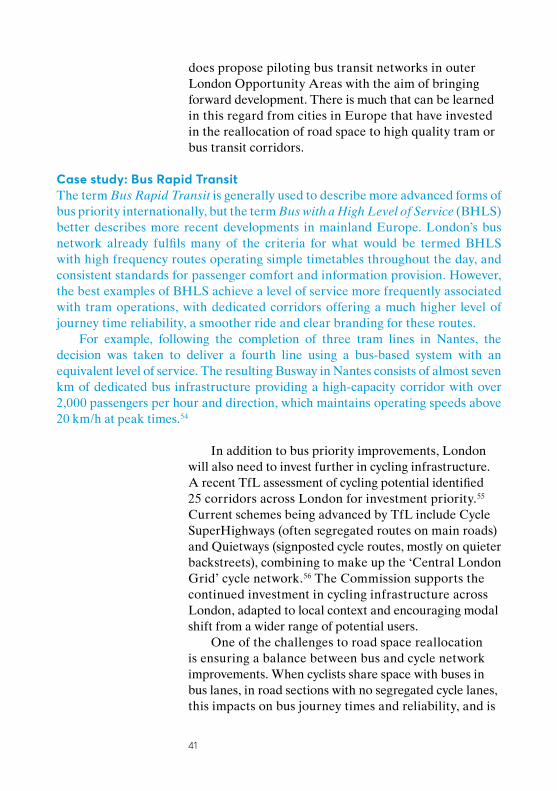
does propose piloting bus transit networks in outer London Opportunity Areas with the aim of bringing forward development. There is much that can be learned in this regard from cities in Europe that have invested in the reallocation of road space to high quality tram or bus transit corridors.
Case study: Bus Rapid TransitThe term Bus Rapid Transit is generally used to describe more advanced forms of bus priority internationally, but the term Bus with a High Level of Service (BHLS) better describes more recent developments in mainland Europe. London’s bus network already fulfils many of the criteria for what would be termed BHLS with high frequency routes operating simple timetables throughout the day, and consistent standards for passenger comfort and information provision. However, the best examples of BHLS achieve a level of service more frequently associated with tram operations, with dedicated corridors offering a much higher level of journey time reliability, a smoother ride and clear branding for these routes.
For example, following the completion of three tram lines in Nantes, the decision was taken to deliver a fourth line using a bus-based system with an equivalent level of service. The resulting Busway in Nantes consists of almost seven km of dedicated bus infrastructure providing a high-capacity corridor with over 2,000 passengers per hour and direction, which maintains operating speeds above 20 km/h at peak times.54
In addition to bus priority improvements, London will also need to invest further in cycling infrastructure. A recent TfL assessment of cycling potential identified 25 corridors across London for investment priority.55
Current schemes being advanced by TfL include Cycle SuperHighways (often segregated routes on main roads) and Quietways (signposted cycle routes, mostly on quieter backstreets), combining to make up the ‘Central London Grid’ cycle network.56 The Commission supports the continued investment in cycling infrastructure across London, adapted to local context and encouraging modal shift from a wider range of potential users.
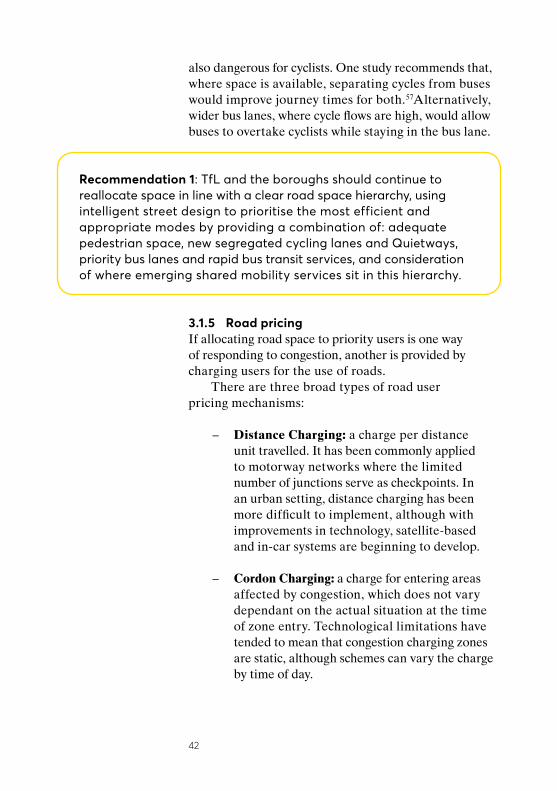
One of the challenges to road space reallocation is ensuring a balance between bus and cycle network improvements. When cyclists share space with buses in bus lanes, in road sections with no segregated cycle lanes, this impacts on bus journey times and reliability, and is
42
also dangerous for cyclists. One study recommends that, where space is available, separating cycles from buses would improve journey times for both.57Alternatively, wider bus lanes, where cycle flows are high, would allow buses to overtake cyclists while staying in the bus lane.
3.1.5 Road pricingIf allocating road space to priority users is one way of responding to congestion, another is provided by charging users for the use of roads.
There are three broad types of road user pricing mechanisms:
– Distance Charging: a charge per distance unit travelled. It has been commonly applied to motorway networks where the limited number of junctions serve as checkpoints. In an urban setting, distance charging has been more difficult to implement, although with improvements in technology, satellite-based and in-car systems are beginning to develop.
– Cordon Charging: a charge for entering areas affected by congestion, which does not vary dependant on the actual situation at the time of zone entry. Technological limitations have tended to mean that congestion charging zones are static, although schemes can vary the charge by time of day.
Recommendation 1: TfL and the boroughs should continue to reallocate space in line with a clear road space hierarchy, using intelligent street design to prioritise the most efficient and appropriate modes by providing a combination of: adequate pedestrian space, new segregated cycling lanes and Quietways, priority bus lanes and rapid bus transit services, and consideration of where emerging shared mobility services sit in this hierarchy.

43
– Environmental Charging: in addition to the above, a charge for a vehicle, either entering a zone or based on travel distance, dependant on its environmental impact. The Driver and Vehicle Licensing Agency (DVLA) database is typically used to ascertain the vehicle’s manufacturer stated emissions. Emerging technology could base charges on real- time emissions.
London’s Congestion Charge was introduced in 2003 and requires vehicles entering the charging zone between 07:00 and 18:00, Monday to Friday, to pay a set daily charge, regardless of the distance travelled in the zone or the number of times it is entered. There are a number of exemptions and discounts available, including for taxis and private hire vehicles (PHVs), some disabled users, ultra-low emission vehicles, vehicles with more than nine seats, residents within the zone, motorbikes and mopeds. There was an immediate reduction in car traffic and delays when the initial £5 charge was introduced.58 However, the increase to £8 in 2005 had no additional impact and, despite a further increase to the current charge of £11.50, over the subsequent years, delays due to congestion returned to pre-charging levels.59 This was the result of both measures to reduce road space available to cars and the replacement of car users deterred by the charge by those less cost-sensitive or exempt from the charge, along with a growing demand for road space by various users. Other studies have found the charge also improved air quality within and adjacent to the charging zone,60 as well as having an indeterminate effect on road casualties.61
London also operates one environmental charging scheme — The Low Emission Zone (LEZ), is implementing another — the T-Charge — and is planning a further scheme: Ultra Low Emission Zone (ULEZ). The LEZ is a daily charge introduced in 2008 for older heavy goods vehicles (HGVs), coaches, minibuses, vans and other vehicles associated with higher levels of pollution. It covers most of Greater
44
London and operates 24 hours a day, every day of the year.62 The T-charge, introduced from 23 October 2017, will charge heavily emitting vehicles a £10 additional fare for entering the Congestion Charging Zone (CCZ).63 The ULEZ is currently scheduled to come into force in 2020 (the most recent consultation proposed introducing it a year earlier in 2019),64 operating 24 hours a day, seven days a week within the same area as the CCZ, and affecting a wider range of vehicles.65 The environmental impact of the schemes, and what more can be done, is considered in Section 3.5, but the demand management impact is likely to be temporary, as the vehicle fleet becomes greener over time. In addition, the Mayor is proposing user charges on the Blackwall and proposed Silvertown Tunnels to cover construction and maintenance costs and manage demand.66
The draft Mayor’s Transport Strategy recognises that the Congestion Charge is now out of date. Not only has congestion reached pre-Charge levels, but traffic levels in the evening and weekends when the charge does not apply have increased, as has the proportion of exempt vehicles such as PHVs. As a result the Mayor has proposed to keep the Congestion Charge “under review”.67
3.1.6 Long term pricing solutionsIn the longer term, technological advances are expected to make more elaborate forms of road pricing feasible. The draft Mayor’s Transport Strategy has recognised the need to replace the blunt Congestion Charge with “more sophisticated road user charging (…) that reflects distance, time, emissions, road danger and other factors in an integrated way”.68 Given the current five year contract for running the CCZ and LEZ operations is ending at the end of 2018, we urgently need to begin a discussion over the future direction of charging in London.
There are many benefits to introducing a more integrated road pricing regime. It would replace the varied payment and enforcement systems (CCZ, LEZ, ULEZ, crossing charges) currently in place with one

45
system that is easier to understand. It would cover all motor vehicles, with limited exemptions. This would provide an opportunity to increase parity between private users, black cabs, PHVs and other emerging MaaS operations, so that future mobility services are charged at the point of use for the time spent travelling and the external effects the travel choice has, for example congestion or pollution. The congestion charge element does provide economic benefits because high value users benefit from faster journeys, and the charge encourages greater efficiency in freight and servicing.
Given the government’s recent commitment to ban all sales of fossil fuel vehicles by 2040, it is very likely that a different fiscal mechanism will be required at the national level in the coming years to replace this revenue. Fuel duty currently accounts for 3.9 per cent of total government receipts,69 and efficient vehicles are already having an impact on revenues.70 In anticipation of a national decision, it is right that London, as the city with the only substantial road user charging system in the UK, takes a lead in determining the vision for a longer term solution.
TfL’s general grant from central government is coming to an end in 2017/18,71 and so road pricing would also provide valuable revenue to support transport investment. London road pricing revenues should be used solely for the purpose of roads maintenance, and investing in London’s public transport and sustainable modes infrastructure, so that drivers priced off the roads have reasonable alternatives. In addition, any released road capacity should be used strategically to support the wider objectives of the Mayor’s Transport Strategy: for example, wider pavements, additional cycle lanes, bus or other transit systems, and kerb space for deliveries.
Case study: Making road pricing work in the UKThe 2017 annual Wolfson Economics Prize was devoted to the following question: How can we pay for better, safer, more reliable roads in a way that is fair to road users and good for the economy and the environment?
The five shortlisted entries present ideas framed by a backdrop of the emergence of disruptive technology and falling fuel duty revenue. There is general agreement

46
that a fair system would replace existing taxation, and charge vehicles instead on a Pay as you Drive basis with a marginal rate contributing to roads maintenance and variable charges depending on the contribution to congestion and other negative externalities.
On the decisive question of how to achieve a pricing framework that is acceptable to the public, the shortlisted authors proposed a number of approaches. Road pricing should be adopted in staggered phases, acknowledging that public attitude changes over time. There are obvious markets for early adopter schemes where users with low car use who would benefit from Pay-As-You-Drive charges can voluntarily switch from the current vehicle excise duty and fuel duty. Several entries also proposed working with existing organisations and brands that motorists may trust. The winning paper by Gergely Raccuja proposes a system of payment using insurance companies’ technology to record road use. The shortlisted authors also stressed the importance of ensuring that pricing can adapt to new mobility services and autonomous vehicles.
A smarter system that covers the whole of Greater London would have variable charging levels based on the individual journey’s characteristics:
• Distance travelled – a baseline charge per mile to cover road maintenance;
• Time of day – a surcharge for peak periods;
• Geographical location – a surcharge for congestion and pollution hotspots, with less congested areas, like outer London, paying less;
• Polluting emissions – higher charges for more polluting vehicles.72
Any pan-London road pricing system would also need the following features:
• Routine and regular pricing reviews – to ensure there are no steep increases;
• Price charged per vehicle, regardless of the number of passengers — to promote car

47
sharing/ pooling over individual premium services and ensure more efficient road usage;
• Price set at the start of a journey – so ensuring transparency, predictability and simplicity of comparison against other modes;
• Measures to ensure that disadvantaged road users are not unfairly affected, e.g. subsidised shared mobility services — shared taxi/cabs — for key workers on low incomes who start or finish work at night.
Road pricing and equity
There are justified concerns that road pricing has negative equity effects, as richer people can pay the additional cost more easily and so continue to drive.73 By that token, however, all charges for transport services are regressive, unless they are income related. All public transport fares, for example, could be considered inequitable, as they charge the same to rich and poor, and additional charges – e.g. on peak-time or fast trains – can price poorer people off those services.
The relationship between income and travel demand by mode is complicated.74 Middle income households have the highest car mode share, while low income households rely especially on buses. Londoners’ overall volume of travel progressively increases with income. Therefore, a package that charges private car road users, while investing in public transport, especially buses, will likely have, on balance, a positive impact on poorer households and a negative impact on middle and high income ones.

48
However, the Commission does recognise that people on low incomes can nonetheless rely on private cars for some trips. This is particularly true for those commuting outside normal working hours, for example in the health and hospitality sectors, when fewer convenient public transport options may be available, as well as lower income individuals priced out of inner London to areas with worse public transport connectivity.75 Policies that might otherwise discriminate against low income car owners may be mitigated in direct ways, such as variable charging with lower rates outside of peak hours, or in indirect ways, such as improving the night bus network or extending the night tube so that the use of a car is not critical. Car clubs may be cheaper overall than owning a car in London, even if it is second hand. Where there is a choice of mode it is more difficult to object to cost increases for the more expensive choices (such as motoring) on equity grounds, as a cheaper choice remains available.
Overall, the Commission considers that, at the aggregate level, equity disbenefits of an extended charging regime for motoring, or other measures, are outweighed by the health equity benefits of reducing traffic on main roads and of the relative equity benefits of increasing local bus services and reliability. A smart road user charging system that reflects travel distance, vehicle emissions, location and time of day, would be fairer in the way that it reflects the real cost of individual journeys, incentivising better travel choices. Still, any such reforms would be announced in advance and implemented gradually to allow people some reasonable time to adjust, as well as mitigating measures as outlined above, to ensure that fair and equitable access to the road network is maintained.

49
There are two broad road pricing technologies: in-vehicle devices and roadside number plate recognition technology (as used in London’s Congestion Charge Zone). They both have their advantages and disadvantages. The right system for London will be determined in part by developments in national transport policy, European standards and international market forces. An in-vehicle based system has a number of benefits – for one thing it avoids the need to cover the city with cameras. But it will be hard for London to adopt an in-vehicle model independently of the rest of the country, given the high number of vehicles that use the city’s roads but are not based in it. For this reason the Commission does not feel able to recommend any particular road pricing technology at this time.
3.1.7 Short term pricing priorities The Commission believes London needs to develop a city-wide road pricing system in the next few years. But any scheme is likely to take some time to implement. However, there is scope for achieving short term objectives within the existing charging infrastructure. The rationale for these is twofold. First, it would signal a gradual change of direction to users, by incrementally moving towards the longer term vision. Second, it would help to raise additional revenue to fund continued improvements to public transport and London’s public realm.
The Commission recognises that, to achieve a worthwhile and sustained reduction in the level of daytime traffic in the existing Congestion Charging Zone (CCZ), it is likely that the level of the charge would have to increase very substantially, and so a
Recommendation 2: The Mayor and TfL should commit to developing a pan-London, pre-pay smart road user pricing scheme by 2020. The scheme needs to reflect the internal and external costs and environmental impacts of journeys, while being fair, easy to understand and administer.

50
wider range of changes should be prioritised to achieve short term tactical objectives set out in this report. We believe there are a number of ways to reform the current Congestion Charge regime:
• Removing the exemptions for private hire vehicles. Although this may encourage drivers to stay in the CCZ longer, once the charge is paid, this would be no worse than now, when there is no barrier to being in the CCZ at all. While TfL has proposed to cap the number of PHV licenses, the current government has shown no sign of a willingness to do this, and charging is arguably a more economically efficient way of managing demand.
• Gradually phase out the current 90 per cent discount for residents – any future pan-London scheme would not offer a discount to residents.
• Extending the hours of the Congestion Charge (possibly offering variable charges), to include times in mornings, evenings and weekends when demand is high.
• Extending the Congestion Charge’s geographical coverage. This would work best where coverage was extended to additional zones in areas with high congestion, e.g. town centres like Croydon, and airports, like Heathrow, that are not contiguous with the current CCZ, rather than in concentric circles around the existing Zone. Creating new Zones is relatively straight-forward, scalable and flexible. However, it should only be done where there are viable and fairly-priced alternatives, otherwise it is unlikely to reduce congestion or emissions, while potentially pricing some people out of certain areas of London.

51
3.2 Managing traffic flowLondon employs a range of tools to manage its traffic flow, but the growing pressures on its roads, along with new technologies mean that current approaches will have to be rethought.
3.2.1 Dynamic traffic managementTfL has made increasing use of traffic signal optimisation to maximise the capacity of London’s limited road space. The Split Cycle Offset Optimisation Technique (SCOOT) system is now used at over 4,000 sites across London to amend signal timings in real time to maximise junction throughput, for all modes, including pedestrians and cyclists.
Technology is moving at a rapid pace, and TfL is now in the process of delivering the Surface Intelligent Transport System (SITS) investment programme to replace and upgrade its current systems and data capabilities for traffic signal control and incident management. SITS will enable TfL to respond more quickly to unplanned incidents, reduce delays, and allow customers and stakeholders to make informed and timely travel decisions.76
This upgrade, along with the increasing use of sensor data (the ‘internet of things’) and mobile communications, will enable ever more sophisticated dynamic systems over the coming years where the emphasis is shifting from traffic management via signals, to management via information provided to connected vehicles. With increasing numbers of road users relying on route guidance apps, like Google Maps, CityMapper, and Waze, to direct their journeys, there is the potential for significant collaboration between public and private
Recommendation 3: TfL should investigate short term changes to the existing scheme, including removing the exemption from PHVs, incrementally reducing the resident discount, introducing variable charging periods to better match demand, and exploring the introduction of additional zones in areas with high congestion.

52
bodies with benefits for both parties. Real-time data from these apps can provide the traffic control centre with an accurate picture of conditions on the road network and alerts to incidents. Comprehensive, real-time information on London’s transport networks can be used by private sector partners to improve their service to users, in particular by proposing less congested routes and providing estimated journey times.
Given the new technological capabilities available, the Commission notes that London’s transport authorities need to be clear on what the strategic objectives of road network management should be. TfL operates London’s traffic control centre on its road network and on borough roads. Ultimate responsibility for signal control is therefore shared by TfL and boroughs, requiring greater transparency about objectives. The Commission suggests two respects in which TfL’s use of traffic signals should be rethought.
First, the race to squeeze ever more capacity out of the existing system leaves no resilience in the system, i.e. the price of marginally quicker journeys is more unreliable journey times. In some circumstances, if a small amount of capacity were held back in regular operation, it could be released in the event of incidents to achieve better journey time reliability.
Second, traffic signal controls could be used to prevent queues in air quality hotspots and concentrate vehicle stacking in areas where pollutants can dissipate more easily.
These tools are not altogether new. Since the London Games in 2012, TfL has had the capability to hold back queues on the main highways into the city.
Case study: Traffic cells in ZurichThe city of Zurich has worked to limit car access to the city centre and improve public transport flows since the early 1970s. A central control room was developed early on, managing all signal junctions with an electronic traffic management system. The Zurich system is cell-based with controlled access to the cells designed to reduce the build-up of traffic jams. For example, traffic is held at the periphery of the city in the morning to prevent congestion in the centre and allow buses and trams to move around freely.

53
3.2.2 A London Movement CodeThe first UK Highway Code was published as a booklet in 1931 as a set of ‘rules of the road’ for a society coming to terms with the motor vehicle. While it has been updated numerous times since, it still has not kept pace with the rapid change in London. And knowledge of the Highway Code is limited, with fewer young people driving77 and many professional drivers coming from other nations,78 all with subtle differences in their national highway rules.
The Commission supports the idea of a new Movement Code that would set down clear principles and rules for all street users, including those who currently do not require formal training, and encourages greater civility in the interaction between different street user groups.79 The code should be supported by publicity campaigns.
Recommendation 4: TfL should seek to develop its road network control systems to maximise the benefits of real-time data exchange with external partners, and review its strategic road network management objectives, to improve journey time reliability and manage air quality hotspots.
Case Study: France and Belgium’s ‘Code de la Rue’An executive decision in 2003 amended the Belgian traffic regulations, introducing a Code de la Rue and thus modifying the highway code that was perceived to be inappropriate to urban conditions. Importantly, the new code introduced a general duty of care of stronger road users towards more vulnerable users. A similar code has been discussed in France in the context of evolving forms of traffic calming (differentiating between pedestrian zones, encounter zones and 30km/h zones), and several cities have adopted urban street codes on a voluntary basis.
A London Movement Code would not be a statutory document in the way the Highway Code is. But we believe that if it were promoted in schools, workplaces and through civil society organisations, it would gradually start to carry weight. The rise of non-driver and specialist road user training (e.g. Bikeability

54
training in schools, or freight operator training schemes) would help embed the Code. Ideally the Movement Code would represent a transitional step to amending the UK Highway Code itself to better respond to changes in our cities.
Fostering more civil behaviour on our roads and streets also requires stronger enforcement of existing and potential new rules. Currently, there is virtually no enforcement of minor traffic transgressions, as London’s police need to devote their resources to more urgent matters. Transferring responsibility to a dedicated unit of Police Traffic Officers, or alternatively a new civil enforcement body (perhaps funded by PCNs and, eventually, income from a London-wide road pricing scheme), with powers to issue fines for careless or aggressive behaviour in traffic, would free up police time. The other advantage of such a force would be the ability to intervene on the ground in the case of events and incidents, effectively acting as a human presence to back up the Traffic Control Centre.
3.2.3 Traffic restriction measuresTraffic management and traffic restriction measures can be used for a number of purposes, including relieving congestion at busy junctions, ensuring the operational resilience of busy stations, creating a safe environment for pedestrians, or creating more pleasant environments and encouraging mode shift away from car, taxi and PHV use. While some of the measures outlined below have been implemented in parts of London, there is potential for their further roll out to meet a number of objectives,
Recommendation 5: The Mayor and TfL should develop a new London Movement Code and an accompanying public awareness and training campaign to guide interaction between different road users, with both existing and new traffic rules enforced by a dedicated enforcement body.

55
particularly in relation to air quality and road safety, and improving the public realm.
Filtered permeability describes a traffic management approach where full or partial traffic closures are implemented on neighbourhood streets. The ‘filtering’ can be achieved in a variety of relatively low-cost ways, such as signs and bollards, or one-way flow for motor traffic. This physically prevents traffic from rat-running, creates a genuine advantage for walking and cycling over car use, and improves the environment for people who are walking and cycling. An example is the mini-Holland scheme in Waltham Forest, which demonstrated that it is possible to improve residential amenity and encourage mode shift to walking and cycling even in more car-dominated suburbs of outer London.80
Traffic restriction schemes, such as Bank Junction in London, limit access to certain types of traffic at certain times.81 There are other areas of central London and other town centres where such schemes would be beneficial. They could involve some displacement of traffic to surrounding areas and this needs to be reviewed on a case-by-case basis. The removal of a particularly congested junction from the network can actually lead to an improvement in network performance.
School Streets are temporary traffic closures around schools at the beginning and end of the school day to create a safe drop-off and pick-up environment, encourage children and parents to walk and cycle to school, and create a more relaxed and sociable environment around the school gates.82 A re-invigorated programme of School Travel Plans would also encourage mode shift. Similarly, temporary road closures for Play Streets can support children’s physical, cognitive and social development.
Shared space, generally considered a design approach where features such as kerbs, traffic signals, road markings and signs are removed, forcing users to negotiate priority, was a popular concept in the early 2000s. Yet some of the schemes introduced in the

56
UK have faced criticism, most notably from visually impaired users. Encounter zones, in contrast, were developed as traffic calmed non-residential streets, with the aim of creating conditions for a more relaxed and civil interaction between street users. The zones are typically open to all forms of transport but pedestrians have priority over other modes. The road is routinely a shared surface, and so they can move with complete freedom. Motorised vehicles are limited in speed (generally to 20 km/h) and may only stop and park in designated areas. Tactile guidance is provided as an alternative to the kerb to enable visually impaired users to navigate through the space. Encounter zones can be created using a combination of existing regulations (speed limits, parking zones), and potentially a new form of signed pedestrian priority.
3.3 Managing the kerb spaceEfforts to manage the conflicting pressures on London’s roads and streets have tended to focus on road space. But available and appropriate kerb space — space to park, pick-up or drop-off — is also a scarce commodity, and recent trends, like the rise of local convenience supermarkets and the increase of van deliveries and PHV pickups/drop-offs, have intensified competition for it. But despite the strong need to manage kerb space, there is a dearth of borough-wide kerbside management strategies, let alone London-wide ones. London urgently needs to review the regulations and price incentives that govern access to kerb space.
As we have seen, the principle of road user hierarchies is well-established as a tool to manage movement. The Commission believes that London
Recommendation 6: Boroughs and TfL should continue to roll out different traffic management and restriction measures – such as filtered permeability, road closures, school streets and encounter zones – using local trial interventions to fine tune final designs, to meet the objectives of improving safety and encouraging modal shift.

57
highway authorities should adopt equivalent kerb space hierarchies to guide their decisions on the allocation of parking and drop-off space. Kerb space hierarchies should prioritise cycle parking, especially around stations and bus stops, and loading bays to accommodate servicing and delivery activities. Similarly, they recognise that drop off and pick up facilities for mobility services like buses, car clubs and PHVs should be prioritised over parking for privately owned motor vehicles.
The following, Figures 4 and 5, formulate indicative kerb space hierarchies for high streets and residential areas.
Figure 5: High street kerb space hierarchy
Safety and accessProvision of a safe layout for vehicle and pedestrians; safe pedestrian crossings and dropped kerbs to be kept clear at all times; emergency services access at all times; access to property entrances
Public transport stops
Stops that are accessible to all users without obstructing pedestrian flows, provide a secure waiting area, and minimise vehicle dwell times
Parking for individual and cycle hire bikes that is safe to access, provided at regular intervals, and minimises disruptions to pedestrians
Cycle parking
Locations where private vehicles, taxis and PHVs can safely pick up and drop off with minimum disruption to other road users
Pick up and drop off
Parking for disabled users
Parking reserved for blue badge (or equivalent scheme ) holders
Short-stay car parking
Short-stay car parking (generally charged)
Access for loading and servicing that provides safe access to premises and minimises disruptions to pedestrians
Deliveries

58
Case study: Southwark’s Kerbside StrategyIn February 2017 Southwark Council launched a public consultation on a new kerbside strategy – the first of its kind among London boroughs.83
The draft strategy seeks to ensure smooth running of road networks, reduce serious collisions, improve air quality, and address public health concerns. It proposes eight major policy areas:
• Arranging kerb space, by (1) allocating space in accordance with their streetwise approach and (2) prioritising kerb space for walking and cycling
• Controlling parking by (3) implementing parking controls, based around evidence and (4) reviewing town centre parking
• Requiring safer, robust delivery, servicing and waste management (5)
• Implementing more green infrastructure (6)
• Expanding the shared mobility network (7) and adapting for the future (8)
Figure 6: Residential kerb space hierarchy
Provision of a safe layout for vehicle and pedestrians, safe pedestrian crossings and dropped kerbs to be kept clear at all times; emergency services access at all times; acccess to property entrances; layout that facilitates access while restricting vehicle speeds
Car clubs
Cycle parking Secure cycle parking and open visitor parking
Bays reserved for car club vehicles
Parking reserved for disabled residentsParking for
disabled users
Short stay baysShort stay bays that can be used for deliveries to residential addresses and for pick up and drop off by taxis/PHVs
EV charging baysElectric vehicle charging bays for residents (with potential short stay use by other vehicles)
Residential car parking
General parking for residents
Safety and access
59
Recommendation 7: TfL and the boroughs should agree new kerb space hierarchies to govern parking and kerb space allocation, and undertake regular local reviews.
3.3.1 Managing demand for residential parkingMany London homes, especially in inner London, do not have off-street parking, which has led to large amounts of kerb space in residential streets being devoted to residential parking, although many residents do not own a car, and those that do may use them infrequently.84 Controlled areas prevent other people from parking in residential streets but does not guarantee residents a space since the number of permits often far exceeds supply. At the same time, with the rise of new shared mobility services, surveys show that a substantial proportion of car owners in London are considering giving up their vehicle.85, 86 London is clearly at a crossroads in its relationship with the private car and a concerted series of measures can help reduce demand for residential parking.
The Mayor could introduce a requirement for boroughs receiving grant funding from TfL to adopt a number of residential parking policies as part of their Traffic Reduction Plans.
First, the management and enforcement of residential controlled parking zones in inner London is expensive and is currently heavily subsidised by other revenues from on-street bays and car parks.87 Boroughs should ensure that residential permit fees cover their full administration and enforcement costs. Any surplus generated by high streets and car parks should not subsidise residential parking and should instead be spent on town centre management activities or improved access for sustainable modes (although in the short term this revenue can be used to fund residents’ parking reduction incentives). Alternatively, where the number of current permits exceeds supply by a large margin (mostly confined to some inner boroughs), councils

60
should seek ways to manage this fairly to reflect available capacity. One mechanism that might be considered would be to auction space off, although there would need to be restrictions to ensure equity impacts are not regressive, and to ensure all those who need a space get one.
Second, boroughs should set a maximum number of permits per household to ensure a fairer allocation of the limited space available. Any additional permits (after the first) should be subject to an escalating charge structure to discourage households from applying for multiple permits. Similarly, parking permits for more polluting vehicles should incur higher prices, a policy already being adopted by some boroughs.
Third, while it is politically difficult to reduce the number of permits already allocated, boroughs should reserve the right to remove automatic eligibility to parking permits when properties are sold. Thus properties with high PTAL (Public Transport Accessibility Levels) ratings could be either be sold as car-free properties, or with limited rights to acquire a parking permit through an auction process.
These policies would be most successful if accompanied by generous incentives for residents to give up their parking permits, such as Oyster card credit to use on public transport, discounted car club memberships or taxi and private hire vehicle credits. It is common for new developments to provide limited numbers of premium-priced parking spaces, while offering residents incentive packages for shared mobility services, or additional space for other forms of mobility (e.g. cycle parking). The combined approach of higher permit charges and incentives should be aimed first and foremost atthe large proportion of inner London residents considering giving up car ownership.
Case Study: Car clubs and development88
From the perspective of a developer, car parking is frequently seen to add value to a property, although it takes space from other value-added facilities such as gyms. In London, it has become common for large developments with little or no parking to include car club bays, in some cases with incentives for new residents such as one-year free membership.

61
This year, UK developer Moda Living made the news when it announced that tenants in its new apartment blocks would be offered up to £100 per month in Uber credits if they chose not to take a parking space. Though there is a risk that this approach may incentivise people to use PHV services when they might have used public transport before.
Incentives such as public transport credits or car club membership would need to be funded by the boroughs, but in inner London boroughs, the cost of an annual subscription to a car club is actually similar to the current subsidy towards residents’ parking permits. Furthermore, there is an obvious incentive for operators to offer discounts to gain market share in a rapidly growing market.
3.3.2 Dynamic management of non- residential parkingAdvances in technology open new opportunities for more dynamic management of short-stay parking in London. Varying charges according to location and time of day and week could be used to achieve a target occupancy of 85-90 per cent, ensuring that motorists paying the parking charge can easily find a space and thus eliminating, or at least reducing, ‘parking search’ traffic. While this may result in some price increases at busy locations and times, it is also likely to result in reduced charges at other times, which can be changed
Recommendation 8: Boroughs should adopt residential parking policies as part of their Traffic Reduction Plans. These should include a charging regime that limits residential parking permits at sustainable levels; limits on the number of permits per household, with escalating charges for additional and more polluting vehicles; potentially removing automatic parking permit rights when properties are sold; incentives that encourage households to give up their parking permits, such as Oyster card credit, discounted car club memberships or credits for mobility services; and minimal residential parking provision on new developments.

62
over time. The real-time monitoring of occupancy does require additional on-street equipment.
Case study: SFpark in San Francisco89
San Francisco was one of the first cities to adopt a dynamic approach to pricing metered parking. Charges vary by block and time of day and week, and to ensure continued parking space availability, rates are adjusted incrementally every month.
In the initial trial of SFpark, wireless sensors were installed to measure parking space occupancy in real time. Following the pilot phase, occupancy is now measured using alternative data feeds. Information on the availability of parking spaces is distributed via a free app and a live data feed, that can be used by app developers.
Evaluation of the pilot phase indicated a 16 per cent reduction in parking non-availability, while users reported a 43 per cent reduction in parking search times. In areas where an improvement in parking availability was measured, overall traffic volume decreased by around eight per cent. The average hourly rate paid by users actually fell from $2.69 to $2.58 as charges in lower utilised blocks were adjusted downwards.
3.3.3 Cycle parkingAs demand for parking spaces drops over time, freed-up parking spaces could be utilised for other strategic purposes, such as freight and deliveries, bike parking, car share and EV charging bays, taxi pick-up/drop-off, and public realm improvement.
While London has been very successful in securing cycle parking in new developments, more established London neighbourhoods have struggled to cope with the rapid growth in bicycles. In parts of central London, it is common to see bicycles chained to street furniture blocking the footways, and many London residents need to store their bicycles in hallways or balconies because they do not have access to secure cycle parking at home. Secure parking such as bike hangars are popular with residents but their provision remains patchy. Too many
Recommendation 9: Boroughs should consider introducing variable charges for non-residential short-stay parking with the aim of achieving 85-90 per cent occupancy.

63
tube stations still offer little or no cycle parking. A concerted effort must be made to address these issues to make cycling more appealing, and to reduce street clutter and the impact on pedestrian safety.
3.4 Freight and servicingGrowing congestion in London is partly due to an increase in activity of the freight and servicing industries, as well as an increase in personal deliveries from online shopping. Between 2000 and 2015, heavy goods vehicle (HGV) kilometres in London fell by seven per cent, while there was a 16 per cent increase in light goods vehicles (LGV) traffic.90 The draft Mayor’s Transport Strategy sets a target to reduce central London construction traffic by five per cent by 2020, and freight traffic by 10 per cent in the morning peak by 2026.91
Freight and servicing, however, are essential to keeping the city moving – from keeping shops supplied to delivering construction materials for building new homes – and supporting economic growth. Indeed, businesses and their supply chains themselves are heavily affected by traffic congestion. During a business roundtable for the Commission, both individual companies and representative organisations spoke about the problems of unreliable journeys, particularly for just-in time deliveries. Businesses recently called for a freight commissioner for London,92 although this Commission believes such a role, if implemented, should also cover servicing, as the needs of these industries are relatively neglected.
Achieving the vision of a clean and liveable city makes it paramount that London’s businesses create
Recommendation 10: Using the kerb space hierarchies, boroughs should develop a robust cycle parking strategy including the reallocation of kerb space to cycle parking. TfL must ensure that the cycle parking strategy is a condition of eligibility for boroughs’ grant funding and actively monitor delivery.

64
efficient and clean supply chains. To this end, we need to create the conditions that enable good practice, as well as restricting activities with adverse impacts. This means creating a system that rewards responsible operators who invest in safer, cleaner and quieter vehicles and working practices.
The freight industry is already adapting to the challenges of operating in London. One of the main solutions proposed has been the retiming of deliveries to off-peak times of the day or night. Encouraged by the successful trials during the Olympic Games, freight operators are keen on the retiming of deliveries, and welcomed the protocol drawn up by the TfL Retiming Deliveries Consortium as useful guidance.93
However, there are still a number of constraints. Building leases and planning conditions often have delivery restrictions attached. The London Lorry Control Scheme (LLCS) restricts heavy lorries at night and at weekends to reduce noise impacts on residents.94 Some businesses criticise the Scheme for requiring detours and state that the fear of the high penalties can disincentivise retiming. In addition, some businesses may be less able to retime deliveries, for example, manufacturing and construction companies that may require just-in-time deliveries or small businesses that may be unable to staff premises out of hours. As a result, some of the businesses we heard from felt that much of the potential of retiming had already been realised. While out-of-hours delivery can improve operational efficiency for the freight sector, client businesses are often less positive since it represents an additional cost to them.
3.4.1 Supporting on - and off - site consolidationFreight consolidation is another option to limit the impact of delivery vehicles. It can take two main forms:
– On-site consolidation refers to the use of harmonised procurement processes by businesses within the same building, estate or business district to reduce the number of deliveries and servicing trips to the site.

65
– Off-site consolidation refers to the use of off-site logistics hubs to consolidate multiple consignments to the same building, estate or business district into a small number of last-mile vehicle trips.
The benefits of freight consolidation include the reduction in vehicle mileage, reduced pressure on road and kerb space in town centres, improved public realm, and improved air quality if zero-emission last-mile vehicles are used. There are many examples of good practice already. For example, some public authorities have consolidated procurement, with deliveries to different offices being coordinated to be delivered more efficiently on the same day. Some Business Improvement Districts (BIDs) and large property estates also coordinate on-site consolidation on behalf of their businesses. The businesses least likely to benefit from commercial consolidation operations are small and medium enterprises (SMEs) located in areas without a natural co-ordination point, and in premises with no off-street servicing.
Servicing
While we have a fairly good understanding of freight – i.e. the supply chain structures that deliver goods to London’s shops, businesses, construction sites and homes – there is little understanding of the road impacts and requirements of servicing. The term now covers not only traditional tradespeople and repair and maintenance activities, but also non-core business functions that may be outsourced to external organisations. It has been suggested that more than half of van movements in central London and the majority of vehicles parked in some car parks are actually related to servicing activities rather than deliveries.

66
One advantage of a van is the ability to have access to a range of equipment at one’s disposal at all times. Yet, an increasing number of people, from tradespeople to camera crews, are making use of public transport – as it may be more convenient and cheaper – and carrying equipment. This highlights the need to view the potential for mode shift of (i) the people carrying out the work, (ii) their equipment and (iii) any materials or parts they need separately.
Future technology may reduce the need for servicing activity, as more equipment is built with predict and prevent functions that seek to reduce the need for reactive maintenance activity, and concepts such as 3D printing could reduce the need to ship spare parts. Efforts to consolidate freight movements work best where large management agencies (BIDs or large private developments) can coordinate the scheme for many businesses. These are also best placed to reduce the ever-increasing fragmentation of service delivery through the harmonisation of service providers, coordination of their activities and potentially even the storage of equipment locally.
Off-site consolidation can be particularly complicated, as it requires consolidation centres, which are dependent on finding the right commercial model. One of the barriers is the lack of logistics land especially around the fringes of central London, but micro-consolidation centres can be accommodated on a range of sites. For example, the conversion of redundant off-street car parks, or other borough assets, could provide space to many small and medium enterprises (SMEs) operating in the last-mile delivery sector.
Another obstacle is that off-side consolidation is difficult to incentivise or impose. One way to overcome this is through additional rules for clean vehicles. For example, declaring entire town centres or business districts as zero-emission delivery zones would force businesses and their suppliers to seek new supply chain
67
solutions and use consolidation centres and a clean last-mile delivery fleet. There are several channels available for implementation of such delivery zones. Where BIDs represent the majority of businesses in an area, they can voluntarily declare a target date and put in place their own consolidation systems. Alternatively, boroughs could enforce such a change by restricting the types of vehicle able to use on-street loading bays, or even the types of vehicle able to enter certain streets.
While the above stresses the importance of incentivising freight consolidation in town centres and business districts, there is substantial potential to improve the efficiency of freight using a strategic pan-London approach. A coordinated approach to freight consolidation corridors across the city, much like the passenger-bus network, has potential to reach businesses and yield efficiencies that localised business-led consolidation activity might be unable to achieve. Out of town consolidation facilities could serve corridors running through central London, supported by micro-consolidation centres in dense or residential areas. A system of franchises could be used to specify greener, safer HGVs with access to existing or new priority lanes and loading bays along the freight corridors. Variable pricing could be used to incentivise off-peak delivery slots.
Alternative commercial models should be explored to assess the viability of such a service, including TfL-led franchising models, with consideration for future
Recommendation 11: Boroughs should encourage off-site consolidation by utilising assets such as underused car parks to provide micro-consolidation and last-mile delivery capacity for SMEs, establishing zero-emission delivery zones around certain business districts, and leading by example by consolidating procurement practices. BIDs and business estates should also coordinate on- and off-site consolidation.

68
road user charging plans. Effects on business efficiency and the allocation of revenues would require further investigation, but this model would likely have benefits of reduced traffic, cleaner air and safer vehicles for London.
3.4.2 Encouraging clean vehiclesThe Fleet Operator Recognition Scheme (FORS) is a voluntary scheme for fleet operators, which offers different levels of accreditation measured against the four requirements of legal compliance, safety, efficiency and environmental protection. It has been successful in improving safety and environmental standards across a range of fleets. The current reach of FORS accreditation within the industry makes it an appropriate scheme to encourage even quicker take-up of freight consolidation, zero-emission last-mile deliveries, safer lorry cab design and quieter out-of-hours working. To achieve the desired level of take-up of a yet higher FORS standard, there would need to be real benefits for operators, for example:
• Exemptions from the London Lorry Control scheme: London Councils is currently reviewing this scheme and has recommended some changes. Moving forward, FORS accredited vehicles meeting certain noise and emissions standards could be exempt from the control scheme allowing them greater freedom to operate at night and on Sunday. Enforcement of the Lorry Control can also be improved through Automatic Number Plate Recognition (ANPR).
• Electric Vehicle (EV) charging: Operators with a higher level of FORS accreditation could
Recommendation 12: Alternative commercial models, including a TfL-led scheme, should be thoroughly investigated for a freight consolidation network, with a view to developing a trial on a strategic corridor.

69
be offered preferential use of on-street EV charging points and access to charging facilities that may be under-used during the day, such as borough-managed vehicle fleets or TfL-leased bus garages.
3.5 Tackling air pollutionAs part of the EU’s response to the 1997 Kyoto Protocol to reduce greenhouse gas emissions and their impact on climate change, diesel was promoted as a more environmentally friendly fuel than petrol, since it produced less carbon dioxide (CO2). As a result, carbon dioxide emissions have fallen, and transport only contributes around 20 per cent of these emissions in London.95
However cars also produce toxic emissions, which are harmful to humans in both the short- and long-term. The two most common local air pollutants released from road transport in the UK, with some of the most damaging health impacts, are nitrogen dioxides (NO2) and particulate matter (PM) – the latter can be split into fine (PM2.5) and coarser (PM10) particles.96 Road transport is the main contributor to NO2, PM10, and PM2.5 emissions in Greater London (51, 50 and 54 per cent respectively in 2013).97 Within these contributions, diesel powered vehicles play a disproportionately large role, particularly in their production of higher concentrations of nitrogen oxides. Combustion engine vehicles produce particulate matter from tailpipe exhausts, but all vehicles also do so from brake, tyre and road wear.98
Both London and national government have recently introduced new measures aimed at reducing air pollution. The ‘UK Plan for Tackling Roadside Nitrogen Dioxide
Recommendation 13: Boroughs should encourage the take-up of cleaner fleets by considering exempting vehicles with higher FORS accreditation, low noise and emissions from the London Lorry Control Scheme, and allowing them access to TfL and borough-managed EV charging facilities in the daytime.

70
Concentrations’ was published in July 2017.99 The plan proposes banning the sale of all conventional petrol and diesel cars and vans from 2040, with the aim for every car and van to be zero tailpipe emission a decade later in 2050.
Responsibility for air quality is devolved at the London level and the Mayor has specific powers to influence the types and number of vehicles driven in London. Current Mayoral plans include:
• The introduction of the T-charge from 23 October 2017, whereby all vehicles entering central London (the Congestion Charge Zone) will have to meet emissions standards (mostly Euro 4/IV) or face a flat £10 charge.100
• For buses, all new TfL purchased ones are set to be hybrid, electric or hydrogen from 2018 onwards, alongside an £86m scheme to retrofit 5,000 older buses by September 2020.101 Further, there will be 12 low emission bus zones, deploying the cleanest buses along the most polluted routes.102
• No new diesel black cabs will be licensed from January 2018, with the ambition that 9,000 will be zero emission capable by 2020.103 The ambition of making the whole public transport network zero emission by 2050, as set out in the draft Mayor’s Transport Strategy.104
• The introduction of the Ultra-Low Emissions Zone (ULEZ) in April 2019 across central London, before expanding it London-wide for buses, coaches and HGVs in 2020, and expanding it within the North and South Circulars for cars, vans, motorbikes and minibuses in 2021. The impact of introducing ULEZ in central London is expected to include reducing emissions NO2 and large particulates (PM10), and a marginal fall in PM2.5 levels.105

71
These policies are welcome but the Commission believes they do not go far enough, and that additional interventions are needed. London may wish to consider further measures to restrict the volume of diesel vehicles and combustion engines more generally.
3.5.1 ULEZ diesel scrappage schemeThe idea of a national or local vehicle scrappage scheme has re-emerged in the air quality debate, but it remains politically contentious. On the one hand, it is argued that motorists were encouraged by government policy to buy diesel vehicles and that they should not be subsequently penalised. On the other hand, it is difficult for politicians to be seen to be diverting resources from other priorities to hand out cash to a select proportion of the population to purchase a new vehicle.
An alternative option for the Mayor would be to offer a partial cashback scrappage scheme in conjunction with the ULEZ. Targeted at motorists who pay the ULEZ charge frequently, this scheme would offer partial cashback to users who take a polluting vehicle off the road. For drivers using vehicles required to pay the charge, the Mayor can offer a proportion of the cumulative charges paid on this vehicle if it is scrapped. If eligibility criteria became stricter in the longer term, it would continue to target the most polluting vehicles on the road.
It would be well targeted in terms of affecting air pollution, as vehicles that pay the most in cumulative charges (and hence those with the greatest incentive to participate in the cashback scheme) are those that make the greatest contribution to poor air quality in the capital. While offering cash for a new vehicle would not fit well with London’s mode shift objectives, the cashback offer could be in the form of mobility credits as an incentive to use alternative modes of transport. This scheme would not divert resources from elsewhere since it would be funded from the ULEZ revenue. It does, however, require a mechanism to restrict a licence holder from applying to pay ULEZ charges for another vehicle once they have benefitted from the cashback offer.

72
3.5.2 Planning for a cleaner vehicle fleetThe conversion of vehicle fleets (public transport, mobility services, freight and servicing, private cars) to low and zero emissions plays a key role in achieving air quality ambitions. But the Commission takes the view that minimising motor vehicle use will also be necessary to help achieve its wider objectives. The recommendations to incentivise cleaner vehicles should therefore be applied in combination with the measures to reduce motor vehicle use altogether.
Technology for electric vehicles (EVs) is improving rapidly, with better batteries and longer ranges. However, one of the main barriers to a fuller rollout of a clean fleet in London is infrastructural capacity of EV charging points. Estimating the density of charging points that will be required is no easy matter. This depends on the range of EVs in the future and the types of charging infrastructure we are likely to see.
The provision of rapid EV charging infrastructure is a mammoth task and will require government and industry to do more. National government has provided funding of £22.5m to TfL, the Greater London Authority and London Councils to develop on-street charging points, but this is a small proportion of the total investment needed.
The National Grid is confident that the challenges of electrification of the fleet can be managed with intelligent technology to charge outside of peak demand on the grid.106 In London, the priority must be the substantial urban areas with no off-street parking, where access to on-street charging points needs to be managed, with priority for shared vehicles in line with the kerb space hierarchies.
Recommendation 14: The Mayor should introduce a cashback scrappage scheme as part of the ULEZ to target the scrappage of the most polluting vehicles and encourage the use of alternative modes of transport.
73
The rollout of individual charging points collectively increases the demands on grid infrastructure, and the cost of upgrades (e.g. new substations) is currently allocated to the user whose additional demand cannot be met by the supply. There is a need, therefore, for a financial mechanism to spread the cost equitably over the users of each additional charging point.
The Commission takes the view that current policy needs to do more to tackle non-tailpipe pollution in the form of particulates. Legal compliance with NO2
emissions is currently the main driver for policy, but there is mounting evidence that policy underestimates the harm done by PM emissions. Research suggests that their health impacts are felt even at extremely small concentrations (even below EU legal limits), particularly with links to cardiopulmonary toxicity.107 PM components from road traffic not only include engine emissions, but also, a very substantial contribution from brake/tyre wear and road surface abrasion.
One approach to minimise PM emissions must be to reduce vehicle use in London, but government should also be encouraging research and development in tackling non-tailpipe and abrasion local emissions through innovation in tyre, brake and surface materials – this field could form a very important strand of the government’s industrial strategy for the UK’s automotive industry.
Recommendation 15: London’s traffic authorities should plan for the rollout of intelligent vehicle charging infrastructure as part of their kerb space strategies, and should develop financial mechanisms to spread grid infrastructure costs fairly across each additional charging point.

74
3.6 Planning for good growthAs discussed in Section 1.3, roads and streets have a movement role and a place role – and the latter is just as important as the former. We look at how this applies to major development areas, and the way we enable delivery of better streets and places.
3.6.1 Principles of good growth and design and applying them to different parts of LondonLondon’s spatial planning policies for the last two decades have supported densification and mixed use intensification in proximity to public transport nodes, which will need to be continued. While almost all neighbourhoods will experience population growth, development will be particularly intense in some areas – in particular Opportunity Areas and areas of low current density, but high development potential. These offer an opportunity to apply principles of good growth, which can design in non-car dependent and healthy lifestyles.
Recommendation 16: The Mayor and central government should place more focus on particulate matter (PM) emissions in their anti-pollution strategies, and support research and development activities to include non-tailpipe emissions.
Case study: Seestadt Aspern, ViennaSeestadt Aspern in Vienna is one of the largest mixed-use development areas in Europe. Unlocked by the extension of the U2 metro line, a new neighbourhood is being developed to provide homes for 20,000 people at urban density, surrounded by high-quality green space. The mobility targets for the development are 40 per cent active modes, 40 per cent public transport and only 20 per cent car. This is achieved by providing services and facilities within easy walking and cycling distance, and delivering a high quality of public realm throughout the development. The majority of car parking is retained in collective garages and the majority of streets in the development are pedestrianised areas. School facilities, high-quality green spaces, and local shops and facilities have been delivered early in the development phasing, and new residents and businesses are encouraged to cooperate on events and other community initiatives.108

75
The principle of Good Growth has been recognised by both the previous and current Mayors of London.109 There have been many different sets of design principles drawn up to achieve good growth and encourage healthy active lifestyles. These include the seven objectives of urban design by the Commission for Architecture and the Built Environment,110 Jan Gehl’s 10 urban transport principles,111 the Building for Life 12 guide,112 the Healthy Streets indicators,113 and Sport England’s Active Design principles,114 to name but a few.
Drawing on the common elements of these, and leaning on the Commission’s objectives, we have drawn up our own list of general attributes of well-designed roads and streets, to encourage the use of active modes and public transport, and to create a high quality of life for residents.
1—Character: a place with its own distinctive identity.
2— Quality: clearly defined, attractive, well-maintained public spaces (including green areas) that people want to spend time in.
3— Integration: respecting historical and urban context and integrated into its surroundings.
4— Connected: easy access to local facilities and amenities within walking distance, co-location of facilities should be promoted through mix of land uses.
5— Transport: good public transport links, easy access to stations and stops.
6— Easy to walk: clear and intuitive sense of space ownership, sufficient crossing points, appropriate speed controls, creating a safe environment for pedestrians, accessible for people with restricted mobility.

76
7— Easy to cycle: clearly defined, safe and integrated cycle routes and sufficient bicycle parking.
8— Parking: minimal resident and visitor car parking, sufficient bicycle parking, EV charging infrastructure, car club bays and pick-up/drop-off space for mobility service providers.
9— Amenity: multifunctional open spaces to support activities including sport, recreation and play.
10— Social value: sufficient community spaces, with shade, places to rest, street art and a range of social activities.
While such general principles provide a useful basis for well-designed roads and streets, the principles need to be carefully applied to reflect local context and circumstances.
3.6.2 Enabling delivery of better streets and placesFunding is one of the main barriers to the delivery of better streets. It is accepted that public sector funding is scarce and under strain, but long-term strategies for street improvement can be formulated within maintenance budgets using consistent design specifications.
The Mayor can take a positive leadership role through the promotion of new projects and through the allocation of TfL funding to the boroughs. There is an opportunity here for London to adopt a radical programme of street improvements with the aim of, through consistent implementation over a prolonged period, creating an urban realm as good as any other city in the world.
Recommendation 17: Spatial planning and urban design policies for densifying places, especially Opportunity Areas, which should apply a set of strategic principles to actively promote non-car-dependent and healthy lifestyles from the outset.

77
Case study: Hornchurch Town CentreThe public realm in Hornchurch town centre in Havering was transformed in 2013 in response to traffic congestion, poor personal safety, and a lack of inclusive design. The London Borough of Havering implemented a public realm improvement scheme with a focus on improving pedestrian access. This was achieved by removing guardrails, moving crossings to desire lines, making bus stops accessible, widening footways and creating a long central strip enabling pedestrians to cross through slow-moving vehicles. The scheme also recognises the multiple place functions of the high street with new lighting, planting and street furniture.115
Case Study: Camden Boulevard ProjectIn 2000 Camden set up the ‘Boulevard Project’ as a response to the high level of personal injury claims that it was receiving. The concept was simple – design a standard heavy-duty paving slab that could be laid to a very exacting specification (on a strong base and close jointed). This was durable, and could be machine cleaned and washed. £5 million was allocated annually from the parking account to supplement the existing maintenance budgets. The standard design was then applied across the borough and a consistent public realm achieved along with a very significant reduction in claims. A street cleaning and enforcement regime was then introduced on this platform. This is an example of consistency in design to raise the basic standards over a prolonged period.116
The case studies set out above, and other catalogues, review some of London’s recent public realm improvement schemes,117 and show the level of design quality that we can achieve as a city. Yet, away from the high-profile schemes, much of London’s public realm is poorly designed and maintained. Many of the streets we use every day bear the scars of decades of car-dominant engineering, coupled with a patchwork of reactive maintenance and well-intentioned but spatially limited improvement schemes.
A great deal of money is spent maintaining and improving London’s roads and streets every year, but this comes from a wide variety of budgets, including road maintenance and safety budgets. If this spending was properly targeted and coordinated it could, over time, dramatically improve the quality of the capital’s public realm. TfL and the boroughs should ensure that spending on the improvement and management of London’s roads

78
Recommendation 18: TfL and the boroughs should ring-fence budgets and coordinate public realm investment through a design-led implementation programme, while LIP funding is allocated on condition of consistent street design manuals that set out long-term plans to restructure the streetscape, and using annual design review audits of major public realm schemes and maintenance activities.
and streets is coordinated and design-led. A proportion of additional revenues resulting from measures proposed in this report (such as road pricing and the restructuring of parking charges) should also be ring-fenced for streets investment, with a funding formula agreed to ensure a fair allocation between TfL and the boroughs.
Each London borough is required to develop a Local Implementation Plan (LIP) that sets out how the borough will deliver the Mayor’s Transport Strategy at the local level. TfL allocates financial support to boroughs to deliver transport improvement schemes via LIP funding packages, and boroughs also fund improvements directly. The annual LIP grant to boroughs might be used for leverage, with long-term plans required as a condition of grant.
A robust monitoring and audit strategy would also be needed to accompany these funding arrangements. Each year, London boroughs must submit details of individual schemes they want to take forward with LIP funding and how they have delivered a range of priorities relating to the Mayor’s Transport Strategy. Within this process, a sample of investment in major public realm schemes and maintenance activities could be audited by an independent design review panel on an annual basis, with the results of this audit being one of the performance criteria used in the allocation of LIP grant funding.
Lack of capacity and leadership are also challenges for the implementation of good design. Some of the great city leaders have been ‘visionary tinkerers’ – combining a sense of purpose and vision with attention
79
to detail and delivery. However, good growth and design considerations are not always prioritised, or understood, at city and borough leadership level.
In July 2017, the Mayor of London launched a Good Growth by Design campaign, appointing 50 architects and design experts as Mayor’s Design Advocates
“to undertake design inquiries on critical architecture, urban design and place-shaping issues, to flesh out what Good Growth means in practice and to set the standards for its delivery”.118
The Design Advocates’ guidance will serve to inform GLA and TfL policy and delivery. In addition, City Hall launched a new social enterprise, Public Practice, to place talented designers and planners in local authorities for up to a year, with the aim of plugging the skills gaps.119
High-profile public realm schemes can help galvanise political support around the importance of design and the Mayor can lead the way in this. For example, the Design Advocates could identify a series of exemplar public realm schemes (e.g. Mayor’s 100 Healthy Spaces)120, including new projects in central London and outer London town centres and high streets. While the Mayor and GLA have a significant role, many initiatives require localised policy measures and schemes to reimagine ordinary residential streets and everyday spaces. Many boroughs already place high value on quality urban spaces, but this needs to be more consistent across the capital. There are opportunities to leverage partnerships – whether that is with the GLA and TfL or the private sector. Reducing public spending, and the desire to do more, means that there is a growing interest of ‘tactical urbanism’, where lower-cost, neighbourhood-level schemes can be trialled, playing a vital role in helping to learn by doing.
The big data revolution could also help improve London’s public realm. Planners have far more information that they did 15 years ago about how we move around and enjoy the city. TfL and the boroughs are already using big data to understand and improve

80
movement but they should ensure they use it to enhance the place aspects of London’s roads and streets, allowing a greater understanding of how people negotiate the public realm and interchange between transport modes. While it would tempting for TfL to settle for generic big data solutions, capturing car and public transport trips only, we recommend that they use big data to facilitate better street design by measuring people movement at a local scale.
3.7 Maximising the benefits of new mobility servicesThe emergence of new technologies and new forms of mobility services means that cities around the world will be faced with unfamiliar challenges. These services will have profound impacts, in particular on public transport systems.121
As a leading world city, London should take a proactive stance and seek to shape the service offering and the regulatory framework in a way that maximises the benefits to Londoners. We cannot predict with any confidence how transport technologies and services will develop. However, the Commission recognises that both mobility as a service (MaaS) and connected and autonomous vehicles (CAVs) could deliver important benefits to London’s roads and streets, but equally pose risks that need to be managed.
Recommendation 19: Good growth and design principles need to be championed at borough leadership level, with better integration between local authorities’ planning, architecture, engineering and design functions. As part of the good growth agenda, the Mayor’s Design Advocates should champion a series of exemplar public realm schemes to showcase good design filtering down to everyday streets and spaces.

81
3.7.1 Mobility as a ServiceThe Commission has sought to understand what MaaS means in a London context. There are three key components of MaaS that connect users and service operators:
• An information platform where users can compare different mobility options;
• Sales and payment channels where users can purchase their mobility; and
• Some form of subscription model where mobility services are bundled or packaged.
Figure 6: Existing mobility services in London
Users
IntegratorsCommon information platform
Subscription
Fare payment mechanism
Mobile service operators
Buses Taxi / PHVLU / LO / DLR / Other rail
River Cycle hire Car club

82
Alternative models for delivering MaaS
MaaS Global is a Finnish company offering users bundled packages of mobility services in Helsinki as a municipal-led project, but now trialling a similar approach with deregulated transport services in the West Midlands.122 The packaging of mobility services under the latter model relies on mobility providers offering discounted rates to gain access to market share.
Travelspirit, an independent think tank representing SMEs in the MaaS sector, argues for an open-source data platform underpinning the development of new mobility apps, in contrast to the more closed system that currently operates.123 An open data platform would allow apps to customise journey options using the services of multiple operators, and it would allow operators to access aggregated data about demand from external parties.
The Commission believes that there is a clear case for a municipal-led approach in London because TfL already operates the basic skeleton of MaaS-enabled infrastructure, and its role could include ownership of the data integration platform. The newly appointed Chief Digital Officer may have a role to play in overseeing the development and trajectory of this technology in the capital.
There are essentially three types of mobility services in London:
1— The public transport services included in the TfL fares system (Travelcard and daily capping) are packaged and sold under what already constitutes a subscription model. This includes price-integrated, but externally run operations, such as regional rail services.

83
2— Other TfL services, such as the river buses and Santander cycle hire, share some information and/or payment platforms but are not linked to a Travelcard or daily-capping fare payment.
3— External mobility services, including private hire vehicles, taxis and car clubs, have completely separate information and payment systems.
Parking information and payment could also be included as one of the core components of MaaS in London in the short-term (particularly for car clubs, but also for private cars), so providing a transparent approach to journey decision-making. Incorporating parking availability data and the ability to book spaces into the MaaS platform would facilitate a quick roll-out, enable benefits to be quickly realised and contribute revenue to support further MaaS investment that may not be profitable.
The expansion of TfL into a mobility service provider or broker poses a number of challenges.
First, can TfL act as regulator, integrator and operator of services in the same market? This is one of the issues addressed in a recent study by the International Transport Forum,124 which concluded that MaaS faces many of the traditional ideological issues found with public transport provision. On the one hand, MaaS provision is a natural monopoly, and passenger utility is maximised with a single dispatcher (an organising body for the service), because this produces the highest number of available journey options at a given point in time. On the other hand, monopolies are prone to producer capture – they can be slow to support or adopt innovation, and to industrial action.
If TfL were to bring further mobility services into its platform, what should these be and on what basis? The Commission endorses the six general principles set out by the Mayor’s Transport Strategy (policy 21): Supporting mode shift away from car travel; Complementing the

84
public transport system; Opening travel to all; Cleaning London’s air; Creating a safe, attractive environment; and Using space efficiently.125 Under these criteria, the case for maintaining close regulation of cycle hire services and the further integration of car clubs and cycle hire services is clear.
It may be that further quality criteria should be applied to mobility services wishing to be included in a TfL subscription model. For example, the case for PHVs and taxis is considerably more complex due to the national regulatory framework that is clearly not fit-for-purpose in the 21st century and provides the Mayor with few policy levers.
The London boroughs have responsibility for parking policy on most London streets and are therefore the regulatory body for car clubs in London. The boroughs have tended to adopt differing policies and standards with the result that pan London car club services have been slow to develop. While boroughs may wish to retain control of the parking spaces made available to such operators, London would benefit from a common operating license for these services.
One immediate solution would be to extend TfL’s existing payment platform (Oyster and contactless) to incorporate new types of services like car clubs, cycle hire, taxis and PHVs. Essentially this would comprise a form of mobility credits that can be used to pay for services on a subscription or Pay-As-You-Go basis. Users wishing to pay for car club services would need to register information about their driving licence for example, but this would not present a serious hurdle. One advantage of extending TfL platforms is that boroughs would be able to use them to offer credits that incentivise residents to give up car ownership, and developers would be able to offer credits in lieu of a parking space in new developments.

85
The Commission believes that authorities and London government should take an active role in promoting MaaS and supporting experiments with new business models. One idea, as identified in the earlier discussion of road pricing, would be for TfL to offer additional mobility services directly, for example where workers need to access services out of hours. TfL could trial such an approach in conjunction with one of the NHS trusts in London, offering workers an enhanced Travelcard subscription that includes credits for using taxi/PHV or floating car club services at night. The enhanced subscription could be means-tested with subsidies for lower income key workers.
Experience has shown that a confined iterative approach works best with MaaS services, allowing experimentation with a platform that comprises both payment and journey management components. Another option would be for TfL to experiment with a hybrid of bus and taxi services. There are areas of outer London where the operations of scheduled bus services are heavily subsidised, and taxis and PHVs are widely used. TfL should trial a shared mobility service in one of these areas as an alternative to buses. If these are to form part of the integrated TfL network, they would need to be appropriately branded and presented alongside scheduled services with a common information and
Recommendation 20: TfL should progress with Smart Ticketing and create a form of mobility credits for MaaS to be available on existing payment platforms (Oyster and contactless) that enables users to purchase mobility services across London on a subscription and Pay-As-You-Go basis.
Recommendation 21: TfL should trial the provision of a mobility services subscription as an extension of the Travelcard, initially targeting lower income key workers travelling at night.

86
ticketing platform. If the experiments are successful, TfL would need to develop a new category of operating license for these shared hybrid mobility services.
3.7.2 Automation on the road networkThe boroughs and TfL, like other highways authorities, need to adapt to rapidly changing technologies. Widespread adoption of fully automated vehicles is likely to be some years away, but some partial automation technologies are already with us, including in-vehicle information and driver assistance.
Connected Autonomous Vehicles (CAVs) are undergoing trials within the UK and internationally. Encouraging the uptake of CAVs could bring benefits to London’s roads particularly through:126
– Change in car ownership model – people are less likely to own a car if they can call one up electronically.
– More reliable journey times – connected vehicles can adapt routes to changing road circumstances in real time.
– More efficient use of existing infrastructure – automated vehicles allow smoother traffic flows and shorter following distances.
– Improved safety – the more automated a vehicle, the smaller the opportunity for human error.
– Reduction in street furniture – vehicular road marking and traffic signs could become redundant with full automation.
Recommendation 22: TfL should identify a low density test area to trial the replacement of a scheduled bus route with a demand-responsive transport service, and evaluate the impacts on operational costs, service quality and social inclusion.

87
– Less parking – searching for which can be a significant contributor to congestion, although their unoccupied circulation would need to be managed.
However, it must be stressed that connected and autonomous vehicle technology is still developing and the way they will end up interacting with roads, streets and different users groups in the capital is still relatively unknown.
Some of the potential benefits of connected vehicles are more tangible and can be realised in the near future. For example, using existing technology, the Traffic Control Centre is already able to make ever greater use of proactive messaging to alert vehicles of incidents, to reroute traffic away from problem areas and potentially even to provide incentives to users to retime their journey.
Much of the literature selling the benefits of automated vehicles to users focuses on the turn-up-and-go nature of the service provided. There would be fewer vehicles overall and those would be used more, and parked less. Yet two issues are often overlooked. First, highway authorities need to consider how to accommodate a large number of drop off and pick up operations. The level of management required at the taxi ranks of major airports and railway stations provides an indication of the challenges associated with such operations at a large scale. Second, while shared vehicles would reduce the overall amount of parking space needed in a city, there remain questions about what happens to vehicles when they are not occupied. Highway authorities would need to avoid creating incentives for vehicles to simply circulate while waiting for their passengers, and to create stacking capacity for vehicles when demand is low, so that they can be released when demand is higher.
London government currently has very limited powers to regulate CAVs. But as the issues outlined above illustrate, new vehicular technologies are likely to

88
pose distinct problems for the capital, and so we need to start putting in place the right frameworks now.
Below we set out seven principles that should govern London’s response to new transport technologies:
1— Vehicles carrying the most passengers should get priority. Any kerb space freed up by the decline in car parking should be used to support public transport, active travel and a more attractive and lively public realm.
2— London should prioritise the development of mobility services that are socially inclusive; offering access to all, use zero-emission vehicles, and make the most efficient use of energy and road space by minimising empty running.
3— The principles of ‘user pays’ and ‘polluter pays’ should govern access to London’s roads for CAVs, whether MaaS or private vehicles. Charges should relate to vehicles rather than occupants to incentivise the use of more efficient use of the road network, and will extend to times when the vehicles are not occupied.
4— The gradual deployment of new vehicle automation technologies should be encouraged where this improves safety and accessibility.
5— Street design will need to adapt to new requirements as a result of increasingly automated vehicles, which will create pressure on kerb space from waiting vehicles. TfL and the boroughs as highway authorities should use similar principles as currently for parking: regulating access for safety and using price to manage demand for the most convenient waiting spaces (with priority access for disabled passengers linked to individuals rather vehicles).

89
6— There should be no loss of access or priority given to pedestrians and cyclists as a result of the deployment of autonomous vehicles, even if this compromises their performance.
7— As with all other areas of technology, issues of cybersecurity will continue to grow in importance as the ‘Internet of Things’ develops. Adequate safeguards should be in place to ensure systems remain safe and secure from cyber-attacks.
Recommendation 23: The Mayor and TfL should develop an appropriate framework for governance of connected and autonomous vehicles, and in doing so develop a full automation strategy for transport in London.


Conclusion and recommendationsWith an ever intensifying pace of change, London’s roads and streets are facing a series of challenges and opportunities, from harnessing the potential of new mobility services, to enabling efficient movement of goods and services across the city. The recommendations proposed by this report, summarised below, will help achieve the Commission’s vision for London.

92
If the city is not going to grind to a halt, we will have to adopt quite different approaches to car ownership and use, freight and services.
Achieving our vision for London will involve brave, skilled and farsighted leadership. But it is eminently achievable.
London faces a number of chronic problems that it has to address if it is going to retain its position as one of the world’s leading cities – with all the benefits this brings, not just to London, but to the UK as a whole. It needs to address its severe housing shortage. It needs to continue to extend its rail services. But it also needs to tackle the problems facing its roads and streets.
These latter problems might look particularly daunting. If the city is not going to ground to a halt in a welter of polluted air and dirty streets, we will have to adopt quite different approaches to car ownership and use, freight and services. More of us will have to give up the car parking space right outside our homes in favour of shared solutions. We will have to drive less and use trains, buses and bikes more. Businesses will have to develop a more coordinated and efficient way of moving goods around.
The Commission recognises that these changes won’t go unopposed, but does not believe that moving the city on in the way we have set out here is as difficult a task as it might seem. London has already made large strides: car ownership and use has declined, more of us are cycling and many more of us are using public transport. As the city grows and low density areas of the city become more populated so local public transport services will improve and local high streets and town centres will flourish, hence reducing the need to travel. Cycling infrastructure and wider, attractive pavements will encourage more of us to walk and cycle. New technology will make it ever easier to move around the city without a private car.
Achieving our vision for London will involve brave, skilled and farsighted leadership. But it is eminently achievable.
The following table lists the recommendations proposed in this report, highlighting the governance structures they are primarily targeted at, and the time by which they need to be achieved: short-term (present-2020) and medium-term (2020-2024).

93
Rec
omm
end
ati
onTf
LM
ayo
rB
orou
gh
Tim
esca
le
1
TfL
and
the
bor
ough
s sh
ould
con
tinue
to
real
loca
te s
pa
ce in
line
with
a c
lea
r ro
ad
spa
ce
hier
arc
hy, u
sing
inte
llig
ent
stre
et d
esig
n to
pri
orit
ise
the
mos
t ef
ficie
nt a
nd a
pp
rop
ria
te
mod
es b
y pr
ovid
ing
a co
mbi
natio
n of
: ade
qua
te p
edes
tria
n sp
ace,
new
seg
rega
ted
cycl
ing
lane
s an
d Q
uiet
way
s, p
riorit
y b
us la
nes
and
rapi
d b
us t
rans
it se
rvic
es, a
nd c
onsi
dera
tion
of
whe
re e
mer
ging
sha
red
mob
ility
ser
vice
s si
t in
thi
s hi
erar
chy.
XX
Shor
t-te
rm
and
med
ium
- te
rm
2Th
e M
ayor
and
TfL
sho
uld
com
mit
to d
evel
opin
g a
pan
Lon
don,
pre
-pay
sm
art
road
use
r pr
icin
g sc
hem
e by
20
20. T
he s
chem
e ne
eds
to re
flect
the
inte
rnal
and
ext
erna
l cos
ts a
nd
envi
ronm
enta
l im
pac
ts o
f jou
rney
s, w
hile
bei
ng fa
ir, a
nd e
asy
to u
nder
stan
d an
d ad
min
iste
r.X
XSh
ort-
term
a
nd m
ediu
m-
term
3
TfL
shou
ld in
vest
iga
te s
hort
ter
m c
hang
es t
o th
e ex
istin
g sc
hem
e, in
clud
ing
rem
ovin
g th
e ex
emp
tion
from
PH
Vs,
incr
emen
tally
red
ucin
g th
e re
sid
ent
dis
coun
t, in
trod
ucin
g va
riab
le
cha
rgin
g p
erio
ds
to b
ette
r m
atc
h d
ema
nd, a
nd e
xplo
ring
the
intr
oduc
tion
of a
dd
ition
al
zone
s in
are
as w
ith h
igh
cong
estio
n.
XX
Shor
t-te
rm
4Tf
L sh
ould
see
k to
dev
elop
its
roa
d ne
twor
k co
ntro
l sys
tem
s to
max
imis
e th
e b
enef
its
of
rea
l-ti
me
da
ta e
xcha
nge
wit
h ex
tern
al p
art
ners
, and
rev
iew
its
stra
teg
ic r
oa
d n
etw
ork
m
anag
emen
t obj
ectiv
es, t
o im
prov
e jo
urne
y tim
e re
liabi
lity
and
man
age
air q
ualit
y ho
tspo
ts.
XSh
ort-
term
5Th
e M
ayor
and
TfL
sho
uld
deve
lop
a ne
w L
ondo
n M
ovem
ent
Cod
e an
d an
acc
omp
anyi
ng
pub
lic a
war
enes
s an
d tr
aini
ng c
amp
aign
to
guid
e in
tera
ctio
n b
etw
een
diff
eren
t ro
ad u
sers
, w
ith b
oth
exis
ting
and
new
tra
ffic
rul
es e
nfor
ced
by a
ded
ica
ted
enfo
rcem
ent
bod
y.X
XSh
ort-
term
a
nd m
ediu
m-
term
6
Bor
ough
s an
d Tf
L sh
ould
con
tinue
to
roll
out
diff
eren
t tr
affic
man
agem
ent
and
rest
rictio
n m
easu
res
– su
ch a
s fil
tere
d p
erm
eabi
lity,
road
clo
sure
s, s
choo
l str
eets
and
enc
ount
er z
ones
–
usin
g lo
cal t
rial i
nter
vent
ions
to
fine
tune
fin
al d
esig
ns, t
o m
eet
the
obje
ctiv
es o
f im
prov
ing
safe
ty a
nd e
ncou
rage
mod
al s
hift
.
XX
Shor
t-te
rm
and
med
ium
-t
erm

94
Rec
omm
end
ati
onTf
LM
ayo
rB
orou
gh
Tim
esca
le
7Tf
L a
nd t
he b
oro
ughs
sho
uld
ag
ree
new
ker
b s
pa
ce h
iera
rchi
es t
o g
over
n p
ark
ing
and
ke
rb s
pa
ce a
lloca
tio
n a
nd u
nder
take
reg
ula
r lo
cal r
evie
ws.
XX
Shor
t-te
rm
8
Bor
ough
s sh
ould
ado
pt re
side
ntia
l par
king
pol
icie
s as
par
t of
the
ir Tr
affic
Red
uctio
n Pl
ans.
Th
ese
shou
ld in
clud
e a
char
ging
regi
me
that
lim
its re
side
ntia
l par
king
per
mits
at
sust
aina
ble
leve
ls; l
imits
on
the
num
ber
of p
erm
its p
er h
ouse
hold
, with
esc
alat
ing
char
ges
for a
dditi
onal
a
nd m
ore
po
lluti
ng v
ehic
les;
rem
ovin
g a
uto
ma
tic
pa
rkin
g p
erm
it r
ight
s w
hen
pro
per
ties
a
re s
old
; inc
enti
ves
tha
t en
cour
ag
e ho
useh
old
s to
giv
e up
the
ir p
ark
ing
per
mit
s, s
uch
as
Oys
ter c
ard
cred
it, d
isco
unte
d ca
r clu
b m
emb
ersh
ips
or c
redi
ts fo
r mob
ility
ser
vice
s; m
inim
al
resi
dent
ial p
arki
ng p
rovi
sion
on
new
dev
elop
men
ts.
XSh
ort-
term
a
nd m
ediu
m-
term
9B
oro
ughs
sho
uld
co
nsid
er in
tro
duc
ing
vari
ab
le c
harg
es f
or
non-
resi
den
tia
l sho
rt-s
tay
pa
rkin
g w
ith
the
aim
of
ach
ievi
ng 8
5-9
0 p
er c
ent
occ
upa
ncy.
XSh
ort-
term
10
Usi
ng t
he k
erb
sp
ace
hie
rarc
hies
, bo
roug
hs s
houl
d d
evel
op
a r
ob
ust
cycl
e p
ark
ing
stra
tegy
incl
udin
g th
e re
allo
catio
n of
ker
b sp
ace
to
cycl
e p
ark
ing
. TfL
mus
t en
sure
tha
t th
e cy
cle
pa
rkin
g st
rate
gy
is a
co
ndit
ion
of e
ligib
ility
fo
r b
oro
ughs
’ LIP
fun
din
g a
nd
act
ivel
y m
oni
tor
del
iver
y.
XX
Shor
t-te
rm
11
Bor
ough
s sh
ould
enc
oura
ge o
ff-s
ite c
onso
lidat
ion
by u
tilis
ing
asse
ts s
uch
as u
nder
used
car
p
arks
to
prov
ide
mic
ro-c
onso
lidat
ion
and
last
-mile
del
iver
y ca
pac
ity fo
r SM
Es, e
stab
lishi
ng
zero
-em
issi
on d
eliv
ery
zone
s ar
ound
cer
tain
bus
ines
s di
stric
ts, a
nd le
adin
g by
exa
mpl
e by
co
nsol
idat
ing
proc
urem
ent
prac
tices
. BID
s an
d b
usin
ess
esta
tes
shou
ld a
lso
coor
dina
te o
n-
and
off-
site
con
solid
atio
n.
XSh
ort-
term
a
nd m
ediu
m-
term
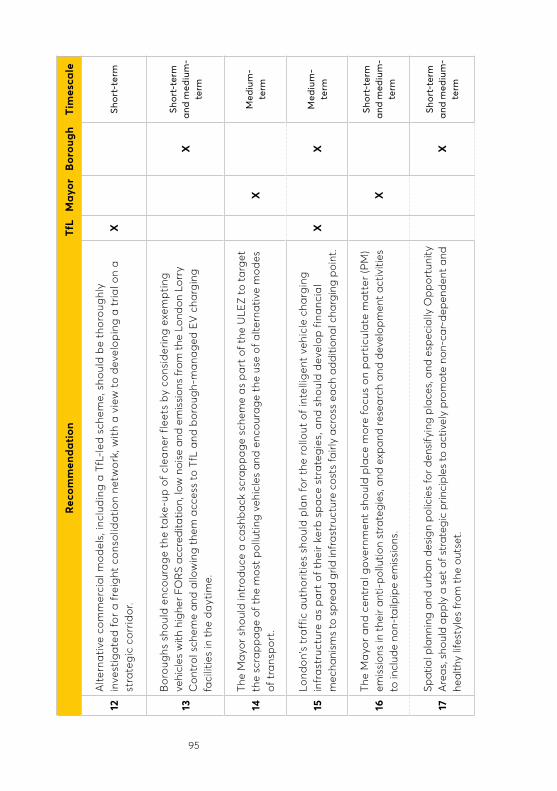
95
Rec
omm
end
ati
onTf
LM
ayo
rB
orou
gh
Tim
esca
le
12A
lter
nati
ve c
om
mer
cia
l mo
del
s, in
clud
ing
a Tf
L-le
d s
chem
e, s
houl
d b
e th
oro
ughl
y in
vest
iga
ted
fo
r a
frei
ght
co
nso
lida
tio
n ne
two
rk, w
ith
a vi
ew t
o d
evel
op
ing
a tr
ial o
n a
stra
teg
ic c
orr
ido
r.X
Sho
rt-t
erm
13
Bo
roug
hs s
houl
d e
nco
ura
ge
the
take
-up
of
clea
ner
flee
ts b
y co
nsid
erin
g ex
emp
ting
ve
hicl
es w
ith h
ighe
r FO
RS
accr
edita
tion,
low
noi
se a
nd e
mis
sion
s fr
om t
he L
ondo
n Lo
rry
Con
trol
sch
eme
and
allo
win
g th
em a
cces
s to
TfL
and
bor
ough
-ma
nag
ed E
V c
harg
ing
faci
litie
s in
the
day
time.
XSh
ort-
term
a
nd m
ediu
m-
term
14Th
e M
ayor
sho
uld
intr
oduc
e a
cash
ba
ck s
cra
pp
ag
e sc
hem
e as
pa
rt o
f the
ULE
Z to
ta
rget
th
e sc
rap
pa
ge
of t
he m
ost
pol
lutin
g ve
hicl
es a
nd e
ncou
rag
e th
e us
e of
alte
rna
tive
mod
es
of t
rans
por
t.X
Med
ium
-te
rm
15Lo
ndo
n’s
tra
ffic
aut
horit
ies
sho
uld
pla
n fo
r th
e ro
llout
of
inte
llig
ent
vehi
cle
cha
rgin
g in
fra
stru
ctur
e a
s p
art
of
thei
r ke
rb s
pa
ce s
tra
teg
ies,
and
sho
uld
dev
elo
p f
ina
ncia
l m
echa
nism
s to
spr
ead
grid
infr
astr
uctu
re c
osts
fairl
y ac
ross
eac
h ad
ditio
nal c
harg
ing
poi
nt.
XX
Med
ium
-te
rm
16Th
e M
ayo
r a
nd c
entr
al g
over
nmen
t sh
oul
d p
lace
mo
re f
ocu
s o
n p
art
icul
ate
ma
tter
(PM
) em
issi
ons
in t
heir
anti-
pol
lutio
n st
rate
gies
, and
exp
and
rese
arch
and
dev
elop
men
t ac
tiviti
es
to in
clud
e no
n-ta
ilpip
e em
issi
ons.
XSh
ort-
term
a
nd m
ediu
m-
term
17Sp
atia
l pla
nnin
g an
d ur
ban
des
ign
pol
icie
s fo
r den
sify
ing
plac
es, a
nd e
spec
ially
Opp
ortu
nity
A
reas
, sho
uld
appl
y a
set
of s
trat
egic
prin
cipl
es t
o ac
tivel
y pr
omot
e no
n-ca
r-de
pen
dent
and
he
alth
y lif
esty
les
from
the
out
set.
XSh
ort-
term
a
nd m
ediu
m-
term

96
Rec
omm
end
ati
onTf
LM
ayo
rB
orou
gh
Tim
esca
le
18
TfL
and
the
bor
ough
s sh
ould
rin
g-fe
nce
bud
get
s a
nd c
oord
ina
te p
ublic
rea
lm in
vest
men
t th
roug
h a
des
ign-
led
imp
lem
enta
tio
n p
rog
ram
me,
whi
le L
IP f
und
ing
is a
lloca
ted
on
cond
ition
of c
onsi
sten
t st
reet
des
ign
ma
nual
s th
at
set
out
long
-ter
m p
lans
to
rest
ruct
ure
the
stre
etsc
ape,
and
usi
ng a
nnua
l des
ign
revi
ew a
udits
of m
ajor
pub
lic re
alm
sch
emes
and
m
aint
ena
nce
act
iviti
es.
XX
Shor
t-te
rm
and
med
ium
- te
rm
19
Goo
d gr
owth
and
des
ign
prin
cip
les
need
to
be
cha
mp
ione
d a
t b
orou
gh le
ad
ersh
ip le
vel,
with
bet
ter
inte
gra
tion
bet
wee
n lo
cal a
utho
ritie
s’ p
lann
ing
, arc
hite
ctur
e, e
ngin
eerin
g a
nd
desi
gn fu
nctio
ns. A
s p
art
of t
he g
ood
grow
th a
gend
a, t
he M
ayor
’s D
esig
n A
dvoc
ates
sho
uld
cha
mp
ion
a se
ries
of
exem
pla
r p
ublic
rea
lm s
chem
es t
o sh
owca
se g
oo
d d
esig
n fil
teri
ng
dow
n to
eve
ryd
ay
stre
ets
and
sp
ace
s.
XX
Sho
rt-t
erm
20Tf
L sh
ould
pro
gres
s w
ith S
ma
rt T
icke
ting
and
cre
ate
a fo
rm o
f mob
ility
cre
dit
s fo
r M
aaS
to
be
avai
lab
le o
n ex
istin
g p
aym
ent
pla
tfor
ms
(Oys
ter
and
con
tact
less
) tha
t en
ab
les
user
s to
p
urch
ase
mob
ility
ser
vice
s a
cros
s Lo
ndon
on
a su
bsc
riptio
n a
nd P
ay-A
s-Yo
u-G
o b
asis
.X
Shor
t-te
rm
and
med
ium
- te
rm
21Tf
L sh
oul
d t
ria
l the
pro
visi
on
of a
mo
bili
ty s
ervi
ces
sub
scri
pti
on
as
an
exte
nsio
n of
the
Tr
ave
lca
rd, i
niti
ally
ta
rget
ing
low
er in
com
e ke
y w
ork
ers
tra
velli
ng a
t ni
ght
.X
Sho
rt-t
erm
22Tf
L sh
oul
d id
enti
fy a
low
den
sity
tes
t a
rea
to t
ria
l the
rep
lace
men
t of
a s
ched
uled
b
us r
out
e w
ith
a d
ema
nd-r
esp
ons
ive
tra
nsp
ort
ser
vice
, and
eva
lua
te t
he im
pa
cts
on
op
era
tio
nal c
osts
, ser
vice
qua
lity
and
so
cia
l inc
lusi
on
XSh
ort
-ter
m
and
med
ium
-t
erm
23Th
e M
ayor
and
TfL
sho
uld
deve
lop
an a
ppro
pria
te fr
amew
ork
for g
over
nanc
e of
con
nect
ed
and
auto
nom
ous
vehi
cles
, and
in d
oing
so
deve
lop
a fu
ll au
tom
atio
n st
rate
gy fo
r tra
nsp
ort
in L
ondo
n.X
XSh
ort-
term
a
nd m
ediu
m-
term


References

99
1. Harari, D. (2016) Regional and local economic growth
statistics. House of Commons Briefing Paper, Number 05795
2. London First (2016) London Congestion Trends. Retrieved
from http://londonfirst.co.uk/wp-content/uploads/2016/05/
London-Congestion-Trends-FINAL.pdf
3. Transport for London (2017) Travel in London Report 9.
Retrieved from http://content.tfl.gov.uk/travel-in-london-
report-9.pdf
4. Transport for London (2013) Central London Cycle Census.
Technical Note. Retrieved from http://content.tfl.gov.uk/cycle-
census-technical-note.pdf
5. The average speed on major roads has fallen from 19.9mph
to 17.7mph from 2012/13 to 2015/16. See The London
Assembly (2017) London Stalling: Reducing Traffic Congestion
in London. Retrieved from https://www.london.gov.uk/sites/
default/files/london_stalling_-_reducing_traffic_congestion_
in_london.pdf
6. Total vehicle delays (7am – 7pm) rose by nearly half a
million minutes per kilometre to 2.85m from 2012/13 to
2014/15, costing £5.5bn annually. See Transport for London
(2016) Traffic Note 4: Total vehicle delay for London 2014-15.
Retrieved from http://content.tfl.gov.uk/total-vehicle-delay-
for-london-2014-15.pdf
7. Transport for London (2016) Programmes and Investment
Committee: Surface Intelligent Transport System. Retrieved
from http://content.tfl.gov.uk/05-p1-sits-pas.pdf
8. Journey time reliability on the Transport for London Road
Network (TLRN) has dropped from 89.2 per cent to 87.8 per
cent from 2012/13 to 2015/16. See The London Assembly (2017)
London Stalling: Reducing Traffic Congestion in London.
Retrieved from https://www.london.gov.uk/sites/default/
files/london_stalling_-_reducing_traffic_congestion_in_
london.pdf
9. Costley, T. and Gray, M. (2013) Public Attitudes to Roads
in England: Wave 1. London: Department for Transport.
Retrieved from https://www.gov.uk/government/uploads/
system/uploads/attachment_data/file/395093/public-
attitudes-roads-england-wave-1.pdf
10. Transport for London (2017) 2016/17 buses performance data,
long-term trends. Retrieved from https://tfl.gov.uk/corporate/
publications-and-reports/buses-performance-data

11. The percentage of journey stages completed by car (driver
or passenger) has fallen from 52 per cent to 42 per cent from
2005/6-2015/6, falling from just over 8 million stages to a
little more than 7 million, while travel time spent as the driver/
passenger of a car has fallen from 26.4 minutes per person
per day in 2005/6 to 20.9 by 2015/6. See Transport for London
(2017) London Travel Demand Survey: 2015/16
12. This equilibrium is dependent on a number of factors –
including vehicle ownership levels, road capacity and
available of alternatives – that change over time, and is
difficult to mitigate. See Metz, D. (2017) The Problem of
Urban Road Traffic Congestion: a policy review
13. Child Poverty Action Group (2017) Child poverty in London -
key facts. Retrieved from http://www.cpag.org.uk/campaigns/
child-poverty-london/keyfacts
14. Travers, T., Sims, S. and Bosetti, N. (2016) Housing and
Inequality in London. Centre for London. Retrieved from
https://www.centreforlondon.org/wp-content/uploads
/2016/08/CFLJ4292-London-Inequality-04_16_WEB_V4.pdf
15. Leadbeater, C. Wilson, B. and Theseira, M. (2014) Hollow
Promise: How London fails people on modest incomes and
what should be done about it. Centre for London. Retrieved
from https://www.centreforlondon.org/wp-content/
uploads/2016/08/CFL-Hollow-Promise-Report-1.pdf
16. 51 per cent of the lower super output areas in the most
deprived decile compared to only 1 per cent within the top
decile. See Greater London Authority (2016) The Economic
Evidence Base for London. Ch.7 The Economics of London’s
Environment. Retrieved from https://www.london.gov.
uk/sites/default/files/economic_evidence_base_2016.
compressed.pdf
17. The Royal Society for the Prevention of Accidents (2012) Social
Factors in Road Safety, Policy Paper. Retrieved from https://
www.rospa.com/rospaweb/docs/advice-services/road-safety/
social-factors-in-road-safety.pdf
18. Hanna, K. and Bosetti, N. (2015) Inside Out: The New
Geography of Wealth and Poverty in London. Centre
for London. Retrieved from http://www.centreforlondon.
org/wp-content/uploads/2016/08/CFLJ3887-Inside-out-
inequality_12.125_WEB.pdf

101
19. McGuinness, F. (2016) Gender Pay Gap. House of Commons
Briefing Paper, Number 7068
20. London Poverty Profile (2017) Women. Retrieved from http://
www.londonspovertyprofile.org.uk/indicators/groups/women/
21. Transport for London (2012) Understanding the travel needs of
London’s diverse communities : Women. Retrieved from http://
content.tfl.gov.uk/women.pdf
22. See for example Llewelyn-Davies report to Transport for
London and the Central London Partnership (2003). Economic
Benefits of Good Walking Environments; Living Streets,
Just Economics (2013). The pedestrian pound: The business
case for better streets and places; and NYC Department of
Transportation (2012). Measuring the Street: New metrics for
21st century streets.
23. Mercer (2017). Quality of Living Rankings. Retrieved from
https://www.mercer.com/newsroom/2017-quality-of-living-
survey.html
24. Allen, J. et al (2016)24 An analysis of road freight in London
and Britain: traffic, activity and sustainability. Retrieved from
http://www.ftc2050.com/reports/westminster_road_traffic_
final_Dec_2016.pdf
25. Transport for London (2016). Collisions and casualties on
London’s roads: Annual Report 2015. Retrieved from http://
content.tfl.gov.uk/collisions-and-casulaties-on-londons-
roads-annual-report-2015.pdf
26. Ibid.
27. Quilter-Pinner, H. and Laybourn-Langton, L. (2016). Lethal and
Illegal: London’s Air Pollution Crisis. IPPR.
28. Particulate matter (PM) is conventionally split into coarser
(PM10) and finer (PM2.5) particles, which reference their
maximum diameter, in micrometres. These are the two most
measured source of particulates, and those which regulation
is targeted at.
29. European Commission (2016) Air Quality - Existing Legislation.
Retrieved from http://ec.europa.eu/environment/air/quality/
legislation/existing_leg.htm

102
30. Department for Environment, Food & Rural Affairs and
Department for Transport (2017) UK plan for tackling roadside
nitrogen dioxide concentrations: Detailed plan, July 2017.
Retrieved from https://www.gov.uk/government/uploads/
system/uploads/attachment_data/file/633270/air-quality-
plan-detail.pdf
31. Department for Environment, Food & Rural Affairs and
Department for Transport (2017) UK plan for tackling roadside
nitrogen dioxide concentrations: An overview. Retrieved from
https://www.gov.uk/government/uploads/system/uploads/
attachment_data/file/633269/air-quality-plan-overview.pdf
32. MacKerron, G. and Mourato, S. (2008) Life satisfaction and air
quality in London. Ecological Economics, 68 (5) 1441-1453
33. Asquith, H. (2017) Health and Good Design. Presentation at
UDL seminar: The Links between Streets, Transport & Public
Health, 11.05.2017
34. British Heart Foundation (2015) Physical Activity Statistics
2015. Retrieved from https://www.bhf.org.uk/publications/
statistics/physical-activity-statistics-2015
35. NHS Information Centre and Department of Health (2016)
Prevalence of Childhood Obesity via Greater London
Authority (2017) Retrieved from https://data.london.gov.uk/
dataset/prevalence-childhood-obesity-borough
36. Lifshitz, F. (2008) Obesity in children. Journal of Clinical
Research in Pediatric Endocrinology, 1 (2) 53-60
37. Figures combine 2014 and 2015 samples. See Department for
Transport (2015) National Travel Survey 2015
38. Fairnie et al. (2016) Active travel in London: The role of travel
survey data in describing population physical activity. Journal
of Transport & Health, 3, 161–172
39. Transport for London (2017) London Travel Demand Survey,
2015/16
40. Greater London Authority (2015) Health Impact of Cars in
London. Retrieved from https://www.london.gov.uk/sites/
default/files/health_impact_of_cars_in_london-sept_2015_
final.pdf
41. Greater London Authority (2014) Transport and health
in London. Retrieved from https://www.london.gov.uk/
sites/default/files/transport_and_health_in_london_
march_2014.pdf

103
42. Lee, J.S., Park, S and Jung, S. (2016) Effect of Crime Prevention
through Environmental Design (CPTED) Measures on Active
Living and Fear of Crime. Sustainability, 8, 872
43. Centre for Educational Research and Innovation, OECD
(2010) Social Capital, Human Capital and Health. What is
the Evidence? Retrieved from https://www.oecd.org/edu/
research/45760738.pdf
44. Transport for London (2017) Travel in London Report 9.
Retrieved from http://content.tfl.gov.uk/travel-in-london-
report-9.pdf
45. ABI Research (2016) ABI Research Forecasts Global Mobility
as a Service Revenues to Exceed $1 Trillion by 2030. Retrieved
from https://www.abiresearch.com/press/abi-research-
forecasts-global-mobility-service-rev/
46. Greater London Authority (2016) Central Activities Zone:
Supplementary Planning Guidance. Retrieved from https://
www.london.gov.uk/sites/default/files/caz_spg_final_v4.pdf
47. Douglass, G. (2016) Work and life in the Central Activities
Zone, northern part of the Isle of Dogs and their fringes.
GLA Economics, Working Paper 68. Retrieved from https://
www.london.gov.uk/sites/default/files/gla_migrate_files_
destination/Working%20Paper%2068.pdf
48. Transport for London (2017) Travel in London Report 9. Table
6.6. Retrieved from http://content.tfl.gov.uk/travel-in-london-
report-9.pdf
49. Transport for London (2013) Roads Task Force Technical
Note 14. Who travels by car in London and for what purpose?
Retrieved from http://content.tfl.gov.uk/technical-note-14-
who-travels-by-car-in-london.pdf
50. Accent for Transport for London (2013) Town Centres 2013.
Retrieved from http://content.tfl.gov.uk/town-centres-
report-13.pdf
51. Transport for London (2016) London Cycling Design Standard,
Chapter 4. Retrieved from http://content.tfl.gov.uk/lcds-
chapter1-designrequirements.pdf
52. Font, A. and Fuller, G.W. (2016) Did policies to abate
atmospheric emissions from traffic have a positive effect in
London? Environmental Pollution, 218, 463-474
53. Transport for London (2015) Street Types Matrix. Retrieved
from http://content.tfl.gov.uk/street-types-matrix.pdf

104
54. Finn, B. et al (2011) Buses with High Level of Service.
Fundamental characteristics and recommendations for
decision-making and research. Results from 35 European
cities. Retrieved from http://www.uitp.org/sites/default/
files/cck-focus-papers-files/BHLS_COST_final_report_
October2011.pdf
55. Mayor of London and Transport for London (2017) Strategic
Cycling Analysis: Identifying future cycling demand in
London. Retrieved from content.tfl.gov.uk/strategic-
cycling-analysis.pdf
56. Transport for London (2017) Central London Grid. Retrieved
from https://tfl.gov.uk/travel-information/improvements-and-
projects/central-london-cycling-grid
57. Aldred, R., Best, L. and Jones, P. (2017) Cyclists in Shared Bus
Lanes: could there be unrecognised impacts on bus journey
times? Proceedings of the Institution of Civil Engineers –
Transport. [Ahead of print] Retrieved from http://www.
icevirtuallibrary.com/doi/abs/10.1680/jtran.16.00072
58. Transport for London (2006) Impacts monitoring: Fourth
Annual Report. Retrieved from http://content.tfl.gov.uk/
fourthannualreportfinal.pdf
59. Transport for London (2008) Congestion Charging five years
on - traffic levels still down but congestion rises back to
pre-charging levels [Press Release] Retrieved from https://
tfl.gov.uk/info-for/media/press-releases/2008/august/
congestion-charging-five-years-on--traffic-levels-still-down-
but-congestion-rises-back-to-precharging-levels
60. Tonne, C. et al (2008) Air pollution and mortality benefits of
the London Congestion Charge: spatial and socioeconomic
inequalities. Occupational and Environmental Medicine, 65,
620-627
61. Noland, R.B., Quddus, M.A. and Ochieng W.Y. (2008) The
effect of the London congestion charge on road casualties: an
intervention analysis. Transportation, 35 (1) 73-91
62. Transport for London (2017) About the LEZ. Retrieved from
https://tfl.gov.uk/modes/driving/low-emission-zone/about-
the-lez
63. Transport for London (2017) T-Charge. Retrieved from https://
tfl.gov.uk/modes/driving/emissions-surcharge

105
64. Transport for London (2017) Proposed changes to the ULEZ
(start date and emissions standards). Consultation and
information document. Retrieved from https://consultations.
tfl.gov.uk/environment/air-quality-consultation-phase-2/
user_uploads/ulez-changes---stage-3a---con-and-info-doc-
--final-v1.0.pdf
65. Transport for London (2017) Ultra Low Emission Zone,
Retrieved from https://tfl.gov.uk/modes/driving/ultra-low-
emission-zone. The MTS proposes to introduce the central
London ULEZ standards and charges in 2019, to extend the
zone London-wide for heavy vehicles by 2020 and to inner
London for all other vehicles (except taxis) by 2021. See
Greater London Authority (2017) Mayor’s Transport Strategy.
Draft for Public Consultation, June 2017. p.89
66. Greater London Authority (2017) Mayor’s Transport Strategy.
Draft for Public Consultation, June 2017. p.214
67. See data on traffic volumes by day and time in Greater
London Authority (2017) Mayor’s Transport Strategy. Draft for
Public Consultation, June 2017. p.78-81
68. Greater London Authority (2017) Mayor’s Transport Strategy.
Draft for Public Consultation, June 2017. p.83
69. Pope, T. and Waters, T. (2016) A Survey of the UK Tax System.
Institute for Fiscal Studies. Retrieved from https://www.ifs.org.
uk/bns/bn09.pdf
70. Office for Budget Responsibility (2017) Fuel duties. Retrieved
from http://budgetresponsibility.org.uk/forecasts-in-depth/
tax-by-tax-spend-by-spend/fuel-duties/#latest_forecast
71. Transport for London (2017) How we are funded. Retrieved
from https://tfl.gov.uk/corporate/about-tfl/how-we-work/
how-we-are-funded
72. European emissions standards are currently based on
laboratory test results, which tend not to accurately reflect
real-world driving conditions (which are often significantly
higher). Work is being done to improve this, and there are
available technologies to give real-time emission levels.
See for example European Commission (2017) Emissions in
the automotive sector. Retrieved from https://ec.europa.
eu/growth/sectors/automotive/environment-protection/
emissions_en
106
73. De Freitas, L.M., Schuemperlin, O. and Balac, M. (2016) Road
pricing: An analysis of equity effects with MATSim. Conference
paper STRC 2016. Retrieved from http://www.strc.ch/2016/
MeyerDeFreitas_EtAl.pdf
74. Transport for London (2013) Roads Task Force Technical Note
9. How does the road network perform in terms of speed,
congestion and journey time reliability? Retrieved from https://
tfl.gov.uk/cdn/static/cms/documents/technical-note-09-
how-does-the-road-network-perform-in-terms-of-speed-
congestion.pdf
75. Hanna, K. and Bosetti, N. (2015) Inside Out: The New
Geography of Wealth and Poverty in London. Centre
for London. Retrieved from http://www.centreforlondon.
org/wp-content/uploads/2016/08/CFLJ3887-Inside-out-
inequality_12.125_WEB.pdf
76. Transport for London (2016). Programmes and Investment
Committee: Surface Intelligent Transport System. Retrieved
from http://content.tfl.gov.uk/05-p1-sits-pas.pdf
77. Turvill, W. (2017) Moany millennials no more: Young Londoners
say they’re appy without cars and can survive on taxi
apps. City AM Online. Retrieved from http://www.cityam.
com/267578/moany-millennials-no-more-young-londoners-
say-theyre-appy
78. Transport for London (2017) London Taxi and Private Hire:
Drivers Demographic Information. Retrieved from http://
content.tfl.gov.uk/taxi-and-phv-demographic-stats.pdf
79. The London Movement Charter: a concept from Patricia
Brown, March 2016
80. See Transport for London, Mayor of London and Waltham
Forest (2015) Waltham Forest: Mini-Holland Design Guide.
Retrieved from http://www.enjoywalthamforest.co.uk/wp-
content/uploads/2015/01/Waltham-Forest-Mini-Holland-
Design-Guide.pdf
81. See City of London (2016) Bank Junction Experimental
Scheme report. Retrieved from http://democracy.cityoflondon.
gov.uk/documents/s72890/Bank%20Junction%20-%20
Experimental%20Safety%20Scheme.pdf
82. See Camden Council (2016) Healthy School Streets. Retrieved
from http://camden.gov.uk/ccm/content/transport-and-
streets/traffic-management/road-safety-in-camden/road-
safety-for-children/healthy-school-streets/

107
83. Southwark Council (2017) Southwark’s Draft Kerbside
Strategy. Retrieved from https://consultations.southwark.
gov.uk/environment-leisure/kerbside-strategy/supporting_
documents/Southwark%20Draft%20Kerbside%20Strategy.
84. Transport for London (2013) Roads Task Force Technical Note
12. How many cars are there in London and who owns them?
http://content.tfl.gov.uk/technical-note-12-how-many-cars-
are-there-in-london.pdf
85. In a YouGov poll commissioned by Uber and conducted
from 28 October-1 November 2016, 19 per cent of Londoners
say they are less likely to buy a car in future because of
alternatives like Uber (rising to 32 per cent for those who
have used Uber in the last six months). A more recent poll,
conducted by YouGov and commissioned by Uber (May-
June 2017) found 43% of Londoners believe that app-based
car booking services are a genuine alternative to owning
a car. See http://uk.businessinsider.com/london-uber-car-
ownership-2017-6
86. Lester-Davis, N. (2017) How can we get drivers to give up their
cars? Retrieved from https://www.ptrc-training.co.uk/News/
TabId/1522/ArtMID/6886/ArticleID/11290/How-can-we-get-
drivers-to-give-up-their-cars.aspx
87. For example, while residential parking accounts for the vast
majority of spaces in Camden (over 38,000 in 19 controlled
parking zones), in 2015/16 resident’s parking permit income
accounted for only 11% of total parking income, indicating
their low relative contribution. See https://www.camden.gov.
uk/ccm/cms-service/stream/asset/?asset_id=3504188&
88. Carplus (2015) Car Clubs in property developments:
Carplus good practice guide. Retrieved from https://www.
carplusbikeplus.org.uk/wp-content/uploads/2015/03/Car-
clubs-in-property-developments-2015.pdf
89. See San Francisco Municipal Transportation Authority (2014)
SFpark: Pilot Project Evaluation Summary. Retrieved from
http://sfpark.org/wp-content/uploads/2014/06/SFpark_Eval_
Summary_2014.pdf
90. Transport for London (2017). Travel in London Report 9. p11.
Retrieved from http://content.tfl.gov.uk/travel-in-london-
report-9.pdf

108
91. Greater London Authority (2017) Mayor’s Transport Strategy.
Draft for Public Consultation, June 2017. p72.
92. London Chamber of Commerce and Industry (2017) Mayor
Urged To Appoint Freight Commissioner For London. [Press
Release] Retrieved from http://www.londonchamber.co.uk/
lcc_public/article.asp?id=0&did=47&aid=8511&st=&oaid=-1
93. Transport for London (2017) Retiming deliveries. Retrieved
from https://tfl.gov.uk/info-for/deliveries-in-london/
delivering-efficiently/retiming-deliveries
94. London Councils (2017) About the London Lorry Control
Scheme. Retrieved from http://www.londoncouncils.gov.uk/
services/london-lorry-control/about-llcs
95. Transport for London (2014) Transport Emissions Roadmap.
Retrieved from http://content.tfl.gov.uk/transport-emissions-
roadmap.pdf
96. Quilter-Pinner, H. and Laybourn-Langton, L. (2017) Connect
the Dots: Air Quality, Industrial Strategy and Smart Mobility.
IPPR. Retrieved from http://www.ippr.org/files/2017-06/
connect-the-dots-june2017.pdf
97. Greater London Authority (2017) Draft Environment Strategy
– Appendix 2: Evidence Base, Figures 5, 6, 7. Retrieved from
https://www.london.gov.uk/sites/default/files/appendix_2_
evidence_base.pdf
98. Air Quality Expert Group (2012) Fine Particulate Matter
(PM2.5) in the United Kingdom. Retrieved from https://uk-air.
defra.gov.uk/assets/documents/reports/aqeg/pb13837-aqeg-
fine-particle-matter-20121220.pdf
99. Department for Environment, Food & Rural Affairs and
Department for Transport (2017) UK plan for tackling roadside
nitrogen dioxide concentrations: Detailed plan, July 2017.
Retrieved from https://www.gov.uk/government/uploads/
system/uploads/attachment_data/file/633270/air-quality-
plan-detail.pdf
100. Transport for London (2017) T-charge. Retrieved from https://
tfl.gov.uk/modes/driving/emissions-surcharge?cid=emissions-
surcharge#on-this-page-3
101. Greater London Authority (2017) Capital’s most polluting
buses to be upgraded. [Press Release] Retreived from https://
www.london.gov.uk/press-releases/mayoral/capitals-most-
polluting-buses-to-be-upgraded

109
102. Greater London Authority (2017) Cleaner Buses. Retrieved
from https://www.london.gov.uk/what-we-do/environment/
pollution-and-air-quality/cleaner-buses
103. Transport for London (2016) Taxi and Private Hire Action
Plan 2016. Retrieved from http://content.tfl.gov.uk/taxi-and-
private-hire-action-plan-2016.pdf
104. Greater London Authority (2017) Mayor’s Transport Strategy.
Draft for Public Consultation, June 2017.
105. For original impact assessment, see Jacobs for Transport for
London (2014) Ultra Low Emission Zone Integrated Impact
Assessment. Retrieved from https://consultations.tfl.gov.uk/
environment/ultra-low-emission-zone/user_uploads/ulez-iia-
report_final.pdf. For updates to this, see Jacobs for Transport
for London (2017) Update to the 2014/2015 Integrated Impact
Assessment. Retrieved from https://consultations.tfl.gov.uk/
environment/air-quality-consultation-phase-2/user_uploads/
ulez-proposed-changes_iia-updated.pdf
106. National Grid (2017) Our energy insights. Electric vehicle
announcement and what the papers say. Retrieved
from http://fes.nationalgrid.com/media/1264/ev-myth-
buster-v032.pdf
107. World Health Organization Regional Office for Europe (2013)
Health effects of particulate matter. Policy implications for
countries in eastern Europe, Caucasus and central Asia.
Retrieved from http://www.euro.who.int/__data/assets/
pdf_file/0006/189051/Health-effects-of-particulate-matter-
final-Eng.pdf
108. See Die Seedstadt Wiens. Retrieved from https://www.aspern-
seestadt.at/
109. Greater London Authority (2017) Good Growth by Design. A
built environment for all Londoners. Retrieved from https://
www.london.gov.uk/sites/default/files/good_growth_web.pdf
110. Department of the Environment, Transport and the Regions
(2000) By Design. Urban design in the planning system:
toward better practice. Retrieved from http://webarchive.
nationalarchives.gov.uk/20110118121743/http:/www.cabe.org.
uk/files/by-design-urban-design-in-the-planning-system.pdf
111. Our Cities Ourselves (2010) Our Cities Ourselves.
Principles for Transport in Urban Life. Retrieved from
https://3gozaa3xxbpb499ejp30lxc8-wpengine.netdna-ssl.
com/wp-content/uploads/2014/07/OCO8principles_ITDP.pdf

110
112. Design Council CABE, Design for Homes, Home Builders
Federation (2012) Building for Life 12. Retrieved from
http://www.udg.org.uk/sites/default/files/publications/
BFL12COMPLETED.pdf
113. Lucy Saunders in Mayor of London, Transport for London
(2014) Improving the health of Londoners: Transport action
plan. Retrieved from http://content.tfl.gov.uk/improving-the-
health-of-londoners-transport-action-plan.pdf
114. Sport England (2015) Active Design: Planning for health and
wellbeing through sport and physical activity. Retrieved from
https://www.sportengland.org/media/3426/spe003-active-
design-published-october-2015-email-2.pdf
115. For more information, see Mayor of London, Urban Design
London, Transport for London (2017) Better Streets Delivered
2; Learning from completed schemes. p60-61. Retrieved from
http://content.tfl.gov.uk/better-streets-delivered-2.pdf
116. For more information, see Livings Streets (2012) The State of
Our Streets. p15. Retrieved from https://www.livingstreets.org.
uk/media/1407/state-of-our-streets-report-august-2012.pdf
117. See for example Urban Design London’s Better Streets
Delivered (2013) and Better Streets Delivered 2 (2017) booklets
118. Mayor of London (2017) Good Growth by Design: A built
environment for all Londoners. Retrieved from https://www.
london.gov.uk/sites/default/files/good_growth_web.pdf
119. Greater London Authority (2017) Mayor sets out his vision
for the future of London as population rises. [Press Release]
Retrieved from https://www.london.gov.uk/press-releases/
mayoral/mayor-sets-out-his-vision-for-the-future-of-london
120. This could continue the legacy of the 100 Public Spaces
programme under former Mayor Ken Livingstone or the
London’s Great Outdoors initiative under Boris Johnson. See,
for example Mayor of London (2009) A Manifesto for Public
Space. London’s Great Outdoors. Retrieved from https://www.
london.gov.uk/sites/default/files/londons_great_outdoors_-_
mayors_manifesto.pdf
121. International Transport Forum (2017) Shaping the Relationship
Between Public Transport and Innovative Mobility. Retrieved
from https://www.itf-oecd.org/sites/default/files/docs/
shaping-relationship-public-transport-innovative-mobility.pdf

111
122. MaaS Global (2016) Transport for West Midlands and Whim
set to pioneer MaaS in the UK. Retrieved from http://maas.
global/transport-for-west-midlands-and-whim-set-to-
pioneer-maas-in-the-uk/
123. Travelspirit (2017) Open or closed? The case for openness
in Mobility as a Service. Retrieved from http://travelspirit.
foundation/wp-content/uploads/2017/05/TravelSpirit-UK-
White-Paper-1-Open-or-Closed-May-2017.pdf
124. International Transport Forum (2017) Transition to Shared
Mobility. How large cities can deliver inclusive transport
services. Retrieved from https://www.itf-oecd.org/sites/
default/files/docs/transition-shared-mobility.pdf
125. Greater London Authority (2017) Mayor’s Transport Strategy.
Draft for Public Consultation, June 2017
126. Atkins (2016) Connected & Autonomous Vehicles. Introducing
the future of mobility. Retrieved from http://www.atkinsglobal.
co.uk/~/media/Files/A/Atkins-Corporate/north-america/
sectors-documents/highways-and-bridges/library-docs/
brochures/CAV_Report-NorthAmerica_v2.pdf

London’s transport system is admired around the world. But as the capital’s population grows, so its roads and streets are becoming increasingly crowded and polluted, while travel choices and emissions are contributing to poor health. New technologies are transforming the way we move around the city, bringing new opportunities but also challenges with them. Too much of the capital’s public realm still feels undervalued and neglected.
But it does not have to be this way. In this important report, the Commission on the Future of London’s Roads and Streets sets out a radical but practical agenda for the London’s surface transport system and public realm - one centred on public transport, walking and cycling and the fair, efficient use of London’s finite road network.
This project has been generously supported by Chris Rokos, and sponsored by Thales, Canary Wharf Group, Atkins and Future Cities Catapult.
© Centre for London, 2017


![TEMPLATE Roads and Streets SCOPE Map extents …...TEMPLATE FOR LOCAL AUTHORITY STREET GUIDANCE Roads and Streets Design Guidance for [ .] SCOPE Map extents and main places within](https://img.pdfslide.net/doc/110x75/5e8989e46dc14c2eb605b611/template-roads-and-streets-scope-map-extents-template-for-local-authority-street.jpg)