Embed Size (px)
Citation preview
Street Sweeping &Storm Drain Cleaning
Recommendations ‘Debut Webinar’
A County employee cleans out the catch basins in historic Ellicott City, MD

Welcome to the Webcast
• To Ask a Question – Submit your question in the chat box located to the left of the
slides. We will answer as many as possible during Q&A.
• To Answer a Poll Question – Simply select the preferred option. For those viewing this session
alongside several colleagues, respond in a manner that represents your organization as a whole.
• We ARE Recording this Session – All comments and questions will be recorded and included in the
archives. We will notify you as soon as the recording and related resources are loaded on the web.
• We Appreciate Your Feedback– Fill out our evaluations – our funders need to hear it!

To learn how you can have access to: FREE Webcasts
Free 1-day design, inspection & maintenance workshops
Intensive master stormwater seminarsDirect On-site technical assistance
Self guided web-based learning modules
Visit: www.chesapeakestormwater.net
Chesapeake Bay Stormwater Training Partnership

CSN’s 2015 Fall Webcast Series
http://chesapeakestormwater.net/events/categories/webcasts/2015-webcast-series/
• Thursday, October 22: Managing Nutrients in Residential and Recreational Areas
• Thursday, November 12: Managing Nutrients on Golf Courses
• Wednesday, November 18: Becoming RiverWise! An Introduction to Becoming a RiverWise Community
• TBD: Building Local Technical Capacity Networks for Small Scale Stormwater BMPs
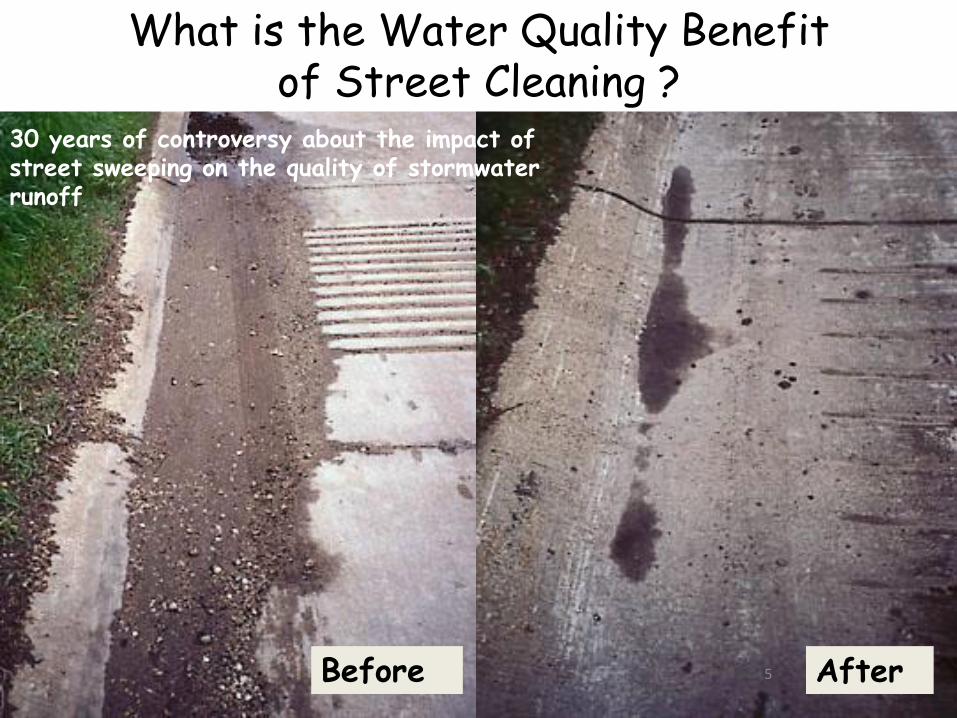
Before After
What is the Water Quality Benefit of Street Cleaning ?
5
30 years of controversy about the impact of street sweeping on the quality of stormwaterrunoff
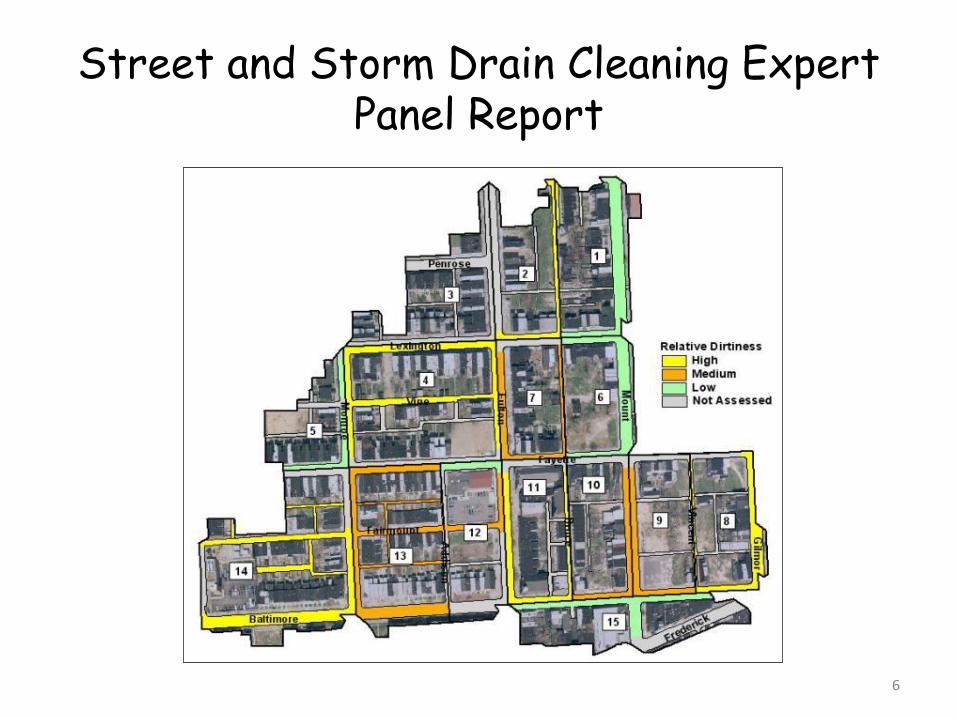
Street and Storm Drain Cleaning Expert Panel Report
6
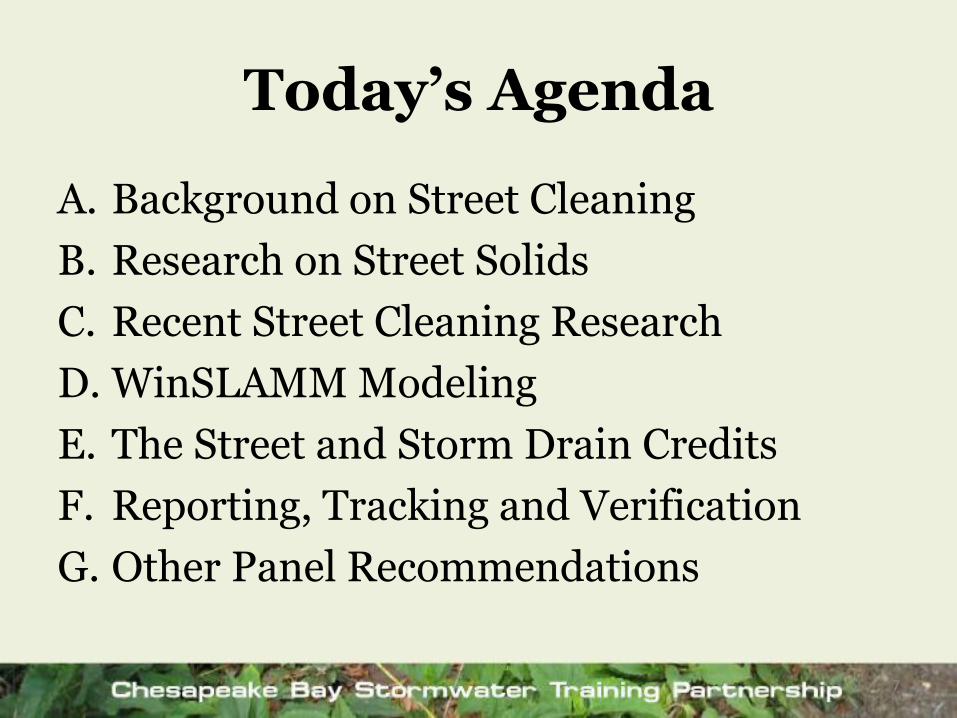
Today’s Agenda
A. Background on Street Cleaning
B. Research on Street Solids
C. Recent Street Cleaning Research
D. WinSLAMM Modeling
E. The Street and Storm Drain Credits
F. Reporting, Tracking and Verification
G. Other Panel Recommendations
7
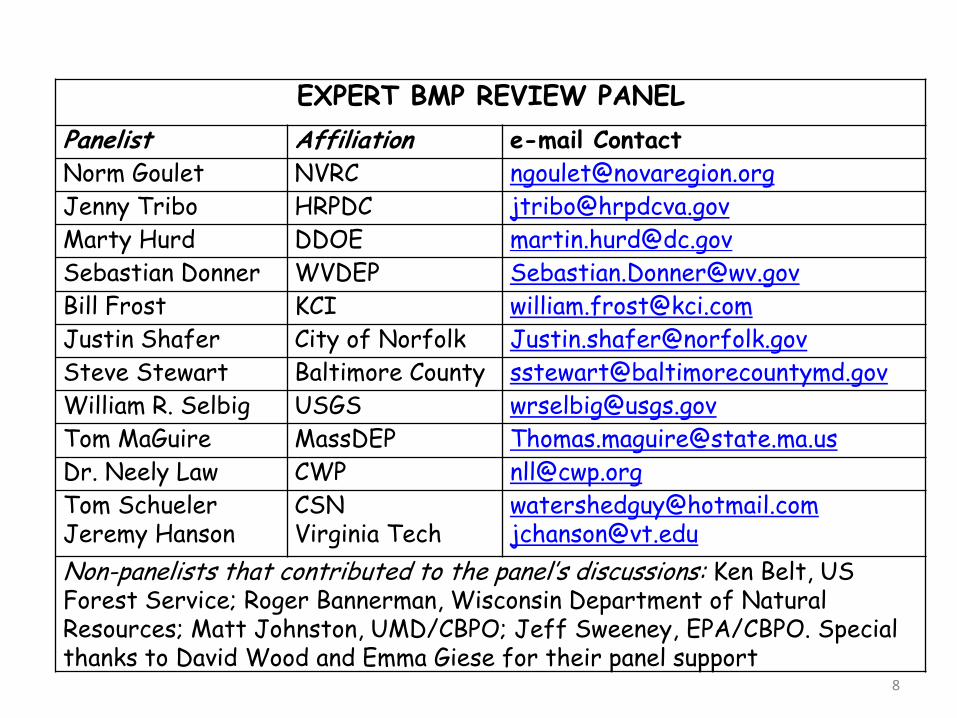
EXPERT BMP REVIEW PANEL
Panelist Affiliation e-mail Contact
Norm Goulet NVRC [email protected]
Jenny Tribo HRPDC [email protected]
Marty Hurd DDOE [email protected]
Sebastian Donner WVDEP [email protected]
Bill Frost KCI [email protected]
Justin Shafer City of Norfolk [email protected]
Steve Stewart Baltimore County [email protected]
William R. Selbig USGS [email protected]
Tom MaGuire MassDEP [email protected]
Dr. Neely Law CWP [email protected]
Tom SchuelerJeremy Hanson
CSN Virginia Tech
[email protected]@vt.edu
Non-panelists that contributed to the panel’s discussions: Ken Belt, US Forest Service; Roger Bannerman, Wisconsin Department of Natural Resources; Matt Johnston, UMD/CBPO; Jeff Sweeney, EPA/CBPO. Special thanks to David Wood and Emma Giese for their panel support
8
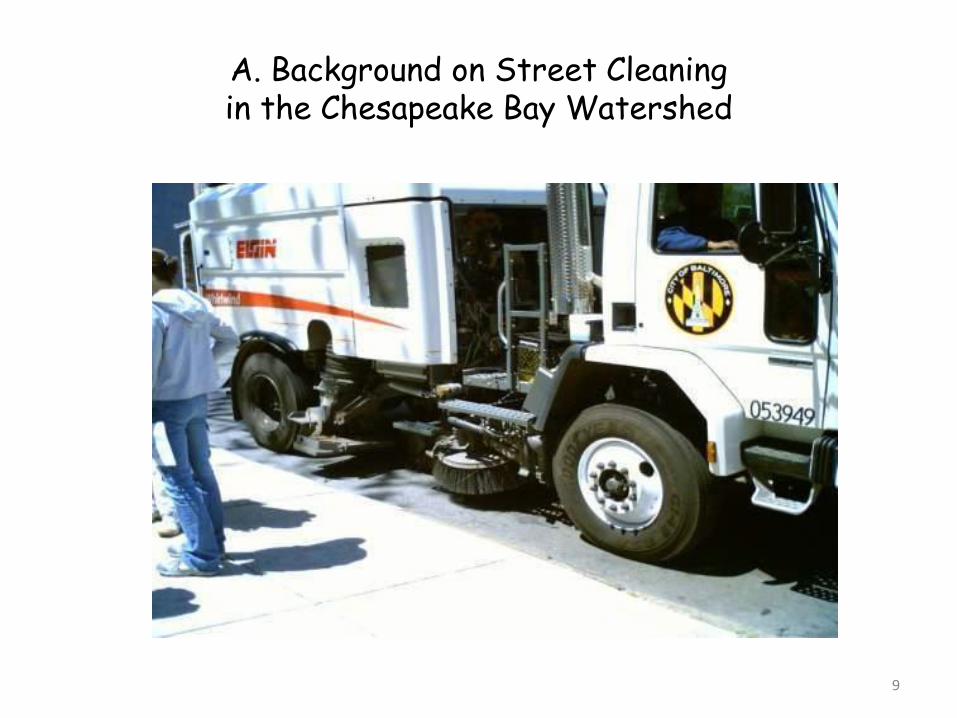
A. Background on Street Cleaning in the Chesapeake Bay Watershed
9
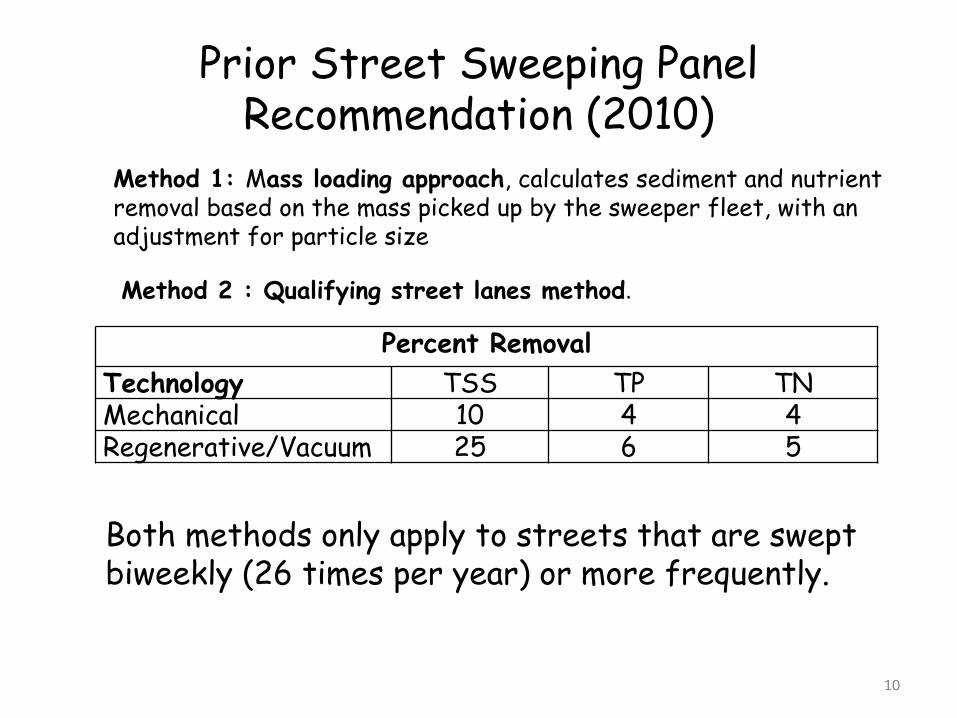
Prior Street Sweeping Panel Recommendation (2010)
Percent Removal
Technology TSS TP TNMechanical 10 4 4Regenerative/Vacuum 25 6 5
10
Method 2 : Qualifying street lanes method.
Method 1: Mass loading approach, calculates sediment and nutrient removal based on the mass picked up by the sweeper fleet, with an adjustment for particle size
Both methods only apply to streets that are swept biweekly (26 times per year) or more frequently.
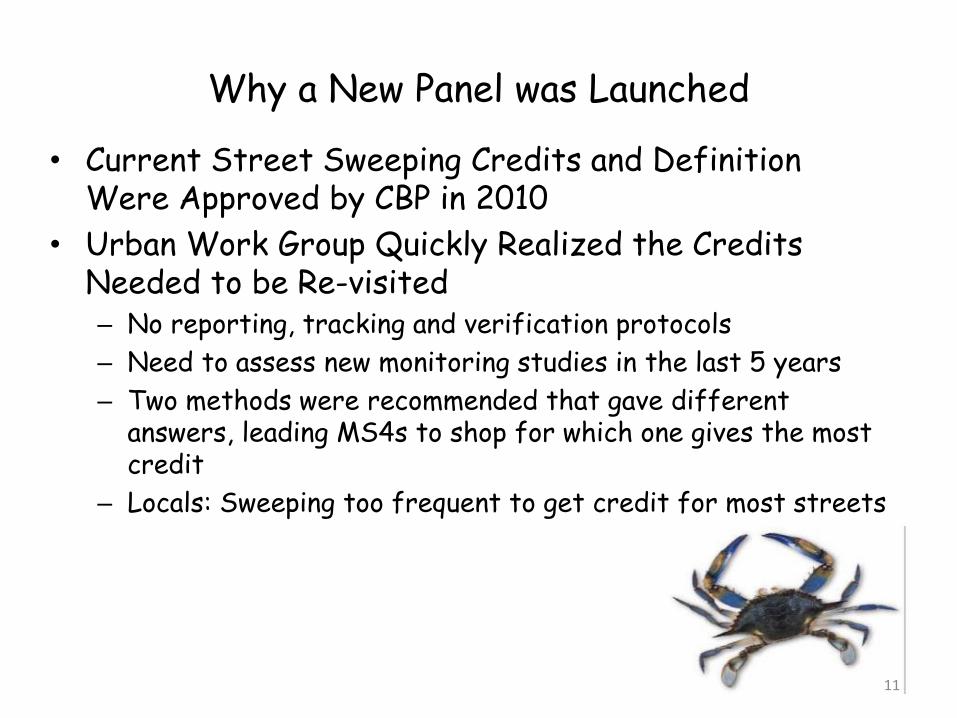
Why a New Panel was Launched
• Current Street Sweeping Credits and Definition Were Approved by CBP in 2010
• Urban Work Group Quickly Realized the Credits Needed to be Re-visited – No reporting, tracking and verification protocols
– Need to assess new monitoring studies in the last 5 years
– Two methods were recommended that gave different answers, leading MS4s to shop for which one gives the most credit
– Locals: Sweeping too frequent to get credit for most streets
11
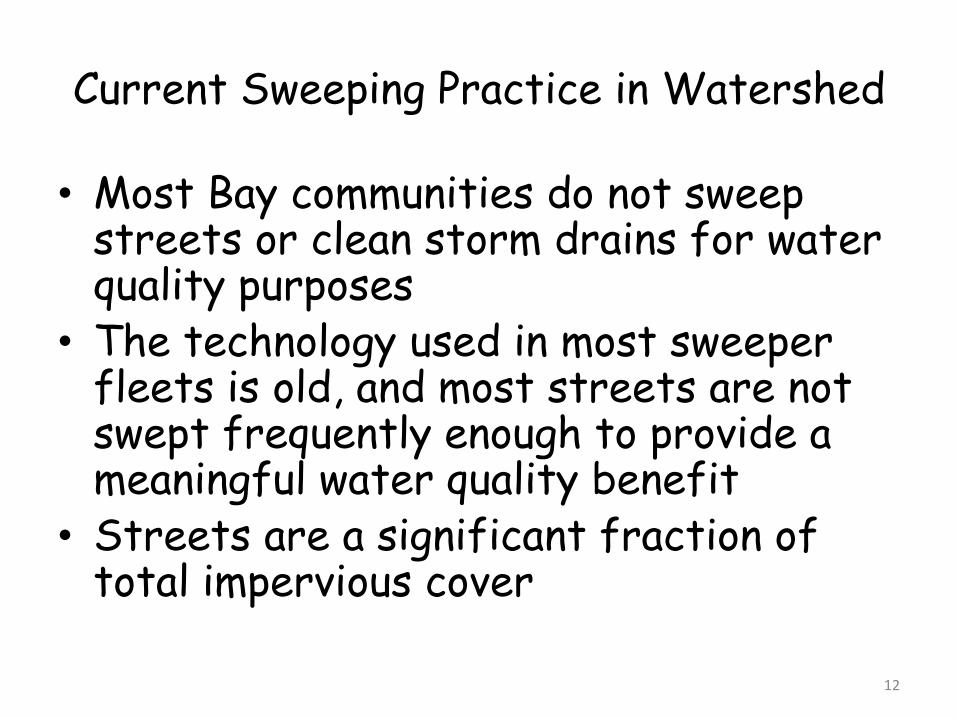
Current Sweeping Practice in Watershed
• Most Bay communities do not sweep streets or clean storm drains for water quality purposes
• The technology used in most sweeper fleets is old, and most streets are not swept frequently enough to provide a meaningful water quality benefit
• Streets are a significant fraction of total impervious cover
12
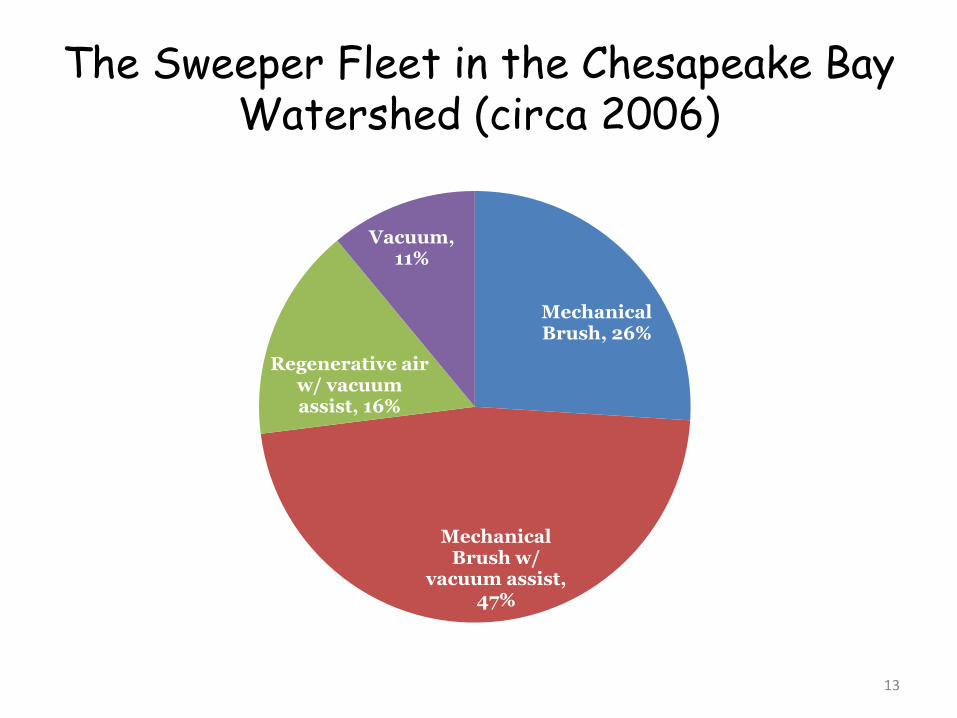
The Sweeper Fleet in the Chesapeake Bay Watershed (circa 2006)
13
Mechanical Brush, 26%
Mechanical Brush w/
vacuum assist, 47%
Regenerative air w/ vacuum assist, 16%
Vacuum, 11%
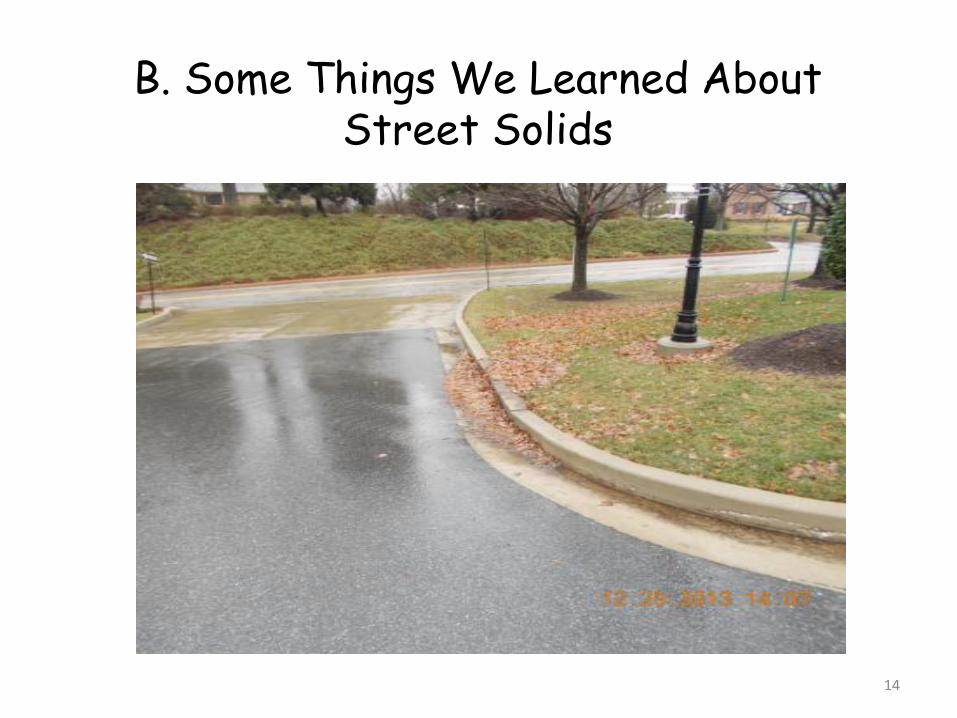
B. Some Things We Learned About Street Solids
14
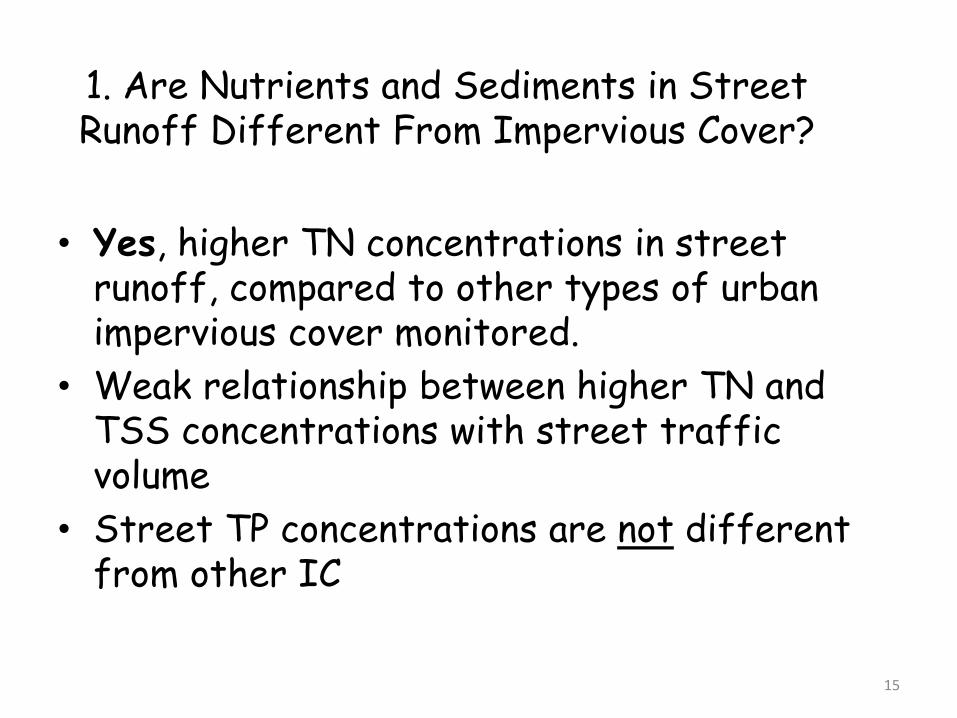
1. Are Nutrients and Sediments in Street Runoff Different From Impervious Cover?
• Yes, higher TN concentrations in street runoff, compared to other types of urban impervious cover monitored.
• Weak relationship between higher TN and TSS concentrations with street traffic volume
• Street TP concentrations are not different from other IC
15
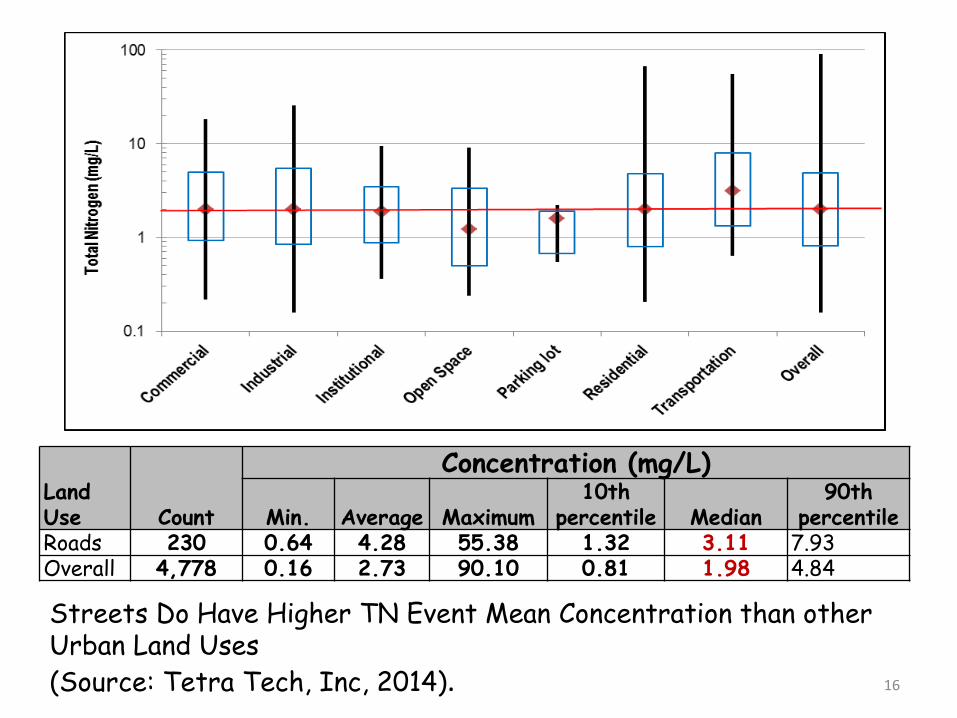
Land Use Count
Concentration (mg/L)
Min. Average Maximum10th
percentile Median90th
percentileRoads 230 0.64 4.28 55.38 1.32 3.11 7.93Overall 4,778 0.16 2.73 90.10 0.81 1.98 4.84
Streets Do Have Higher TN Event Mean Concentration than other Urban Land Uses
(Source: Tetra Tech, Inc, 2014). 16
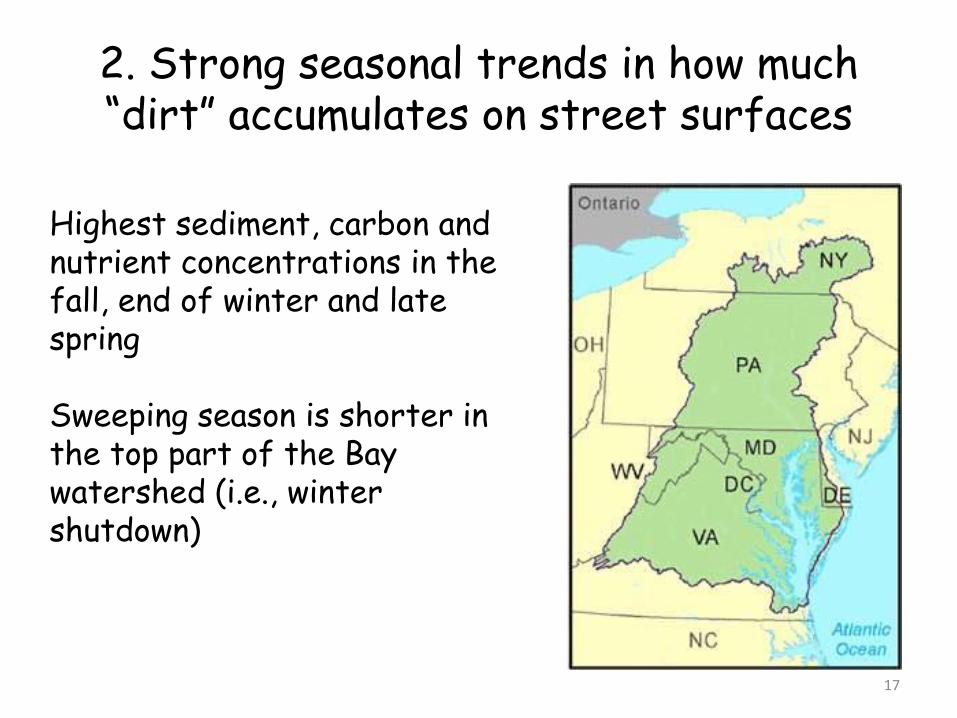
2. Strong seasonal trends in how much “dirt” accumulates on street surfaces
Highest sediment, carbon and nutrient concentrations in the fall, end of winter and late spring
Sweeping season is shorter in the top part of the Bay watershed (i.e., winter shutdown)
17
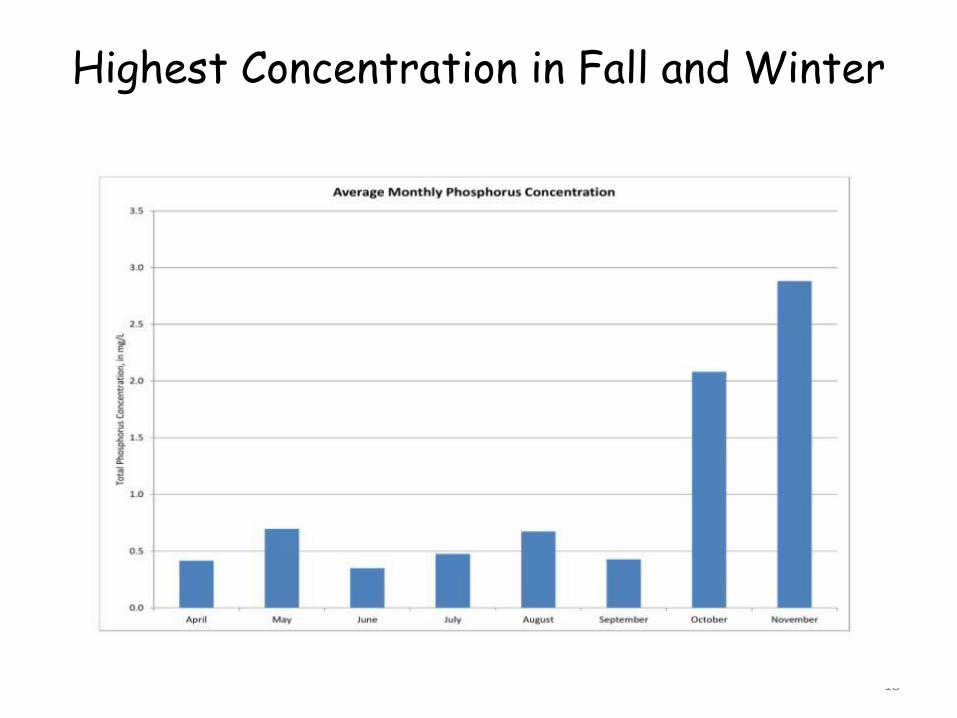
Highest Concentration in Fall and Winter
18
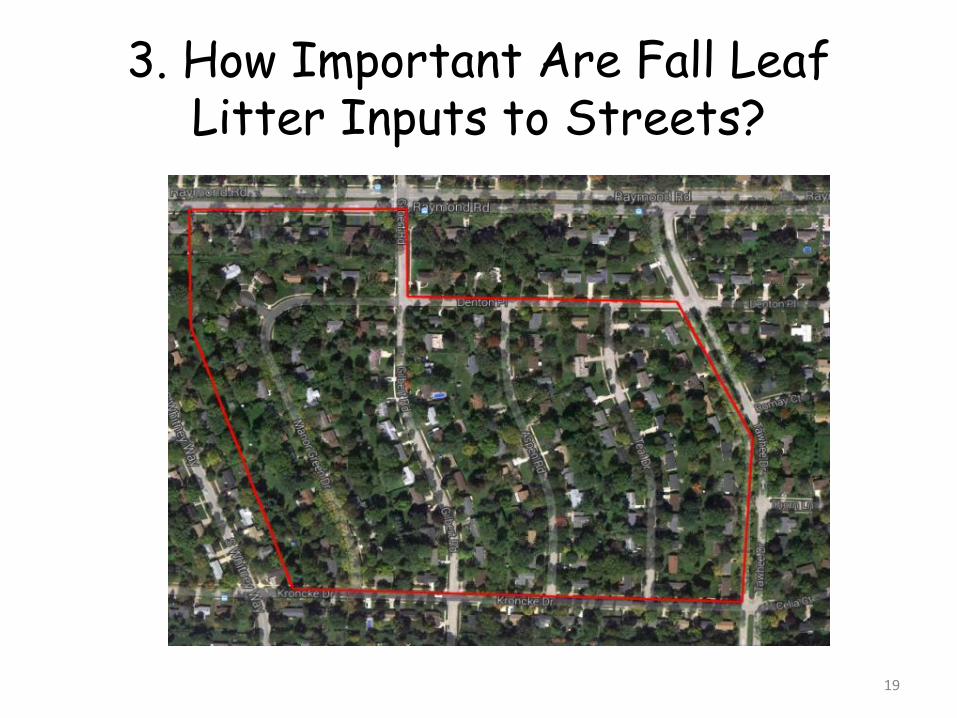
3. How Important Are Fall Leaf Litter Inputs to Streets?
19
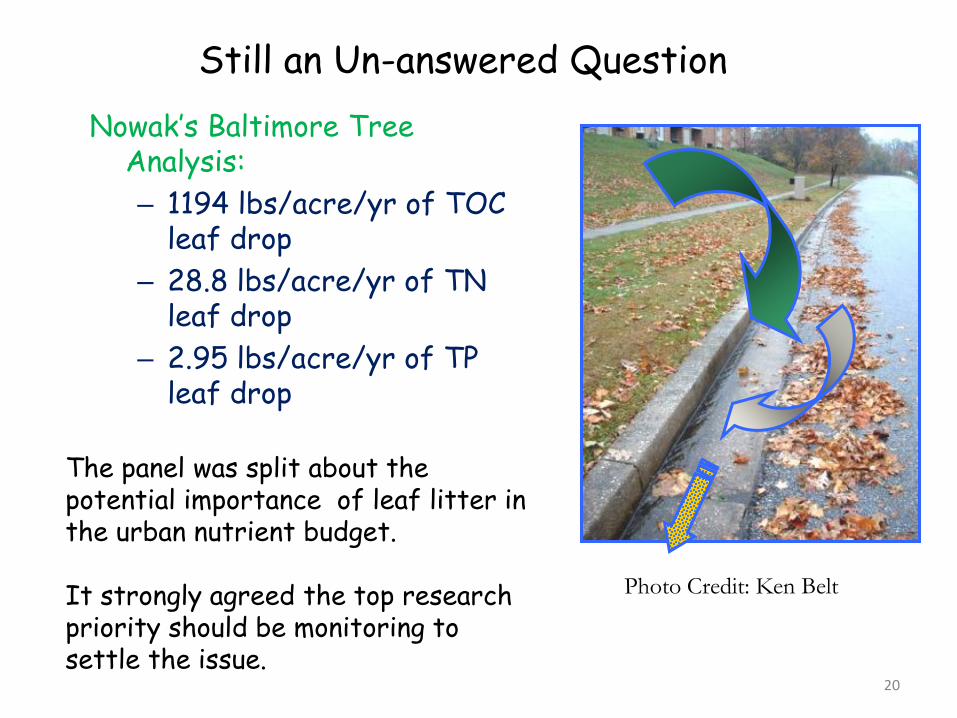
Still an Un-answered Question
Nowak’s Baltimore Tree Analysis:
– 1194 lbs/acre/yr of TOC leaf drop
– 28.8 lbs/acre/yr of TN leaf drop
– 2.95 lbs/acre/yr of TP leaf drop
Photo Credit: Ken Belt
The panel was split about the potential importance of leaf litter in the urban nutrient budget.
It strongly agreed the top research priority should be monitoring to settle the issue.
20
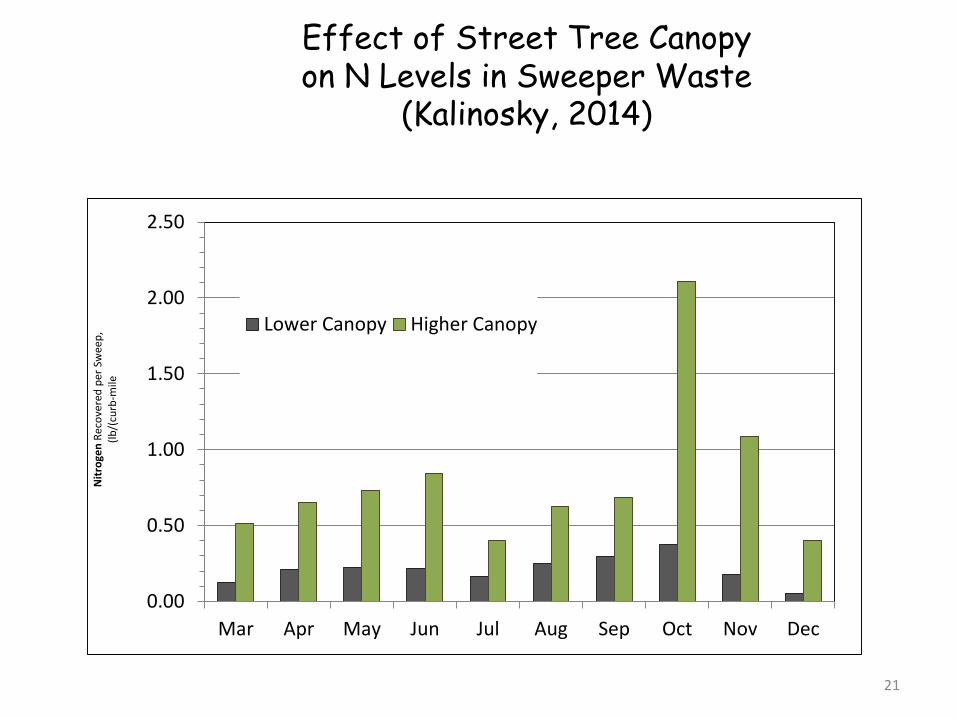
Effect of Street Tree Canopy on N Levels in Sweeper Waste
(Kalinosky, 2014)
21
0.00
0.50
1.00
1.50
2.00
2.50
Mar Apr May Jun Jul Aug Sep Oct Nov Dec
Nit
roge
n R
eco
vere
d p
er S
wee
p,
(lb
/(cu
rb-m
ile
Lower Canopy Higher Canopy
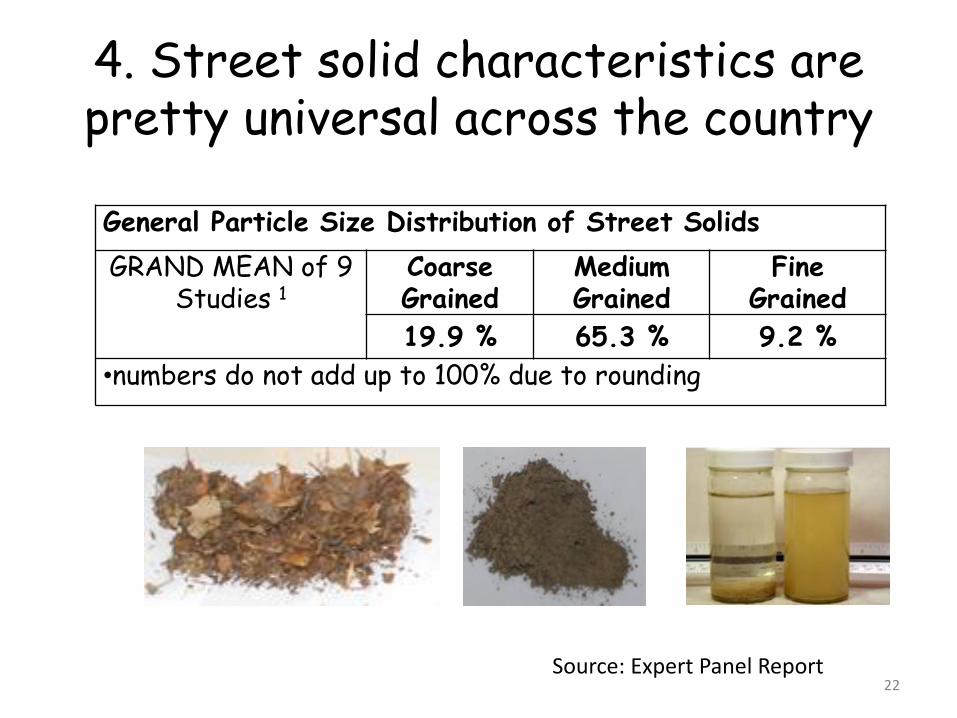
4. Street solid characteristics are pretty universal across the country
General Particle Size Distribution of Street Solids
GRAND MEAN of 9 Studies 1
CoarseGrained
MediumGrained
FineGrained
19.9 % 65.3 % 9.2 %
•numbers do not add up to 100% due to rounding
22Source: Expert Panel Report
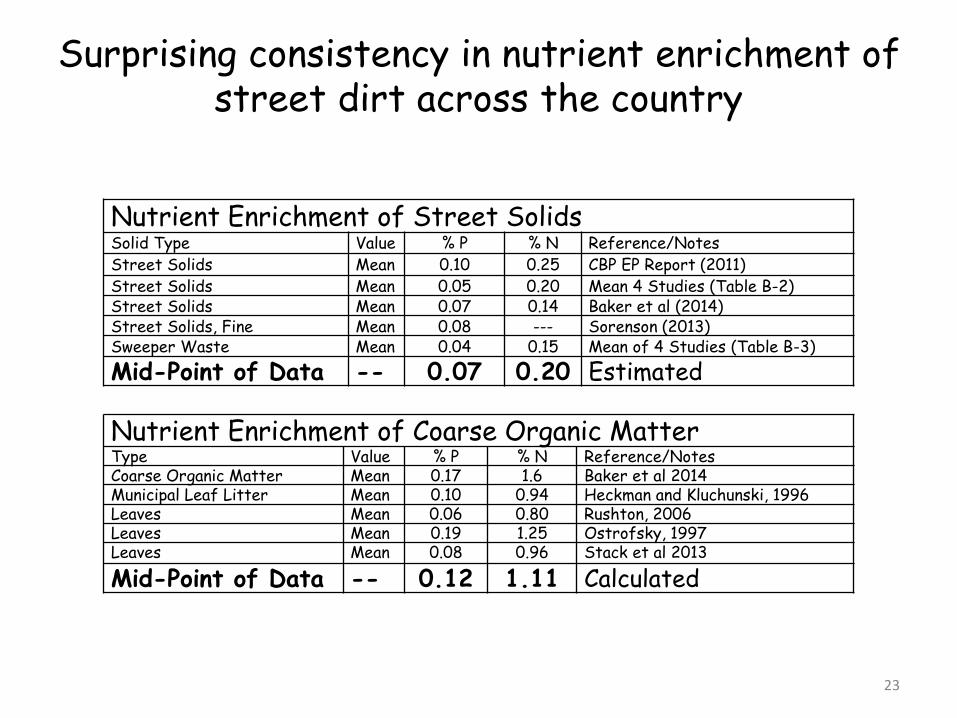
Surprising consistency in nutrient enrichment of street dirt across the country
Nutrient Enrichment of Street SolidsSolid Type Value % P % N Reference/NotesStreet Solids Mean 0.10 0.25 CBP EP Report (2011)Street Solids Mean 0.05 0.20 Mean 4 Studies (Table B-2)Street Solids Mean 0.07 0.14 Baker et al (2014)Street Solids, Fine Mean 0.08 --- Sorenson (2013)Sweeper Waste Mean 0.04 0.15 Mean of 4 Studies (Table B-3)
Mid-Point of Data -- 0.07 0.20 Estimated
23
Nutrient Enrichment of Coarse Organic MatterType Value % P % N Reference/NotesCoarse Organic Matter Mean 0.17 1.6 Baker et al 2014Municipal Leaf Litter Mean 0.10 0.94 Heckman and Kluchunski, 1996Leaves Mean 0.06 0.80 Rushton, 2006Leaves Mean 0.19 1.25 Ostrofsky, 1997Leaves Mean 0.08 0.96 Stack et al 2013
Mid-Point of Data -- 0.12 1.11 Calculated
5. Particle size matters, but maybe not
• “Street Solids” are a complex mix of organic and mineral particles
• Particle size ranges over four orders of magnitude
• Bi-modal particle size distribution for nutrients and carbon
24
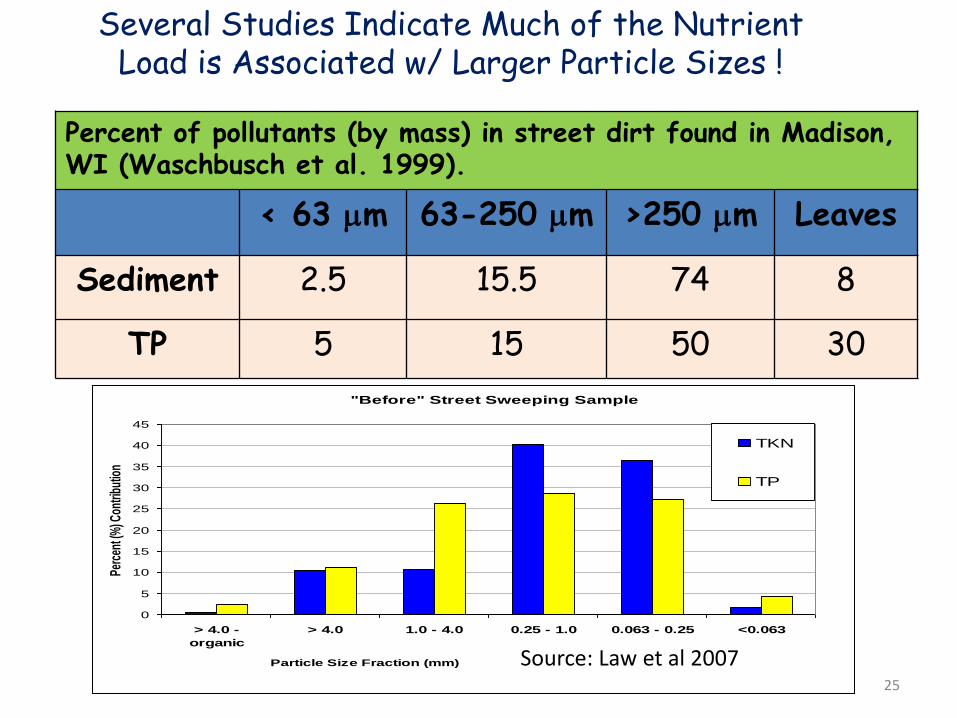
Percent of pollutants (by mass) in street dirt found in Madison, WI (Waschbusch et al. 1999).
< 63 m 63-250 m >250 m Leaves
Sediment 2.5 15.5 74 8
TP 5 15 50 30
Several Studies Indicate Much of the Nutrient Load is Associated w/ Larger Particle Sizes !
"Before" Street Sweeping Sample
0
5
10
15
20
25
30
35
40
45
> 4.0 -
organic
> 4.0 1.0 - 4.0 0.25 - 1.0 0.063 - 0.25 <0.063
Particle Size Fraction (mm)
Perc
ent (
%) C
ontri
butio
n
TKN
TP
25
Source: Law et al 2007
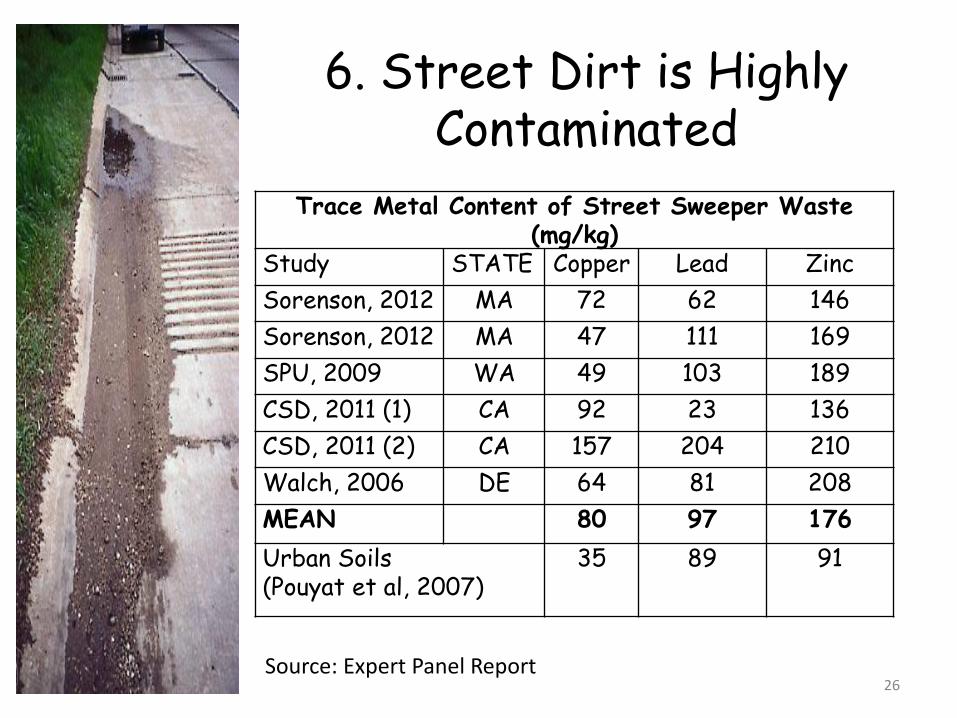
6. Street Dirt is Highly Contaminated
Trace Metal Content of Street Sweeper Waste (mg/kg)
Study STATE Copper Lead Zinc
Sorenson, 2012 MA 72 62 146
Sorenson, 2012 MA 47 111 169
SPU, 2009 WA 49 103 189
CSD, 2011 (1) CA 92 23 136
CSD, 2011 (2) CA 157 204 210
Walch, 2006 DE 64 81 208
MEAN 80 97 176
Urban Soils (Pouyat et al, 2007)
35 89 91
26Source: Expert Panel Report
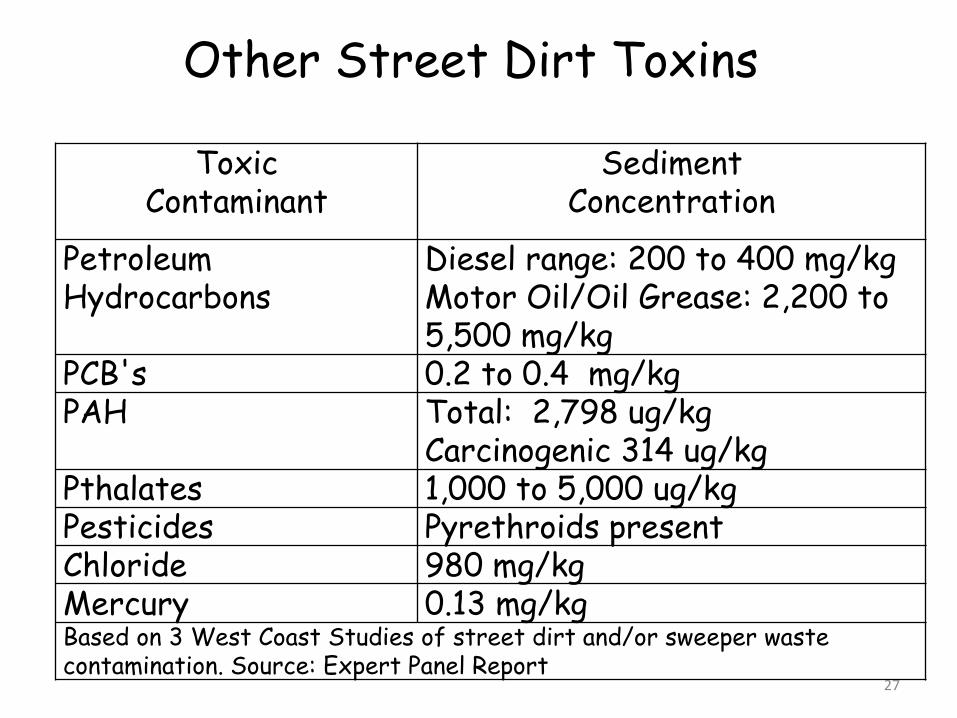
Other Street Dirt Toxins
ToxicContaminant
Sediment Concentration
Petroleum Hydrocarbons
Diesel range: 200 to 400 mg/kgMotor Oil/Oil Grease: 2,200 to 5,500 mg/kg
PCB's 0.2 to 0.4 mg/kgPAH Total: 2,798 ug/kg
Carcinogenic 314 ug/kgPthalates 1,000 to 5,000 ug/kgPesticides Pyrethroids presentChloride 980 mg/kgMercury 0.13 mg/kgBased on 3 West Coast Studies of street dirt and/or sweeper waste contamination. Source: Expert Panel Report
27
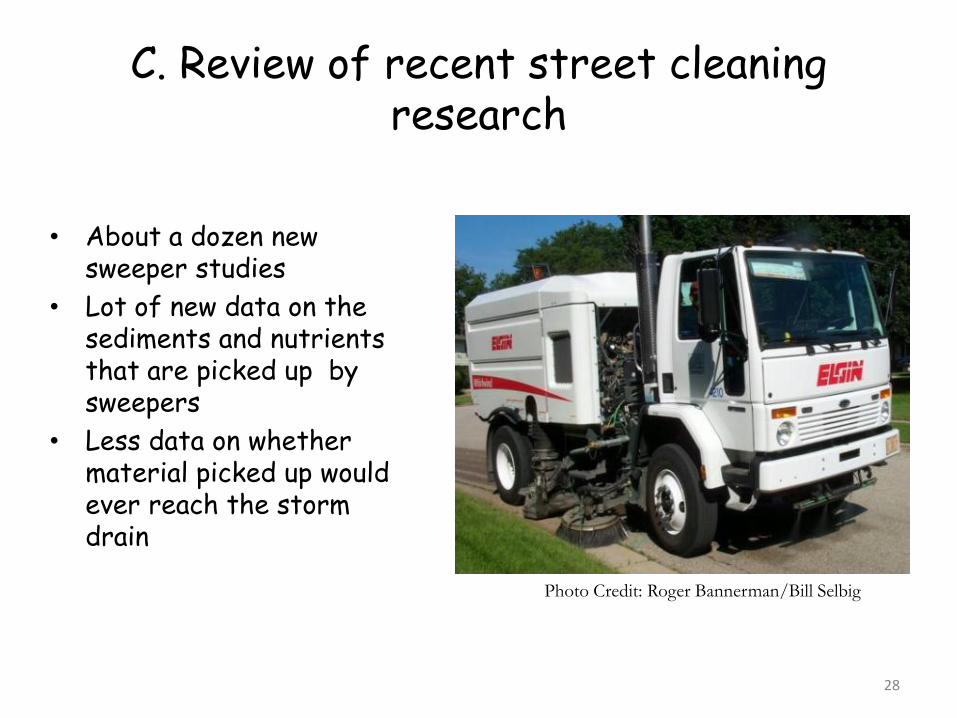
C. Review of recent street cleaning research
• About a dozen new sweeper studies
• Lot of new data on the sediments and nutrients that are picked up by sweepers
• Less data on whether material picked up would ever reach the storm drain
Photo Credit: Roger Bannerman/Bill Selbig
28
Stre
et L
oad
TimeCredit: Adapted from R. Bannerman and Bill Frost
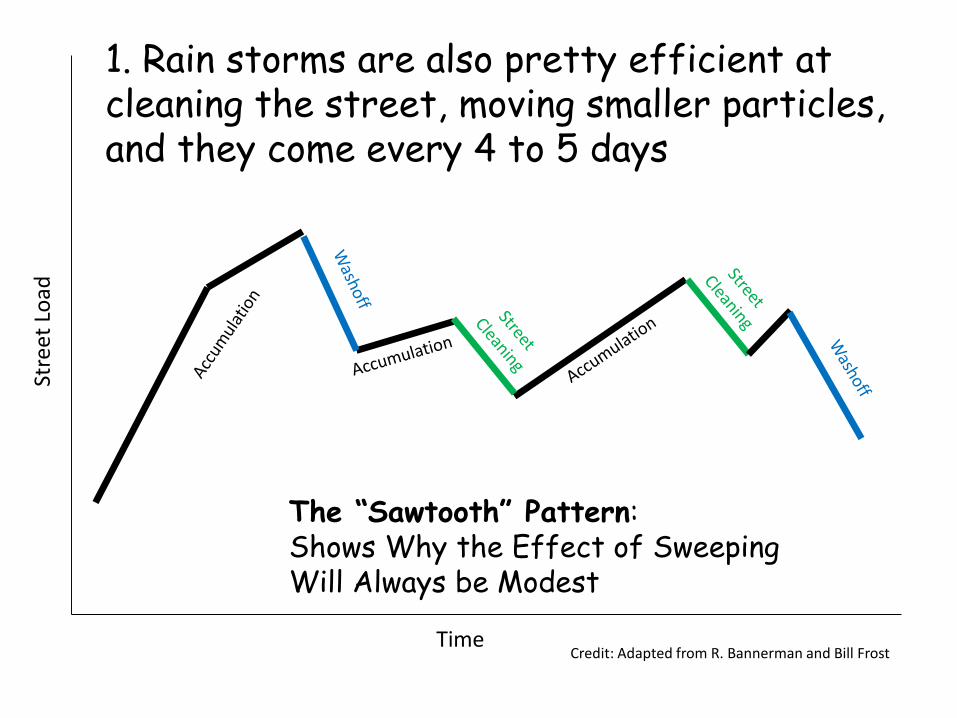
1. Rain storms are also pretty efficient at cleaning the street, moving smaller particles, and they come every 4 to 5 days
The “Sawtooth” Pattern: Shows Why the Effect of Sweeping Will Always be Modest
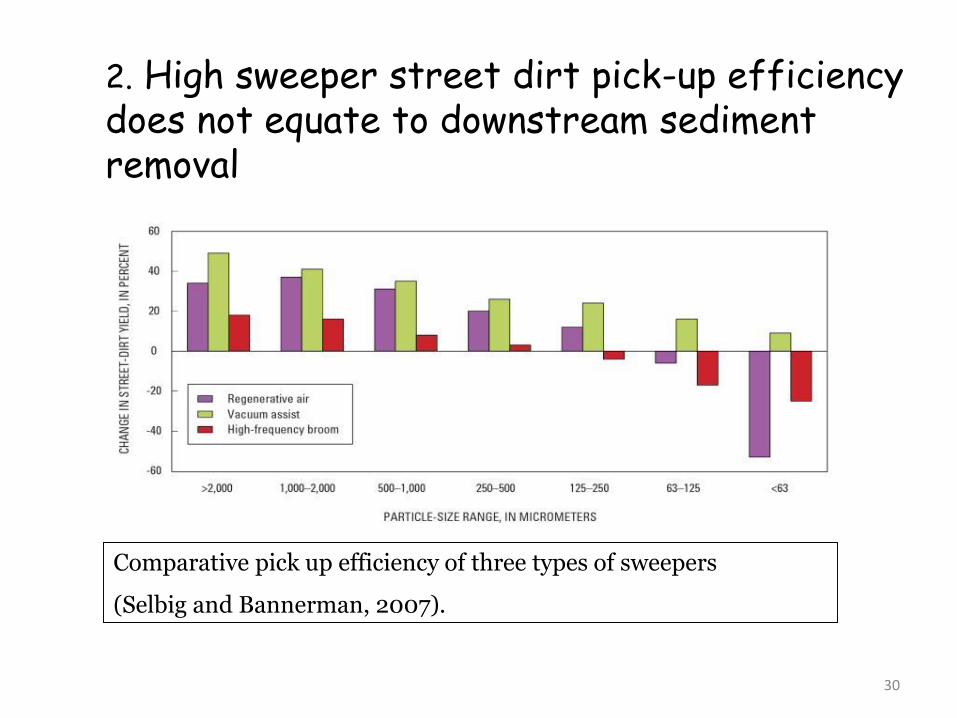
2. High sweeper street dirt pick-up efficiency does not equate to downstream sediment removal
30
Comparative pick up efficiency of three types of sweepers
(Selbig and Bannerman, 2007).
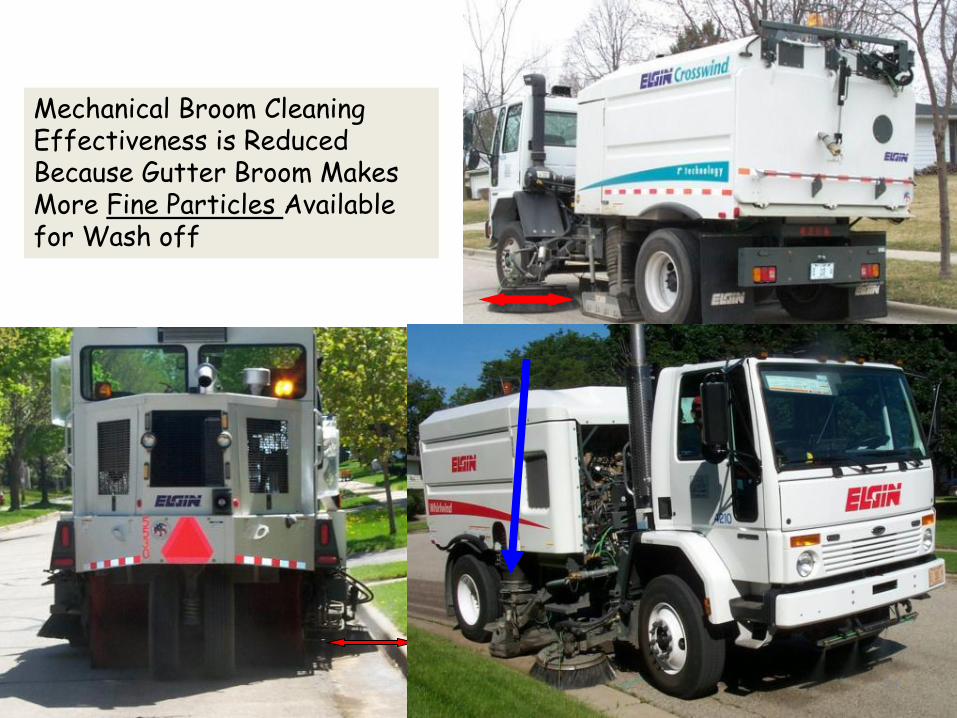
Mechanical Broom Cleaning Effectiveness is Reduced Because Gutter Broom Makes More Fine Particles Available for Wash off
31
3. Sweeping Technology Matters a Lot
• Mechanical broom sweepers used by many Bay communities pick up a lot of large particles, but not a lot of the sediments that are ultimately transported to the Chesapeake Bay.
• These sweepers have very low sediment reductions.
32
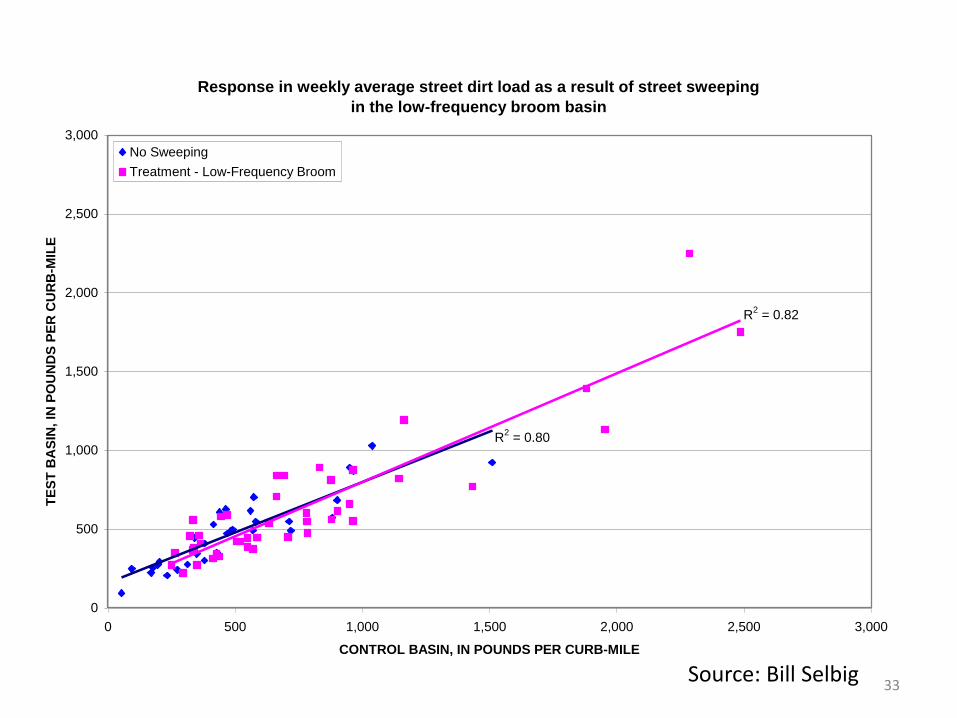
Response in weekly average street dirt load as a result of street sweeping
in the low-frequency broom basin
R2 = 0.80
R2 = 0.82
0
500
1,000
1,500
2,000
2,500
3,000
0 500 1,000 1,500 2,000 2,500 3,000
CONTROL BASIN, IN POUNDS PER CURB-MILE
TE
ST
BA
SIN
, IN
PO
UN
DS
PE
R C
UR
B-M
ILE
No Sweeping
Treatment - Low-Frequency Broom
33Source: Bill Selbig
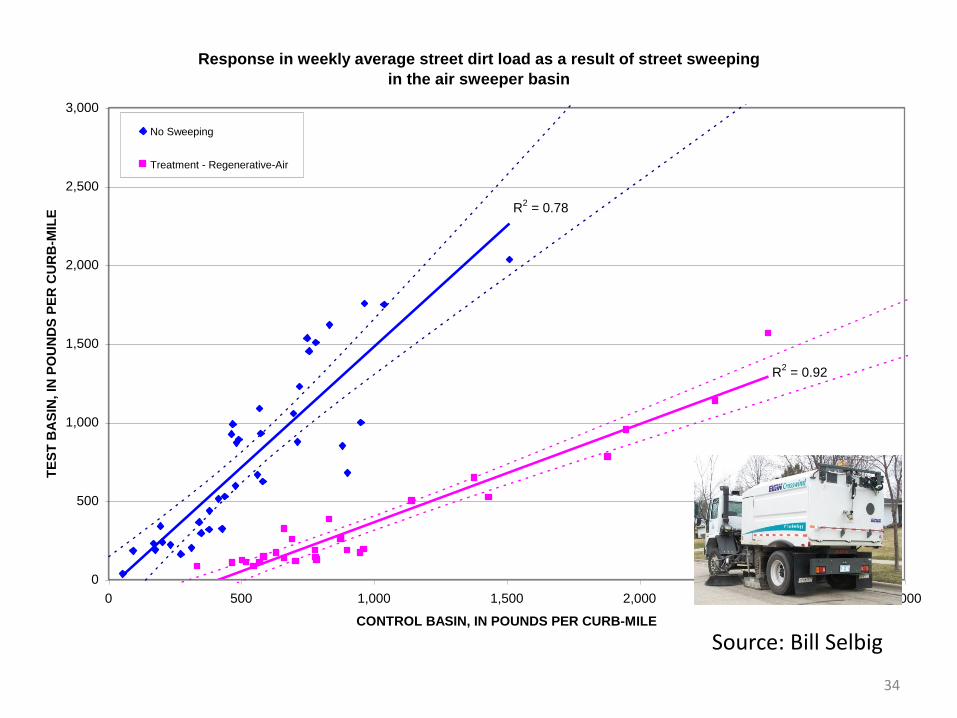
Response in weekly average street dirt load as a result of street sweeping
in the air sweeper basin
R2 = 0.92
R2 = 0.78
0
500
1,000
1,500
2,000
2,500
3,000
0 500 1,000 1,500 2,000 2,500 3,000
CONTROL BASIN, IN POUNDS PER CURB-MILE
TE
ST
BA
SIN
, IN
PO
UN
DS
PE
R C
UR
B-M
ILE
No Sweeping
Treatment - Regenerative-Air
34
Source: Bill Selbig
4. Frequent street sweeping is needed to get real sediment reductions
• Need to beat those rain storms that are also great at cleaning streets 30 to 50 times a year
• Panel provided a lot more options than the “once a week” sweeping frequency allowed by the last panel
• Seasonal options provide more flexibility in how MS4s deploy their sweeper fleets
35
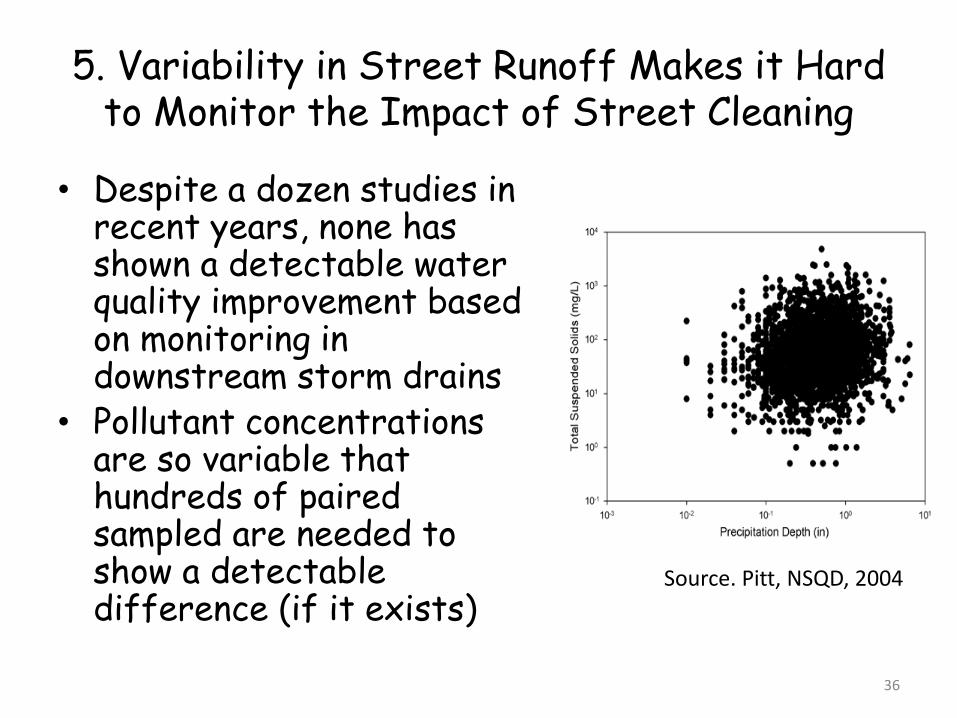
5. Variability in Street Runoff Makes it Hard to Monitor the Impact of Street Cleaning
• Despite a dozen studies in recent years, none has shown a detectable water quality improvement based on monitoring in downstream storm drains
• Pollutant concentrations are so variable that hundreds of paired sampled are needed to show a detectable difference (if it exists)
36
Source. Pitt, NSQD, 2004
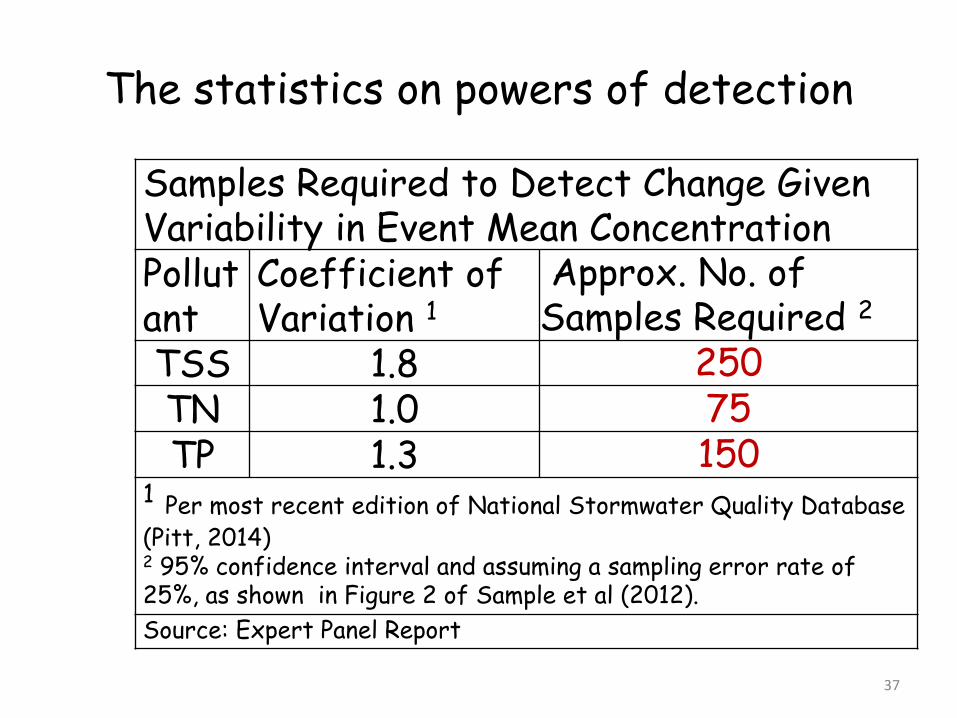
The statistics on powers of detection
Samples Required to Detect Change Given Variability in Event Mean ConcentrationPollutant
Coefficient of Variation 1
Approx. No. of Samples Required 2
TSS 1.8 250TN 1.0 75TP 1.3 150
1 Per most recent edition of National Stormwater Quality Database (Pitt, 2014)2 95% confidence interval and assuming a sampling error rate of 25%, as shown in Figure 2 of Sample et al (2012).
Source: Expert Panel Report
37
6. Need to resort to simulation models to derive street cleaning estimates, given
monitoring limitations
• Modeling also allows managers to determine removal rates for hundreds of different street cleaning scenarios
• Models are intended to guide better environmental decisions, but managers who use them should be aware of their inherent limitations, false precision, and uncertainty of model predictions.
38
D. WinSLAMM Model
• The Panel selected the WinSLAMM Model as the tool to estimate sediment removal rates for streets in urban watersheds.
WinSLAMM is widely accepted and documented model that simulates urban hydrology, pollutants and the effect of stormwater practices
• The basic street cleaning module in WinSLAMM is a conservative simulation of the potential sediment reductions associated with different street cleaning scenarios, and relies on sediment production and wash-off functions derived from empirical monitoring data
• Model was customized to incorporate East coast sediment buildup and washoff data, Chesapeake Bay rainfall, and expected variations in street types, technologies and urban land uses.
• Used in MN and MA to determine TP credits in lake TMDLs
39
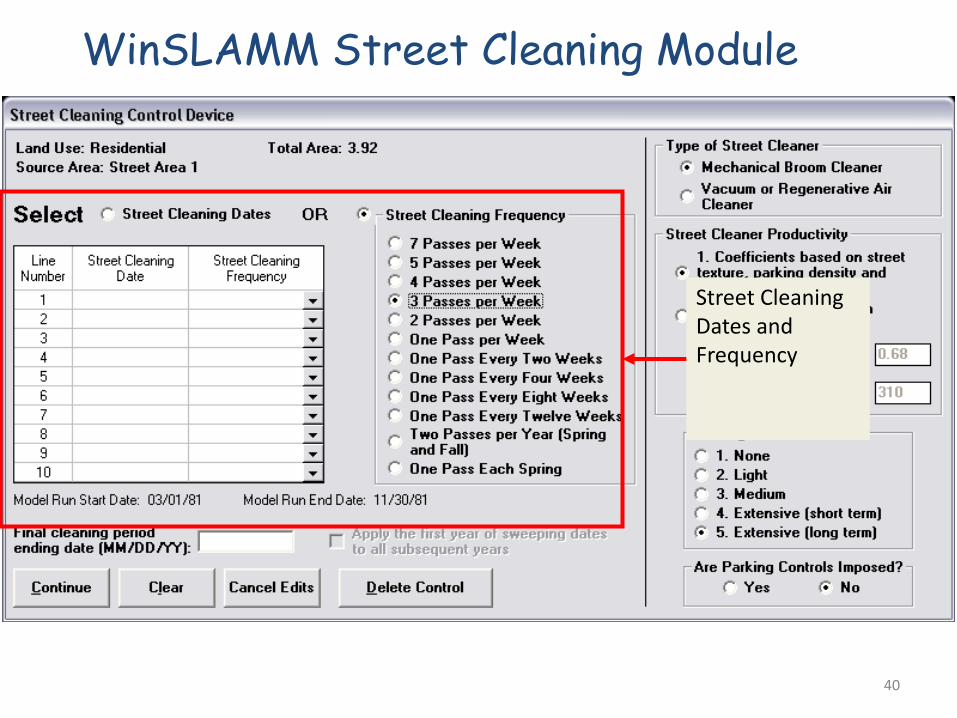
WinSLAMM Street Cleaning Module
Street Cleaning Dates and Frequency
40
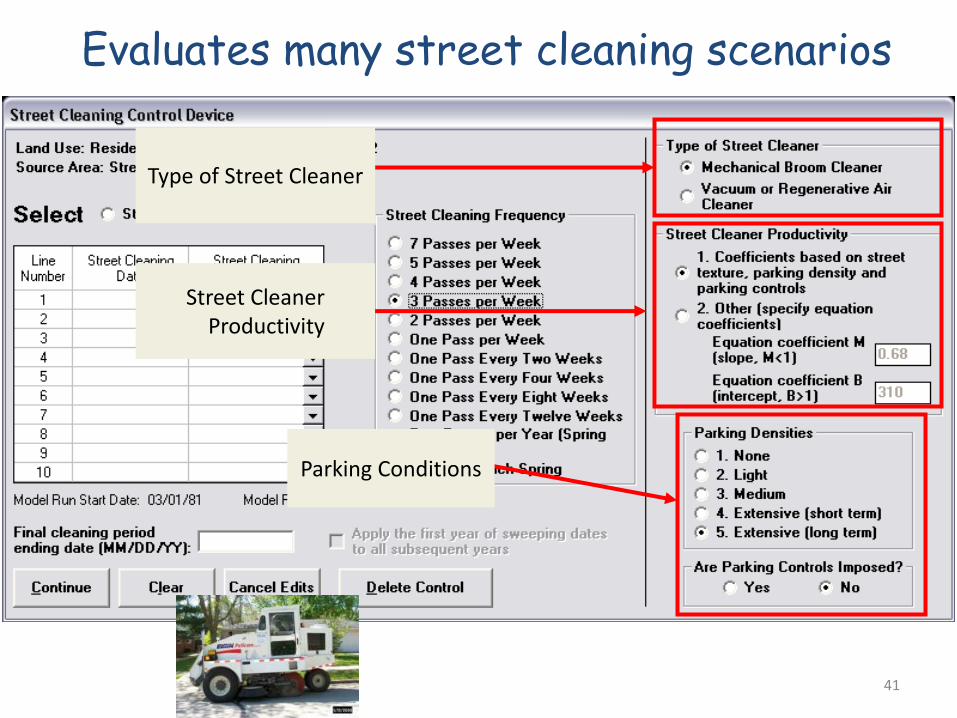
Evaluates many street cleaning scenarios
Street Cleaner Productivity
Parking Conditions
Type of Street Cleaner
41
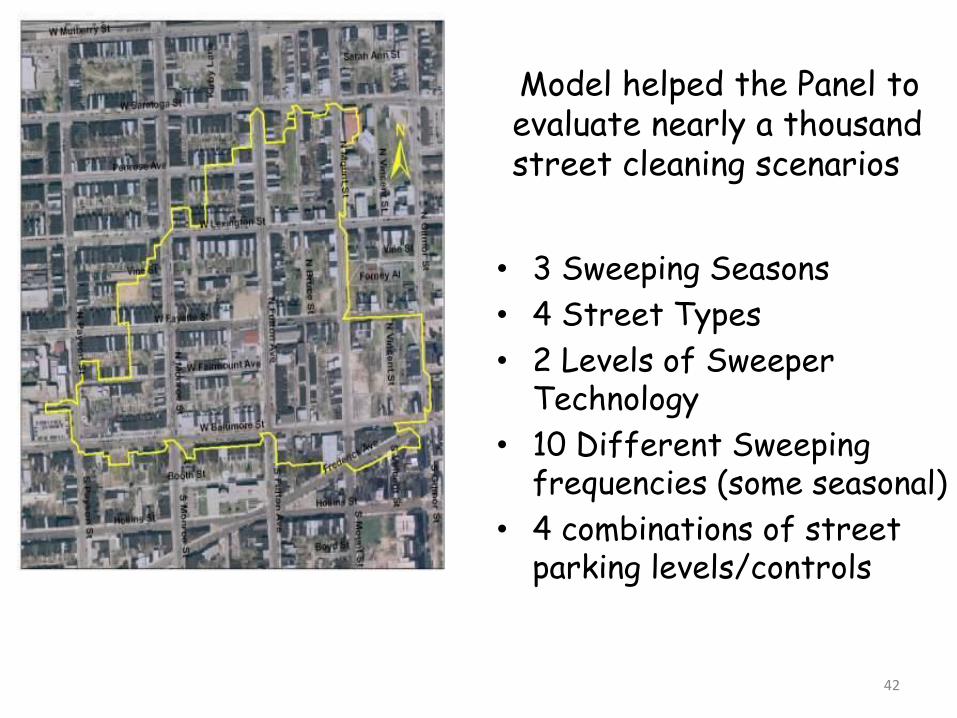
Model helped the Panel to evaluate nearly a thousand street cleaning scenarios
• 3 Sweeping Seasons
• 4 Street Types
• 2 Levels of Sweeper Technology
• 10 Different Sweeping frequencies (some seasonal)
• 4 combinations of street parking levels/controls
42
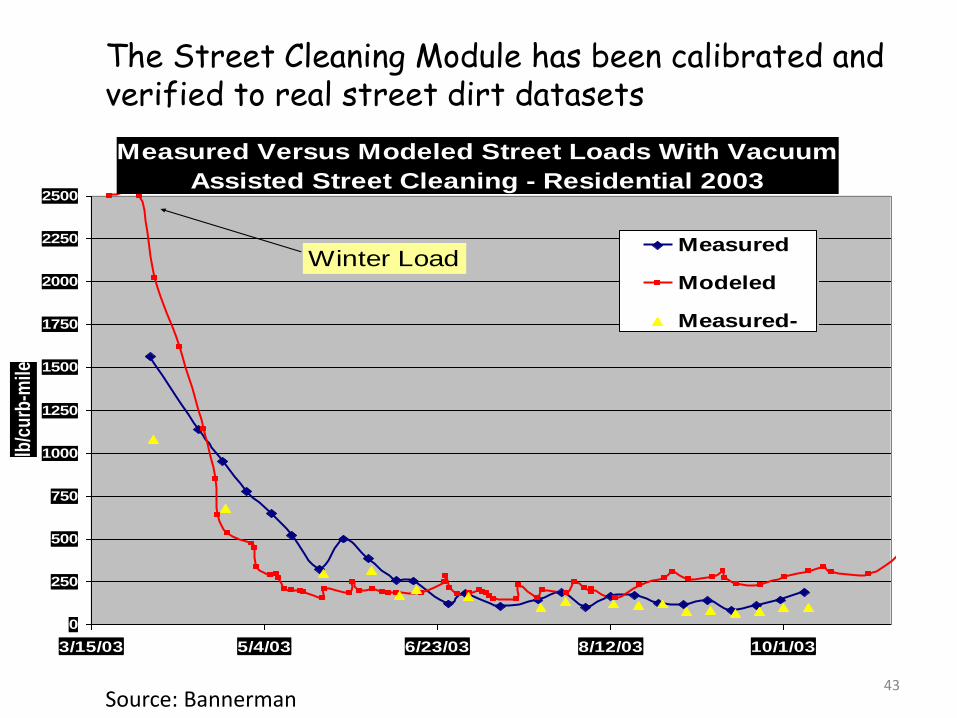
Measured Versus Modeled Street Loads With Vacuum
Assisted Street Cleaning - Residential 2003
0
250
500
750
1000
1250
1500
1750
2000
2250
2500
3/15/03 5/4/03 6/23/03 8/12/03 10/1/03
lb/c
urb
-mile
Measured
Modeled
Measured-post
Winter Load
The Street Cleaning Module has been calibrated and verified to real street dirt datasets
43Source: Bannerman
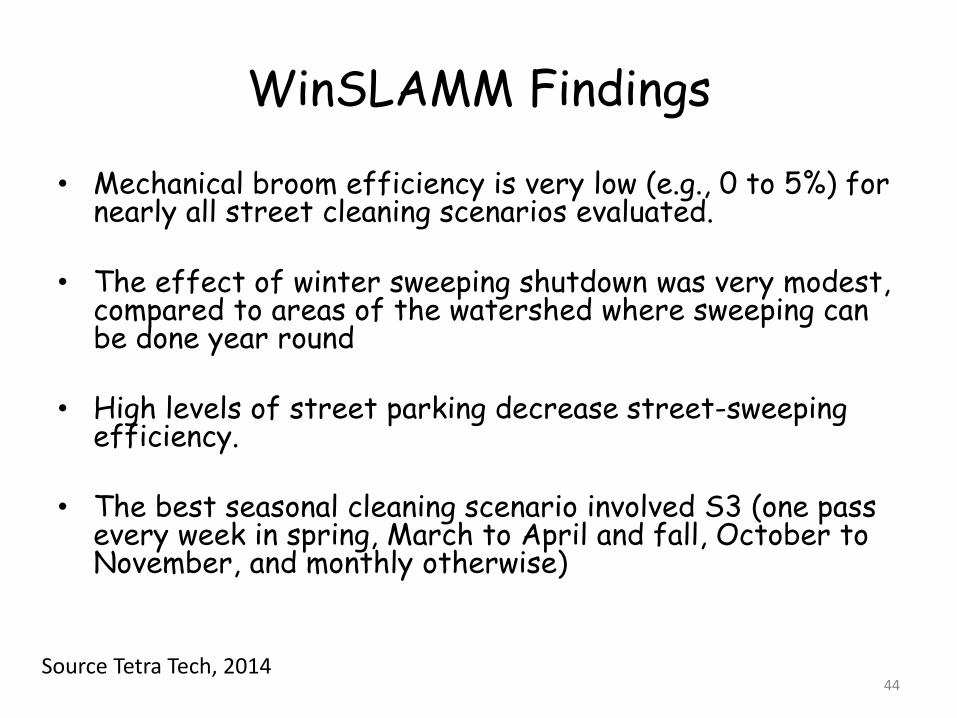
WinSLAMM Findings
• Mechanical broom efficiency is very low (e.g., 0 to 5%) for nearly all street cleaning scenarios evaluated.
• The effect of winter sweeping shutdown was very modest, compared to areas of the watershed where sweeping can be done year round
• High levels of street parking decrease street-sweeping efficiency.
• The best seasonal cleaning scenario involved S3 (one pass every week in spring, March to April and fall, October to November, and monthly otherwise)
44Source Tetra Tech, 2014
Questions?
E. The Three Credit Changes
1. Street Cleaning Credit, for lane miles swept
2. No Street Cleaning Credit for Hopper Mass
3. Storm Drain Cleaning Credit, mass collected
46
1. The Street Cleaning Credit
• The standard unit is curb miles swept
• One impervious acre is equal to one curb-lane mile swept, for streets with curb and gutters, assuming they are swept on one-side only
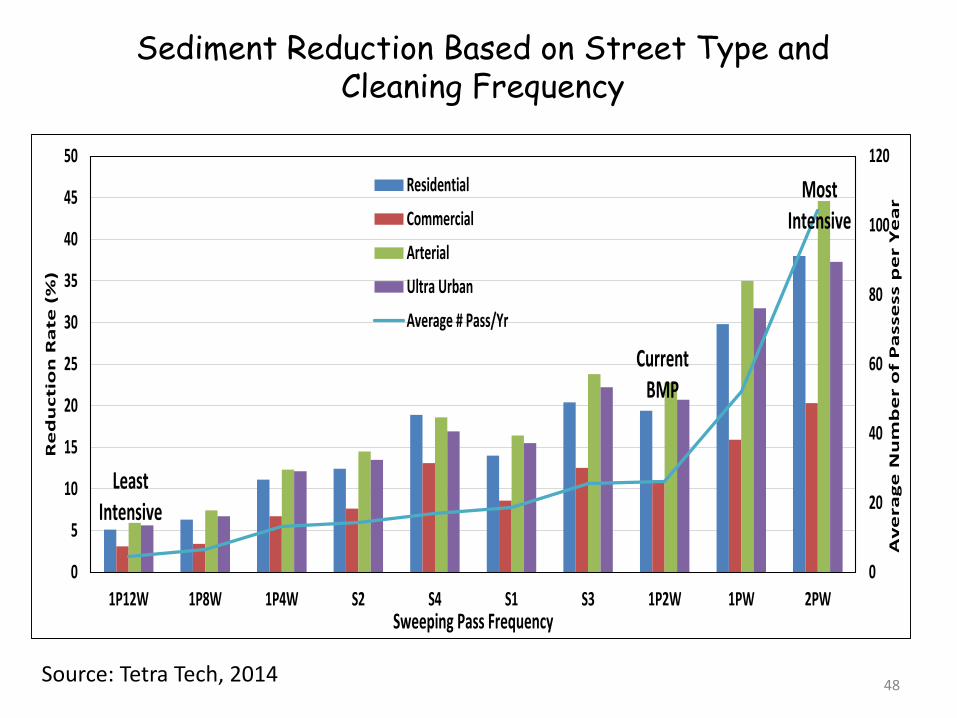
• A spreadsheet calculated the annual sediment and nutrient reduction for 960 street cleaning scenarios…which were then consolidated into 11 street cleaning practices (SCPs)
• Credit must be calculated every year
47
0
20
40
60
80
100
120
0
5
10
15
20
25
30
35
40
45
50
1P12W 1P8W 1P4W S2 S4 S1 S3 1P2W 1PW 2PW
Av
era
ge
Nu
mb
er o
f P
asse
ss p
er Y
ea
r
Re
du
ctio
n R
ate
(%
)
Sweeping Pass Frequency
Residential
Commercial
Arterial
Ultra Urban
Average # Pass/Yr
Most Intensive
CurrentBMP
Least Intensive
Sediment Reduction Based on Street Type and Cleaning Frequency
48Source: Tetra Tech, 2014
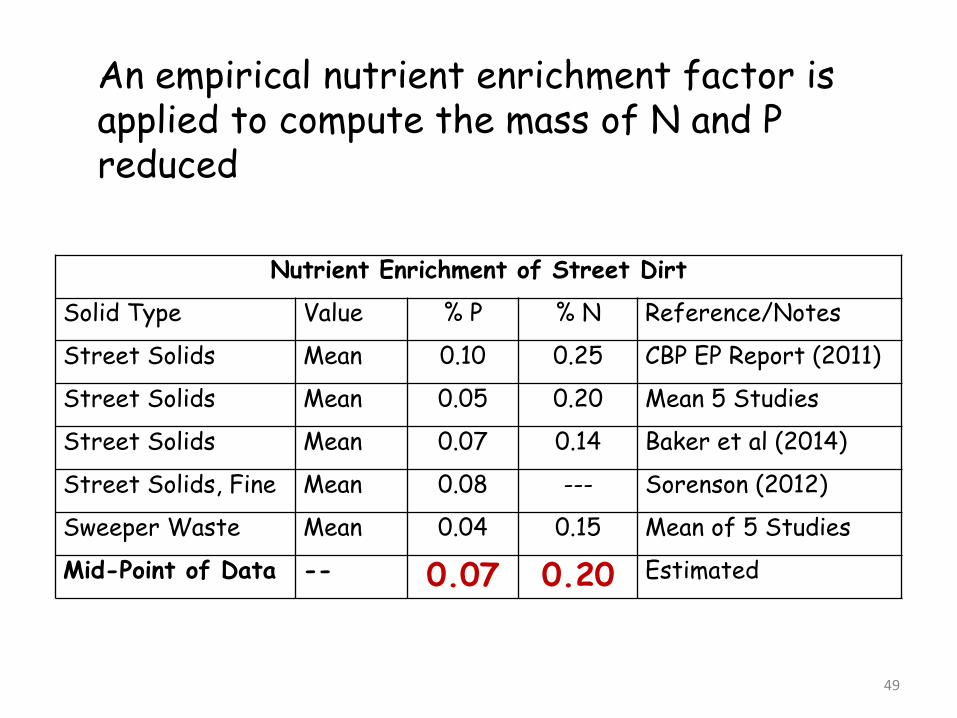
Nutrient Enrichment of Street Dirt
Solid Type Value % P % N Reference/Notes
Street Solids Mean 0.10 0.25 CBP EP Report (2011)
Street Solids Mean 0.05 0.20 Mean 5 Studies
Street Solids Mean 0.07 0.14 Baker et al (2014)
Street Solids, Fine Mean 0.08 --- Sorenson (2012)
Sweeper Waste Mean 0.04 0.15 Mean of 5 Studies
Mid-Point of Data -- 0.07 0.20 Estimated
An empirical nutrient enrichment factor is applied to compute the mass of N and P reduced
49
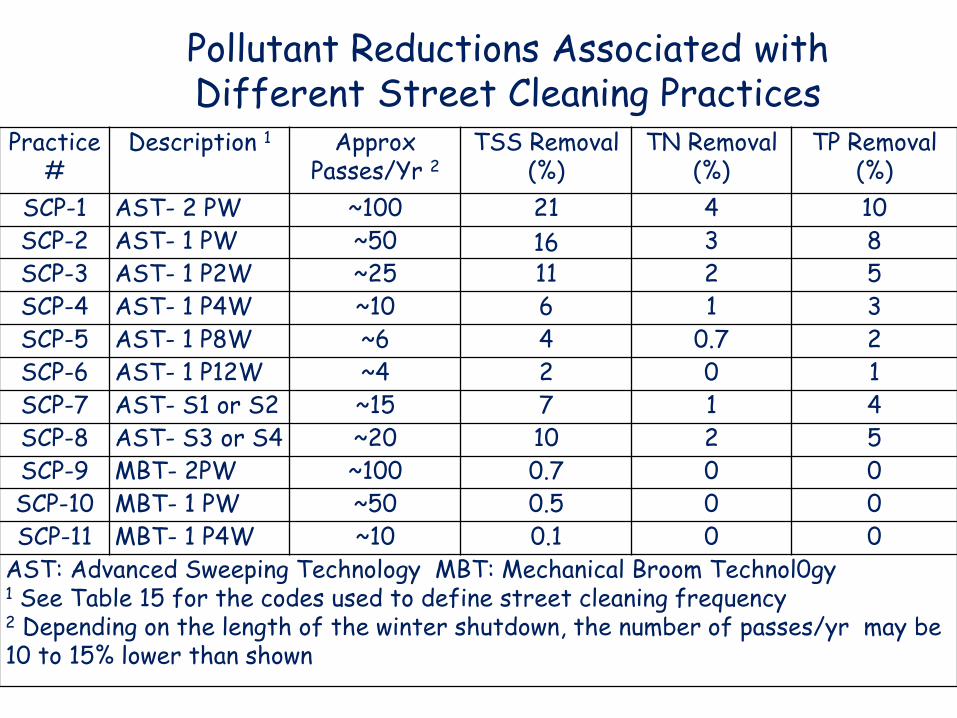
Pollutant Reductions Associated with Different Street Cleaning Practices
Practice #
Description 1 ApproxPasses/Yr 2
TSS Removal(%)
TN Removal(%)
TP Removal(%)
SCP-1 AST- 2 PW ~100 21 4 10
SCP-2 AST- 1 PW ~50 16 3 8
SCP-3 AST- 1 P2W ~25 11 2 5
SCP-4 AST- 1 P4W ~10 6 1 3
SCP-5 AST- 1 P8W ~6 4 0.7 2
SCP-6 AST- 1 P12W ~4 2 0 1
SCP-7 AST- S1 or S2 ~15 7 1 4
SCP-8 AST- S3 or S4 ~20 10 2 5
SCP-9 MBT- 2PW ~100 0.7 0 0
SCP-10 MBT- 1 PW ~50 0.5 0 0
SCP-11 MBT- 1 P4W ~10 0.1 0 0
AST: Advanced Sweeping Technology MBT: Mechanical Broom Technol0gy1 See Table 15 for the codes used to define street cleaning frequency2 Depending on the length of the winter shutdown, the number of passes/yr may be 10 to 15% lower than shown
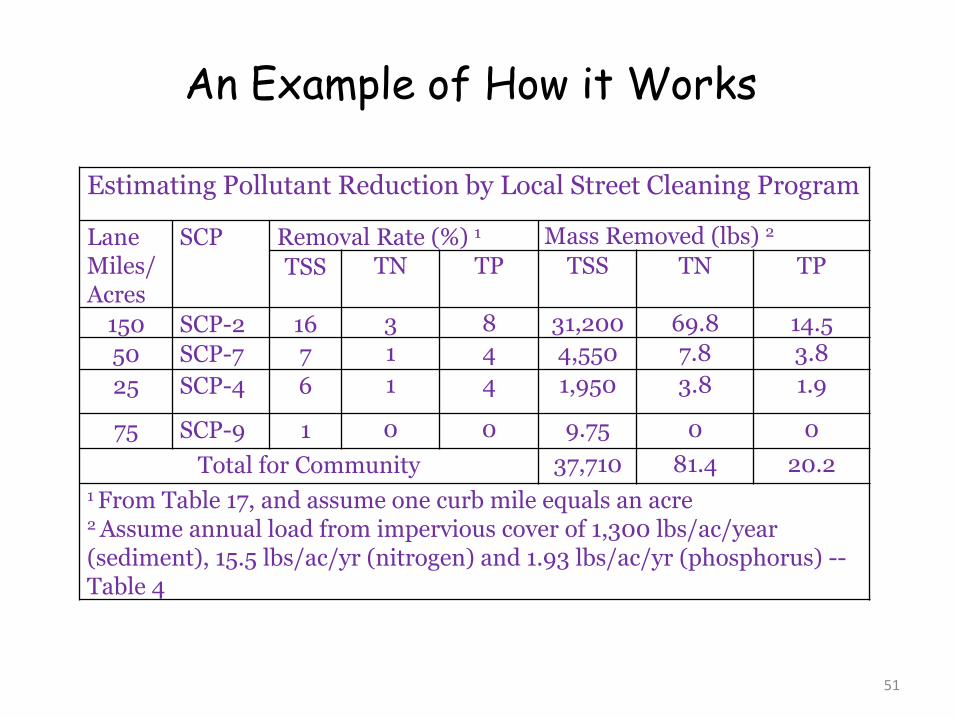
An Example of How it Works
Estimating Pollutant Reduction by Local Street Cleaning Program
Lane Miles/Acres
SCP Removal Rate (%) 1 Mass Removed (lbs) 2
TSS TN TP TSS TN TP
150 SCP-2 16 3 8 31,200 69.8 14.5
50 SCP-7 7 1 4 4,550 7.8 3.8
25 SCP-4 6 1 4 1,950 3.8 1.9
75 SCP-9 1 0 0 9.75 0 0
Total for Community 37,710 81.4 20.21 From Table 17, and assume one curb mile equals an acre2 Assume annual load from impervious cover of 1,300 lbs/ac/year (sediment), 15.5 lbs/ac/yr (nitrogen) and 1.93 lbs/ac/yr (phosphorus) --Table 4
51
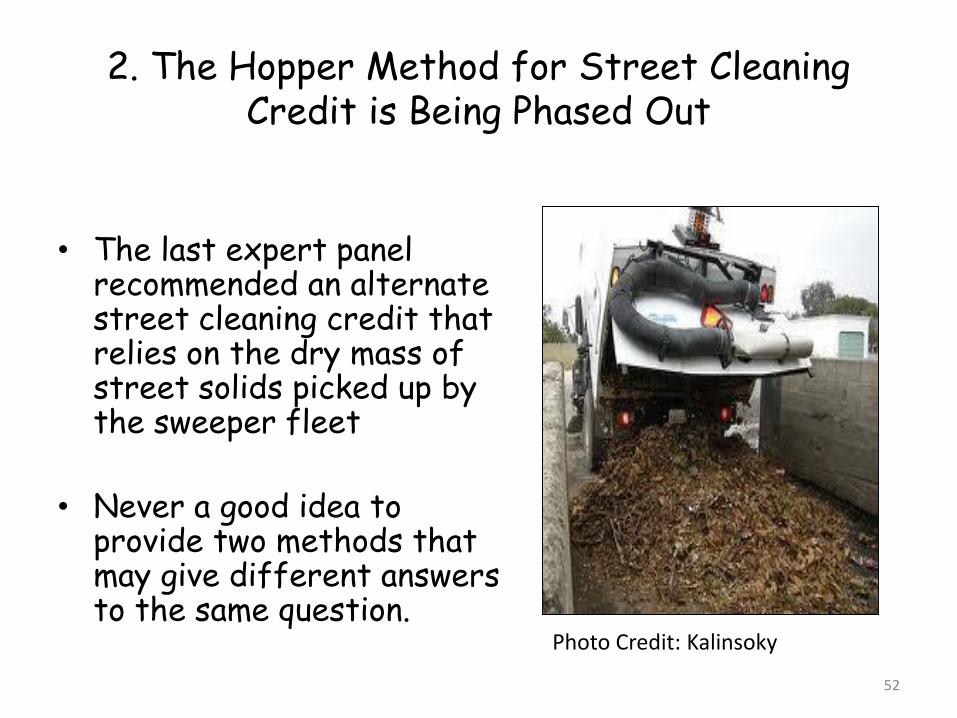
2. The Hopper Method for Street Cleaning Credit is Being Phased Out
• The last expert panel recommended an alternate street cleaning credit that relies on the dry mass of street solids picked up by the sweeper fleet
• Never a good idea to provide two methods that may give different answers to the same question.
52
Photo Credit: Kalinsoky
2. End of the hopper credit
• The WINSLAMM modeling provides better support for the curb lane miles swept approach
• Eliminates the possibility that users will "shop" for the method that gives them the most credit.
• The Old Hopper Method Credit is OK in Phase 5.3.2, but expires with Phase 6 of CBWM
• Hopper data is still used to calculate and verify the storm drain cleaning credit
53
3. The Storm Drain Cleaning Credit
• Sediment and nutrient credit for solids that are directly removed from catch basins, storm drain pipes or are collected at the outfall, based on the dry weight of the mass of solids collected, using a default nutrient enrichment factor (or a locally derived one).
• Must also meet 3 qualifying conditions to ensure cleaning has a water quality focus
54

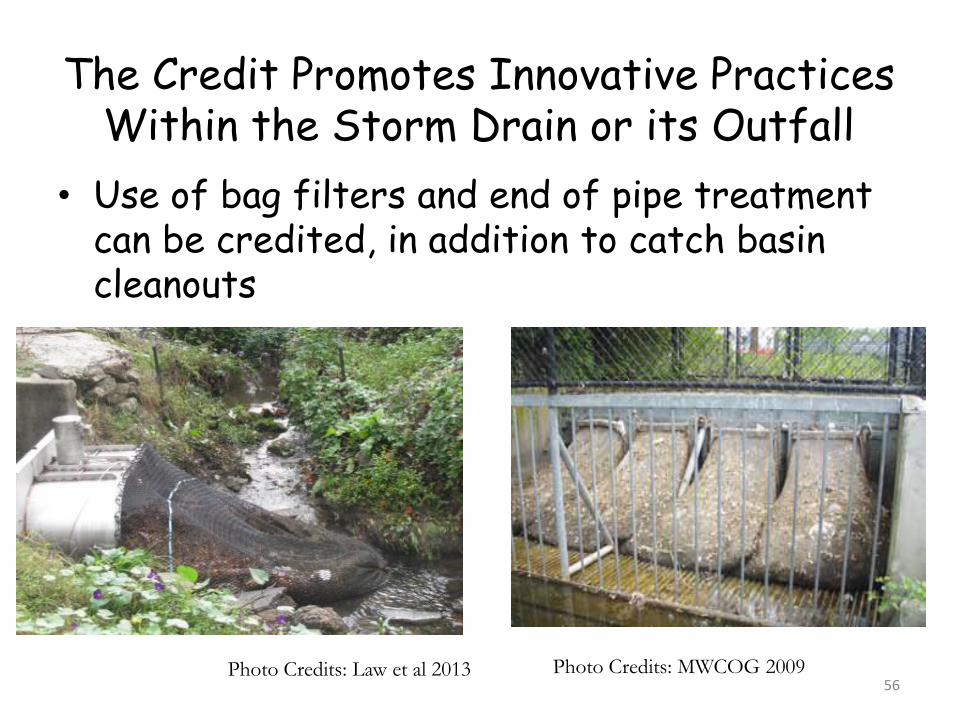
The Credit Promotes Innovative Practices Within the Storm Drain or its Outfall
• Use of bag filters and end of pipe treatment can be credited, in addition to catch basin cleanouts
Photo Credits: Law et al 2013 Photo Credits: MWCOG 200956
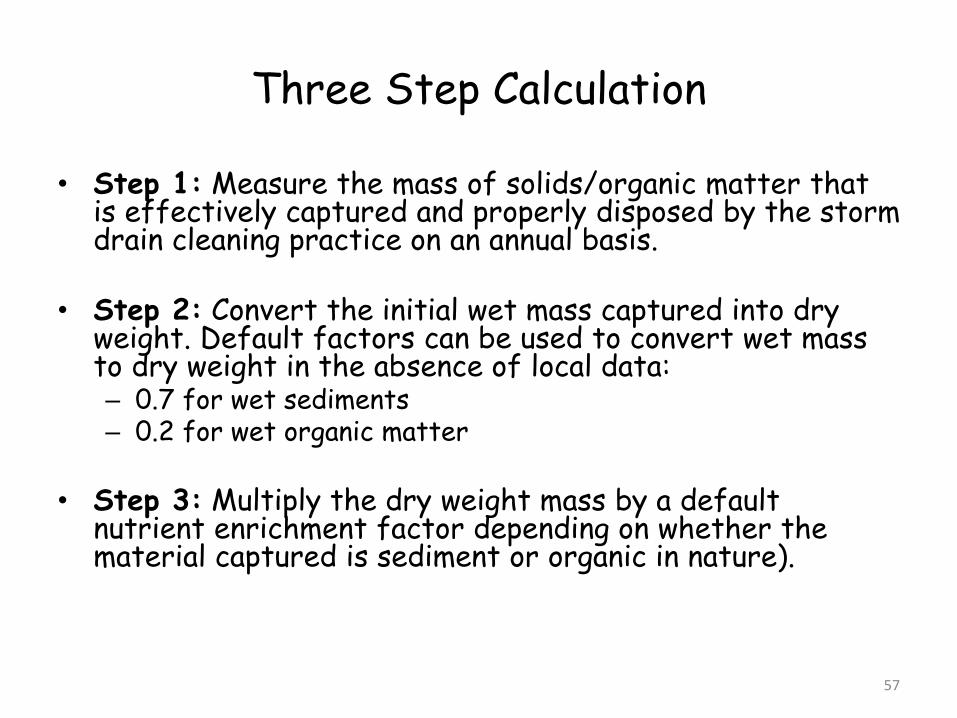
Three Step Calculation
• Step 1: Measure the mass of solids/organic matter that is effectively captured and properly disposed by the storm drain cleaning practice on an annual basis.
• Step 2: Convert the initial wet mass captured into dry weight. Default factors can be used to convert wet mass to dry weight in the absence of local data: – 0.7 for wet sediments – 0.2 for wet organic matter
• Step 3: Multiply the dry weight mass by a default nutrient enrichment factor depending on whether the material captured is sediment or organic in nature).
57
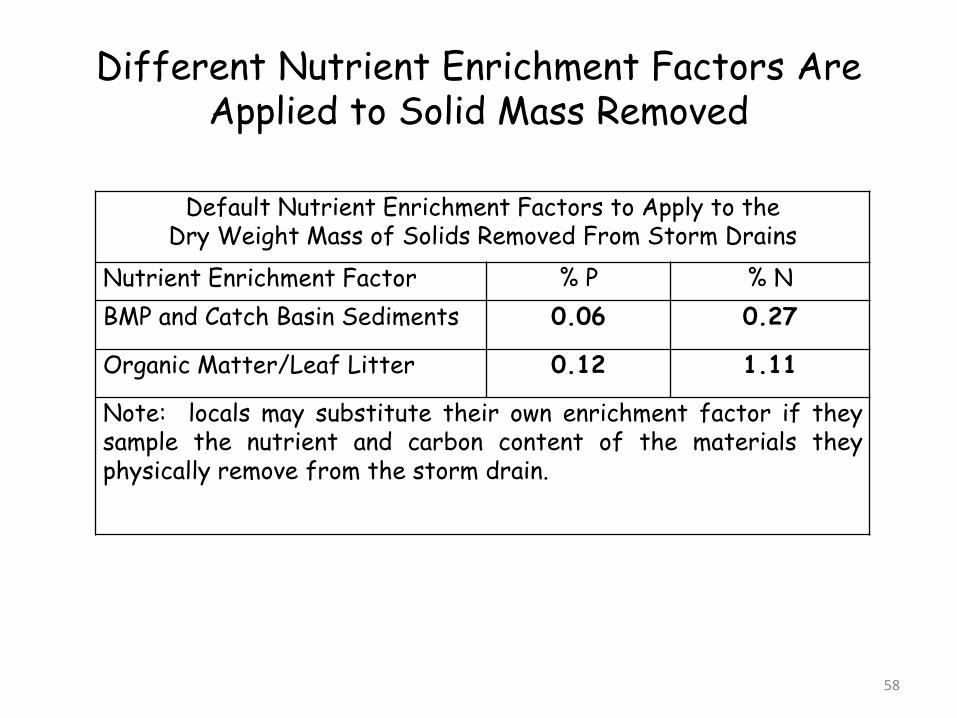
Different Nutrient Enrichment Factors Are Applied to Solid Mass Removed
58
Default Nutrient Enrichment Factors to Apply to theDry Weight Mass of Solids Removed From Storm Drains
Nutrient Enrichment Factor % P % N
BMP and Catch Basin Sediments 0.06 0.27
Organic Matter/Leaf Litter 0.12 1.11
Note: locals may substitute their own enrichment factor if theysample the nutrient and carbon content of the materials theyphysically remove from the storm drain.
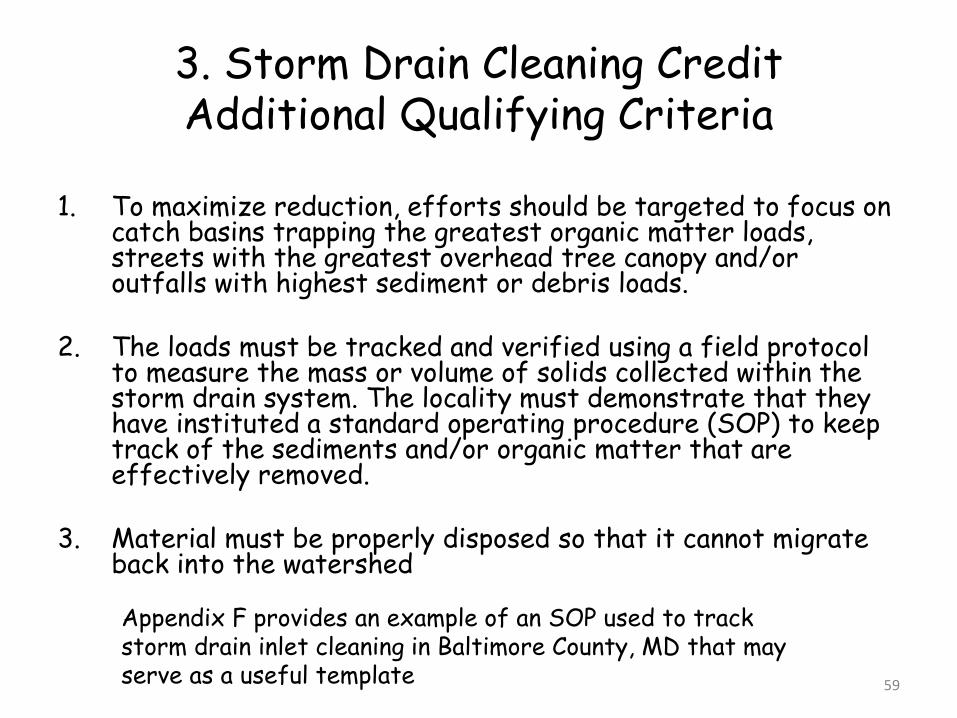
3. Storm Drain Cleaning Credit Additional Qualifying Criteria
1. To maximize reduction, efforts should be targeted to focus on catch basins trapping the greatest organic matter loads, streets with the greatest overhead tree canopy and/or outfalls with highest sediment or debris loads.
2. The loads must be tracked and verified using a field protocol to measure the mass or volume of solids collected within the storm drain system. The locality must demonstrate that they have instituted a standard operating procedure (SOP) to keep track of the sediments and/or organic matter that are effectively removed.
3. Material must be properly disposed so that it cannot migrate back into the watershed
59
Appendix F provides an example of an SOP used to track storm drain inlet cleaning in Baltimore County, MD that may serve as a useful template
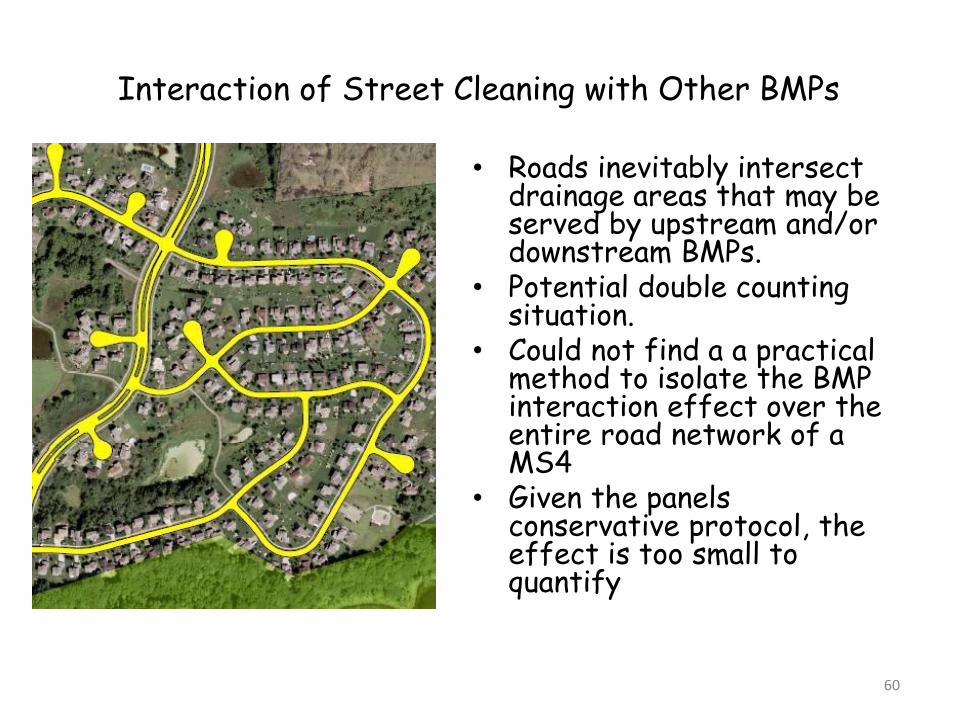
Interaction of Street Cleaning with Other BMPs
• Roads inevitably intersect drainage areas that may be served by upstream and/or downstream BMPs.
• Potential double counting situation.
• Could not find a a practical method to isolate the BMP interaction effect over the entire road network of a MS4
• Given the panels conservative protocol, the effect is too small to quantify
60
F. Reporting, Tracking and Verification
61
For Street Cleaning &Storm Drain Cleaning
Street Cleaning Reporting
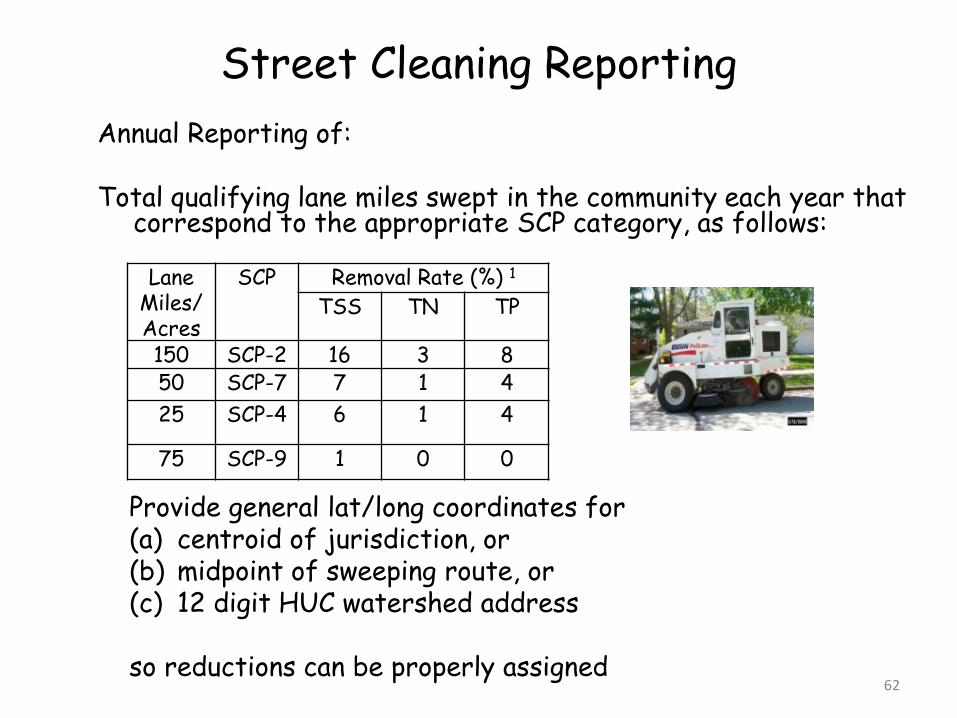
Annual Reporting of:
Total qualifying lane miles swept in the community each year that correspond to the appropriate SCP category, as follows:
62
Lane Miles/Acres
SCP Removal Rate (%) 1
TSS TN TP
150 SCP-2 16 3 850 SCP-7 7 1 4
25 SCP-4 6 1 4
75 SCP-9 1 0 0
Provide general lat/long coordinates for (a) centroid of jurisdiction, or (b) midpoint of sweeping route, or (c) 12 digit HUC watershed address
so reductions can be properly assigned
Street Cleaning Tracking
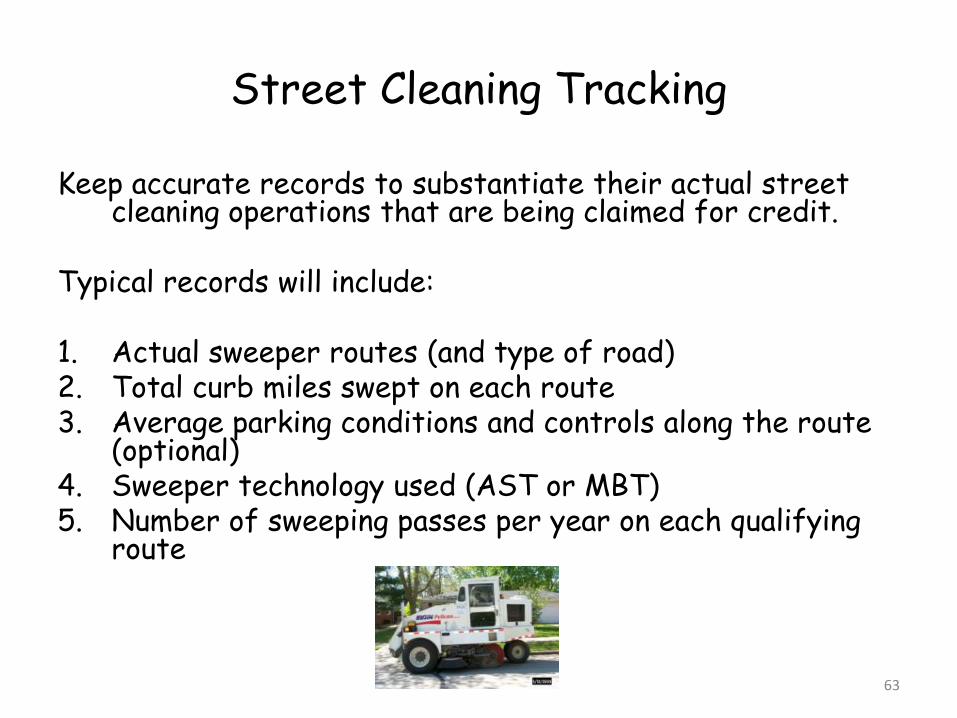
Keep accurate records to substantiate their actual street cleaning operations that are being claimed for credit.
Typical records will include:
1. Actual sweeper routes (and type of road)2. Total curb miles swept on each route3. Average parking conditions and controls along the route
(optional)4. Sweeper technology used (AST or MBT)5. Number of sweeping passes per year on each qualifying
route
63
Street Cleaning Verification
Collect one high quality street sweeper waste sample on one route for each unique SCP they report for credit every year.
The single sample is used to characterize the mass and quality of sweeper waste picked up along a single route by a single sweeper that is disposed at a landfill or a solid waste transfer station
The data is used to compute more accurate:– Average dry weight solids load collected over the route
(lbs/curb mile)
– Wet mass to dry weight conversion factor
– Sweeper waste nutrient enrichment ratios
64
RTV for Storm Drain Cleaning Credit
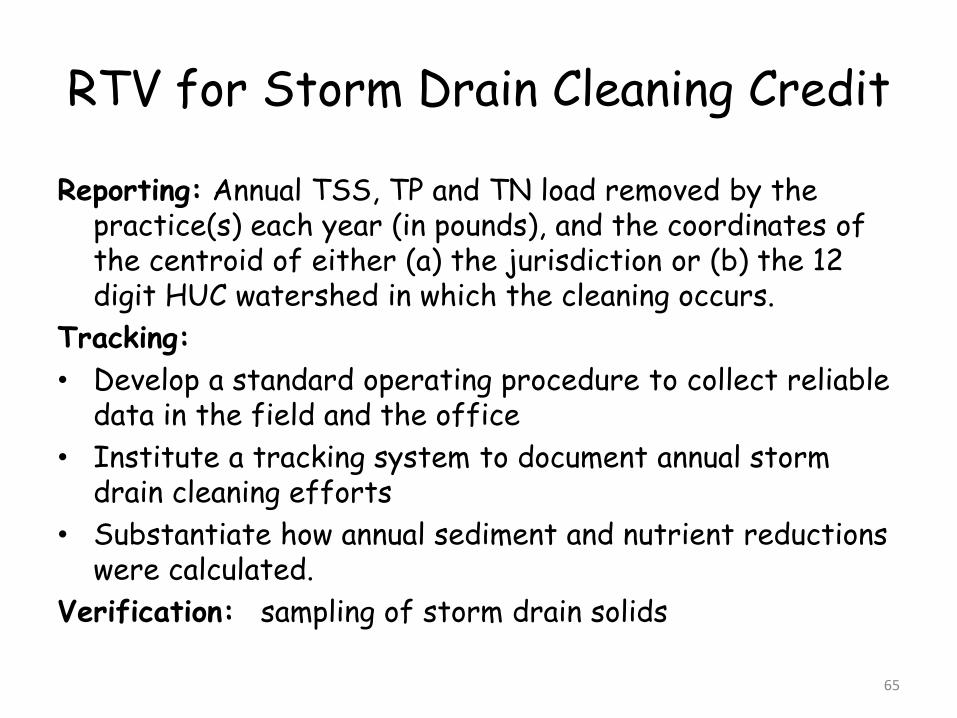
Reporting: Annual TSS, TP and TN load removed by the practice(s) each year (in pounds), and the coordinates of the centroid of either (a) the jurisdiction or (b) the 12 digit HUC watershed in which the cleaning occurs.
Tracking:
• Develop a standard operating procedure to collect reliable data in the field and the office
• Institute a tracking system to document annual storm drain cleaning efforts
• Substantiate how annual sediment and nutrient reductions were calculated.
Verification: sampling of storm drain solids
65
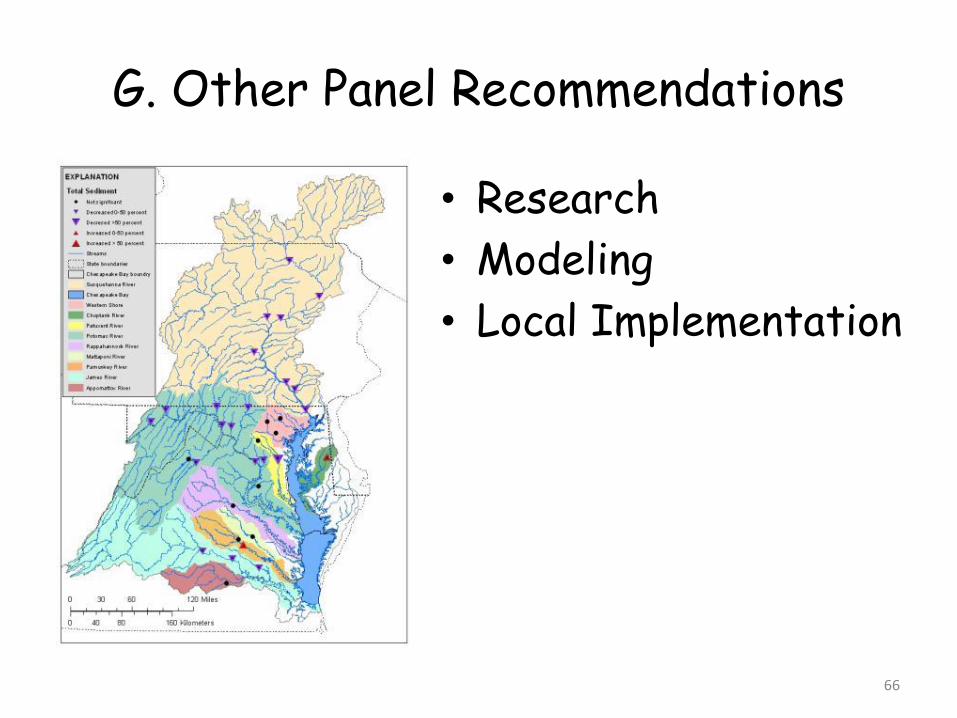
G. Other Panel Recommendations
66
• Research
• Modeling
• Local Implementation
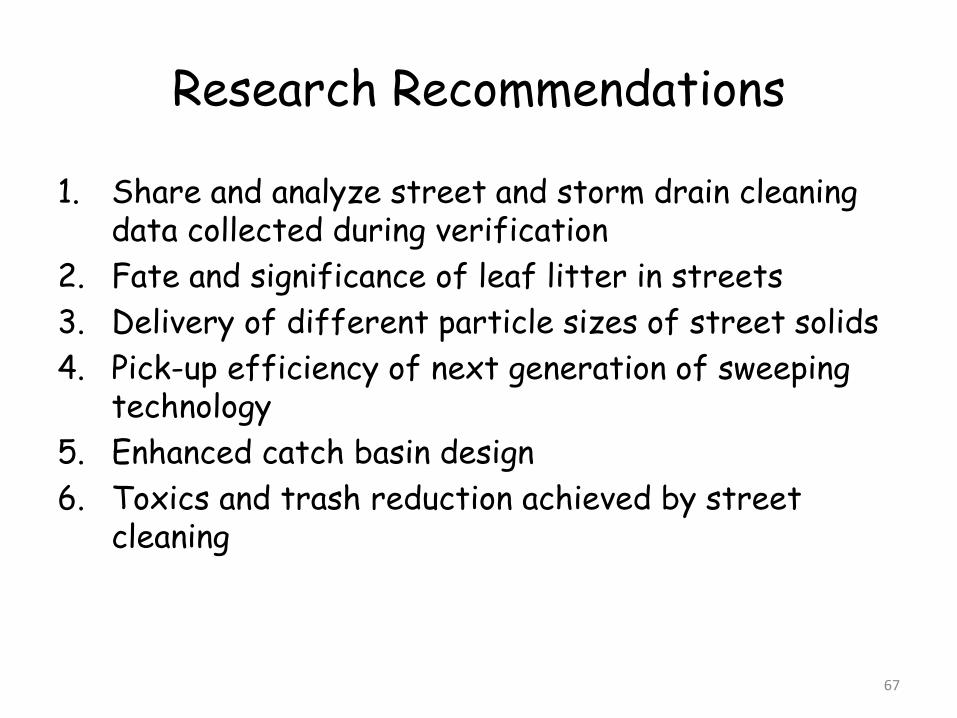
Research Recommendations
1. Share and analyze street and storm drain cleaning data collected during verification
2. Fate and significance of leaf litter in streets
3. Delivery of different particle sizes of street solids
4. Pick-up efficiency of next generation of sweeping technology
5. Enhanced catch basin design
6. Toxics and trash reduction achieved by street cleaning
67
Modeling
• The panel endorses the creation of a new land use in the next generation of the Chesapeake Bay Watershed Model that represents the impervious cover associated with transport land uses (i.e., streets, roads and highways).
68
Local Implementation Considerations
• Develop more detailed sampling guidance and standard operating procedures to support the proposed verification protocols for street and storm drain cleaning.
• Training and Outreach
• Support Website for MS4s on the Practices
• Annual forum for MS4 fleet managers
69
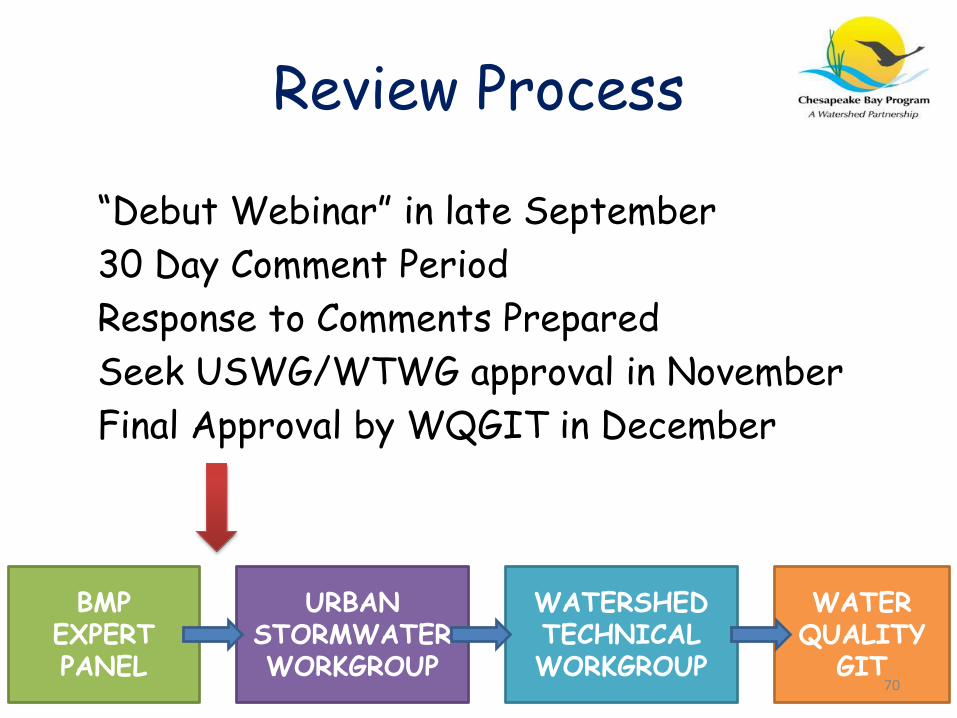
Review Process
“Debut Webinar” in late September
30 Day Comment Period
Response to Comments Prepared
Seek USWG/WTWG approval in November
Final Approval by WQGIT in December
BMP EXPERT PANEL
URBAN STORMWATER WORKGROUP
WATER QUALITY
GIT
WATERSHED TECHNICAL WORKGROUP
70
Questions?
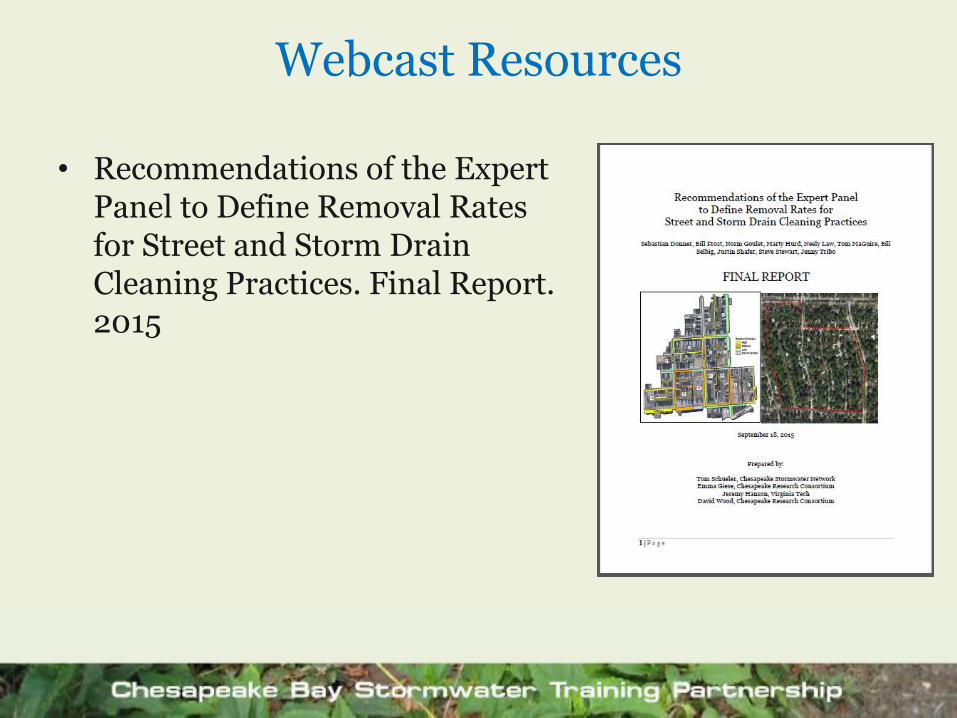
Webcast Resources
• Recommendations of the Expert Panel to Define Removal Rates for Street and Storm Drain Cleaning Practices. Final Report. 2015