Embed Size (px)
Citation preview
energies
Article
Strength Analysis of a PTO (Power Take-Off)Gear-Train of a Multi-Purpose Cultivator during aRotary Ditching Operation
Yeon-Soo Kim 1,2, Pa-Ul Lee 1, Wan-Soo Kim 1, Oh-Won Kwon 3, Chang-Won Kim 3 ,Kyeong-Hwan Lee 4 and Yong-Joo Kim 1,*
1 Department of Biosystems Machinery Engineering, Chungnam National University, Daejeon 34134, Korea;[email protected] (Y.-S.K.); [email protected] (P.-U.L.); [email protected] (W.-S.K.)
2 Convergence Agricultural Machinery Group, Korea Institute of Industrial Technology (KITECH),Gimje 54325, Korea
3 Korea Institute of Machinery &Materials (KIMM), Daegu 42994, Korea; [email protected] (O.-W.K.);[email protected] (C.-W.K.)
4 Department of Rural & Bio-Systems Engineering, Chonnam National University, Gwangju 500-757, Korea;[email protected]
* Correspondence: [email protected]; Tel.: +82-10-9811-5290
Received: 8 February 2019; Accepted: 18 March 2019; Published: 21 March 2019�����������������
Abstract: Optimal design of transmission gears is important to ensure product durability andreliability. This study measured a multi-purpose cultivator during a rotary ditching operation andanalyzed the strength of the power take off (PTO) gear-train for the cultivator using analysis software(KISSsoft, KISSsoft AG—A Gleason Company, Bubikon, Switzerland) based on ISO 6336 standardsand a modified Miner’s rule. A load measurement system was installed on the cultivator to measurethe load on the PTO shaft. To measure the load on the PTO shaft, the load measuring systemconsisting of a data acquisition board (NI USB-6212, National Instruments, Austin, TX, USA) anda torque sensor was installed on the cultivator. Rotary ditching operations were conducted at twoground speeds and two PTO rotational speeds on a field with the same soil conditions. The measuredload data were constructed using the rainflow-counting algorithm and the Smith-Watson-Topperequation. When the ground speed or PTO rotational speed increased, the average and maximum PTOtorque increased significantly. The average measured torque ratio to rated torque of the PTO inputshaft (19.6 Nm) was in the range of 50.1–105.9%. The simulation results using the actual measurementload indicated that the strength of the PTO gear-train tended to decrease with higher transmissiongear stage and lower PTO gear stage except for the G2 and G3 gears. The simulation results of thesafety factor for contact stress were lower than the minimum safety factor of ‘1.0’ at the T2P1 gearstage (G4 and G2). The simulation results of the fatigue life analysis showed fatigue life of less thanservice life (1000 h) at T2P2 (G2) and T2P1 (G2, G3, and G4). The simulation results indicate thatthere is a possibility of gear failure before service life at the T2P1 (G2, G3, and G4) and T2P2 (G2).It is known that the weak parts (G2, G3, and G4) should be the focus of design optimization throughgear strength simulation to meet upward of a 1.0 safety factor and service life.
Keywords: cultivator; power take off (PTO) gear-train; rotary ditching; gear strength
1. Introduction
In Korea, 42.7% of farmers were female in 2010, with an expected increase to 47.1% by 2050. Onthe other hand, farmers aged 65 years and over accounted for 6.7% of the total in Korea in 2010, andthis percentage is expected to increase to 11.3% by 2050 in Korea [1]. With these demographic shifts,
Energies 2019, 12, 1100; doi:10.3390/en12061100 www.mdpi.com/journal/energies
Energies 2019, 12, 1100 2 of 14
compact, easy-to-use machines are in continual demand on the worldwide agricultural market toaccommodate female and elderly farmers. Multi-purpose cultivators are used in areas where farmingmechanization using conventional machines is difficult, such as small plots of land and greenhouses.The overseas market for cultivators was $7.57 billion dollars in 2013, and is expected to reach $15.15billion dollars in 2023 [2]. The agricultural market for cultivators is expected to steadily increase.Cultivators that operate using power take off (PTO) equipment are widely used for various fieldoperations such as rotary ditching, plowing, and vinyl mulching. Given the increasing demand forsuch cultivators, they have been the subject of recent active research.
Park [3] concluded that the handle vibration of a walking type cultivator could be reducedby adding mass to the handle. This was determined by investigating nodal points of the handlevibration by an operational deflection shapes test to optimize the handle vibration. Sam [4] conductedexperiments to measure vibration on walking and riding power tillers to assess the operator’s comfort.This paper addresses machine vibration, hand-transmitted vibration, and whole-body vibration duringrototilling under various conditions. Chaturvedi [5] conducted experiments in three operationalconditions, including transportation on farm roads, tilling with a cultivator, and tilling with a rotavator,in order to reduce the vibration of power tillers. The results show that the maximum vibrationreductions were achieved with the rubber intervention in all three operational conditions. There arevery few studies that have focused on the PTO gear-train of a cultivator. The PTO gear-train is used inmost agricultural operations and is easily damaged by soil and working conditions, pointing to a needfor design optimization. Additionally, load analysis for the major parts of the cultivator during fieldoperation is important for its optimal design and proper service life [6].
There is much research pertaining to the PTO gear-train for agricultural tractors. Lee [7] examinedthe PTO load severity on a tractor during rotary tillage and baler operations. When the ground speedof the tractor or the PTO rotational speed increased, the damage to the PTO increased. Consequently,the design of the PTO gears should take into account the various loading conditions during operation.Jung [8] investigated the possibility of optimizing the PTO gears according to their face width.The optimal design of PTO gears enhances quality and reduces material cost by improving durability,stability, and reliability during product development. Shim [9] developed an anti-backlash gear toreduce noise in the PTO gearbox for an agricultural tractor. A model was developed, and the systemperformance was computer-simulated. This study optimizes the design parameters of the anti-backlashgear for the best performance according to the given conditions.
Recently, analysis and design optimization of PTO gears have been performed using analysissoftware. This type of design optimization has seen particular use in the automobile industry andfor industrial and construction machinery. Demand for high load capacity, high speed, light weight,and safe products have increased as technology has advanced, and the accurate analysis of eachcomponent and design for reliability is critical [10]. Gear studies using analysis software havebeen performed to improve the quality and reliability of vehicle power transmission systems aswell as to reduce development time [11]. Lisle [12] compared the bending stress of external spurgears established by ISO 6336, AGMA 2101 standards and numerical finite element analysis withexperimental measurements. Wu [13] analyzed the transmission and load characteristics of a meshinghelical gear pair with twist-free teeth using analysis software. When the proposed gear honingmethodologies were applied to an external gear, an improvement in contact temperature and powerloss was observed. Analysis software has been used for gear optimization in various fields, althoughthere are very few studies that have applied analysis software to agricultural topics.
The goal of this study is to provide guidelines for the optimal design of the PTO gear-train,considering the measured work load on a cultivator during a rotary ditching operation. Specifically,this study (1) constructs a torque measurement system for a cultivator; (2) acquires the PTO torqueduring a rotary ditching that was mostly used in cultivator operation; and (3) analyzes the strength ofthe PTO gear-train using analysis software.
Energies 2019, 12, 1100 3 of 14
2. Materials and Methods
2.1. Multi-Purpose Cultivator
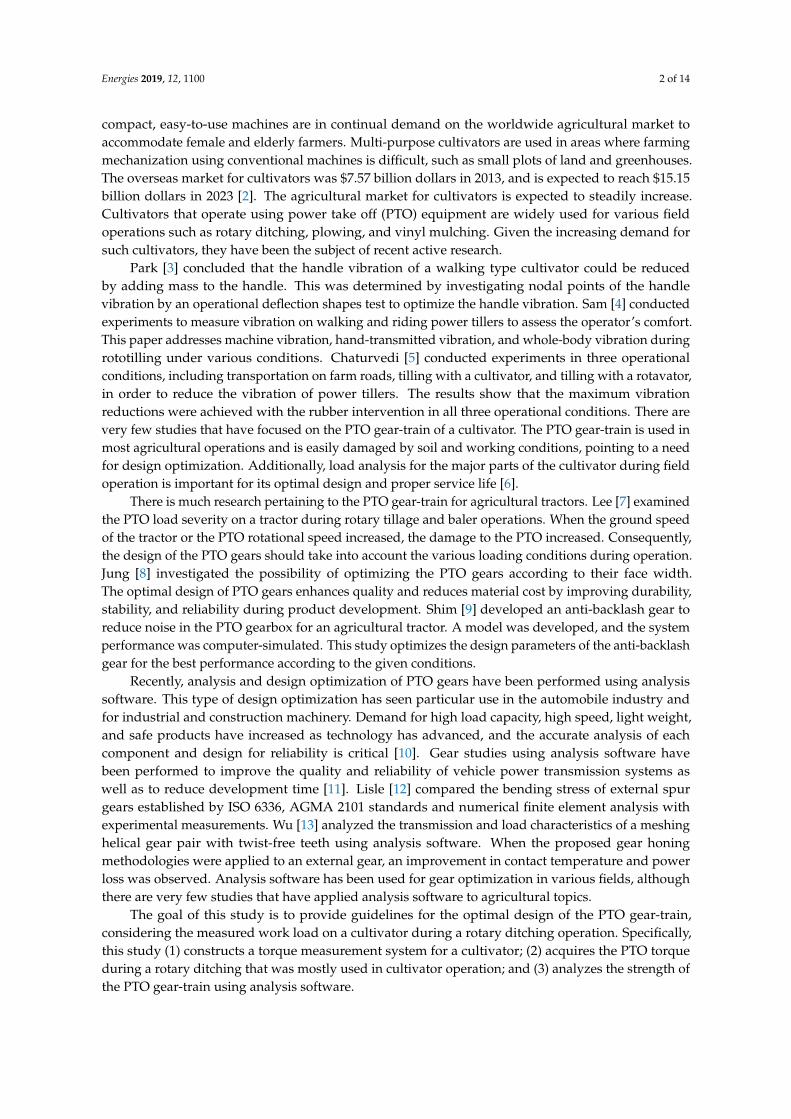
Multi-purpose cultivators (ASC-640, ASIAtech, Daegu, Korea) are generally used as a powersource for various operations in the field and in greenhouse farming. The cultivator has a total mass of93 kg (including the ditching rotor) and overall dimensions of 1530 × 610 × 960 mm (length × width ×height). The rated output and the rated torque of the engine of the cultivator were 3.9 kW and 20.7 Nm,respectively, at an engine revolution speed of 1800 rpm. The power transmission efficiency of the beltpulley power transmission system used in this study was generally 95% [14]. Therefore, the rated outputand rated torque of the PTO input shaft are 3.7 kW and 19.6 Nm, respectively, considering the powertransmission efficiency of the belt pulley. The cultivator was equipped with a manual transmissionand a PTO gearbox. The ground speeds of the cultivator at T1, T2, and T3 were 1.3, 1.8, and 4.0 km/h,respectively, and the PTO rotational speeds at P1 and P2 were 335 and 709 rpm, respectively. Figure 1shows the power flow of the cultivator used in the study. The power from the engine is divided betweenthe transmission and the PTO through the belt pulley. The transmission drives two wheels, and the PTOperforms various operations such as rotary ditching, ridging, soil covering, ridge plowing, cultivation,and so on.
Energies 2019, 12, x FOR PEER REVIEW 3 of 14
2. Materials and Methods
2.1. Multi-Purpose Cultivator
Multi-purpose cultivators (ASC-640, ASIAtech, Daegu, Korea) are generally used as a power source for various operations in the field and in greenhouse farming. The cultivator has a total mass of 93 kg (including the ditching rotor) and overall dimensions of 1530 × 610 × 960 mm (length × width × height). The rated output and the rated torque of the engine of the cultivator were 3.9 kW and 20.7 Nm, respectively, at an engine revolution speed of 1800 rpm. The power transmission efficiency of the belt pulley power transmission system used in this study was generally 95% [14]. Therefore, the rated output and rated torque of the PTO input shaft are 3.7 kW and 19.6 Nm, respectively, considering the power transmission efficiency of the belt pulley. The cultivator was equipped with a manual transmission and a PTO gearbox. The ground speeds of the cultivator at T1, T2, and T3 were 1.3, 1.8, and 4.0 km/h, respectively, and the PTO rotational speeds at P1 and P2 were 335 and 709 rpm, respectively. Figure 1 shows the power flow of the cultivator used in the study. The power from the engine is divided between the transmission and the PTO through the belt pulley. The transmission drives two wheels, and the PTO performs various operations such as rotary ditching, ridging, soil covering, ridge plowing, cultivation, and so on.
Figure 1. Schematic diagram of the power flow for the cultivator. PTO = power take off.
2.2. Torque Measurement
2.2.1. Torque Measurement System
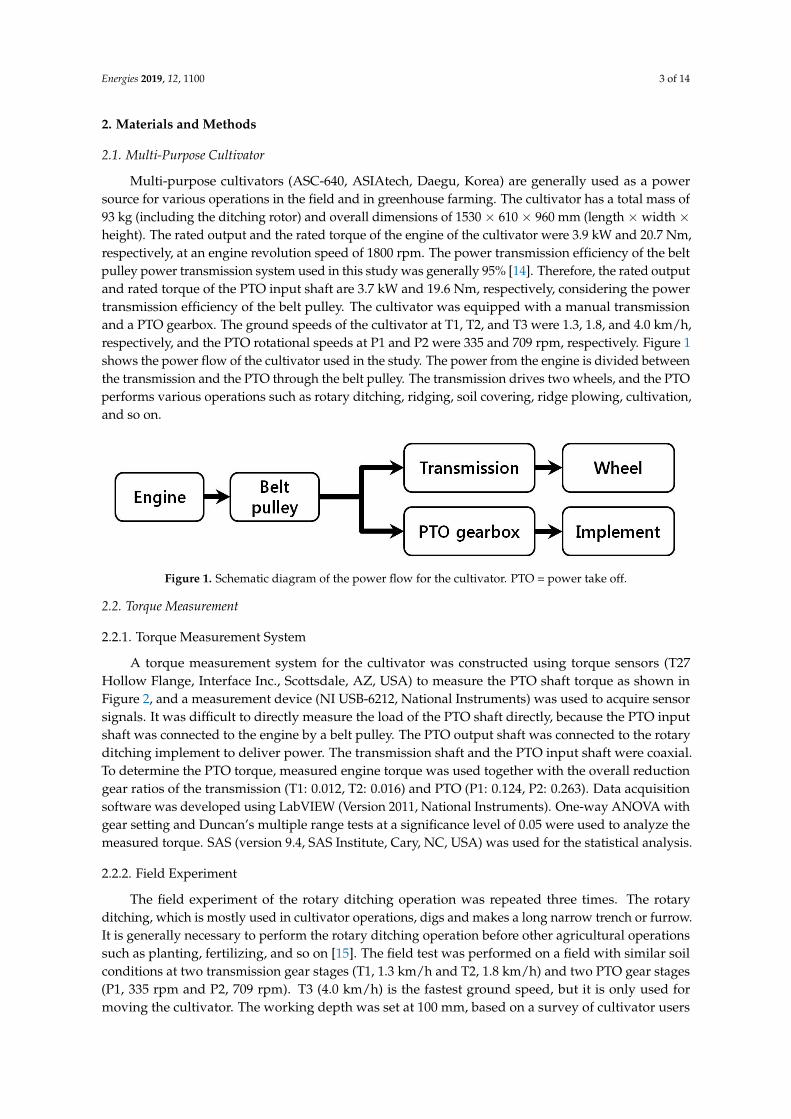
A torque measurement system for the cultivator was constructed using torque sensors (T27 Hollow Flange, Interface Inc., Scottsdale, AZ, USA) to measure the PTO shaft torque as shown in Figure 2, and a measurement device (NI USB-6212, National Instruments) was used to acquire sensor signals. It was difficult to directly measure the load of the PTO shaft directly, because the PTO input shaft was connected to the engine by a belt pulley. The PTO output shaft was connected to the rotary ditching implement to deliver power. The transmission shaft and the PTO input shaft were coaxial. To determine the PTO torque, measured engine torque was used together with the overall reduction gear ratios of the transmission (T1: 0.012, T2: 0.016) and PTO (P1: 0.124, P2: 0.263). Data acquisition software was developed using LabVIEW (Version 2011, National Instruments). One-way ANOVA with gear setting and Duncan’s multiple range tests at a significance level of 0.05 were used to analyze the measured torque. SAS (version 9.4, SAS Institute, Cary, NC, USA) was used for the statistical analysis.
Figure 1. Schematic diagram of the power flow for the cultivator. PTO = power take off.
2.2. Torque Measurement
2.2.1. Torque Measurement System
A torque measurement system for the cultivator was constructed using torque sensors (T27Hollow Flange, Interface Inc., Scottsdale, AZ, USA) to measure the PTO shaft torque as shown inFigure 2, and a measurement device (NI USB-6212, National Instruments) was used to acquire sensorsignals. It was difficult to directly measure the load of the PTO shaft directly, because the PTO inputshaft was connected to the engine by a belt pulley. The PTO output shaft was connected to the rotaryditching implement to deliver power. The transmission shaft and the PTO input shaft were coaxial.To determine the PTO torque, measured engine torque was used together with the overall reductiongear ratios of the transmission (T1: 0.012, T2: 0.016) and PTO (P1: 0.124, P2: 0.263). Data acquisitionsoftware was developed using LabVIEW (Version 2011, National Instruments). One-way ANOVA withgear setting and Duncan’s multiple range tests at a significance level of 0.05 were used to analyze themeasured torque. SAS (version 9.4, SAS Institute, Cary, NC, USA) was used for the statistical analysis.
2.2.2. Field Experiment
The field experiment of the rotary ditching operation was repeated three times. The rotaryditching, which is mostly used in cultivator operations, digs and makes a long narrow trench or furrow.It is generally necessary to perform the rotary ditching operation before other agricultural operationssuch as planting, fertilizing, and so on [15]. The field test was performed on a field with similar soilconditions at two transmission gear stages (T1, 1.3 km/h and T2, 1.8 km/h) and two PTO gear stages(P1, 335 rpm and P2, 709 rpm). T3 (4.0 km/h) is the fastest ground speed, but it is only used formoving the cultivator. The working depth was set at 100 mm, based on a survey of cultivator users
Energies 2019, 12, 1100 4 of 14
in Korea. The field experiment was conducted at a field in Dori 751, Gajo-myeon, Geochang-gun,Gyeongsangnam-do. The cone index (CI), depth, shear force, moisture content, electric conductivity(EC), and temperature were analyzed following the USDA (United States Department of Agriculture)standard for field sites (ASABE 2011a; ASABE 2011b). Environmental conditions of the field showedan average moisture content of 30.4%, an average EC of 1.75 dS/m, an average temperature of 28.9 ◦C,an average CI of 2605 kPa, an average soil shear force of 18.5 Nm, and an average depth of 12 cm.Energies 2019, 12, x FOR PEER REVIEW 4 of 14
Figure 2. Torque measurement system for the cultivator.
2.2.2. Field Experiment
The field experiment of the rotary ditching operation was repeated three times. The rotary ditching, which is mostly used in cultivator operations, digs and makes a long narrow trench or furrow. It is generally necessary to perform the rotary ditching operation before other agricultural operations such as planting, fertilizing, and so on [15]. The field test was performed on a field with similar soil conditions at two transmission gear stages (T1, 1.3 km/h and T2, 1.8 km/h) and two PTO gear stages (P1, 335 rpm and P2, 709 rpm). T3 (4.0 km/h) is the fastest ground speed, but it is only used for moving the cultivator. The working depth was set at 100 mm, based on a survey of cultivator users in Korea. The field experiment was conducted at a field in Dori 751, Gajo-myeon, Geochang-gun, Gyeongsangnam-do. The cone index (CI), depth, shear force, moisture content, electric conductivity (EC), and temperature were analyzed following the USDA (United States Department of Agriculture) standard for field sites (ASABE 2011a; ASABE 2011b). Environmental conditions of the field showed an average moisture content of 30.4%, an average EC of 1.75 dS/m, an average temperature of 28.9 °C, an average CI of 2605 kPa, an average soil shear force of 18.5 Nm, and an average depth of 12 cm.
2.3. Simulation of the PTO Gear-Train
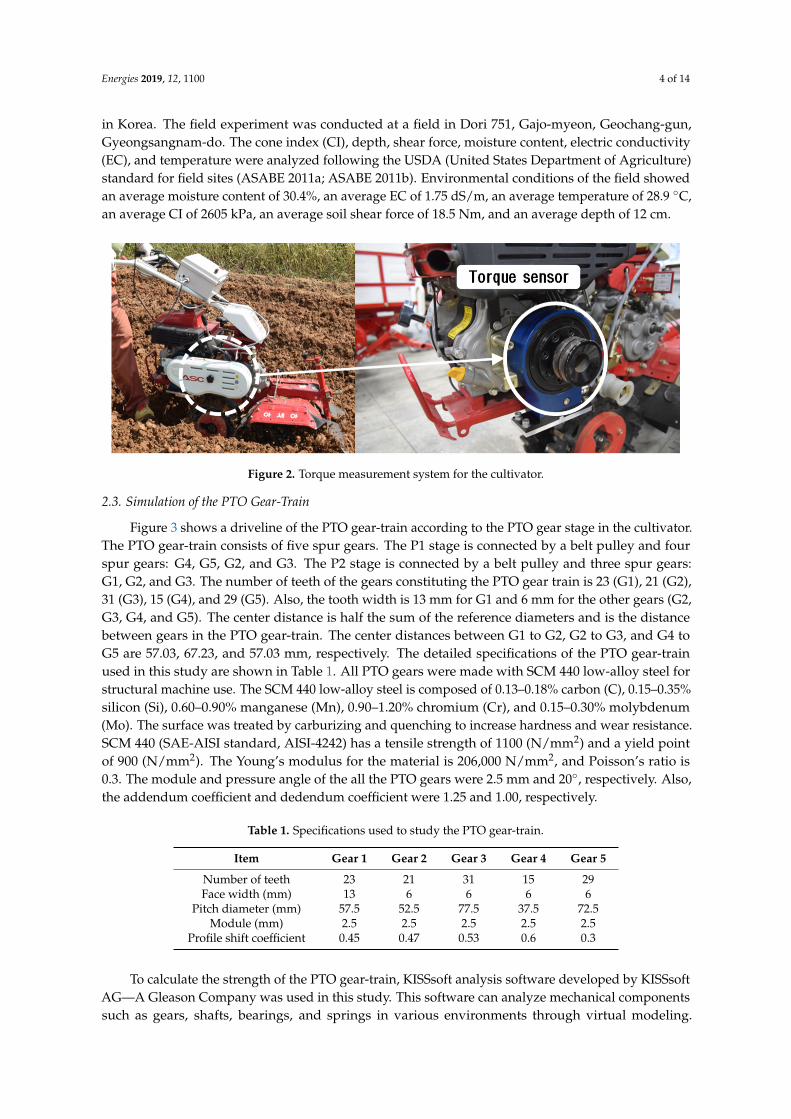
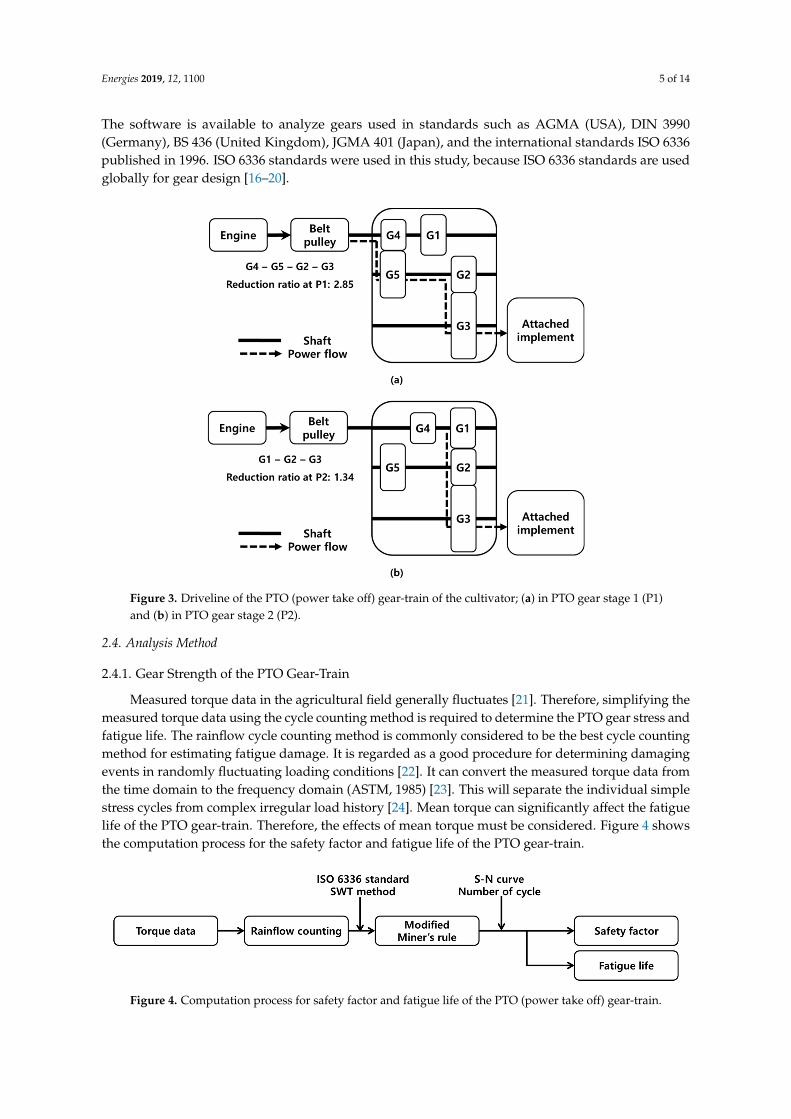
Figure 3 shows a driveline of the PTO gear-train according to the PTO gear stage in the cultivator. The PTO gear-train consists of five spur gears. The P1 stage is connected by a belt pulley and four spur gears: G4, G5, G2, and G3. The P2 stage is connected by a belt pulley and three spur gears: G1, G2, and G3. The number of teeth of the gears constituting the PTO gear train is 23 (G1), 21 (G2), 31 (G3), 15 (G4), and 29 (G5). Also, the tooth width is 13 mm for G1 and 6 mm for the other gears (G2, G3, G4, and G5). The center distance is half the sum of the reference diameters and is the distance between gears in the PTO gear-train. The center distances between G1 to G2, G2 to G3, and G4 to G5 are 57.03, 67.23, and 57.03 mm, respectively. The detailed specifications of the PTO gear-train used in this study are shown in Table 1. All PTO gears were made with SCM 440 low-alloy steel for structural machine use. The SCM 440 low-alloy steel is composed of 0.13–0.18% carbon (C), 0.15–0.35% silicon (Si), 0.60–0.90% manganese (Mn), 0.90–1.20% chromium (Cr), and 0.15–0.30% molybdenum (Mo). The surface was treated by carburizing and quenching to increase hardness and wear resistance. SCM 440 (SAE-AISI standard, AISI-4242) has a tensile strength of 1100 (N/mm2) and a yield point of 900 (N/mm2). The Young’s modulus for the material is 206,000 N/mm2, and Poisson’s ratio is 0.3. The module and pressure angle of the all the PTO gears were 2.5 mm and 20°, respectively. Also, the addendum coefficient and dedendum coefficient were 1.25 and 1.00, respectively.
Figure 2. Torque measurement system for the cultivator.
2.3. Simulation of the PTO Gear-Train
Figure 3 shows a driveline of the PTO gear-train according to the PTO gear stage in the cultivator.The PTO gear-train consists of five spur gears. The P1 stage is connected by a belt pulley and fourspur gears: G4, G5, G2, and G3. The P2 stage is connected by a belt pulley and three spur gears:G1, G2, and G3. The number of teeth of the gears constituting the PTO gear train is 23 (G1), 21 (G2),31 (G3), 15 (G4), and 29 (G5). Also, the tooth width is 13 mm for G1 and 6 mm for the other gears (G2,G3, G4, and G5). The center distance is half the sum of the reference diameters and is the distancebetween gears in the PTO gear-train. The center distances between G1 to G2, G2 to G3, and G4 toG5 are 57.03, 67.23, and 57.03 mm, respectively. The detailed specifications of the PTO gear-trainused in this study are shown in Table 1. All PTO gears were made with SCM 440 low-alloy steel forstructural machine use. The SCM 440 low-alloy steel is composed of 0.13–0.18% carbon (C), 0.15–0.35%silicon (Si), 0.60–0.90% manganese (Mn), 0.90–1.20% chromium (Cr), and 0.15–0.30% molybdenum(Mo). The surface was treated by carburizing and quenching to increase hardness and wear resistance.SCM 440 (SAE-AISI standard, AISI-4242) has a tensile strength of 1100 (N/mm2) and a yield pointof 900 (N/mm2). The Young’s modulus for the material is 206,000 N/mm2, and Poisson’s ratio is0.3. The module and pressure angle of the all the PTO gears were 2.5 mm and 20◦, respectively. Also,the addendum coefficient and dedendum coefficient were 1.25 and 1.00, respectively.
Table 1. Specifications used to study the PTO gear-train.
Item Gear 1 Gear 2 Gear 3 Gear 4 Gear 5
Number of teeth 23 21 31 15 29Face width (mm) 13 6 6 6 6
Pitch diameter (mm) 57.5 52.5 77.5 37.5 72.5Module (mm) 2.5 2.5 2.5 2.5 2.5
Profile shift coefficient 0.45 0.47 0.53 0.6 0.3
To calculate the strength of the PTO gear-train, KISSsoft analysis software developed by KISSsoftAG—A Gleason Company was used in this study. This software can analyze mechanical componentssuch as gears, shafts, bearings, and springs in various environments through virtual modeling.
Energies 2019, 12, 1100 5 of 14
The software is available to analyze gears used in standards such as AGMA (USA), DIN 3990(Germany), BS 436 (United Kingdom), JGMA 401 (Japan), and the international standards ISO 6336published in 1996. ISO 6336 standards were used in this study, because ISO 6336 standards are usedglobally for gear design [16–20].Energies 2019, 12, x FOR PEER REVIEW 5 of 14
Figure 3. Driveline of the PTO (power take off) gear-train of the cultivator; (a) in PTO gear stage 1 (P1) and (b) in PTO gear stage 2 (P2).
Table 1. Specifications used to study the PTO gear-train.
Item Gear 1 Gear 2 Gear 3 Gear 4 Gear 5 Number of teeth 23 21 31 15 29 Face width (mm) 13 6 6 6 6
Pitch diameter (mm) 57.5 52.5 77.5 37.5 72.5 Module (mm) 2.5 2.5 2.5 2.5 2.5
Profile shift coefficient 0.45 0.47 0.53 0.6 0.3
To calculate the strength of the PTO gear-train, KISSsoft analysis software developed by KISSsoft AG – A Gleason Company was used in this study. This software can analyze mechanical components such as gears, shafts, bearings, and springs in various environments through virtual modeling. The software is available to analyze gears used in standards such as AGMA (USA), DIN 3990 (Germany), BS 436 (United Kingdom), JGMA 401 (Japan), and the international standards ISO 6336 published in 1996. ISO 6336 standards were used in this study, because ISO 6336 standards are used globally for gear design [16–20].
2.4. Analysis Method
2.4.1. Gear Strength of the PTO Gear-Train
Measured torque data in the agricultural field generally fluctuates [21]. Therefore, simplifying the measured torque data using the cycle counting method is required to determine the PTO gear stress and fatigue life. The rainflow cycle counting method is commonly considered to be the best cycle counting method for estimating fatigue damage. It is regarded as a good procedure for determining damaging events in randomly fluctuating loading conditions [22]. It can convert the measured torque data from the time domain to the frequency domain (ASTM, 1985) [23]. This will separate the individual simple stress cycles from complex irregular load history [24]. Mean torque can significantly affect the fatigue life of the PTO gear-train. Therefore, the effects of mean torque
Figure 3. Driveline of the PTO (power take off) gear-train of the cultivator; (a) in PTO gear stage 1 (P1)and (b) in PTO gear stage 2 (P2).
2.4. Analysis Method
2.4.1. Gear Strength of the PTO Gear-Train
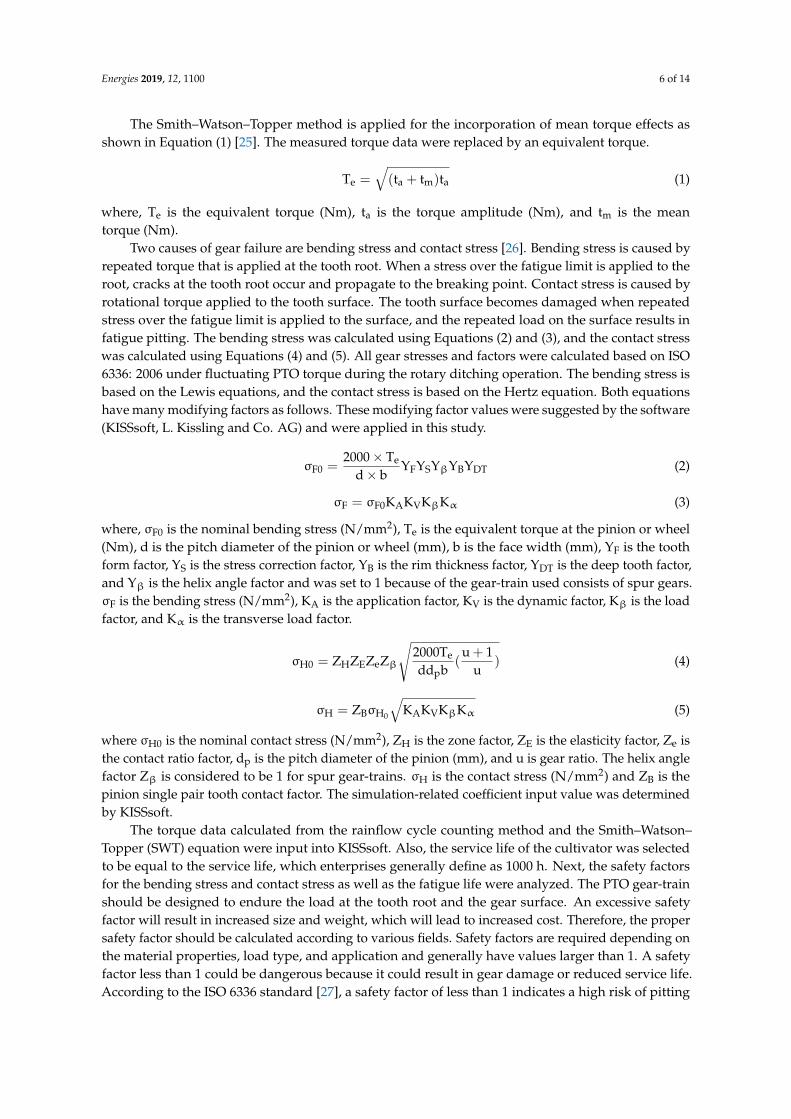
Measured torque data in the agricultural field generally fluctuates [21]. Therefore, simplifying themeasured torque data using the cycle counting method is required to determine the PTO gear stress andfatigue life. The rainflow cycle counting method is commonly considered to be the best cycle countingmethod for estimating fatigue damage. It is regarded as a good procedure for determining damagingevents in randomly fluctuating loading conditions [22]. It can convert the measured torque data fromthe time domain to the frequency domain (ASTM, 1985) [23]. This will separate the individual simplestress cycles from complex irregular load history [24]. Mean torque can significantly affect the fatiguelife of the PTO gear-train. Therefore, the effects of mean torque must be considered. Figure 4 showsthe computation process for the safety factor and fatigue life of the PTO gear-train.
Energies 2019, 12, x FOR PEER REVIEW 6 of 14
must be considered. Figure 4 shows the computation process for the safety factor and fatigue life of the PTO gear-train.
Figure 4. Computation process for safety factor and fatigue life of the PTO (power take off) gear-train.
The Smith–Watson–Topper method is applied for the incorporation of mean torque effects as shown in Equation (1) [25]. The measured torque data were replaced by an equivalent torque. T = t t t (1)
where, T is the equivalent torque (Nm), t is the torque amplitude (Nm), and t is the mean torque (Nm).
Two causes of gear failure are bending stress and contact stress [26]. Bending stress is caused by repeated torque that is applied at the tooth root. When a stress over the fatigue limit is applied to the root, cracks at the tooth root occur and propagate to the breaking point. Contact stress is caused by rotational torque applied to the tooth surface. The tooth surface becomes damaged when repeated stress over the fatigue limit is applied to the surface, and the repeated load on the surface results in fatigue pitting. The bending stress was calculated using Equations (2) and (3), and the contact stress was calculated using Equations (4) and (5). All gear stresses and factors were calculated based on ISO 6336: 2006 under fluctuating PTO torque during the rotary ditching operation. The bending stress is based on the Lewis equations, and the contact stress is based on the Hertz equation. Both equations have many modifying factors as follows. These modifying factor values were suggested by the software (KISSsoft, L. Kissling and Co. AG) and were applied in this study. σ = Y Y Y Y Y (2)σ = σ K K K K (3)
where, σ is the nominal bending stress (N/mm2), T is the equivalent torque at the pinion or wheel (Nm), d is the pitch diameter of the pinion or wheel (mm), b is the face width (mm), Y is the tooth form factor, Y is the stress correction factor, Y is the rim thickness factor, Y is the deep tooth factor, and Y is the helix angle factor and was set to 1 because of the gear-train used consists of spur gears. σ is the bending stress (N/mm2), K is the application factor, K is the dynamic factor, K is the load factor, and K is the transverse load factor.
σ = Z Z Z Z 2000Tdd b u 1u (4)
σ = Z σ K K K K (5)
where σ is the nominal contact stress (N/mm2), Z is the zone factor, Z is the elasticity factor, Z is the contact ratio factor, d is the pitch diameter of the pinion (mm), and u is gear ratio. The helix angle factor Z is considered to be 1 for spur gear-trains. σ is the contact stress (N/mm2) and Z is the pinion single pair tooth contact factor. The simulation-related coefficient input value was determined by KISSsoft.
The torque data calculated from the rainflow cycle counting method and the Smith–Watson–Topper (SWT) equation were input into KISSsoft. Also, the service life of the cultivator was selected to be equal to the service life, which enterprises generally define as 1000 h. Next, the safety factors for
Figure 4. Computation process for safety factor and fatigue life of the PTO (power take off) gear-train.
Energies 2019, 12, 1100 6 of 14
The Smith–Watson–Topper method is applied for the incorporation of mean torque effects asshown in Equation (1) [25]. The measured torque data were replaced by an equivalent torque.
Te =√(ta + tm)ta (1)
where, Te is the equivalent torque (Nm), ta is the torque amplitude (Nm), and tm is the meantorque (Nm).
Two causes of gear failure are bending stress and contact stress [26]. Bending stress is caused byrepeated torque that is applied at the tooth root. When a stress over the fatigue limit is applied to theroot, cracks at the tooth root occur and propagate to the breaking point. Contact stress is caused byrotational torque applied to the tooth surface. The tooth surface becomes damaged when repeatedstress over the fatigue limit is applied to the surface, and the repeated load on the surface results infatigue pitting. The bending stress was calculated using Equations (2) and (3), and the contact stresswas calculated using Equations (4) and (5). All gear stresses and factors were calculated based on ISO6336: 2006 under fluctuating PTO torque during the rotary ditching operation. The bending stress isbased on the Lewis equations, and the contact stress is based on the Hertz equation. Both equationshave many modifying factors as follows. These modifying factor values were suggested by the software(KISSsoft, L. Kissling and Co. AG) and were applied in this study.
σF0 =2000 × Te
d × bYFYSYβYBYDT (2)
σF = σF0KAKVKβKα (3)
where, σF0 is the nominal bending stress (N/mm2), Te is the equivalent torque at the pinion or wheel(Nm), d is the pitch diameter of the pinion or wheel (mm), b is the face width (mm), YF is the toothform factor, YS is the stress correction factor, YB is the rim thickness factor, YDT is the deep tooth factor,and Yβ is the helix angle factor and was set to 1 because of the gear-train used consists of spur gears.σF is the bending stress (N/mm2), KA is the application factor, KV is the dynamic factor, Kβ is the loadfactor, and Kα is the transverse load factor.
σH0 = ZHZEZeZβ
√2000Te
ddpb(
u + 1u
) (4)
σH = ZBσH0
√KAKVKβKα (5)
where σH0 is the nominal contact stress (N/mm2), ZH is the zone factor, ZE is the elasticity factor, Ze isthe contact ratio factor, dp is the pitch diameter of the pinion (mm), and u is gear ratio. The helix anglefactor Zβ is considered to be 1 for spur gear-trains. σH is the contact stress (N/mm2) and ZB is thepinion single pair tooth contact factor. The simulation-related coefficient input value was determinedby KISSsoft.
The torque data calculated from the rainflow cycle counting method and the Smith–Watson–Topper (SWT) equation were input into KISSsoft. Also, the service life of the cultivator was selectedto be equal to the service life, which enterprises generally define as 1000 h. Next, the safety factorsfor the bending stress and contact stress as well as the fatigue life were analyzed. The PTO gear-trainshould be designed to endure the load at the tooth root and the gear surface. An excessive safetyfactor will result in increased size and weight, which will lead to increased cost. Therefore, the propersafety factor should be calculated according to various fields. Safety factors are required depending onthe material properties, load type, and application and generally have values larger than 1. A safetyfactor less than 1 could be dangerous because it could result in gear damage or reduced service life.According to the ISO 6336 standard [27], a safety factor of less than 1 indicates a high risk of pitting
Energies 2019, 12, 1100 7 of 14
failure. The safety factor for bending stress was calculated using Equation (6). The safety factor forstress at a single tooth point of contact was calculated using Equation (7).
SF = σFG/σF (6)
SH = σHG/σH (7)
where SF is the safety factor for bending stress, σFG is the tooth root stress limit (N/mm2), σF is thebending stress (N/mm2), SH is the safety factor for contact stress, σHG is the tooth flank stress limit(N/mm2), and σH is the contact stress (N/mm2).
2.4.2. Fatigue Life of the PTO Gear-Train
The modified Miner’s rule [28] with S–N curves of SCM440 and ISO 6336 standards were used topredict the damage sum using Equation (8). The equations of the S–N curves of the PTO gears wereEquations (9) and (10) from KISSsoft. The modified Miner’s rule is probably the simplest cumulativedamage model, and it includes a procedure for estimating the fatigue life since the fatigue occurs inthe number of cycles to failure when the damage sum obtained using the modified Miner’s rule is‘1’. The number of cycles (n) is determined by an equivalent stress of the load data. The fatigue lifecycle (N) is derived from the S–N curve of the PTO gear-train’s material. Then, the damage sum (D)aggregates the calculated 32 stress classes [29]. It can be thought of as assessing the proportion of lifeconsumed at each stress level and then adding the proportions for all the levels together. In general,when the damage fraction reaches 1, failure occurs. The service life of each gear stage is assumed to be1000 h, which is the manufacturer’s warranty time, because it is very difficult to accurately analyze theusage ratio of each gear stage (T1, T2, P1, P2).
Dtotal =k
∑i=1
ni
Ni(8)
where, Dtotal is the damage sum, ni is the number of cycles at the ith stress class, and Ni is the fatiguelife at the ith stress class.
σP = 2417.9 N−0.068i (9)
σP = 2858.8 N−0.032i (10)
where Equation (9) is the S–N curve Equation of SCM440 at the PTO gear root, Equation (10) is theS–N curve equation of SCM440 at the PTO gear flank, σP is the stress (N/mm2), and Ni is the fatiguelife at the ith stress class.
3. Results
3.1. Statistical Analysis
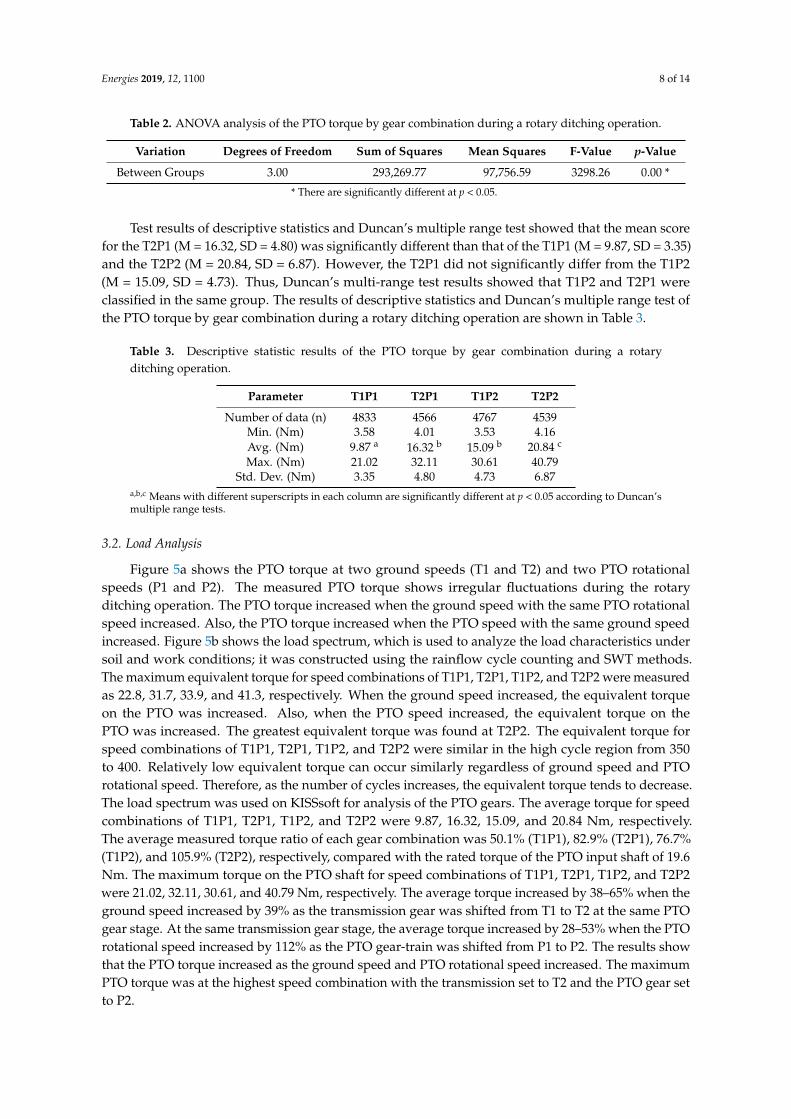
Analysis of variance (ANOVA) using statistical software SAS (version 9.4, SAS Institute, Cary,NC, USA) was conducted to compare and analyze the influence of each gear combination of thetransmission and the PTO gear stages on the load of the PTO gear-train. In general, the measurementdata in the field of agriculture, which is mainly concerned with the interaction with soil, tend to havenon-normality. Therefore, the statistical analysis of the measurement data in this study was performedafter assuming a normal distribution of the data using the Central Limit Theorem, which says thattreatment means have an approximate normal distribution if the number of measured data is largeenough [30,31]. There was a significant effect of gear combinations of transmission and PTO gearstages on torque of the PTO gear-train; F(3) = 3298.26, p = 0.0001. The results of the ANOVA analysisof the PTO torque by gear combination during the rotary ditching operation are shown in Table 2.
Energies 2019, 12, 1100 8 of 14
Table 2. ANOVA analysis of the PTO torque by gear combination during a rotary ditching operation.
Variation Degrees of Freedom Sum of Squares Mean Squares F-Value p-Value
Between Groups 3.00 293,269.77 97,756.59 3298.26 0.00 *
* There are significantly different at p < 0.05.
Test results of descriptive statistics and Duncan’s multiple range test showed that the mean scorefor the T2P1 (M = 16.32, SD = 4.80) was significantly different than that of the T1P1 (M = 9.87, SD = 3.35)and the T2P2 (M = 20.84, SD = 6.87). However, the T2P1 did not significantly differ from the T1P2(M = 15.09, SD = 4.73). Thus, Duncan’s multi-range test results showed that T1P2 and T2P1 wereclassified in the same group. The results of descriptive statistics and Duncan’s multiple range test ofthe PTO torque by gear combination during a rotary ditching operation are shown in Table 3.
Table 3. Descriptive statistic results of the PTO torque by gear combination during a rotaryditching operation.
Parameter T1P1 T2P1 T1P2 T2P2
Number of data (n) 4833 4566 4767 4539Min. (Nm) 3.58 4.01 3.53 4.16Avg. (Nm) 9.87 a 16.32 b 15.09 b 20.84 c
Max. (Nm) 21.02 32.11 30.61 40.79Std. Dev. (Nm) 3.35 4.80 4.73 6.87
a,b,c Means with different superscripts in each column are significantly different at p < 0.05 according to Duncan’smultiple range tests.
3.2. Load Analysis
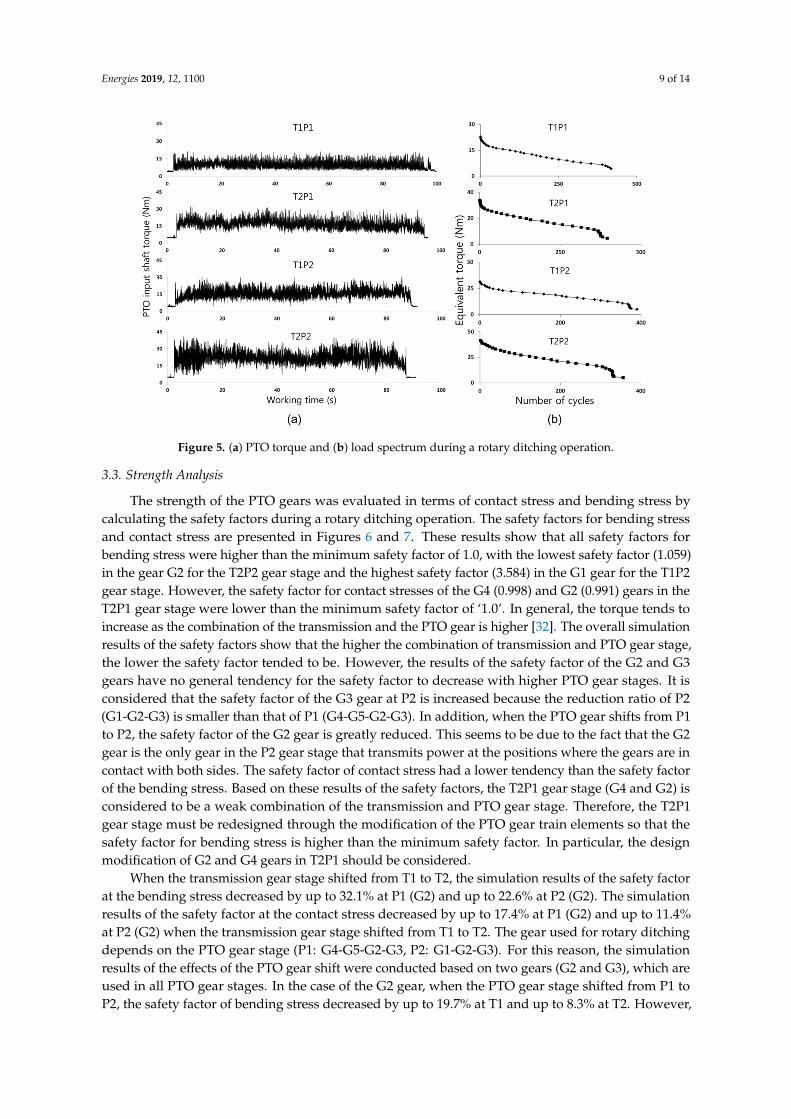
Figure 5a shows the PTO torque at two ground speeds (T1 and T2) and two PTO rotationalspeeds (P1 and P2). The measured PTO torque shows irregular fluctuations during the rotaryditching operation. The PTO torque increased when the ground speed with the same PTO rotationalspeed increased. Also, the PTO torque increased when the PTO speed with the same ground speedincreased. Figure 5b shows the load spectrum, which is used to analyze the load characteristics undersoil and work conditions; it was constructed using the rainflow cycle counting and SWT methods.The maximum equivalent torque for speed combinations of T1P1, T2P1, T1P2, and T2P2 were measuredas 22.8, 31.7, 33.9, and 41.3, respectively. When the ground speed increased, the equivalent torqueon the PTO was increased. Also, when the PTO speed increased, the equivalent torque on thePTO was increased. The greatest equivalent torque was found at T2P2. The equivalent torque forspeed combinations of T1P1, T2P1, T1P2, and T2P2 were similar in the high cycle region from 350to 400. Relatively low equivalent torque can occur similarly regardless of ground speed and PTOrotational speed. Therefore, as the number of cycles increases, the equivalent torque tends to decrease.The load spectrum was used on KISSsoft for analysis of the PTO gears. The average torque for speedcombinations of T1P1, T2P1, T1P2, and T2P2 were 9.87, 16.32, 15.09, and 20.84 Nm, respectively.The average measured torque ratio of each gear combination was 50.1% (T1P1), 82.9% (T2P1), 76.7%(T1P2), and 105.9% (T2P2), respectively, compared with the rated torque of the PTO input shaft of 19.6Nm. The maximum torque on the PTO shaft for speed combinations of T1P1, T2P1, T1P2, and T2P2were 21.02, 32.11, 30.61, and 40.79 Nm, respectively. The average torque increased by 38–65% when theground speed increased by 39% as the transmission gear was shifted from T1 to T2 at the same PTOgear stage. At the same transmission gear stage, the average torque increased by 28–53% when the PTOrotational speed increased by 112% as the PTO gear-train was shifted from P1 to P2. The results showthat the PTO torque increased as the ground speed and PTO rotational speed increased. The maximumPTO torque was at the highest speed combination with the transmission set to T2 and the PTO gear setto P2.
Energies 2019, 12, 1100 9 of 14
Energies 2019, 12, x FOR PEER REVIEW 9 of 14
53% when the PTO rotational speed increased by 112% as the PTO gear-train was shifted from P1 to P2. The results show that the PTO torque increased as the ground speed and PTO rotational speed increased. The maximum PTO torque was at the highest speed combination with the transmission set to T2 and the PTO gear set to P2.
Figure 5. (a) PTO torque and (b) load spectrum during a rotary ditching operation.
3.3. Strength Analysis
The strength of the PTO gears was evaluated in terms of contact stress and bending stress by calculating the safety factors during a rotary ditching operation. The safety factors for bending stress and contact stress are presented in Figures 6 and 7. These results show that all safety factors for bending stress were higher than the minimum safety factor of 1.0, with the lowest safety factor (1.059) in the gear G2 for the T2P2 gear stage and the highest safety factor (3.584) in the G1 gear for the T1P2 gear stage. However, the safety factor for contact stresses of the G4 (0.998) and G2 (0.991) gears in the T2P1 gear stage were lower than the minimum safety factor of ‘1.0’. In general, the torque tends to increase as the combination of the transmission and the PTO gear is higher [32]. The overall simulation results of the safety factors show that the higher the combination of transmission and PTO gear stage, the lower the safety factor tended to be. However, the results of the safety factor of the G2 and G3 gears have no general tendency for the safety factor to decrease with higher PTO gear stages. It is considered that the safety factor of the G3 gear at P2 is increased because the reduction ratio of P2 (G1-G2-G3) is smaller than that of P1 (G4-G5-G2-G3). In addition, when the PTO gear shifts from P1 to P2, the safety factor of the G2 gear is greatly reduced. This seems to be due to the fact that the G2 gear is the only gear in the P2 gear stage that transmits power at the positions where the gears are in contact with both sides. The safety factor of contact stress had a lower tendency than the safety factor of the bending stress. Based on these results of the safety factors, the T2P1 gear stage (G4 and G2) is considered to be a weak combination of the transmission and PTO gear stage. Therefore, the T2P1 gear stage must be redesigned through the modification of the PTO gear train elements so that the safety factor for bending stress is higher than the minimum safety factor. In particular, the design modification of G2 and G4 gears in T2P1 should be considered.
When the transmission gear stage shifted from T1 to T2, the simulation results of the safety factor at the bending stress decreased by up to 32.1% at P1 (G2) and up to 22.6% at P2 (G2). The simulation results of the safety factor at the contact stress decreased by up to 17.4% at P1 (G2) and up to 11.4% at P2 (G2) when the transmission gear stage shifted from T1 to T2. The gear used for rotary ditching depends on the PTO gear stage (P1: G4-G5-G2-G3, P2: G1-G2-G3). For this reason, the simulation
Figure 5. (a) PTO torque and (b) load spectrum during a rotary ditching operation.
3.3. Strength Analysis
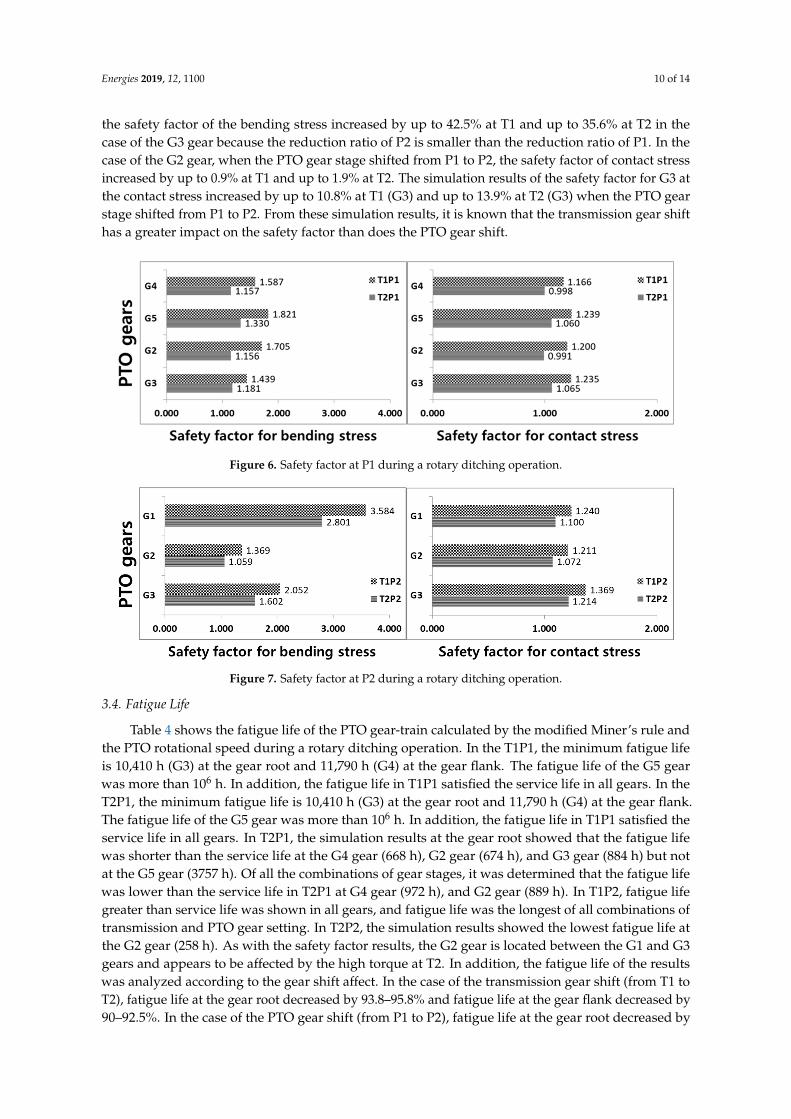
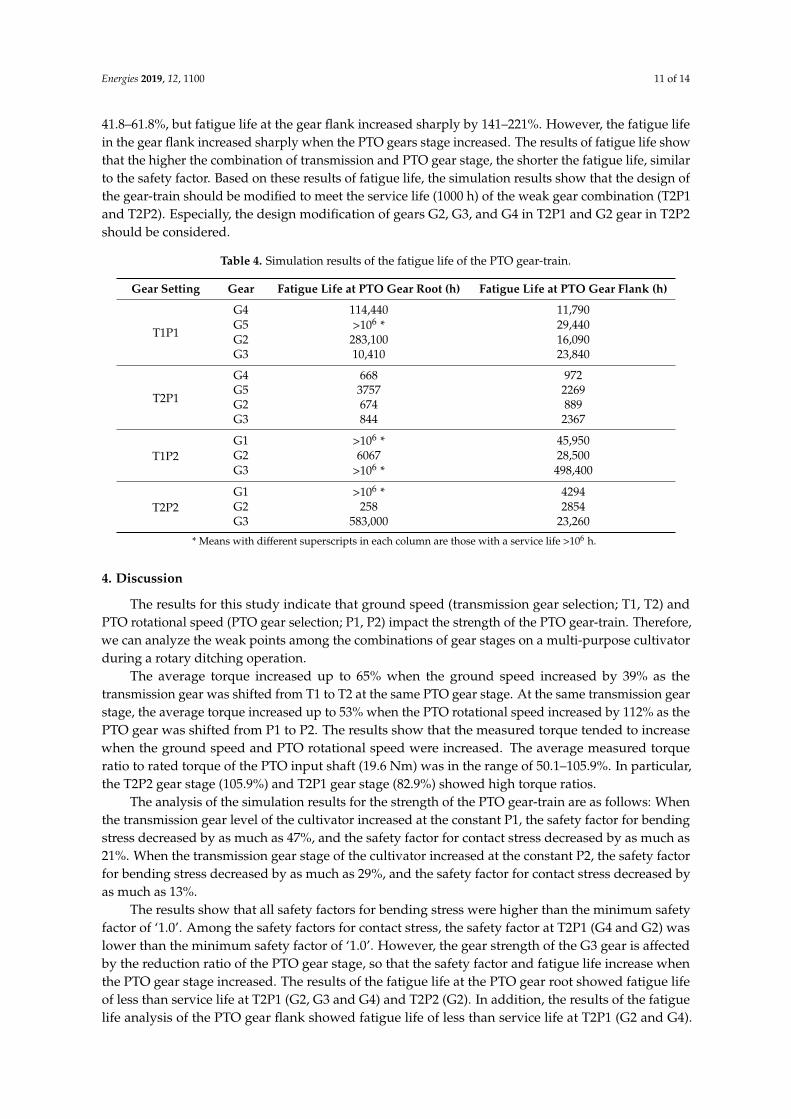
The strength of the PTO gears was evaluated in terms of contact stress and bending stress bycalculating the safety factors during a rotary ditching operation. The safety factors for bending stressand contact stress are presented in Figures 6 and 7. These results show that all safety factors forbending stress were higher than the minimum safety factor of 1.0, with the lowest safety factor (1.059)in the gear G2 for the T2P2 gear stage and the highest safety factor (3.584) in the G1 gear for the T1P2gear stage. However, the safety factor for contact stresses of the G4 (0.998) and G2 (0.991) gears in theT2P1 gear stage were lower than the minimum safety factor of ‘1.0’. In general, the torque tends toincrease as the combination of the transmission and the PTO gear is higher [32]. The overall simulationresults of the safety factors show that the higher the combination of transmission and PTO gear stage,the lower the safety factor tended to be. However, the results of the safety factor of the G2 and G3gears have no general tendency for the safety factor to decrease with higher PTO gear stages. It isconsidered that the safety factor of the G3 gear at P2 is increased because the reduction ratio of P2(G1-G2-G3) is smaller than that of P1 (G4-G5-G2-G3). In addition, when the PTO gear shifts from P1to P2, the safety factor of the G2 gear is greatly reduced. This seems to be due to the fact that the G2gear is the only gear in the P2 gear stage that transmits power at the positions where the gears are incontact with both sides. The safety factor of contact stress had a lower tendency than the safety factorof the bending stress. Based on these results of the safety factors, the T2P1 gear stage (G4 and G2) isconsidered to be a weak combination of the transmission and PTO gear stage. Therefore, the T2P1gear stage must be redesigned through the modification of the PTO gear train elements so that thesafety factor for bending stress is higher than the minimum safety factor. In particular, the designmodification of G2 and G4 gears in T2P1 should be considered.
When the transmission gear stage shifted from T1 to T2, the simulation results of the safety factorat the bending stress decreased by up to 32.1% at P1 (G2) and up to 22.6% at P2 (G2). The simulationresults of the safety factor at the contact stress decreased by up to 17.4% at P1 (G2) and up to 11.4%at P2 (G2) when the transmission gear stage shifted from T1 to T2. The gear used for rotary ditchingdepends on the PTO gear stage (P1: G4-G5-G2-G3, P2: G1-G2-G3). For this reason, the simulationresults of the effects of the PTO gear shift were conducted based on two gears (G2 and G3), which areused in all PTO gear stages. In the case of the G2 gear, when the PTO gear stage shifted from P1 toP2, the safety factor of bending stress decreased by up to 19.7% at T1 and up to 8.3% at T2. However,
Energies 2019, 12, 1100 10 of 14
the safety factor of the bending stress increased by up to 42.5% at T1 and up to 35.6% at T2 in thecase of the G3 gear because the reduction ratio of P2 is smaller than the reduction ratio of P1. In thecase of the G2 gear, when the PTO gear stage shifted from P1 to P2, the safety factor of contact stressincreased by up to 0.9% at T1 and up to 1.9% at T2. The simulation results of the safety factor for G3 atthe contact stress increased by up to 10.8% at T1 (G3) and up to 13.9% at T2 (G3) when the PTO gearstage shifted from P1 to P2. From these simulation results, it is known that the transmission gear shifthas a greater impact on the safety factor than does the PTO gear shift.
Energies 2019, 12, x FOR PEER REVIEW 10 of 14
results of the effects of the PTO gear shift were conducted based on two gears (G2 and G3), which are used in all PTO gear stages. In the case of the G2 gear, when the PTO gear stage shifted from P1 to P2, the safety factor of bending stress decreased by up to 19.7% at T1 and up to 8.3% at T2. However, the safety factor of the bending stress increased by up to 42.5% at T1 and up to 35.6% at T2 in the case of the G3 gear because the reduction ratio of P2 is smaller than the reduction ratio of P1. In the case of the G2 gear, when the PTO gear stage shifted from P1 to P2, the safety factor of contact stress increased by up to 0.9% at T1 and up to 1.9% at T2. The simulation results of the safety factor for G3 at the contact stress increased by up to 10.8% at T1 (G3) and up to 13.9% at T2 (G3) when the PTO gear stage shifted from P1 to P2. From these simulation results, it is known that the transmission gear shift has a greater impact on the safety factor than does the PTO gear shift.
Figure 6. Safety factor at P1 during a rotary ditching operation.
Figure 7. Safety factor at P2 during a rotary ditching operation.
3.4. Fatigue Life
Table 4 shows the fatigue life of the PTO gear-train calculated by the modified Miner’s rule and the PTO rotational speed during a rotary ditching operation. In the T1P1, the minimum fatigue life is 10,410 h (G3) at the gear root and 11,790 h (G4) at the gear flank. The fatigue life of the G5 gear was more than 10 h. In addition, the fatigue life in T1P1 satisfied the service life in all gears. In the T2P1, the minimum fatigue life is 10,410 h (G3) at the gear root and 11,790 h (G4) at the gear flank. The fatigue life of the G5 gear was more than 10 h. In addition, the fatigue life in T1P1 satisfied the service life in all gears. In T2P1, the simulation results at the gear root showed that the fatigue life was shorter than the service life at the G4 gear (668 h), G2 gear (674 h), and G3 gear (884 h) but not at the G5 gear (3757 h). Of all the combinations of gear stages, it was determined that the fatigue life was lower than the service life in T2P1 at G4 gear (972 h), and G2 gear (889 h). In T1P2, fatigue life greater than service life was shown in all gears, and fatigue life was the longest of all combinations of transmission and PTO gear setting. In T2P2, the simulation results showed the lowest fatigue life at the G2 gear (258 h). As with the safety factor results, the G2 gear is located between the G1 and G3 gears and appears to be affected by the high torque at T2. In addition, the fatigue life of the results was analyzed according to the gear shift affect. In the case of the transmission gear shift (from T1 to
Figure 6. Safety factor at P1 during a rotary ditching operation.
Energies 2019, 12, x FOR PEER REVIEW 10 of 14
results of the effects of the PTO gear shift were conducted based on two gears (G2 and G3), which are used in all PTO gear stages. In the case of the G2 gear, when the PTO gear stage shifted from P1 to P2, the safety factor of bending stress decreased by up to 19.7% at T1 and up to 8.3% at T2. However, the safety factor of the bending stress increased by up to 42.5% at T1 and up to 35.6% at T2 in the case of the G3 gear because the reduction ratio of P2 is smaller than the reduction ratio of P1. In the case of the G2 gear, when the PTO gear stage shifted from P1 to P2, the safety factor of contact stress increased by up to 0.9% at T1 and up to 1.9% at T2. The simulation results of the safety factor for G3 at the contact stress increased by up to 10.8% at T1 (G3) and up to 13.9% at T2 (G3) when the PTO gear stage shifted from P1 to P2. From these simulation results, it is known that the transmission gear shift has a greater impact on the safety factor than does the PTO gear shift.
Figure 6. Safety factor at P1 during a rotary ditching operation.
Figure 7. Safety factor at P2 during a rotary ditching operation.
3.4. Fatigue Life
Table 4 shows the fatigue life of the PTO gear-train calculated by the modified Miner’s rule and the PTO rotational speed during a rotary ditching operation. In the T1P1, the minimum fatigue life is 10,410 h (G3) at the gear root and 11,790 h (G4) at the gear flank. The fatigue life of the G5 gear was more than 10 h. In addition, the fatigue life in T1P1 satisfied the service life in all gears. In the T2P1, the minimum fatigue life is 10,410 h (G3) at the gear root and 11,790 h (G4) at the gear flank. The fatigue life of the G5 gear was more than 10 h. In addition, the fatigue life in T1P1 satisfied the service life in all gears. In T2P1, the simulation results at the gear root showed that the fatigue life was shorter than the service life at the G4 gear (668 h), G2 gear (674 h), and G3 gear (884 h) but not at the G5 gear (3757 h). Of all the combinations of gear stages, it was determined that the fatigue life was lower than the service life in T2P1 at G4 gear (972 h), and G2 gear (889 h). In T1P2, fatigue life greater than service life was shown in all gears, and fatigue life was the longest of all combinations of transmission and PTO gear setting. In T2P2, the simulation results showed the lowest fatigue life at the G2 gear (258 h). As with the safety factor results, the G2 gear is located between the G1 and G3 gears and appears to be affected by the high torque at T2. In addition, the fatigue life of the results was analyzed according to the gear shift affect. In the case of the transmission gear shift (from T1 to
Figure 7. Safety factor at P2 during a rotary ditching operation.
3.4. Fatigue Life
Table 4 shows the fatigue life of the PTO gear-train calculated by the modified Miner’s rule andthe PTO rotational speed during a rotary ditching operation. In the T1P1, the minimum fatigue lifeis 10,410 h (G3) at the gear root and 11,790 h (G4) at the gear flank. The fatigue life of the G5 gearwas more than 106 h. In addition, the fatigue life in T1P1 satisfied the service life in all gears. In theT2P1, the minimum fatigue life is 10,410 h (G3) at the gear root and 11,790 h (G4) at the gear flank.The fatigue life of the G5 gear was more than 106 h. In addition, the fatigue life in T1P1 satisfied theservice life in all gears. In T2P1, the simulation results at the gear root showed that the fatigue lifewas shorter than the service life at the G4 gear (668 h), G2 gear (674 h), and G3 gear (884 h) but notat the G5 gear (3757 h). Of all the combinations of gear stages, it was determined that the fatigue lifewas lower than the service life in T2P1 at G4 gear (972 h), and G2 gear (889 h). In T1P2, fatigue lifegreater than service life was shown in all gears, and fatigue life was the longest of all combinations oftransmission and PTO gear setting. In T2P2, the simulation results showed the lowest fatigue life atthe G2 gear (258 h). As with the safety factor results, the G2 gear is located between the G1 and G3gears and appears to be affected by the high torque at T2. In addition, the fatigue life of the resultswas analyzed according to the gear shift affect. In the case of the transmission gear shift (from T1 toT2), fatigue life at the gear root decreased by 93.8–95.8% and fatigue life at the gear flank decreased by90–92.5%. In the case of the PTO gear shift (from P1 to P2), fatigue life at the gear root decreased by
Energies 2019, 12, 1100 11 of 14
41.8–61.8%, but fatigue life at the gear flank increased sharply by 141–221%. However, the fatigue lifein the gear flank increased sharply when the PTO gears stage increased. The results of fatigue life showthat the higher the combination of transmission and PTO gear stage, the shorter the fatigue life, similarto the safety factor. Based on these results of fatigue life, the simulation results show that the design ofthe gear-train should be modified to meet the service life (1000 h) of the weak gear combination (T2P1and T2P2). Especially, the design modification of gears G2, G3, and G4 in T2P1 and G2 gear in T2P2should be considered.
Table 4. Simulation results of the fatigue life of the PTO gear-train.
Gear Setting Gear Fatigue Life at PTO Gear Root (h) Fatigue Life at PTO Gear Flank (h)
T1P1
G4 114,440 11,790G5 >106 * 29,440G2 283,100 16,090G3 10,410 23,840
T2P1
G4 668 972G5 3757 2269G2 674 889G3 844 2367
T1P2G1 >106 * 45,950G2 6067 28,500G3 >106 * 498,400
T2P2G1 >106 * 4294G2 258 2854G3 583,000 23,260
* Means with different superscripts in each column are those with a service life >106 h.
4. Discussion
The results for this study indicate that ground speed (transmission gear selection; T1, T2) andPTO rotational speed (PTO gear selection; P1, P2) impact the strength of the PTO gear-train. Therefore,we can analyze the weak points among the combinations of gear stages on a multi-purpose cultivatorduring a rotary ditching operation.
The average torque increased up to 65% when the ground speed increased by 39% as thetransmission gear was shifted from T1 to T2 at the same PTO gear stage. At the same transmission gearstage, the average torque increased up to 53% when the PTO rotational speed increased by 112% as thePTO gear was shifted from P1 to P2. The results show that the measured torque tended to increasewhen the ground speed and PTO rotational speed were increased. The average measured torqueratio to rated torque of the PTO input shaft (19.6 Nm) was in the range of 50.1–105.9%. In particular,the T2P2 gear stage (105.9%) and T2P1 gear stage (82.9%) showed high torque ratios.
The analysis of the simulation results for the strength of the PTO gear-train are as follows: Whenthe transmission gear level of the cultivator increased at the constant P1, the safety factor for bendingstress decreased by as much as 47%, and the safety factor for contact stress decreased by as much as21%. When the transmission gear stage of the cultivator increased at the constant P2, the safety factorfor bending stress decreased by as much as 29%, and the safety factor for contact stress decreased byas much as 13%.
The results show that all safety factors for bending stress were higher than the minimum safetyfactor of ‘1.0’. Among the safety factors for contact stress, the safety factor at T2P1 (G4 and G2) waslower than the minimum safety factor of ‘1.0’. However, the gear strength of the G3 gear is affectedby the reduction ratio of the PTO gear stage, so that the safety factor and fatigue life increase whenthe PTO gear stage increased. The results of the fatigue life at the PTO gear root showed fatigue lifeof less than service life at T2P1 (G2, G3 and G4) and T2P2 (G2). In addition, the results of the fatiguelife analysis of the PTO gear flank showed fatigue life of less than service life at T2P1 (G2 and G4).
Energies 2019, 12, 1100 12 of 14
Therefore, the weak gear combination T2P1 (gear root; G2, G3, and G4, gear flank; G2) and T2P2(gear root; G2) should be considered as the weak parts that require redesigning in the PTO gear-trainelements to meet and exceed the minimum safety factor and service life.
5. Conclusions
In this study, the strength analysis of a PTO gear-train of a multi-purpose cultivator was performedusing actual measured loads during rotary ditching operation. The safety factor and fatigue life of aPTO gear-train were analyzed with respect to four gear combinations of transmission and PTO gearstages. The main conclusions are summarized as follows.
According to the simulation results about the strength of the gear-train of a multi-purposecultivator, the safety factor and fatigue life of the PTO gear-train tend to decrease when the combinationof gear stages are higher, except for the G2 and G3 gears. The strength of the PTO gear-train greatlydepends on the combination of gear stages (transmission and PTO gear stages). Thus, to achieve theoptimal design of a cultivator, the main gear selection of the cultivator must be considered dependingon the various operations the cultivator will perform.
The results of this study provide a guide for predicting the life of the PTO gear-train and selectingthe weak combination of gear stages using the measured fluctuating load during actual rotary ditchingoperation. Based on the results obtained according to this research method, it is expected that thelife of the gear can be increased according to the designed purpose by modifying the gear material,the gear ratio, the center distance of gear, and the gear-train elements such as the number of teeth,face width, and gear-train modules [33].
Generally, farmers tend to conduct rotary ditching operations using a multi-purpose cultivator athigher gear combinations of transmission and PTO gear stages to reduce the total working duration.However, higher gear combinations cause greater load on the PTO input shaft, which affects thestrength of the PTO gear-train. Therefore, farmers using multi-purpose cultivators need to select anappropriate gear combination considering soil conditions and the load severity of the PTO gear-train.
In this study, all combinations of gear stages were limited to a service life of a minimum of1000 h. Therefore, it is necessary to calculate the service life by applying the actual usage ratio obtainedthrough user surveys. It is possible to analyze the gear strength in various regions using the guidelinespresented in this study.
Author Contributions: Conceptualization, Y.-J.K. and K.-H.L.; methodology, O.-W.K. and C.-W.K.; software,Y.-S.K. and W.-S.K.; formal analysis, Y.-S.K. and P.-U.L.; investigation, P.-U.L.; writing—original draft preparation,P.-U.L.; writing—review and editing, Y.-S.K.; supervision, Y.-J.K.; project administration, Y.-J.K.
Funding: This research received no external funding.
Acknowledgments: This research was supported by the Agriculture, Food and Rural Affairs Research CenterSupport Program, Ministry of Agriculture, Food and Rural Affairs.
Conflicts of Interest: The authors declare no conflict of interest.
References
1. Statistics Korea (KOSTAT). Available online: http://kostat.go.kr/wnsearch/search.jsp (accessed on17 November 2018).
2. Kim, W.S.; Kim, Y.S.; Kim, Y.J.; Choi, C.H.; Inoue, E.; Okayasu, T. Analysis of the Load of a Transplanter PTOShaft Based on the Planting Distance. J. Fac. Agric. Kyushu Univ. 2018, 63, 97–102.
3. Park, S.B.; Park, Y.J.; Kim, K.U. Optimization of handle vibration of walking type cultivator. J. Biosyst. Eng.2006, 31, 39–145. [CrossRef]
4. Sam, B.; Kathirvel, K. Vibration characteristics of walking and riding type power tillers. Biosyst. Eng. 2006,95, 517–528. [CrossRef]
5. Chaturvedi, V.; Kumar, A.; Singh, J.K. Power tiller: Vibration magnitudes and intervention development forvibration reduction. Appl. Ergon. 2012, 43, 891–901. [CrossRef] [PubMed]
Energies 2019, 12, 1100 13 of 14
6. Kim, W.S.; Chung, S.O.; Choi, C.H.; Cho, J.S.; Choi, D.S.; Kim, Y.J.; Lee, S.D.; Hong, S.J.; Kim, Y.J.; Koo, S.M.Analysis of the PTO Torque of a Transplanter by Planting Condition. J. Biosyst. Eng. 2016, 41, 313–318.[CrossRef]
7. Lee, D.H.; Kim, Y.J.; Chung, S.O.; Choi, C.H.; Lee, K.H.; Shin, B.S. Analysis of the PTO load of a 75 kWagricultural tractor during rotary tillage and baler operation in Korean upland fields. J. Terramech. 2015, 60,75–83. [CrossRef]
8. Jung, J.W.; Kim, K.P.; Ji, H.C.; Moon, T.S. Design Improvement of the Driving Bevel Gearin Transmissions ofa Tracked Vehicle. J. Korean Soc. Manuf. Process Eng. 2015, 14, 1–6. [CrossRef]
9. Shim, S.B.; Park, Y.J.; Kim, K.U. Reduction of PTO rattle noise of an agricultural tractor using an anti-backlashgear. J. Biosyst. Eng. 2008, 100, 346–354. [CrossRef]
10. Zhang, J.K.; Cheng, X.Q.; Li, Z.N. Total fatigue life prediction for Ti-alloys airframe structure based ondurability and damage-tolerant design concept. Mater. Des. 2010, 31, 4329–4335. [CrossRef]
11. Han, H.S.; Lee, J.K. Development of a Web-based Powertrain Performance Simulation System. J. Korean Soc.Precis. Eng. 2004, 21, 100–107.
12. Timothy, J.L.; Brian, A.S.; Robert, C.F. External spur gear root bending stress: A comparison of ISO 6336:2006,AGMA 2101-D04, ANSYS finite element analysis and strain gauge techniques. Mech. Mach. Theory 2017, 111,1–9. [CrossRef]
13. Wu, Y.R.; Van, T.T. Transmission and load analysis for a crowned helical gear pair with twist-free tooth flanksgenerated by an external gear honing machine. Mech. Mach. Theory 2016, 98, 36–47. [CrossRef]
14. Yoo, K.H.; Claude, E.B. Hydrology and Water Supply for Pond Aquaculture, 1st ed.; Springer Science & BusinessMedia: New York, NY, USA, 2012; pp. 346–347.
15. Yu, Y.; Zhang, S.; Li, H.; Wang, X.; Tang, Y. Modal and Harmonic Response Analysis of Key Components ofDitch device Based on ANSYS. Procedia Eng. 2017, 174, 956–964. [CrossRef]
16. Standard ISO. 6336-1, Calculation of Load Capacity of Spur and Helical Gears; International StandardOrganization: Geneva, Switzerland, 2006.
17. Standard ISO. 6336-2, Calculation of Load Capacity of Spur and Helical Gears; International StandardOrganization: Geneva, Switzerland, 2006.
18. Standard ISO. 6336-3, Calculation of Load Capacity of Spur and Helical Gears; International StandardOrganization: Geneva, Switzerland, 2006.
19. Standard ISO. 6336-4, Calculation of Load Capacity of Spur and Helical Gears; International StandardOrganization: Geneva, Switzerland, 2006.
20. Standard ISO. 6336-5, Calculation of Load Capacity of Spur and Helical Gears; International StandardOrganization: Geneva, Switzerland, 2006.
21. Kim, J.H.; Kim, K.U.; Yong, G.W. Analysis of transmission load of agricultural tractors. J. Terramech. 2000, 37,113–125. [CrossRef]
22. Anthes, R.J. Modified rainflow counting keeping the load sequence. Int. J. Fatigue 1997, 19, 529–535.[CrossRef]
23. Dowling, N.E. Fatigue failure predictions for complicated stress—Strain histories. J. Mater. 1971, 7, 71–87.[CrossRef]
24. Marsh, G.; Wignall, C.; Thies, P.R.; Barltrop, N.; Incecik, A.; Venugopal, V.; Johanning, L. Review andapplication of Rainflow residue processing techniques for accurate fatigue damage estimation. Int. J. Fatigue2016, 82, 757–765. [CrossRef]
25. Smith, R.N.; Wastson, P.; Topper, T.H. A stress-strain parameter for the fatigue of metals. J. Mater. 1970, 5,767–778.
26. Park, D.B.; Sung, S.M.; Hwang, P.; Hong, D.K.; Kim, J.M. Design and analysis for a direct-axis drive ofelectric car. J. Korean Soc. Precis. Eng. 2014, 31, 544–545.
27. McVittie, D. ISO 6336-5: Strength and quality of materials. Gear Technol. 1999, 16, 20–23.28. Miner, M.A. Cumulative damage in fatigue. J. Appl. Mech. 1945, 12, 159–164.29. Kim, D.C.; Ryu, I.H.; Kim, K.U. Analysis of tractor transmission and driving axle loads. Trans. ASAE 2001,
44, 751–757. [CrossRef]30. Stroup, W.W. Rethinking the analysis of non-normal data in plant and soil science. Agron. J. 2015, 107,
811–827. [CrossRef]

Energies 2019, 12, 1100 14 of 14
31. Glancey, J.L.; Upadhyaya, S.K. An improved technique for agriculture implement draught analysis.Soil Tillage Res. 1995, 35, 175–182. [CrossRef]
32. Kim, Y.J.; Chung, S.O.; Choi, C.H. Effects of gear selection of an agricultural tractor on transmission andPTO load during rotary tillage. Soil Tillage Res. 2013, 134, 90–96. [CrossRef]
33. Nenad, M.; Biserka, I.; Vesna, M.; Zoran, M.; Mirko, B.; Milorad, B. A practical approach to the optimizationof gear trains with spur gears. Mech. Mach. Theory 2012, 53, 1–16. [CrossRef]
© 2019 by the authors. Licensee MDPI, Basel, Switzerland. This article is an open accessarticle distributed under the terms and conditions of the Creative Commons Attribution(CC BY) license (http://creativecommons.org/licenses/by/4.0/).